cumulative exposure to metabolic syndrome components and
TRANSCRIPT

424 www.e-enm.org
Endocrinol Metab 2021;36:424-435https://doi.org/10.3803/EnM.2020.935pISSN 2093-596X · eISSN 2093-5978
OriginalArticle
Cumulative Exposure to Metabolic Syndrome Components and the Risk of Dementia: A Nationwide Population-Based StudyYunjung Cho1,*, Kyungdo Han2,*, Da Hye Kim3, Yong-Moon Park4, Kun-Ho Yoon1,5, Mee Kyoung Kim6, Seung-Hwan Lee1,5
1Division of Endocrinology and Metabolism, Department of Internal Medicine, Seoul St. Mary’s Hospital, College of Medicine, The Catholic University of Korea; 2Department of Statistics and Actuarial Science, Soongsil University; 3Department of Biostatistics, College of Medicine, The Catholic University of Korea, Seoul, Korea; 4Department of Epidemiology, Fay W. Boozman College of Public Health, University of Arkansas for Medical Sciences, Little Rock, AR, USA; 5Department of Medical Informatics, College of Medicine, The Catholic University of Korea; 6Division of Endocrinology and Metabolism, Department of Internal Medicine, Yeouido St. Mary’s Hospital, College of Medicine, The Catholic University of Korea, Seoul, Korea
Background: Metabolic disturbances are modifiable risk factors for dementia. Because the status of metabolic syndrome (MetS) and its components changes over time, we aimed to investigate the association of the cumulative exposure to MetS and its compo-nents with the risk of dementia.Methods: Adults (n=1,492,776; ≥45-years-old) who received health examinations for 4 consecutive years were identified from a nationwide population-based cohort in Korea. Two exposure-weighted scores were calculated: cumulative number of MetS diagno-ses (MetS exposure score, range of 0 to 4) and the composite of its five components (MetS component exposure score, range of 0 to 20). Hazard ratio (HR) and 95% confidence interval (CI) values for dementia were analyzed using the multivariable Cox proportion-al-hazards model.Results: Overall, 47.1% of subjects were diagnosed with MetS at least once, and 11.5% had persistent MetS. During the mean 5.2 years of follow-up, there were 7,341 cases (0.5%) of incident dementia. There was a stepwise increase in the risk of all-cause demen-tia, Alzheimer’s disease, and vascular dementia with increasing MetS exposure score and MetS component exposure score (each P for trend <0.0001). The HR of all-cause dementia was 2.62 (95% CI, 1.87 to 3.68) in subjects with a MetS component exposure score of 20 compared with those with a score of 0. People fulfilling only one MetS component out of 20 already had an approximately 40% increased risk of all-cause dementia and Alzheimer’s disease.Conclusion: More cumulative exposure to metabolic disturbances was associated with a higher risk of dementia. Of note, even min-imal exposure to MetS components had a significant effect on the risk of dementia.
Keywords: Alzheimer disease; Dementia; Metabolic syndrome
Received: 3 December 2020, Revised: 18 February 2021, Accepted: 22 February 2021
Corresponding author: Seung-Hwan LeeDivision of Endocrinology and Metabolism, Department of Internal Medicine, Seoul St. Mary’s Hospital, College of Medicine, The Catholic University of Korea, 222 Banpo-daero, Seocho-gu, Seoul 06591, Korea Tel: +82-2-2258-6069, Fax: +82-2-595-2534, E-mail: [email protected]
*These authors contributed equally to this work.
Copyright © 2021 Korean Endocrine SocietyThis is an Open Access article distributed under the terms of the Creative Com-mons Attribution Non-Commercial License (https://creativecommons.org/licenses/by-nc/4.0/) which permits unrestricted non-commercial use, distribu-tion, and reproduction in any medium, provided the original work is properly cited.

Exposure to Metabolic Syndrome and Risk of Dementia
Copyright © 2021 Korean Endocrine Society www.e-enm.org 425
Endocrinol Metab 2021;36:424-435https://doi.org/10.3803/EnM.2020.935pISSN 2093-596X · eISSN 2093-5978
INTRODUCTION
Dementia is a disease that causes serious and long-term gradual decreases in brain function. In 2015, dementia affected 46.8 mil-lion people worldwide, which was associated with poor quality of life and mortality as well as increased socioeconomic costs [1]. The prevalence of dementia is expected to nearly double ev-ery 20 years, especially in East Asia, where dementia among people aged 60 or older is expected to show a proportional in-crease of 193% from 2015 to 2050 [1]. South Korea has the fast-est aging rate among developing countries, and the incidence and prevalence of dementia almost double with every added 5 years of age until age 85 to 89 years [2,3]. This age-dependent increase in prevalence is seen in both Alzheimer’ disease and vascular de-mentia. In addition, disability-adjusted life years due to dementia in 2050 in Korea are expected to be 3.0 times higher than in 2010 [3].
Previous studies have shown that cognitive performance de-clines in people with metabolic syndrome (MetS), particularly with high blood glucose levels, which is associated with in-creased inflammation [4,5]. Both diabetes and impaired glucose tolerance status are independent risk factors for Alzheimer’s disease and vascular dementia [6,7]. Large epidemiological studies have demonstrated a consistent association between midlife hypertension and late-life cognitive decline or dementia and have shown that active blood pressure (BP) control reduces the risk of dementia [8-10]. Associations between total choles-terol levels and the risk of dementia are controversial, and one study even showed that high total cholesterol level late in life is associated with a reduced risk of dementia [11-14]. While some studies have shown that dyslipidemia increases the risk of de-mentia, other studies suggest a weak or no association between low-density lipoprotein cholesterol (LDL-C) or high-density li-poprotein cholesterol (HDL-C) levels and the risk of Alzheim-er’s disease or vascular dementia [15,16]. Obesity, represented by high body mass index (BMI), is known to be a risk factor for dementia, including Alzheimer’s disease, in mid-life but is still controversial in late life [17-21].
The status of MetS and its components changes over time, and modification of these risk factors may affect various health outcomes, including dementia [22-25]. Because most of the pre-vious studies did not consider cumulative effects of metabolic risk factors on the risk of dementia, the relationship between the extent and duration of exposure to risks and incident dementia is still unknown. In this study, we used a large-scale, nation-wide, population-based database with consecutive health exam-
inations to investigate the associations of cumulative exposure to MetS and its components with the risk of dementia.
METHODS
Data source and study populationThe Korean National Health Insurance Service (NHIS) is a sin-gle, government-managed insurer, to which all residents in Ko-rea subscribe. Because it has adopted a fee-for-service system to pay healthcare providers, the NHIS obtains a complete set of in-formation that represents the entire Korean population [26,27]. The database provides comprehensive information, including an eligibility database (e.g., age, sex, socioeconomic variables, re-gion, and type of eligibility), a medical treatment database (based on the accounts submitted by medical service providers for medical expenses), a health examination database, and a medical care institution database (types of medical care institu-tions, location, equipment, and number of physicians). NHIS beneficiaries are encouraged to undergo standardized health ex-aminations at least every 2 years.
In total, 1,548,192 people (aged ≥45 years) received four con-secutive annual health examinations either from 2009 to 2012 or from 2010 to 2013. Those with missing variables (n=54,287) or with a previous diagnosis of dementia (n=1,129) were excluded; therefore, 1,492,776 people were included in this analysis. This study was approved by the Institutional Review Board of Yeoui-do St. Mary’s Hospital, The Catholic University of Korea (No. SC19ZASE0142). Informed consent was waived because only anonymous and deidentified information was used.
Measurements and definitionsBMI was calculated as weight in kilograms divided by the square of the height in meters. Information on smoking and alcohol con-sumption history (heavy alcohol consumption, ≥30 g/day) was obtained from the questionnaire. Regular exercise was defined as performing more than 20 minutes of strenuous physical activ-ity ≥3/week or more than 30 minutes of moderate physical ac-tivity ≥5/week. Household income level was dichotomized at the lower 25%. Blood samples were drawn after overnight fast-ing for the measurement of serum glucose, total cholesterol, tri-glyceride, HDL-C, and LDL-C levels. Estimated glomerular fil-tration rate was calculated using the modification of diet in renal disease formula: 186×(serum creatinine)–1.154×age–0.203×0.742 (if female). Hospitals performing health check-ups were certified by the NHIS and received regular quality control. Diabetes mel-litus was diagnosed as at least one claim per year with the Inter-

Cho Y, et al.
426 www.e-enm.org Copyright © 2021 Korean Endocrine Society
national Classification of Disease, 10th Revision (ICD-10) codes E10-14 and a prescription of anti-diabetic medication or fasting glucose level ≥126 mg/dL. Hypertension was diagnosed as at least one claim per year with ICD-10 codes I10 or I11 and the prescription of anti-hypertensive agents or systolic/diastolic BP ≥140/90 mm Hg. Dyslipidemia was diagnosed as at least one claim per year with ICD-10 code E78 and the prescription of a lipid-lowering agent or a total cholesterol level ≥240 mg/dL. History of ischemic heart disease (I20-I25), stroke (I63-I64), de-pression (F32-F33), and Parkinson’s disease (G00-G22) was de-fined using ICD-10 codes.
Scoring of cumulative exposure to MetSMetS was defined according to the revised criteria of the Na-tional Cholesterol Education Program–Adult Treatment Panel III. MetS was diagnosed if at least three of the following condi-tions were met: (1) waist circumference (WC) ≥90 cm for men or ≥85 cm for women (using modified WC criteria for abdom-inal obesity of the Korean Society for the Study of Obesity) [28]; (2) serum triglyceride level ≥150 mg/dL or use of lipid-lowering medication; (3) HDL-C level <40 mg/dL for men or <50 mg/dL for women, or use of lipid-lowering medication; (4) systolic BP ≥130 mm Hg, diastolic BP ≥85 mm Hg, or use of an anti-hypertensive drug; and (5) fasting blood glucose lev-el ≥100 mg/dL or use of anti-diabetic medication.
Two exposure-weighted scores were calculated for the esti-mation of cumulative effects of exposure to MetS and its com-ponents. First, the frequency of MetS diagnoses over 4 years was counted (MetS exposure score, range 0 to 4). Subjects who were free from MetS during the four health examinations would have a MetS exposure score of 0, while those who were diag-nosed with MetS at every health examination would have a score of 4. The same scoring system was also used to calculate the frequency of each MetS component diagnosed. Second, we added all of the individual MetS components diagnosed during the 4 years (MetS component exposure score, range 0 to 20).
Study outcomes and follow-upThe outcome of this study was newly diagnosed all-cause de-mentia, Alzheimer’s disease, and vascular dementia. The defini-tion of these diseases was based on the recording of diagnosis statements by ICD-10 codes (F00 or G30 for Alzheimer’s dis-ease; F01 for vascular dementia; and F02, F03, or G31 for de-mentia of other causes) and the prescription of medications for dementia (rivastigmine, galantamine, memantine, or donepezil) [29]. In Korea, evidence of cognitive dysfunction (Mini-Mental
State Examination [MMSE] ≤26 and either Clinical Dementia Rating ≥1 or Global Deterioration Scale ≥3) must be docu-mented for filing expense claims for drug prescriptions. When more than 2 codes for dementia were recorded, we followed the principal diagnosis. The study population was followed to the date of incident dementia or until 31st December 2017, which-ever came first. The mean follow-up period was 5.2±0.6 years.
Statistical analysisBaseline characteristics are presented as the mean±standard de-viation, median (interquartile range), or number (%). Participants were classified into five and 21 groups according to their MetS and MetS component exposure scores, respectively. The inci-dence rate of primary outcomes was calculated by dividing the number of events by the total follow-up period (person-years). The Cox proportional-hazards model was used to estimate hazard ratio (HR) and 95% confidence interval (CI) values for dementia according to the exposure-weighted scores for MetS. The propor-tional-hazards assumption was assessed using the Schoenfeld re-siduals test, with a logarithm of the cumulative hazard functions based on Kaplan-Meier estimates for the cumulative number of MetS and its components. Over time, there was no significant de-parture from proportionality in the hazards. Possible confounding factors were adjusted using multivariable-adjusted proportional-hazards models [30]. Model 1 was adjusted for age, sex, alcohol drinking, smoking, regular exercise, income status, systolic BP, WC, and fasting glucose, triglyceride, and HDL-C levels. Model 2 was further adjusted for previous history of ischemic heart dis-ease, stroke, depression, and Parkinson’s disease. To minimize the possible effect of reverse causality, sensitivity analysis was performed by excluding people with events occurring within the first 2 years of follow-up. Because people undergoing treatment for diabetes mellitus, hypertension, or dyslipidemia may have different risks for dementia, we also performed a sensitivity anal-ysis by excluding these subjects. A subgroup analysis was per-formed to compare subjects with improved (decreased MetS component number) and nonimproved (increased or same MetS component number) MetS status from the first year to the last year health examination. All statistical analyses were performed using SAS software version 9.4 (SAS Institute, Cary, NC, USA). A P value <0.05 was considered statistically significant.
RESULTS
Study subject characteristicsThe mean age and BMI of the study subjects were 53.1±6.6

Exposure to Metabolic Syndrome and Risk of Dementia
Copyright © 2021 Korean Endocrine Society www.e-enm.org 427
years and 24.0±2.9 kg/m2, respectively. Overall, 11.1% of the study population had diabetes, 31.0% had hypertension, and 23.6% had dyslipidemia. Baseline characteristics according to the MetS exposure score during the 4 years of the study are pre-sented in Table 1. In total, 789,674 (52.9%) subjects had never been diagnosed with MetS, whereas 171,176 (11.5%) had per-sistent MetS. Therefore, 531,926 (35.6%) subjects had changes in their MetS status during the 4 years. Subjects with higher MetS exposure score were older, more likely to be male, more obese, and had a higher prevalence of diabetes, hypertension, dyslipidemia, ischemic heart disease, stroke, and depression compared with people with lower scores. Current smoking, heavy alcohol drinking, and lower household income was also associated with a higher frequency of MetS diagnosis. During the follow-up, there were 7,341 cases (0.5%) of incident demen-
tia. The incidence rate of all-cause dementia was approximately ten times higher in subjects older than 65 years (8.43 per 1,000 person-years in the group with a MetS exposure score of 4) compared with those younger than 65 years (0.81 per 1,000 per-son-years in the group with a MetS exposure score of 4). Sub-jects who developed dementia had lower BMI but higher WC, and had a higher prevalence of diabetes, hypertension, dyslipid-emia, ischemic heart disease, stroke, depression, and Parkin-son’s disease, and were more likely to have lower income (Sup-plemental Table S1).
MetS exposure score and the risk of dementiaA higher incidence rate and HR (95% CI) of all-cause dementia, Alzheimer’s disease, and vascular dementia was observed in people with a higher MetS exposure score in a dose-dependent
Table 1. Baseline Characteristics of Study Subjects According to the Metabolic Syndrome Exposure Score during the 4 Years
Characteristic Total (n=1,492,776)
0 (n=789,674)
1 (n=245,219)
2 (n=157,966)
3 (n=128,741)
4 (n=171,176) P for trend
Age, yr 53.1±6.6 52.2±6.3 53.4±6.7 54.1±6.9 54.4±7.0 54.9±6.9 <0.001
Male sex 1,042,857 (69.9) 516,771 (65.4) 179,498 (73.2) 118,397 (75.0) 98,850 (76.8) 129,341 (75.6) <0.001
Body mass index, kg/m2 24.0±2.9 22.8±2.4 24.4±2.5 25.1±2.6 25.7±2.7 26.3±3.0 <0.001
Waist circumference, cm 81.6±8.2 78.1±7.1 82.9±6.9 85.1±7.1 86.8±7.2 88.4±7.9 <0.001
Systolic BP, mm Hg 123.6±13.9 119.8±13.1 125.6±13.1 127.8±13.3 129.2±13.4 130.0±13.9 <0.001
Diastolic BP, mm Hg 77.7±9.6 75.4±9.1 78.9±9.1 80.2±9.2 81.0±9.4 81.3±9.7 <0.001
Fasting glucose, mg/dL 100.2±23.5 93.8±15.3 100.6±21.0 105.0±24.8 109.9±29.2 117.9±36.2 <0.001
Total cholesterol, mg/dL 198.0±35.5 196.0±33.0 200.8±36.0 201.7±37.5 200.9±38.8 197.8±40.5 <0.001
Triglyceride, mg/dL 115 (80–170) 93 (68–127) 132 (94–183) 152 (107–210) 167 (117–232) 177 (122–252) <0.001
HDL-C, mg/dL 54.4±14.7 58.3±14.4 52.2±13.8 50.0±13.9 48.4±13.5 47.9±13.5 <0.001
LDL-C, mg/dL 116.6±32.9 116.6±30.4 119.3±33.5 118.4±35.2 116.3±36.3 111.5±37.7 <0.001
eGFR, mL/min/1.73 m2 89.1±36.4 90.0±36.2 89.0±36.6 88.1±36.7 87.5±35.5 87.0±37.3 <0.001
Current smoker 384,174 (25.7) 184,121 (23.3) 67,748 (27.6) 44,936 (28.5) 37,402 (29.1) 49,967 (29.2) <0.001
Heavy alcohol drinker 110,369 (7.4) 45,167 (5.7) 20,253 (8.3) 14,368 (9.1) 12,836 (10.0) 17,745 (10.4) <0.001
Regular exercise 381,359 (25.6) 202,274 (25.6) 62,905 (25.7) 39,888 (25.3) 32,860 (25.5) 43,432 (25.4) 0.010
Household income (lower 25%) 422,184 (28.3) 210,983 (26.7) 69,330 (28.3) 46,818 (29.6) 37,913 (29.5) 57,140 (33.4) <0.001
Diabetes mellitus 166,348 (11.1) 26,819 (3.4) 22,467 (9.2) 23,208 (14.7) 29,115 (22.6) 64,739 (37.8) <0.001
Hypertension 462,686 (31.0) 127,939 (16.2) 79,468 (32.4) 68,647 (43.5) 68,904 (53.5) 117,728 (68.8) <0.001
Dyslipidemia 352,723 (23.6) 108,962 (13.8) 58,882 (24.0) 48,674 (30.8) 48,449 (37.6) 87,756 (51.3) <0.001
Ischemic heart disease 65,315 (4.4) 19,278 (2.4) 10,168 (4.2) 8,948 (5.7) 9,265 (7.2) 17,656 (10.3) <0.001
Stroke 13,735 (0.9) 3,877 (0.5) 2,248 (0.9) 1,956 (1.2) 1,991 (1.6) 3,663 (2.1) <0.001
Depression 50,439 (3.4) 24,370 (3.1) 8,497 (3.5) 5,773 (3.7) 4,827 (3.8) 6,972 (4.1) <0.001
Parkinson’s disease 601 (0.04) 338 (0.04) 93 (0.04) 59 (0.04) 54 (0.04) 57 (0.03) 0.395
Values are expressed as mean±standard deviation, number (%), or median (interquartile range).BP, blood pressure; HDL-C, high-density lipoprotein cholesterol; LDL-C, low-density lipoprotein cholesterol; eGFR, estimated glomerular filtration rate.
Cho Y, et al.
428 www.e-enm.org Copyright © 2021 Korean Endocrine Society
manner. The incidence rate of all-cause dementia was 0.69 (per 1,000 person-years) in the group with a MetS exposure score of 0, which increased to 1.54 in the group with a MetS exposure score of 4. After adjusting for age, sex, alcohol drinking, smok-ing, regular exercise, income status, systolic BP, WC, fasting glucose, triglyceride, and HDL-C levels, the HRs of all-cause dementia, Alzheimer’s disease, and vascular dementia in the group with a MetS exposure score of 4 were 1.35 (95% CI, 1.25 to 1.47), 1.30 (95% CI, 1.18 to 1.43), and 1.50 (95% CI, 1.24 to 1.80), respectively. Of note, people having been diagnosed with MetS once in 4 years also had significantly increased risk of all-cause dementia (by 15%) and Alzheimer’s disease (by 13%). Analysis of the cumulative effects of individual MetS compo-nents also showed a higher risk of all-cause dementia and Al-zheimer’s disease in subjects with more exposure to each MetS component (Table 2). This trend was maintained after further adjusting for ischemic heart disease, stroke, depression, and Parkinson’s disease, which are known to increase the risk of de-mentia. The HRs of all-cause dementia, Alzheimer’s disease, and vascular dementia in the group with a MetS exposure score of 4 were 1.23 (95% CI, 1.14 to 1.34), 1.19 (95% CI, 1.08 to 1.31), and 1.36 (95% CI, 1.13 to 1.64), respectively (Supple-mental Table S2).
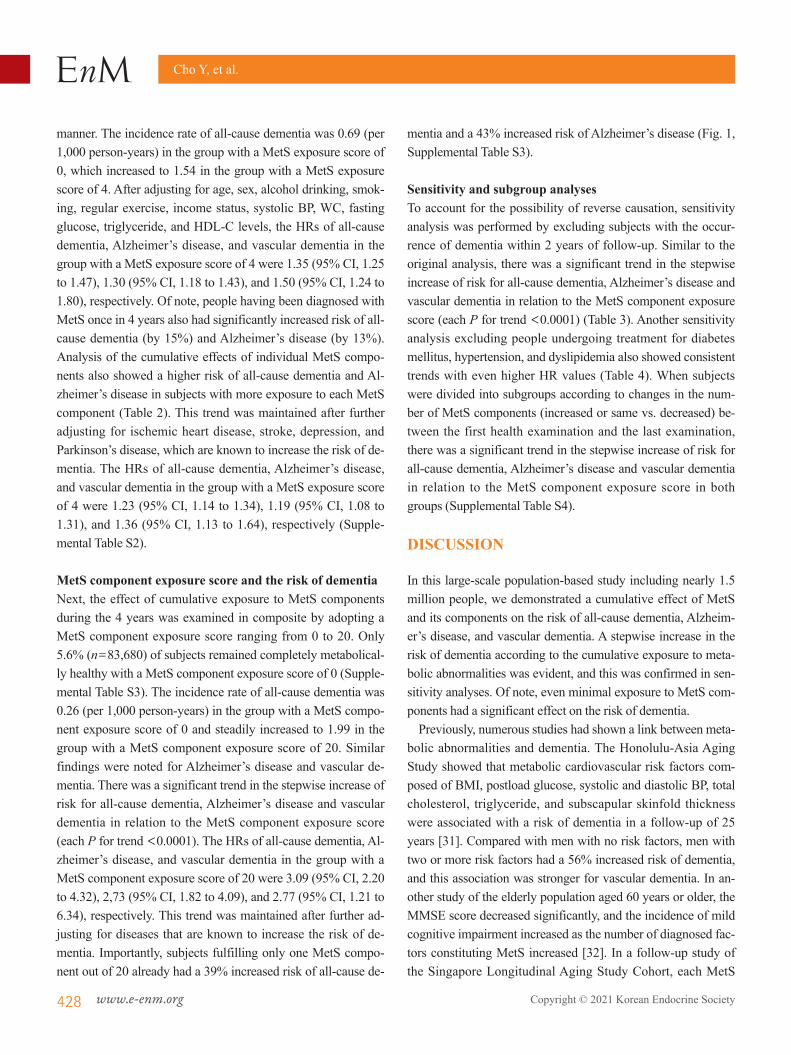
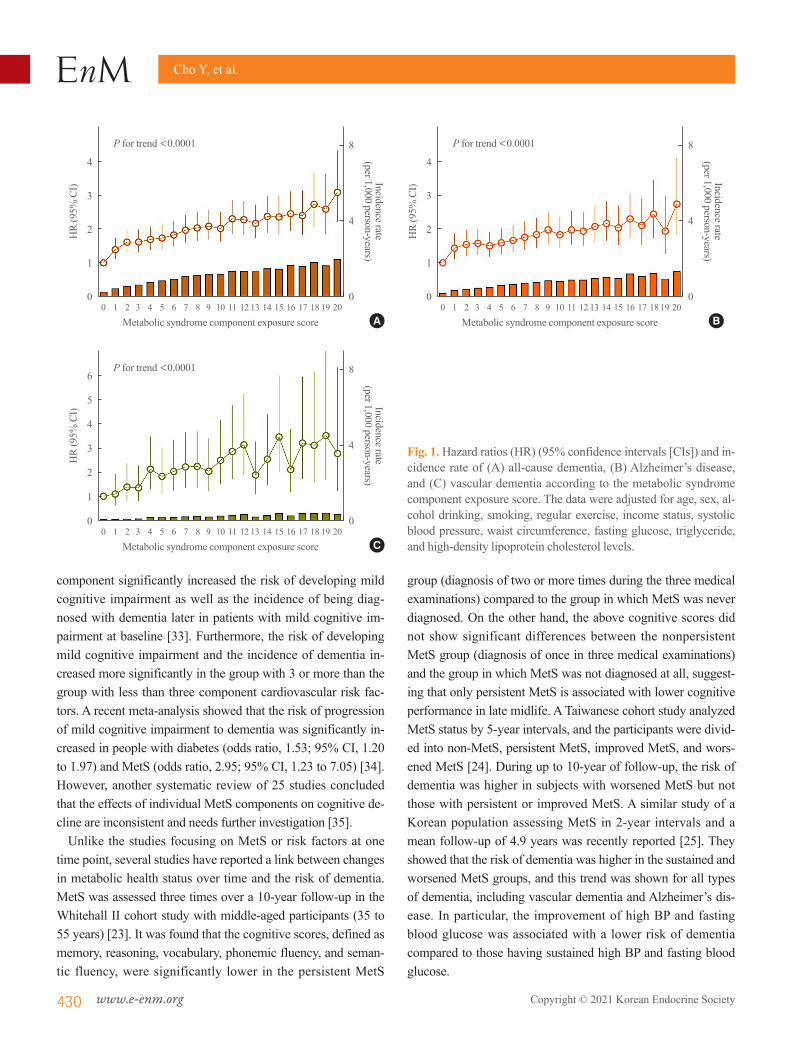
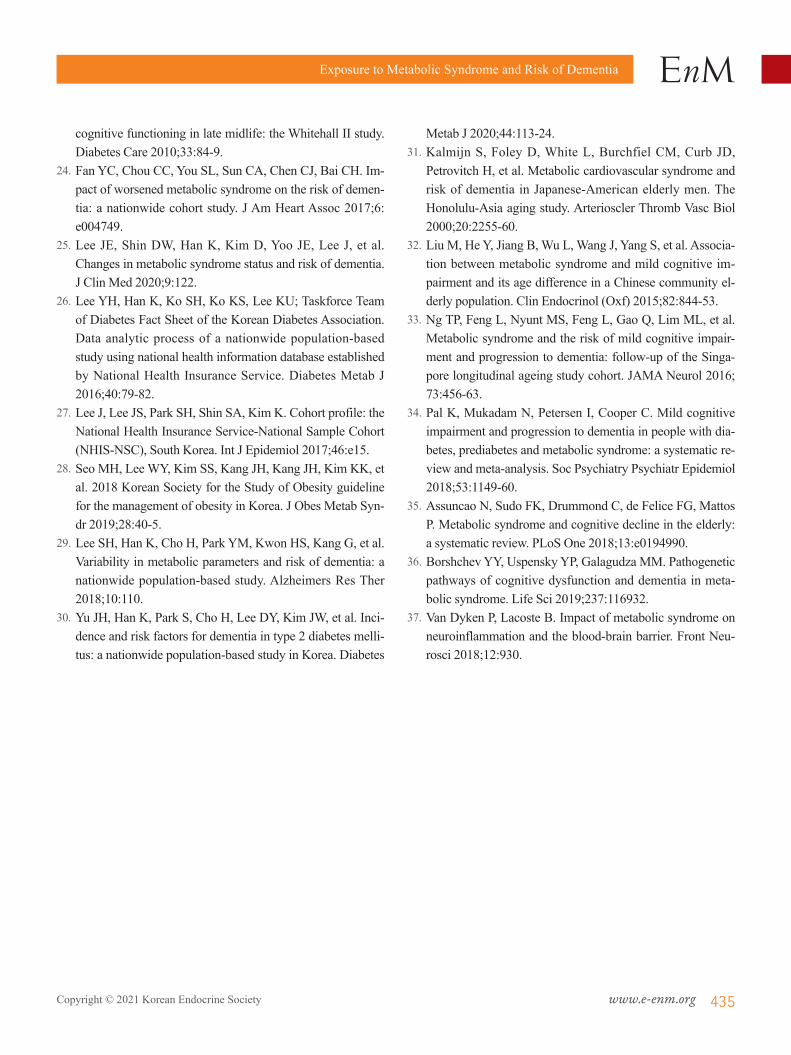
MetS component exposure score and the risk of dementiaNext, the effect of cumulative exposure to MetS components during the 4 years was examined in composite by adopting a MetS component exposure score ranging from 0 to 20. Only 5.6% (n=83,680) of subjects remained completely metabolical-ly healthy with a MetS component exposure score of 0 (Supple-mental Table S3). The incidence rate of all-cause dementia was 0.26 (per 1,000 person-years) in the group with a MetS compo-nent exposure score of 0 and steadily increased to 1.99 in the group with a MetS component exposure score of 20. Similar findings were noted for Alzheimer’s disease and vascular de-mentia. There was a significant trend in the stepwise increase of risk for all-cause dementia, Alzheimer’s disease and vascular dementia in relation to the MetS component exposure score (each P for trend <0.0001). The HRs of all-cause dementia, Al-zheimer’s disease, and vascular dementia in the group with a MetS component exposure score of 20 were 3.09 (95% CI, 2.20 to 4.32), 2,73 (95% CI, 1.82 to 4.09), and 2.77 (95% CI, 1.21 to 6.34), respectively. This trend was maintained after further ad-justing for diseases that are known to increase the risk of de-mentia. Importantly, subjects fulfilling only one MetS compo-nent out of 20 already had a 39% increased risk of all-cause de-
mentia and a 43% increased risk of Alzheimer’s disease (Fig. 1, Supplemental Table S3).
Sensitivity and subgroup analysesTo account for the possibility of reverse causation, sensitivity analysis was performed by excluding subjects with the occur-rence of dementia within 2 years of follow-up. Similar to the original analysis, there was a significant trend in the stepwise increase of risk for all-cause dementia, Alzheimer’s disease and vascular dementia in relation to the MetS component exposure score (each P for trend <0.0001) (Table 3). Another sensitivity analysis excluding people undergoing treatment for diabetes mellitus, hypertension, and dyslipidemia also showed consistent trends with even higher HR values (Table 4). When subjects were divided into subgroups according to changes in the num-ber of MetS components (increased or same vs. decreased) be-tween the first health examination and the last examination, there was a significant trend in the stepwise increase of risk for all-cause dementia, Alzheimer’s disease and vascular dementia in relation to the MetS component exposure score in both groups (Supplemental Table S4).
DISCUSSION
In this large-scale population-based study including nearly 1.5 million people, we demonstrated a cumulative effect of MetS and its components on the risk of all-cause dementia, Alzheim-er’s disease, and vascular dementia. A stepwise increase in the risk of dementia according to the cumulative exposure to meta-bolic abnormalities was evident, and this was confirmed in sen-sitivity analyses. Of note, even minimal exposure to MetS com-ponents had a significant effect on the risk of dementia.
Previously, numerous studies had shown a link between meta-bolic abnormalities and dementia. The Honolulu-Asia Aging Study showed that metabolic cardiovascular risk factors com-posed of BMI, postload glucose, systolic and diastolic BP, total cholesterol, triglyceride, and subscapular skinfold thickness were associated with a risk of dementia in a follow-up of 25 years [31]. Compared with men with no risk factors, men with two or more risk factors had a 56% increased risk of dementia, and this association was stronger for vascular dementia. In an-other study of the elderly population aged 60 years or older, the MMSE score decreased significantly, and the incidence of mild cognitive impairment increased as the number of diagnosed fac-tors constituting MetS increased [32]. In a follow-up study of the Singapore Longitudinal Aging Study Cohort, each MetS

Exposure to Metabolic Syndrome and Risk of Dementia
Copyright © 2021 Korean Endocrine Society www.e-enm.org 429
Table 2. HR and 95% CI for Dementia According to the Cumulative Number of Individual Metabolic Syndrome Components
VariableAll-cause dementia Alzheimer’s disease Vascular dementia
No. of events IRa HR (95% CI) No. of events IRa HR (95% CI) No. of events IRa HR (95% CI)BP
0 (n=402,145) 973 0.47 1 (reference) 735 0.35 1 (reference) 137 0.07 1 (reference) 1 (n=261,172) 925 0.68 1.12 (1.02–1.23) 669 0.49 1.07 (0.96–1.19) 158 0.12 1.36 (1.08–1.71) 2 (n=211,342) 958 0.88 1.16 (1.06–1.28) 668 0.61 1.06 (0.95–1.19) 174 0.16 1.50 (1.19–1.90) 3 (n=194,457) 1,135 1.13 1.26 (1.15–1.39) 797 0.79 1.16 (1.04–1.30) 215 0.21 1.70 (1.35–2.14) 4 (n=423,660) 3,350 1.53 1.32 (1.22–1.44) 2,263 1.03 1.15 (1.04–1.27) 688 0.31 2.01 (1.63–2.48) P for trend <0.0001 0.0027 <0.0001WC 0 (n=1,023,438) 4,337 0.82 1 (reference) 3,054 0.58 1 (reference) 806 0.15 1 (reference) 1 (n=168,082) 970 1.12 1.10 (1.02–1.19) 671 0.77 1.06 (0.97–1.17) 169 0.19 1.05 (0.88–1.26) 2 (n=98,996) 677 1.33 1.25 (1.14–1.37) 489 0.96 1.25 (1.12–1.39) 120 0.24 1.19 (0.96–1.48) 3 (n=85,774) 575 1.30 1.19 (1.08–1.32) 391 0.88 1.13 (1.00–1.28) 117 0.26 1.29 (1.02–1.62) 4 (n=116,486) 782 1.30 1.22 (1.10–1.36) 527 0.88 1.16 (1.02–1.31) 160 0.27 1.28 (1.00–1.62) P for trend <0.0001 0.0042 0.0147Fasting glucose 0 (n=536,419) 1,940 0.70 1 (reference) 1,354 0.49 1 (reference) 369 0.13 1 (reference) 1 (n=337,939) 1,501 0.86 1.05 (0.98–1.12) 1,065 0.61 1.08 (0.99–1.17) 255 0.15 0.90 (0.77–1.06) 2 (n=224,782) 1,101 0.95 1.06 (0.98–1.14) 757 0.65 1.07 (0.98–1.17) 221 0.19 1.04 (0.87–1.23) 3 (n=164,370) 957 1.13 1.13 (1.04–1.23) 687 0.81 1.21 (1.09–1.33) 172 0.20 0.96 (0.80–1.16) 4 (n=229,266) 1,842 1.56 1.28 (1.18–1.38) 1,269 1.07 1.33 (1.21–1.46) 355 0.30 1.11 (0.93–1.33)
P for trend <0.0001 <0.0001 0.2336Triglycerides 0 (n=594,746) 2,612 0.85 1 (reference) 1,857 0.60 1 (reference) 467 0.15 1 (reference) 1 (n=258,344) 1,369 1.02 1.12 (1.05–1.20) 963 0.72 1.12 (1.04–1.22) 238 0.18 1.03 (0.87–1.21) 2 (n=191,878) 1,037 1.04 1.12 (1.03–1.21) 715 0.72 1.10 (1.00–1.21) 208 0.21 1.14 (0.96–1.37) 3 (n=178,767) 929 1.00 1.13 (1.04–1.23) 643 0.69 1.14 (1.03–1.26) 170 0.18 1.00 (0.82–1.22) 4 (n=269,041) 1,394 1.00 1.17 (1.08–1.27) 954 0.69 1.17 (1.06–1.29) 289 0.21 1.13 (0.94–1.36) P for trend 0.0002 0.0026 0.2711HDL-C 0 (n=854,394) 3,584 0.81 1 (reference) 2,475 0.56 1 (reference) 675 0.15 1 (reference) 1 (n=233,143) 1,256 1.04 1.14 (1.07–1.22) 908 0.75 1.17 (1.08–1.27) 226 0.19 1.13 (0.97–1.32) 2 (n=140,107) 830 1.14 1.13 (1.05–1.23) 587 0.81 1.12 (1.02–1.23) 152 0.21 1.19 (0.99–1.43) 3 (n=112,765) 656 1.12 1.17 (1.07–1.28) 452 0.77 1.13 (1.02–1.26) 129 0.22 1.31 (1.07–1.60) 4 (n=152,367) 1,015 1.30 1.29 (1.19–1.39) 710 0.91 1.26 (1.15–1.38) 190 0.24 1.35 (1.14–1.61) P for trend <0.0001 <0.0001 0.0002MetS 0 (n=789,674) 2,835 0.69 1 (reference) 2,018 0.49 1 (reference) 496 0.12 1 (reference) 1 (n=245,219) 1,275 1.00 1.15 (1.07–1.23) 896 0.71 1.13 (1.04–1.23) 233 0.18 1.18 (0.99–1.39) 2 (n=157,966) 966 1.18 1.18 (1.09–1.28) 659 0.81 1.12 (1.02–1.23) 194 0.24 1.35 (1.12–1.62) 3 (n=128,741) 910 1.37 1.30 (1.20–1.42) 622 0.93 1.24 (1.12–1.38) 179 0.27 1.43 (1.18–1.74) 4 (n=171,176) 1,355 1.54 1.35 (1.25–1.47) 937 1.06 1.30 (1.18–1.43) 270 0.31 1.50 (1.24–1.80)
P for trend <0.0001 <0.0001 <0.0001
Adjusted for age, sex, alcohol drinking, smoking, regular exercise, income status, systolic BP, WC, fasting glucose, triglyceride, and HDL-C levels (model 1).HR, hazard ratio; CI, confidence interval; IR, incidence rate; BP, blood pressure; WC, waist circumference; HDL-C, high-density lipoprotein cholesterol; MetS, metabolic syndrome.aPer 1,000 person-years.
Cho Y, et al.
430 www.e-enm.org Copyright © 2021 Korean Endocrine Society
component significantly increased the risk of developing mild cognitive impairment as well as the incidence of being diag-nosed with dementia later in patients with mild cognitive im-pairment at baseline [33]. Furthermore, the risk of developing mild cognitive impairment and the incidence of dementia in-creased more significantly in the group with 3 or more than the group with less than three component cardiovascular risk fac-tors. A recent meta-analysis showed that the risk of progression of mild cognitive impairment to dementia was significantly in-creased in people with diabetes (odds ratio, 1.53; 95% CI, 1.20 to 1.97) and MetS (odds ratio, 2.95; 95% CI, 1.23 to 7.05) [34]. However, another systematic review of 25 studies concluded that the effects of individual MetS components on cognitive de-cline are inconsistent and needs further investigation [35].
Unlike the studies focusing on MetS or risk factors at one time point, several studies have reported a link between changes in metabolic health status over time and the risk of dementia. MetS was assessed three times over a 10-year follow-up in the Whitehall II cohort study with middle-aged participants (35 to 55 years) [23]. It was found that the cognitive scores, defined as memory, reasoning, vocabulary, phonemic fluency, and seman-tic fluency, were significantly lower in the persistent MetS
group (diagnosis of two or more times during the three medical examinations) compared to the group in which MetS was never diagnosed. On the other hand, the above cognitive scores did not show significant differences between the nonpersistent MetS group (diagnosis of once in three medical examinations) and the group in which MetS was not diagnosed at all, suggest-ing that only persistent MetS is associated with lower cognitive performance in late midlife. A Taiwanese cohort study analyzed MetS status by 5-year intervals, and the participants were divid-ed into non-MetS, persistent MetS, improved MetS, and wors-ened MetS [24]. During up to 10-year of follow-up, the risk of dementia was higher in subjects with worsened MetS but not those with persistent or improved MetS. A similar study of a Korean population assessing MetS in 2-year intervals and a mean follow-up of 4.9 years was recently reported [25]. They showed that the risk of dementia was higher in the sustained and worsened MetS groups, and this trend was shown for all types of dementia, including vascular dementia and Alzheimer’s dis-ease. In particular, the improvement of high BP and fasting blood glucose was associated with a lower risk of dementia compared to those having sustained high BP and fasting blood glucose.
4
3
2
1
0
4
3
2
1
0
6
5
4
3
2
1
0
8
4
0
8
4
0
8
4
0
HR
(95%
CI)
HR
(95%
CI)
HR
(95%
CI)
Incidence rate(per 1,000 person-years)
Incidence rate(per 1,000 person-years)
Incidence rate(per 1,000 person-years)
Metabolic syndrome component exposure score
Metabolic syndrome component exposure score
Metabolic syndrome component exposure score
P for trend <0.0001
P for trend <0.0001
P for trend <0.0001
0 1 2 3 4 5 6 7 8 9 10 11 12 13 14 15 16 17 18 19 20
0 1 2 3 4 5 6 7 8 9 10 11 12 13 14 15 16 17 18 19 20
0 1 2 3 4 5 6 7 8 9 10 11 12 13 14 15 16 17 18 19 20
Fig. 1. Hazard ratios (HR) (95% confidence intervals [CIs]) and in-cidence rate of (A) all-cause dementia, (B) Alzheimer’s disease, and (C) vascular dementia according to the metabolic syndrome component exposure score. The data were adjusted for age, sex, al-cohol drinking, smoking, regular exercise, income status, systolic blood pressure, waist circumference, fasting glucose, triglyceride, and high-density lipoprotein cholesterol levels.
A
C
B

Exposure to Metabolic Syndrome and Risk of Dementia
Copyright © 2021 Korean Endocrine Society www.e-enm.org 431
Tabl
e 3.
HR
and
95%
CI f
or D
emen
tia A
ccor
ding
to th
e M
etab
olic
Syn
drom
e Co
mpo
nent
Exp
osur
e Sc
ore
(Sen
sitiv
ity A
naly
sis E
xclu
ding
Sub
ject
s with
the
Occ
urre
nce
of O
utco
mes
with
in 2
Ye
ars o
f Fol
low
-up)
All-
caus
e dem
entia
Alz
heim
er’s
dise
ase
Vasc
ular
dem
entia
No.
of
even
tsIR
aM
odel
1M
odel
2N
o. o
f ev
ents
IRa
Mod
el 1
Mod
el 2
No.
of
even
tsIR
aM
odel
1M
odel
2
0 (n
=83
,525
)81
0.30
1 (re
fere
nce)
1 (re
fere
nce)
610.
231
(refe
renc
e)1
(refe
renc
e)13
0.05
1 (re
fere
nce)
1 (re
fere
nce)
1 (n
=10
5,95
3)17
80.
531.
46 (1
.13–
1.90
)1.
43 (1
.10–
1.86
)14
30.
421.
55 (1
.15–
2.09
)1.
51 (1
.12–
2.04
)24
0.07
1.23
(0.6
3–2.
42)
1.23
(0.6
3–2.
42)
2 (n
=11
2,86
1)26
10.
721.
76 (1
.37–
2.26
)1.
72 (1
.34–
2.21
)19
40.
541.
72 (1
.29–
2.30
)1.
68 (1
.26–
2.24
)38
0.11
1.59
(0.8
5–2.
99)
1.58
(0.8
4–2.
98)
3 (n
=11
6,69
4)29
40.
791.
73 (1
.35–
2.21
)1.
70 (1
.33–
2.18
)22
40.
601.
73 (1
.30–
2.31
)1.
70 (1
.28–
2.27
)39
0.10
1.41
(0.7
5–2.
65)
1.40
(0.7
4–2.
63)
4 (n
=13
1,79
3)38
40.
911.
73 (1
.36–
2.20
)1.
69 (1
.33–
2.16
)25
90.
611.
53 (1
.16–
2.03
)1.
50 (1
.13–
1.98
)87
0.21
2.40
(1.3
3–4.
33)
2.37
(1.3
2–4.
28)
5 (n
=12
5,09
3)40
61.
011.
78 (1
.40–
2.27
)1.
73 (1
.36–
2.20
)30
70.
771.
77 (1
.34–
2.34
)1.
71 (1
.29–
2.26
)64
0.16
1.72
(0.9
4–3.
14)
1.69
(0.9
2–3.
09)
6 (n
=11
8,19
8)44
71.
181.
95 (1
.53–
2.48
)1.
88 (1
.48–
2.39
)32
00.
851.
83 (1
.39–
2.43
)1.
76 (1
.33–
2.33
)81
0.21
2.15
(1.1
8–3.
90)
2.10
(1.1
6–3.
82)
7 (n
=10
8,82
7)44
51.
282.
02 (1
.59–
2.58
)1.
94 (1
.52–
2.48
)31
70.
911.
90 (1
.43–
2.51
)1.
81 (1
.37–
2.40
)86
0.25
2.35
(1.3
0–4.
28)
2.29
(1.2
6–4.
16)
8 (n
=10
6,74
0)45
91.
342.
08 (1
.63–
2.65
)1.
98 (1
.55–
2.53
)33
50.
982.
01 (1
.51–
2.66
)1.
90 (1
.44–
2.52
)84
0.25
2.25
(1.2
4–4.
11)
2.19
(1.2
0–3.
99)
9 (n
=90
,220
)43
21.
502.
28 (1
.78–
2.91
)2.
14 (1
.67–
2.74
)31
51.
092.
19 (1
.65–
2.91
)2.
05 (1
.54–
2.72
)77
0.27
2.40
(1.3
1–4.
41)
2.31
(1.2
6–4.
25)
10 (n
=78
,866
)37
91.
502.
22 (1
.73–
2.85
)2.
08 (1
.62–
2.67
)26
81.
062.
06 (1
.54–
2.75
)1.
92 (1
.44–
2.57
)81
0.32
2.81
(1.5
3–5.
17)
2.70
(1.4
7–4.
97)
11 (n
=66
,725
)35
51.
672.
44 (1
.89–
3.14
)2.
29 (1
.78–
2.95
)24
21.
142.
20 (1
.64–
2.95
)2.
05 (1
.53–
2.76
)75
0.35
3.01
(1.6
2–5.
57)
2.87
(1.5
5–5.
32)
12 (n
=62
,647
)34
91.
752.
51 (1
.95–
3.23
)2.
33 (1
.80–
3.00
)23
51.
182.
23 (1
.66–
3.00
)2.
06 (1
.53–
2.76
)79
0.40
3.31
(1.7
9–6.
13)
3.15
(1.7
0–5.
82)
13 (n
=48
,298
)26
21.
712.
39 (1
.84–
3.10
)2.
17 (1
.67–
2.82
)19
61.
282.
36 (1
.74–
3.19
)2.
12 (1
.56–
2.87
)42
0.27
2.24
(1.1
7–4.
29)
2.11
(1.1
0–4.
04)
14 (n
=38
,443
)23
21.
902.
61 (2
.00–
3.40
)2.
39 (1
.83–
3.12
)16
41.
342.
43 (1
.78–
3.32
)2.
22 (1
.63–
3.03
)42
0.34
2.74
(1.4
2–5.
27)
2.57
(1.3
4–4.
95)
15 (n
=29
,202
)17
31.
872.
57 (1
.95–
3.40
)2.
35 (1
.78–
3.11
)11
71.
262.
30 (1
.66–
3.19
)2.
08 (1
.50–
2.89
)43
0.46
3.68
(1.9
1–7.
09)
3.44
(1.7
8–6.
64)
16 (n
=26
,305
)17
72.
132.
68 (2
.03–
3.54
)2.
39 (1
.81–
3.15
)12
91.
562.
59 (1
.87–
3.57
)2.
27 (1
.65–
3.14
)28
0.34
2.45
(1.2
3–4.
88)
2.26
(1.1
3–4.
51)
17 (n
=14
,421
)94
2.07
2.64
(1.9
3–3.
61)
2.36
(1.7
3–3.
23)
621.
362.
30 (1
.59–
3.34
)2.
05 (1
.41–
2.97
)26
0.57
4.18
(2.0
6–8.
46)
3.85
(1.9
0–7.
81)
18 (n
=9,
535)
672.
232.
89 (2
.06–
4.06
)2.
64 (1
.88–
3.71
)52
1.73
2.98
(2.0
1–4.
39)
2.71
(1.8
3–4.
00)
90.
302.
18 (0
.90–
5.29
)2.
02 (0
.83–
4.91
)
19 (n
=6,
370)
432.
162.
96 (2
.01–
4.35
)2.
67 (1
.81–
3.92
)25
1.26
2.30
(1.4
2–3.
73)
2.06
(1.2
7–3.
34)
120.
604.
54 (1
.99–
10.3
5)4.
16 (1
.82–
9.49
)
20 (n
=5,
409)
392.
333.
15 (2
.11–
4.70
)2.
81 (1
.88–
4.19
)28
1.67
3.05
(1.9
1–4.
88)
2.71
(1.7
0–4.
33)
40.
241.
72 (0
.54–
5.45
)1.
56 (0
.49–
4.95
)
P fo
r tre
nd<
0.00
01<
0.00
01<
0.00
01<
0.00
01<
0.00
01<
0.00
01
Mod
el 1
: adj
uste
d fo
r age
, sex
, alc
ohol
drin
king
, sm
okin
g, re
gula
r exe
rcise
, inc
ome
statu
s, sy
stolic
blo
od p
ress
ure,
wai
st ci
rcum
fere
nce,
fasti
ng g
luco
se, t
rigly
cerid
e, a
nd h
igh-
dens
ity li
popr
o-te
in ch
oles
tero
l lev
els;
Mod
el 2
: adj
uste
d fo
r mod
el 1
+isc
hem
ic h
eart
dise
ase,
stro
ke, d
epre
ssio
n, an
d Pa
rkin
son’
s dise
ase.
HR,
haz
ard
ratio
; CI,
conf
iden
ce in
terv
al; I
R, in
cide
nce r
ate.
a Per 1
,000
per
son-
year
s.

Cho Y, et al.
432 www.e-enm.org Copyright © 2021 Korean Endocrine Society
Tabl
e 4. H
R an
d 95
% C
I for
Dem
entia
Acc
ordi
ng to
the M
etab
olic
Syn
drom
e Com
pone
nt E
xpos
ure S
core
(Sen
sitiv
ity A
naly
sis E
xclu
ding
Sub
ject
s on
Trea
tmen
t with
Dia
-be
tes M
ellit
us, H
yper
tens
ion,
and
Dys
lipid
emia
)
All-
caus
e dem
entia
Alz
heim
er’s
dise
ase
Vasc
ular
dem
entia
No.
of
even
tsIR
aM
odel
1M
odel
2N
o. o
f ev
ents
IRa
Mod
el 1
Mod
el 2
No.
of
even
tsIR
aM
odel
1M
odel
2
0 (n
=81
,188
)10
00.
241
(refe
renc
e)1
(refe
renc
e)77
0.18
1 (re
fere
nce)
1 (re
fere
nce)
160.
041
(refe
renc
e)1
(refe
renc
e)
1 (n
=10
1,81
0)20
70.
391.
44 (1
.13–
1.83
)1.
40 (1
.10–
1.78
)16
10.
311.
44 (1
.10–
1.89
)1.
39 (1
.06–
1.83
)28
0.05
1.21
(0.6
5–2.
24)
1.20
(0.6
5–2.
23)
2 (n
=10
6,26
2)27
80.
501.
68 (1
.34–
2.12
)1.
66 (1
.32–
2.09
)20
40.
371.
60 (1
.22–
2.08
)1.
57 (1
.20–
2.04
)39
0.07
1.44
(0.8
0–2.
59)
1.44
(0.8
0–2.
58)
3 (n
=10
6,54
6)28
30.
511.
61 (1
.28–
2.03
)1.
59 (1
.26–
2.01
)21
30.
391.
57 (1
.20–
2.05
)1.
56 (1
.19–
2.03
)38
0.07
1.29
(0.7
1–2.
33)
1.29
(0.7
1–2.
32)
4 (n
=10
8,47
0)31
90.
571.
68 (1
.34–
2.12
)1.
66 (1
.32–
2.09
)21
50.
381.
48 (1
.13–
1.93
)1.
46 (1
.12–
1.90
)64
0.11
1.97
(1.1
3–3.
45)
1.96
(1.1
2–3.
43)
5 (n
=97
,087
)32
70.
651.
87 (1
.48–
2.36
)1.
84 (1
.46–
2.33
)23
00.
461.
71 (1
.31–
2.23
)1.
68 (1
.29–
2.20
)63
0.13
2.09
(1.1
8–3.
68)
2.07
(1.1
8–3.
65)
6 (n
=85
,691
)27
20.
611.
79 (1
.41–
2.28
)1.
76 (1
.38–
2.23
)19
70.
441.
69 (1
.28–
2.23
)1.
66 (1
.26–
2.18
)54
0.12
2.01
(1.1
2–3.
59)
1.98
(1.1
1–3.
54)
7 (n
=74
,028
)28
70.
752.
19 (1
.72–
2.78
)2.
16 (1
.69–
2.75
)20
50.
532.
03 (1
.53–
2.68
)2.
00 (1
.51–
2.64
)52
0.14
2.23
(1.2
3–4.
02)
2.21
(1.2
3–3.
99)
8 (n
=65
,645
)25
00.
742.
28 (1
.78–
2.92
)2.
21 (1
.73–
2.83
)16
60.
491.
98 (1
.48–
2.65
)1.
92 (1
.44–
2.56
)49
0.14
2.44
(1.3
4–4.
44)
2.40
(1.3
2–4.
36)
9 (n
=52
,192
)20
20.
752.
35 (1
.81–
3.04
)2.
28 (1
.76–
2.96
)14
40.
532.
17 (1
.61–
2.93
)2.
11 (1
.56–
2.85
)32
0.12
2.05
(1.0
8–3.
88)
2.02
(1.0
7–3.
83)
10 (n
=41
,672
)15
50.
722.
25 (1
.72–
2.96
)2.
21 (1
.68–
2.90
)10
80.
502.
03 (1
.48–
2.79
)1.
99 (1
.45–
2.73
)37
0.17
2.97
(1.5
8–5.
59)
2.93
(1.5
6–5.
52)
11 (n
=32
,399
)13
30.
802.
59 (1
.95–
3.43
)2.
53 (1
.91–
3.35
)76
0.45
1.92
(1.3
6–2.
71)
1.88
(1.3
3–2.
65)
410.
254.
30 (2
.29–
8.09
)4.
23 (2
.25–
7.96
)
12 (n
=25
,606
)92
0.70
2.35
(1.7
3–3.
18)
2.24
(1.6
5–3.
04)
590.
451.
97 (1
.37–
2.85
)1.
87 (1
.29–
2.69
)27
0.20
3.62
(1.8
4–7.
10)
3.54
(1.8
0–6.
94)
13 (n
=17
,859
)85
0.92
3.05
(2.2
3–4.
17)
2.98
(2.1
8–4.
08)
580.
632.
71 (1
.87–
3.93
)2.
66 (1
.83–
3.85
)20
0.22
3.81
(1.8
6–7.
78)
3.73
(1.8
3–7.
63)
14 (n
=12
,383
)56
0.88
3.13
(2.2
0–4.
45)
2.99
(2.1
1–4.
26)
420.
663.
10 (2
.06–
4.65
)2.
95 (1
.96–
4.43
)10
0.16
2.86
(1.2
3–6.
65)
2.78
(1.2
0–6.
47)
15 (n
=8,
318)
390.
913.
19 (2
.15–
4.74
)3.
11 (2
.10–
4.61
)22
0.51
2.34
(1.4
2–3.
86)
2.27
(1.3
8–3.
75)
140.
335.
92 (2
.70–
12.9
5)5.
81 (2
.66–
12.7
2)
16 (n
=5,
543)
301.
053.
60 (2
.34–
5.54
)3.
56 (2
.31–
5.48
)19
0.67
3.00
(1.7
6–5.
09)
2.97
(1.7
5–5.
05)
50.
183.
04 (1
.06–
8.73
)3.
00 (1
.05–
8.63
)
17 (n
=2,
784)
140.
983.
41 (1
.91–
6.08
)3.
24 (1
.81–
5.79
)8
0.56
2.57
(1.2
1–5.
45)
2.43
(1.1
5–5.
14)
50.
356.
13 (2
.12–
17.7
4)5.
97 (2
.06–
17.2
8)
18 (n
=1,
524)
101.
274.
36 (2
.23–
8.51
)4.
35 (2
.23–
8.49
)5
0.64
2.84
(1.1
3–7.
17)
2.85
(1.1
3–7.
19)
40.
518.
92 (2
.81–
28.2
7)8.
82 (2
.78–
27.9
5)
19 (n
=85
3)4
0.91
3.51
(1.2
8–9.
67)
3.37
(1.2
2–9.
26)
10.
231.
16 (0
.16–
8.44
)1.
11 (0
.15–
8.08
)2
0.46
8.46
(1.8
6–38
.50)
8.21
(1.8
0–37
.38)
20 (n
=45
6)5
2.16
7.98
(3.1
9–19
.96)
7.38
(2.9
5–18
.48)
31.
296.
22 (1
.92–
20.1
5)5.
72 (1
.76–
18.5
5)2
0.86
16.2
6(3.
54–7
4.81
)15
.64
(3.3
9–72
.09)
P fo
r tre
nd<
0.00
01<
0.00
01<
0.00
01<
0.00
01<
0.00
01<
0.00
01
Mod
el 1
: adj
uste
d fo
r age
, sex
, alc
ohol
drin
king
, sm
okin
g, re
gula
r exe
rcise
, inc
ome
statu
s, sy
stolic
blo
od p
ress
ure,
wai
st ci
rcum
fere
nce,
fasti
ng g
luco
se, t
rigly
cerid
e, a
nd h
igh-
dens
ity li
popr
o-te
in ch
oles
tero
l lev
els;
Mod
el 2
: adj
uste
d fo
r mod
el 1
+isc
hem
ic h
eart
dise
ase,
stro
ke, d
epre
ssio
n, an
d Pa
rkin
son’
s dise
ase.
HR,
haz
ard
ratio
; CI,
conf
iden
ce in
terv
al; I
R, in
cide
nce r
ate.
a Per 1
,000
per
son-
year
s.

Exposure to Metabolic Syndrome and Risk of Dementia
Copyright © 2021 Korean Endocrine Society www.e-enm.org 433
In addition to known evidence that MetS status and their changes over time are important risk predictors, we aimed to measure the complex effect of exposure degree and duration on incident dementia, considering the dynamic nature of MetS. Us-ing a scoring system, a quantitative assessment of exposure to each MetS component and their composite during a certain pe-riod was performed. In fact, more than one-third of subjects had changes in their MetS status during the 4 years, and nearly 95% of subjects had been exposed to at least one MetS component in this cohort. We found that the risk of all-cause dementia, Al-zheimer’s disease, and vascular dementia increased in propor-tion to the MetS exposure score and MetS component exposure score. This was true for both improved and worsened MetS groups. These results suggest that the extent and duration of ex-posure to metabolic unhealthiness may be important in the de-velopment of dementia. To our knowledge, this is the first large-scale analysis to examine the long-term effects of cumulative exposure to MetS on dementia. The validity of this scoring sys-tem, giving an equal weight to each MetS component, can be explained by the fact that they share some of the common pathogenetic pathways that cause dementia [36]. These univer-sal mechanisms associated with MetS components may lead to vascular dementia due to cerebral small vessel disease and ath-erosclerosis, as well as cognitive dysfunction due to neurode-generation, neuroinflammation, and increased blood-brain-bar-rier permeability [36,37].
The most important and alarming finding in this study is that the increase in the incidence rate and HR of dementia became significant with very minimal exposure to MetS components. The risk of all-cause dementia and Alzheimer’s disease was al-ready increased by approximately 40% with exposure to only one MetS component out of 20 during 4 years. This suggests a substantial increase in the dementia risk even before a formal diagnosis of MetS or other metabolic disorders. Because there is no complete cure and prevention is the best strategy in the management of dementia, active surveillance, education, life-style modification, and close follow-up are needed for high-risk subjects.
A strength of this study is the use of a nationwide database representing the entire Korean population, with almost 1.5 mil-lion subjects included in the analysis. Their metabolic health status was examined for 4 consecutive years for detailed charac-terization of risk profiles. However, some limitations should be acknowledged. First, because we included subjects who re-ceived annual health examinations, and men and employees are more likely to receive regular check-ups, the possibility of se-
lection bias should be considered. Second, a causal relationship could not be confirmed because this was an observational study with a retrospective design. To overcome this problem, we per-formed a sensitivity analysis with elimination of cases devel-oped in the first 2 years of follow-up, which showed similar re-sults. Third, due to the lack of imaging data or cognitive func-tion scaling, dementia was defined by disease codes and the prescription of medications; therefore, the severity of dementia could not be assessed. Further analysis on the relationship be-tween the extent of exposure to metabolic dysfunction and cog-nitive decline would be interesting. Fourth, a possible role for unidentified confounding variables, such as genetic predisposi-tion or social factors, remains to be identified. Last, because this study included only Korean people, the results may not be gen-eralized to other ethnicities.
In conclusion, more cumulative exposure to MetS or its com-ponents was associated with a higher risk of all-cause dementia, Alzheimer’s disease, and vascular dementia. Because even min-imal exposure to MetS components had a significant effect on the risk of dementia, more intensive management of metabolic risks should be emphasized for the prevention of dementia.
CONFLICTS OF INTEREST
No potential conflict of interest relevant to this article was re-ported.
ACKNOWLEDGMENTS
This study was performed using the database from the National Health Insurance System, and the results do not necessarily rep-resent the opinion of the National Health Insurance Corporation. This work was supported by EnM Research Award 2018 of the Korean Endocrine Society.
AUTHOR CONTRIBUTIONS
Conception or design: K.H., S.H.L. Acquisition, analysis, or in-terpretation of data: K.H., D.H.K., Y.M.P., K.H.Y., M.K.K., S.H.L. Drafting the work or revising: Y.C., S.H.L. Final approv-al of the manuscript: Y.C., K.H., D.H.K., Y.M.P., K.H.Y., M.K.K., S.H.L.
ORCID
Yunjung Cho https://orcid.org/0000-0002-9940-1909

Cho Y, et al.
434 www.e-enm.org Copyright © 2021 Korean Endocrine Society
Kyungdo Han https://orcid.org/0000-0002-6096-1263Seung-Hwan Lee https://orcid.org/0000-0002-3964-3877
REFERENCES
1. Prince M, Wimo A, Guerchet M, Ali G, Wu Y, Prina M. World Alzheimer Report 2015: the global impact of demen-tia. London: Alzheimer’s Disease International; 2015.
2. Kim YJ, Han JW, So YS, Seo JY, Kim KY, Kim KW. Preva-lence and trends of dementia in Korea: a systematic review and meta-analysis. J Korean Med Sci 2014;29:903-12.
3. Park JH, Eum JH, Bold B, Cheong HK. Burden of disease due to dementia in the elderly population of Korea: present and future. BMC Public Health 2013;13:293.
4. Yaffe K, Kanaya A, Lindquist K, Simonsick EM, Harris T, Shorr RI, et al. The metabolic syndrome, inflammation, and risk of cognitive decline. JAMA 2004;292:2237-42.
5. Dik MG, Jonker C, Comijs HC, Deeg DJ, Kok A, Yaffe K, et al. Contribution of metabolic syndrome components to cognition in older individuals. Diabetes Care 2007;30:2655-60.
6. Kuusisto J, Koivisto K, Mykkanen L, Helkala EL, Vanhanen M, Hanninen T, et al. Association between features of the insulin resistance syndrome and Alzheimer’s disease inde-pendently of apolipoprotein E4 phenotype: cross sectional population based study. BMJ 1997;315:1045-9.
7. Curb JD, Rodriguez BL, Abbott RD, Petrovitch H, Ross GW, Masaki KH, et al. Longitudinal association of vascular and Alzheimer’s dementias, diabetes, and glucose tolerance. Neurology 1999;52:971-5.
8. Ninomiya T, Ohara T, Hirakawa Y, Yoshida D, Doi Y, Hata J, et al. Midlife and late-life blood pressure and dementia in Japanese elderly: the Hisayama study. Hypertension 2011; 58:22-8.
9. Skoog I, Lernfelt B, Landahl S, Palmertz B, Andreasson LA, Nilsson L, et al. 15-Year longitudinal study of blood pressure and dementia. Lancet 1996;347:1141-5.
10. Launer LJ, Ross GW, Petrovitch H, Masaki K, Foley D, White LR, et al. Midlife blood pressure and dementia: the Honolulu-Asia aging study. Neurobiol Aging 2000;21:49-55.
11. Kivipelto M, Helkala EL, Laakso MP, Hanninen T, Hal-likainen M, Alhainen K, et al. Apolipoprotein E epsilon4 al-lele, elevated midlife total cholesterol level, and high midlife systolic blood pressure are independent risk factors for late-life Alzheimer disease. Ann Intern Med 2002;137:149-55.
12. Mielke MM, Zandi PP, Sjogren M, Gustafson D, Ostling S, Steen B, et al. High total cholesterol levels in late life associ-ated with a reduced risk of dementia. Neurology 2005;64: 1689-95.
13. Solomon A, Kivipelto M, Wolozin B, Zhou J, Whitmer RA. Midlife serum cholesterol and increased risk of Alzheimer’s and vascular dementia three decades later. Dement Geriatr Cogn Disord 2009;28:75-80.
14. Tan ZS, Seshadri S, Beiser A, Wilson PW, Kiel DP, Tocco M, et al. Plasma total cholesterol level as a risk factor for Al-zheimer disease: the Framingham Study. Arch Intern Med 2003;163:1053-7.
15. Reitz C, Tang MX, Luchsinger J, Mayeux R. Relation of plasma lipids to Alzheimer disease and vascular dementia. Arch Neurol 2004;61:705-14.
16. Tynkkynen J, Hernesniemi JA, Laatikainen T, Havulinna AS, Sundvall J, Leiviska J, et al. Apolipoproteins and HDL cholesterol do not associate with the risk of future dementia and Alzheimer’s disease: the National Finnish population study (FINRISK). Age (Dordr) 2016;38:465-73.
17. Anstey KJ, Cherbuin N, Budge M, Young J. Body mass in-dex in midlife and late-life as a risk factor for dementia: a meta-analysis of prospective studies. Obes Rev 2011;12: e426-37.
18. Loef M, Walach H. Midlife obesity and dementia: meta-analysis and adjusted forecast of dementia prevalence in the United States and China. Obesity (Silver Spring) 2013;21: E51-5.
19. Bowman K, Thambisetty M, Kuchel GA, Ferrucci L, Melz-er D. Obesity and longer term risks of dementia in 65-74 year olds. Age Ageing 2019;48:367-73.
20. Whitmer RA, Gunderson EP, Barrett-Connor E, Quesenber-ry CP Jr, Yaffe K. Obesity in middle age and future risk of dementia: a 27 year longitudinal population based study. BMJ 2005;330:1360.
21. Singh-Manoux A, Dugravot A, Shipley M, Brunner EJ, El-baz A, Sabia S, et al. Obesity trajectories and risk of demen-tia: 28 years of follow-up in the Whitehall II Study. Al-zheimers Dement 2018;14:178-86.
22. Kim JA, Kim DH, Kim SM, Park YG, Kim NH, Baik SH, et al. Impact of the dynamic change of metabolic health status on the incident type 2 diabetes: a nationwide population-based cohort study. Endocrinol Metab (Seoul) 2019;34:406-14.
23. Akbaraly TN, Kivimaki M, Shipley MJ, Tabak AG, Jokela M, Virtanen M, et al. Metabolic syndrome over 10 years and
Exposure to Metabolic Syndrome and Risk of Dementia
Copyright © 2021 Korean Endocrine Society www.e-enm.org 435
cognitive functioning in late midlife: the Whitehall II study. Diabetes Care 2010;33:84-9.
24. Fan YC, Chou CC, You SL, Sun CA, Chen CJ, Bai CH. Im-pact of worsened metabolic syndrome on the risk of demen-tia: a nationwide cohort study. J Am Heart Assoc 2017;6: e004749.
25. Lee JE, Shin DW, Han K, Kim D, Yoo JE, Lee J, et al. Changes in metabolic syndrome status and risk of dementia. J Clin Med 2020;9:122.
26. Lee YH, Han K, Ko SH, Ko KS, Lee KU; Taskforce Team of Diabetes Fact Sheet of the Korean Diabetes Association. Data analytic process of a nationwide population-based study using national health information database established by National Health Insurance Service. Diabetes Metab J 2016;40:79-82.
27. Lee J, Lee JS, Park SH, Shin SA, Kim K. Cohort profile: the National Health Insurance Service-National Sample Cohort (NHIS-NSC), South Korea. Int J Epidemiol 2017;46:e15.
28. Seo MH, Lee WY, Kim SS, Kang JH, Kang JH, Kim KK, et al. 2018 Korean Society for the Study of Obesity guideline for the management of obesity in Korea. J Obes Metab Syn-dr 2019;28:40-5.
29. Lee SH, Han K, Cho H, Park YM, Kwon HS, Kang G, et al. Variability in metabolic parameters and risk of dementia: a nationwide population-based study. Alzheimers Res Ther 2018;10:110.
30. Yu JH, Han K, Park S, Cho H, Lee DY, Kim JW, et al. Inci-dence and risk factors for dementia in type 2 diabetes melli-tus: a nationwide population-based study in Korea. Diabetes
Metab J 2020;44:113-24.31. Kalmijn S, Foley D, White L, Burchfiel CM, Curb JD,
Petrovitch H, et al. Metabolic cardiovascular syndrome and risk of dementia in Japanese-American elderly men. The Honolulu-Asia aging study. Arterioscler Thromb Vasc Biol 2000;20:2255-60.
32. Liu M, He Y, Jiang B, Wu L, Wang J, Yang S, et al. Associa-tion between metabolic syndrome and mild cognitive im-pairment and its age difference in a Chinese community el-derly population. Clin Endocrinol (Oxf) 2015;82:844-53.
33. Ng TP, Feng L, Nyunt MS, Feng L, Gao Q, Lim ML, et al. Metabolic syndrome and the risk of mild cognitive impair-ment and progression to dementia: follow-up of the Singa-pore longitudinal ageing study cohort. JAMA Neurol 2016; 73:456-63.
34. Pal K, Mukadam N, Petersen I, Cooper C. Mild cognitive impairment and progression to dementia in people with dia-betes, prediabetes and metabolic syndrome: a systematic re-view and meta-analysis. Soc Psychiatry Psychiatr Epidemiol 2018;53:1149-60.
35. Assuncao N, Sudo FK, Drummond C, de Felice FG, Mattos P. Metabolic syndrome and cognitive decline in the elderly: a systematic review. PLoS One 2018;13:e0194990.
36. Borshchev YY, Uspensky YP, Galagudza MM. Pathogenetic pathways of cognitive dysfunction and dementia in meta-bolic syndrome. Life Sci 2019;237:116932.
37. Van Dyken P, Lacoste B. Impact of metabolic syndrome on neuroinflammation and the blood-brain barrier. Front Neu-rosci 2018;12:930.