cumulative economic impact of future trade agreements on eu...
TRANSCRIPT

Pierre Boulanger, Hasan Dudu, Emanuele Ferrari, Mihaly Himics, Robert M'barek
Extended summary
Cumulative economic impact of future trade agreements on EU agriculture
2016
EUR 28200 EN
This publication is a Technical report by the Joint Research Centre (JRC), the European Commission’s science and
knowledge service. It aims to provide evidence-based scientific support to the European policy-making process.
The scientific output expressed does not imply a policy position of the European Commission. Neither the
European Commission nor any person acting on behalf of the Commission is responsible for the use which might
be made of this publication.
JRC Science Hub
https://ec.europa.eu/jrc
JRC103838
EUR 28200 EN
PDF ISBN 978-92-79-63490-1 ISSN 1831-9424 doi:10.2788/918897
Print ISBN 978-92-79-63491-8 ISSN 1018-5593 doi:10.2788/6212
Luxembourg: Publications Office of the European Union, 2016
© European Union, 2016
Reproduction is authorised provided the source is acknowledged.
How to cite: Boulanger, P., Dudu, H., Ferrari, E., Himics, M., and M'barek, R.; Cumulative economic impact of
future trade agreements on EU agriculture, Extended summary; EUR 28200 EN; doi:10.2788/918897
All images © European Union 2016, except cover images:
anaumenko, Selection of fresh products from farmers market, Fotolia.com
torsakarin, Container Cargo freight ship with working crane bridge, Fotolia.com
theaphotography, Handshake over EU flag. Partnership and politics concept, Fotolia.com
Abstract
This extended summary presents the main findings of the potential effects of twelve free trade agreements
(FTAs) under the current EU FTA agenda. It sheds some light on relatively balanced cumulated impacts in terms
of trade, production and price for the EU agricultural sector as a whole, while quantifying also the market
development for specific agricultural sectors. In contrast to a forecasting exercise, it compares a conservative and
an ambitious FTA scenario with a business as usual (reference) scenario.
For the full set of results and analysis, please see the JRC Science for Policy report:
Boulanger, P., Dudu, H., Ferrari, E., Himics, M., and M'barek, R.; Cumulative economic impact of future trade
agreements on EU agriculture; EUR 28206 EN; doi:10.2788/194880

Table of contents
1 Introduction .................................................................................................... 1
2 Scope of the study ........................................................................................... 2
3 Methodology ................................................................................................... 4
4 Caveats and limitations .................................................................................... 4
5 Main results .................................................................................................... 6
6 Focus on specific sectors .................................................................................. 9
6.1 Dairy ........................................................................................................ 9
6.2 Beef and sheep ........................................................................................ 10
6.3 Pigmeat and poultry ................................................................................. 12
6.4 Arable crops ............................................................................................ 13
6.5 Rice ........................................................................................................ 13
6.6 Sugar ..................................................................................................... 13
6.7 Beverages and tobacco ............................................................................. 15
6.8 On the effect of the Trans-Pacific Partnership .............................................. 15
7 Conclusion .................................................................................................... 16
List of abbreviations ............................................................................................ 17
List of figures ...................................................................................................... 18

1
1 Introduction
Trade is important to the European economy. The European Union (EU) exports nearly
as many goods as China, and more than the United States of America (USA) or any
other country. For agri-food trade in particular, the EU is also a key player on global
markets. For many years, the EU has been the leading importer of agri-food products,
underpinned by large imports of raw materials for the EU meat and food sectors. Since
2013, the EU has become the biggest global exporter of agri-food products. In 2010, the
EU became for the first time a net exporter of agri-food products and since then has
consistently run a trade surplus. Apart from the setback in 2009 (in the wake of the
global economic and financial crisis), export values has been continuously increasing
since 2005, at an average pace of 8% per year and outpacing growth of non-agricultural
exports.
In 2015, EU agri-food exports totalled 129 billion euros, with a growth of 6% compared
to 2014, despite the significant export losses to one of its most important export
markets, following the import ban imposed by the Russian authorities on a large number
of the EU products, notably meats, dairy products and fruit & vegetables. EU agri-food
imports in 2015 amounted to 113 billion euros, also showing a rising trend compared to
the previous year (+9%). Hence, the trade balance showed a positive surplus of 16
billion euros. Agri-food trade represented about 7% of the EU trade value, and made up
25% of the positive EU trade balance.
International markets are becoming more and more essential for the growth of EU
agriculture and farmers' incomes, and are an important source for jobs creation. On one
hand, expansion opportunities on the internal market appear to be limited in the context
of slower economic growth, an ageing population, saturation of food consumption and
changing diet preferences. On the other hand, market projections indicate a favourable
development for food export demand: while developed countries remain an important
outlet, emerging economies and a growing middle class in many developing countries in
Asia and Sub-Saharan Africa are expected to open up promising opportunities for
agricultural exporters, with growth rates in population and purchasing power outpacing
the EU and other advanced economies, and with nutrition patterns shifting to include
more dairy products and meat -based diets.
Against this background, the European Commission (EC) is committed to further
promote trade relationships that bring value to European society, while safeguarding the
European social and regulatory model, which notably includes appropriate protection of
highly sensitive agricultural products.
Over recent years, there has been a significant evolution in global trade policies: while
multilateral negotiations mediated by the World Trade Organization (WTO) have been
struggling to achieve concrete results as regards a possible deal to boost market access,
most countries have engaged in a number of bilateral and regional trade agreements
with various trade partners, to achieve a higher degree of reciprocal tariff liberalisation
and thus improved access to third country markets. These trade agreements are now
generally more ambitious and comprehensive in scope compared to only a decade ago.
The EU has followed this global trend in trade policy, with the number of preferential
trade negotiations expanding over the past years.
In order to build a coherent EU trade policy for the EU agri-food sector, EU policymakers
and negotiators need to ensure consistency between all trade agreements, and in
particular to limit their possible negative impacts on sensitive EU agricultural products.
To this end, the joint effects of all bilateral concessions that are granted to the EU's
trade partners need to be understood and balanced against concessions obtained from
these partners in market access and beyond, and the effects in other sectors in the
economy.
For each agreement, the EC regularly carries out impact assessments before the launch
of the negotiation and sustainability impact assessments (SIAs) while they are ongoing,
2
but a study that takes account of different trade negotiations simultaneously – at least
for the agricultural sector – has never been carried out. Furthermore, a more
disaggregated analysis of the agricultural sector than is typically carried out in the
Commission impact assessments is needed to complete the picture.
At the Agricultural Council meeting of 15 February 2016, Commissioner Hogan
announced that the Commission would carry out a study to analyse the economic
cumulative effects of ongoing and upcoming trade negotiations on the EU agricultural
sector. The present report is an extended summary of the report that is the result of
Commissioner Hogan's commitment to the EU Council of Ministers.
2 Scope of the study
The aim of the study is to provide policy-makers and negotiators with insights into the
economic impact of a selection of potential future EU trade agreements on the
agricultural sector in the EU28. The study aims to single out sensitive products and
indicate potentially offensive interests of the EU going into the bilateral negotiations.
Detailed knowledge of the potential impacts will allow the Commission to make informed
choices during the negotiation process.
The analysis will solely focus on the market access arrangements of the trade
agreements, i.e. on the effects produced by reciprocal liberalisation of import tariffs
between the EU and the relevant trade partners. This means that other provisions in the
trade agreements that could potentially also have an economic impact on the EU
agricultural sector (e.g. the reduction of non-tariff measures (NTMs), in particular
sanitary and phytosanitary measures (SPS), or the protection of geographical
indications) are not taken into account in the present assessment.
This study intends to cover ongoing and upcoming Free Trade Agreements (FTAs) that
could be concluded by the EU and come into operation over the next decade. Since the
list of potential negotiations to be considered would be quite long, only the agreements
with the most significant expected impacts for EU agriculture are analysed. First, the
study considers trade agreements recently concluded but not yet implemented, i.e.
those with Canada and Vietnam. A second category consists of major trade
agreements under negotiation (USA, Mercosur, Japan, Thailand, Indonesia and the
Philippines). The study also addresses negotiations likely to start in the near future, i.e.
with Australia and New Zealand. Finally, the modernisation of the older agreements
with Turkey and Mexico are included to complete the picture. In total, 12 trade
negotiations are covered. They represent a selection of the most important initiatives
under the current EU FTA agenda.
Agreements concluded in the past and already applied are not covered, since their
effects are already accounted for in the medium-term prospects of the EU agricultural
sector and integrated into the reference scenario (the "baseline") until 20251.
For most of the ongoing negotiations, offers of market access between the EU and the
relevant trade partners have not yet been exchanged, or at least they do not cover the
treatment of sensitive products, for which reciprocal concessions are usually granted
under the form of Tariff Rate Quotas (TRQs). Talks have not been launched for other
agreements. This implies that the actual outcome of the majority of EU free trade
negotiations considered in this study is largely unknown at this stage. In particular, it
would be extremely challenging to speculate about possible realistic volumes of
reciprocal TRQ concessions for a large number of sensitive products.
1 The baseline is documented in the annual report "Prospects for Agricultural Markets and Income in the EU, 2015-2025" available at the DG AGRI website: http://ec.europa.eu/agriculture

3
Given the early stage status of most of the negotiations analysed in this study, it is not
possible to model the precise negotiation outcomes. Instead, consideration is given to
theoretical scenarios that can provide a range of possible cumulated impacts of EU trade
policy.
The study considers two trade scenarios with different levels of ambition in the
negotiations: a conservative and an ambitious scenario. For the trade agreements with
Canada and Vietnam, both the conservative and the ambitious scenarios are based on
the actual outcome of the respective trade negotiations as regards tariff liberalisation.
This includes the modelling of bilateral TRQs granted under the two agreements. For the
remaining ten trade negotiations, the two scenarios are based on full tariff liberalisation
for a large majority of tariff lines and on a partial tariff cut for the few remaining lines,
which represent the sensitive products. The conservative and the ambitious scenarios
differ in terms of their assumptions regarding the percentage of tariff lines that will be
fully liberalised under the agreements and the size of the tariff cut for the sensitive
products.
Conservative: Full liberalisation of 97% of the World Customs Organization’s
Harmonized System (HS) 6-digit lines and a partial cut of 25% for
the remaining 3% of lines.
Ambitious: Full liberalisation of 98.5% of HS 6-digit lines and a partial cut of
50% for the remaining 1.5% of lines2.
The assumptions are applied identically to all considered trade agreements and
symmetrically for both the EU and the relevant trade partners. However, the selection of
sensitive products varies as a function of the trade agreement considered and can be
different for the EU and the relevant trade partners. The precise list of sensitive products
for each agreement and trade partner has been established based on two criteria,
applied in the following order of priority:
1. Expert judgement of the relevant trade negotiators of the European Commission,
based on the evidence of ongoing negotiations with trade partners or on the analysis
of the respective sensitivities, carried out prior to the launch of the trade talks;
2. Objective statistical indicators, notably the tariff revenue associated with each tariff
line.
As far as EU trade partners are concerned, beyond well-known sensitivities that emerged
from trade negotiations or preliminary talks, the degree of knowledge about products
potentially eligible for exemption from full tariff cuts is somewhat more limited;
therefore, the use of statistical indicators for the compilation of the sensitive products'
list is more extensive for third countries than for the EU.
Given the theoretical scenarios applied for the study, the results clearly do not represent
a forecast of the likely outcome of the trade negotiations covered in the study. In the
actual negotiations, the level of TRQs agreed will be the key factor determining the
impact on agricultural markets.
Finally, a sensitivity analysis is run to take into account the impact of the Trans-Pacific
Partnership (TPP) agreement, a mega regional FTA concluded between 12 countries of
2 It is worth noting that the percentage of liberalised lines must be dealt with at HS6 rather than at CN8 level, since global trade models work with HS6, which is the most disaggregated level for the harmonised world trade nomenclature. The margin of manoeuvre to shield sensitive agricultural products is not identical when working at HS6 or CN8 level, since the share of agricultural lines on the total tariff lines is different in the two product nomenclatures. 97% liberalisation at HS6 level leaves room for up to 21% of potentially sensitive agri codes to be excluded from full liberalisation, and is thus roughly equivalent to only 95.4% liberalisation at CN8 level for the EU. 98.5% liberalisation at HS6 level allows for the exclusion of up to 10.5% of agri codes, which roughly corresponds to 97.7% liberalisation at CN8 level.

4
the Pacific Rim (the United States, Australia, Brunei Darussalam, Canada, Chile, Japan,
Malaysia, Mexico, New Zealand, Peru, Singapore and Vietnam) and that is expected to
have major importance on the global trade arena. This sensitivity analysis consists of
implementing the two scenarios, ambitious and conservative, in combination with the
TPP.
3 Methodology
Economic models represent the main tools for the analysis of complex trade relations
and have been applied in several occasions to assess EU trade agreements with third
countries. Although many studies have focused on specific trade agreements
independently, here the analytical question at stake (i.e. the cumulative effect of trade
agreements), creates even more complexity and requires a specific approach that
responds to the multitude of agreements and, at the same time, the particularity of the
agri-food sector. In order to provide an answer to both aspects, this study applies a two-
tier modelling approach.
The first part of the analysis is carried out using a multi-region neoclassical computable
general equilibrium model (CGE) named MAGNET (Modular Applied GeNeral Equilibrium
Tool). MAGNET provides a comprehensive picture of the world economy at sector level,
and disaggregated at country level. This model takes into account the interactions of
individual economic sectors through domestic and international linkages. It provides
highly relevant information about trade-offs between different (agri-food) sectors in the
event of multiple bilateral trade liberalisation agreements.
As a model of the global economy, the relatively aggregated commodity structure of CGE
models and the somewhat standardised treatment across commodities and countries can
omit certain sectorial particularities or policy constraints. This is where partial
equilibrium models (PE) introduce complementary features, in particular through a more
disaggregated commodity structure within agriculture and the incorporation of
commodity specific interrelations. Hence, for a detailed analysis of the impacts on EU
agriculture at product-specific level the AGLINK-COSIMO model was applied3.
The two models are interlinked, i.e. the results of MAGNET simulations on EU exports
and imports are transferred to the AGLINK-COSIMO model, which is not designed to deal
with bilateral trade flows. Conversely, the latter model has higher product disaggregation
for EU agriculture and provides more details on production and trade volumes as well as
on producer prices.
4 Caveats and limitations
This study is based on simulations performed using economic models. These models
provide a conceptual framework that allows for a representation of the economy in an
effective but schematic and simplified manner. Since they cannot reproduce the reality in
its full complexity, they often have significant shortcomings and limitations that affect
the results of the study.
One of the main limitations relates to the coverage and the disaggregation of the
agricultural products in the models used: the CGE model MAGNET has a comprehensive
coverage of the economy, and thus of the agri-food sector. However, some of the most
important processed agricultural products that fall under the product category named
"other food" cannot be included in this analysis for technical reasons. In fact, this
3 The results of any analysis based on the use of the AGLINK-COSIMO model by parties outside the OECD are outside the responsibility of the OECD Secretariat. Conclusions derived by third-party users of AGLINK-COSIMO should not be attributed to the OECD or its member governments.

5
category is very large and heterogeneous and contains at the same time a variety of
food preparations and a very significant share (about 50% for EU imports) of non-
agricultural products, namely fishery products. Given that the database doesn't allow for
a separation between agricultural and fishery products, simulations on this category
provide misleading results, so they are not included in the analysis. It should however be
pointed out that the processed agricultural products falling under the other food
category, which include e.g. sugar confectionery, cocoa preparations, preparations of
cereals, bakers' wares and preparations of fruit and vegetables, are typical flagship
exports products, representing EU key offensive interest in bilateral trade negotiations,
and for which the EU normally expects to derive large benefits. Therefore, this limitation
leads to an underestimation the trade gains for the EU agri-food sector in a broad sense.
Given that the level of product disaggregation in any global CGE model is quite limited as
is its capacity to model detailed sectorial linkages and policy constraints, the partial
equilibrium model AGLINK-COSIMO is used to overcome these shortcomings of the CGE
models and to provide much more detailed and realistic results at agricultural commodity
level, even though it cannot provide results for the specific dynamics relating to certain
product segments (e.g. specialty cheeses vs. industrial cheeses). However, the product
coverage of the AGLINK-COSIMO model is lower than CGE models: although it includes
all major agricultural commodities, it does not model some important agricultural
products such as fruit and vegetables, wine and olive oil, as well as processed
agricultural products in general. Given the very high value of processed products, the
AGLINK-COSIMO model does not represent a significant share of the total EU agri-food
export value (70%).
As regards the geographical disaggregation of the study, results are provided only for
the EU as a whole. This simplification was necessary given the complexity of the analysis
and the limited reliability of the modelling tools at sub-EU level. This means that this
exercise is not able to provide indications on the impact of trade agreements at Member
State or at regional level, and thus even less for outermost regions, which are generally
explicitly covered in the standard Commission impact assessments.
Another limitation of the study lies in the theoretical character of the scenarios, where
possible trade concessions for sensitive products are not implemented under the form of
TRQs – as is usually the case in trade negotiations - but rather in terms of partial tariff
liberalisation (the exception being represented by the two FTAs concluded with Canada
and Vietnam). The reason for this choice and its implications were explained in the
section on the scope of the study.
Furthermore, the considered trade scenarios only investigate the effects of tariff
liberalisation, but do not factor in the analysis of the possible reduction of NTMs. In fact,
since there are currently no reliable estimates of NTMs for the agricultural sector at
disaggregated level, and given the limited time available to complete the exercise, it was
decided to omit them from the study. The non-quantification of potential gains in the
NTMs area may hide important benefits for EU exporters, as several trade partners
impose cumbersome and unjustified procedures that are usually streamlined in an FTA.
On the other hand, regarding EU imports, past experience shows that the EU does not
compromise its standards of consumer protection in any FTA chapter, for example on
authorising 'growth promoters', or modifying its science-based Genetically Modified
Organism (GMO) approval process. These barriers to EU imports remain in place (e.g.
the Comprehensive Economic and Trade Agreement (CETA)) even when tariffs are
removed or reduced.
Finally, another issue that the study was unable to take into account, although it could
certainly have huge implications on the EU free trade negotiations, is the possible impact
future developments related to the UK.

6
5 Main results
Unless otherwise stated, all results of this analysis refer to 2025, the year for which it is
assumed there is a full implementation of all the trade agreements. The impacts are
expressed as the difference between the scenario in which the set of considered
agreements is implemented, with respect to a reference scenario (or baseline)
representing the status quo situation (i.e. with no application of the trade agreements).
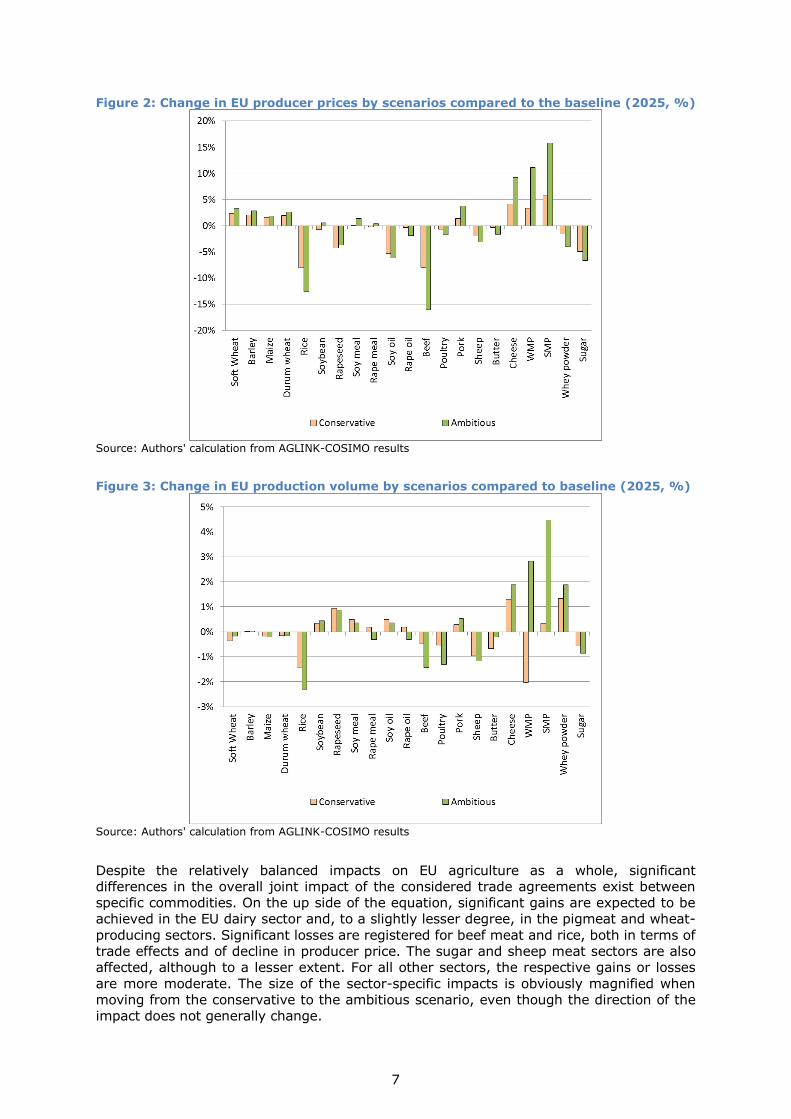
Figure 1 shows the trade impact of both scenarios in million euros, as determined by the
MAGNET model.
Figure 1: Change in EU trade value of agri-food products by scenarios compared to the baseline (2025, million euros)
Source: Authors' calculation from MAGNET results
The dairy sector displays net trade gains, which are particularly sizeable under the
ambitious scenario. On the contrary, trade impacts for beef & sheep meat are
characterised by a significant increase in imports and a much more modest growth in
exports, with an overall negative impact on the net trade position. In the pig & poultry
meat category, mixed impacts are registered, with net trade gains for pigmeat and
losses for poultry. Further, significant net trade gains are registered for the beverages
and tobacco category, whereas overall changes are quite limited for the fruit & vegetable
(F&V) sector as a whole. With the latter two sectors not being covered by the partial
equilibrium model, the presented impacts on trade flows are the only results available.
Except for the fruit & vegetables and beverages and tobacco sectors, the trade impacts at
sector level are "translated" into detailed production and price effects by the AGLINK-
COSIMO model (Figure 2 and Figure 3).
7
Figure 2: Change in EU producer prices by scenarios compared to the baseline (2025, %)
Source: Authors' calculation from AGLINK-COSIMO results
Figure 3: Change in EU production volume by scenarios compared to baseline (2025, %)
Source: Authors' calculation from AGLINK-COSIMO results
Despite the relatively balanced impacts on EU agriculture as a whole, significant
differences in the overall joint impact of the considered trade agreements exist between
specific commodities. On the up side of the equation, significant gains are expected to be
achieved in the EU dairy sector and, to a slightly lesser degree, in the pigmeat and wheat-
producing sectors. Significant losses are registered for beef meat and rice, both in terms of
trade effects and of decline in producer price. The sugar and sheep meat sectors are also
affected, although to a lesser extent. For all other sectors, the respective gains or losses
are more moderate. The size of the sector-specific impacts is obviously magnified when
moving from the conservative to the ambitious scenario, even though the direction of the
impact does not generally change.

8
Figure 4: Change in EU production value by scenarios compared to 2015 (2025, million
euros)
Source: Authors' calculation from AGLINK-COSIMO results
Figure 5: Change in EU production value by scenarios compared to 2015 (2025, %)
Source: Authors' calculation from AGLINK-COSIMO results
Comparing the situation in 2025 (after the implementation of all considered agreements)
with the current situation (2015) provides interesting indications. The black bar in Figure 4
and Figure 5 shows the projected change in the EU production value for the main
agricultural commodities between 2015 and 2025 based on DG AGRI outlook. The
coloured bars represent the situation in 2025 under the ambitious and conservative
scenarios. For the great majority of sectors, the expected evolution over the ten-year
period is strongly positive and more significant than the incremental effect of the trade
scenarios. For most dairy products, the expansion under the status quo is enhanced by
positive trade opening, while for sugar and rice the positive market outlook is slightly
reduced due to additional imports under both trade scenarios. Only for beef does the effect
of the trade scenarios outweigh the projected decline in production and price.

9
6 Focus on specific sectors
6.1 Dairy
Although dairy imports are expected to increase significantly from their current low
levels, they are dominated by export opportunities following easier access to the FTA
countries. Export opportunities are diverse, but particularly good in Japan, the USA,
Mercosur and Mexico. Within the dairy output mix, cheeses and skimmed milk powder
(SMP) are the major sources of export growth. The extra demand on international
markets leads to increases in both price (+9% and +16% respectively under the
ambitious scenario) and in production +2% and +4% respectively (see Figures 6 and 7).
While the price of whole milk powder (WMP) increases, the price for butter and whey
powder is expected to drop slightly following the increase in availability, due to the
relation of production complementarity with SMP and cheese. The combined trade effects
of all dairy products lead to an increase in EU milk production of 0.7% under the
ambitious scenario and 0.2% under the conservative scenario at a significantly increased
milk price level by 7% and 2% respectively. This leads to an annual increase of around
5.6 billion euros in market receipts for dairy farmers under the ambitious scenario.
Figures 6 and 7: Change in EU cheese and SMP balance sheet by scenarios compared to the baseline (2025, thousand tonnes)
Source: Authors' calculation from AGLINK-COSIMO results
Figure 8: Change in EU exports value of dairy by destinations and scenarios compared to the baseline (2025, million euros)

10
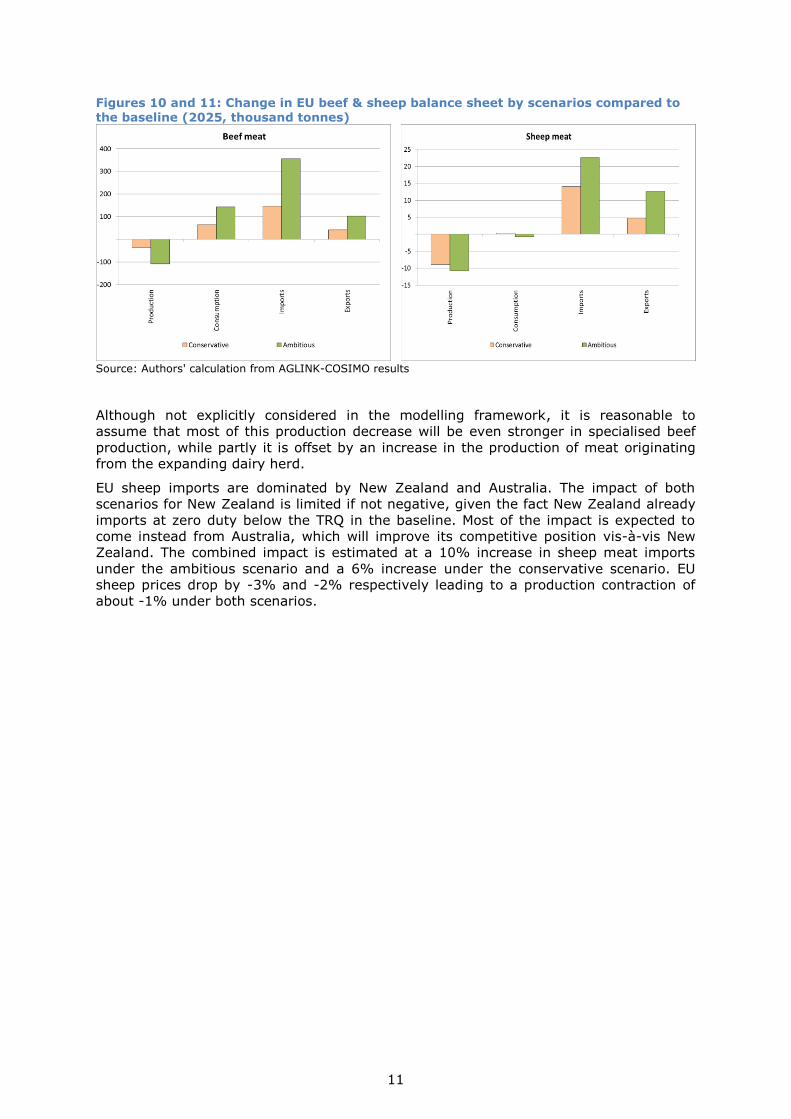
6.2 Beef and sheep
The red meat sector is potentially the most affected by further trade liberalisation
following the set of bilateral trade agreements. Under the specific settings of the
ambitious and conservative scenarios designed for this study, EU beef imports could
increase by about 146 and 356 thousand tonnes under the conservative and ambitious
scenarios, respectively. The additional imports are dominated by Mercosur (essentially
beef) and to a lesser extent Australia (beef and sheep). The additional imports from New
Zealand are negligible, although this is likely to be the result of a slight decline in sheep
meat imports, due to the preference erosion to Australia, combined with a slight increase
in beef imports. It is important to highlight the fact that this reflects the joint impact of
all trade agreements considered. The country-specific trade flows should not be
interpreted as a proxy for the impact of the different individual trade agreements. In this
particular study, the absence of TRQs reserved to individual trade partners allows
Mercosur to overshadow imports from other less competitive exporters.
Figure 9: Change in EU imports value of beef & sheep meat by origins and scenarios
compared to the baseline (2025, million euros)
Source: Authors' calculation from MAGNET results
The additional volume of EU beef imports creates a direct downward pressure on EU
producer prices. Moreover, the beef market is under additional pressure from the
positive developments in the dairy market. In the EU, about two thirds of beef
production stems from dairy herds. The positive price and production effect of the trade
scenario on the EU dairy market indirectly leads to a higher availability of meat from the
dairy herd at lower prices. The combined pressures on the EU market lead to a steep
drop in beef meat prices, by 8% under the conservative scenario and 16% under the
ambitious scenario. The lower beef price shifts EU meat consumption from other meats
towards beef. Increased consumption, combined with additional exports, relieves the
effect on EU beef production, which only declines by 1.4% under the most ambitious
scenario and 0.5% under the conservative one.
11
Figures 10 and 11: Change in EU beef & sheep balance sheet by scenarios compared to
the baseline (2025, thousand tonnes)
Source: Authors' calculation from AGLINK-COSIMO results
Although not explicitly considered in the modelling framework, it is reasonable to
assume that most of this production decrease will be even stronger in specialised beef
production, while partly it is offset by an increase in the production of meat originating
from the expanding dairy herd.
EU sheep imports are dominated by New Zealand and Australia. The impact of both
scenarios for New Zealand is limited if not negative, given the fact New Zealand already
imports at zero duty below the TRQ in the baseline. Most of the impact is expected to
come instead from Australia, which will improve its competitive position vis-à-vis New
Zealand. The combined impact is estimated at a 10% increase in sheep meat imports
under the ambitious scenario and a 6% increase under the conservative scenario. EU
sheep prices drop by -3% and -2% respectively leading to a production contraction of
about -1% under both scenarios.

12
6.3 Pigmeat and poultry
The MAGNET model shows a diverse trade impact on this aggregate commodity group,
which contains both strong export potential and sensitivities towards increased imports.
While the net effect on the trade balance is almost neutral under the conservative
scenario, the impact becomes slightly more negative when fewer EU tariff lines can be
protected under the ambitious trade scenario. In general, the EU’s interest in an
offensive trade strategy lies within the pork sector. The most promising export markets
include Japan, Mercosur and the USA. The poultry sector, on the other hand, is sensitive
to additional imports. These imports are dominated by Mercosur and Thailand.
Figure 12: Change in EU imports value of pigmeat and poultry by origins and scenarios compared to the baseline (2025, million euros)
Source: Authors' calculation from MAGNET results
Figures 13 and 14: Change in EU pigmeat and poultry balance sheet by scenarios compared to the baseline (2025, thousand tonnes)
Source: Authors' calculation from AGLINK-COSIMO results

13
Additional imports are the driving factor in the EU poultry balance. Imports increase by
48% and 20% under the ambitious and conservative scenarios, respectively, compared
to the baseline in 2025. However, the effect on production is limited to -1.3% and -0.5%
respectively. Firstly, the additional imports are limited to about 3% of EU domestic
consumption. Secondly, EU exports also increase, further alleviating the effect on the EU
domestic market. While the EU is less competitive in cuts such as breast fillets it is
successful in exporting other cuts to nearby markets in the Middle East and Africa.
6.4 Arable crops
The impact on the major arable crops can be summarised in two main events on the EU
market. Exports of durum and soft wheat have the potential to increase by 957 thousand
tonnes under the ambitious scenario and by 307 thousand tonnes under the
conservative scenario, mainly to Turkey. EU barley exports increase under both
scenarios. This additional demand leads to increased EU domestic prices of 3% in the
ambitious scenario and 1% under the conservative scenario for wheat. The other driver
of the cereal and oilseed market is the internal demand for feed. The changes in the
animal sector towards pork and milk, and away from beef and poultry, modify the
demand composition. The resulting effect is a shift from wheat and barley towards maize
and protein meals. This results in an increase in soymeal imports by 3% under the
ambitious scenario and 1% under the conservative scenario. The increased imports of
soybean (meal) lead to a reduced rapeseed price for EU farmers.
Overall, the impact is positive for the arable crops sector. Only the value of rapeseed
production declines.
6.5 Rice
Rice imports increase under both the ambitious and conservative scenarios. The
additional imports are dominated by Thailand, but the USA and Mercosur would also
increase slightly their exports to the EU. The additional trade from the 12 trade
agreements amounts to 165 million euros under the ambitious scenario. However, total
imports only increase by 111 million euros (+9%) as about one third of the imports
replace current imports. Rice production is very specialised. In some production areas
(e.g. Spain) conversion to alternative crops is not straightforward due to a variety of
reasons such as the specialized machinery and salinity of the soil in deltas. This leads to
an inelastic response to price changes. Under the ambitious scenario EU rice production
decreases by 2% while the EU rice price falls by 13%. The reduction is less pronounced
under the conservative scenario, but still amounts to 1% and 8% under each scenario
respectively.
6.6 Sugar
The expiration of the sugar quota in 2017 is expected to increase the competitiveness of
European sugar production on the world market, potentially leading the sector to change
from being a net importer to a net exporter by 2025. This new market environment
significantly changes the impact of trade agreements compared to earlier studies,
assuming a quota market environment.
Additional EU sugar imports are dominated by imports from Brazil, the world's biggest
sugar exporter. While sugar imports from other destinations decrease slightly, the trade
diversion is limited.

14
Figure 15: Change in EU imports value of sugar by origin by scenarios compared to the
baseline (2025, million euros)
Source: Authors' calculation from MAGNET results
The EU, a competitive refined sugar producer, is able to compensate a substantial part of
the additional imports through exports to Japan, Turkey and the USA.
Overall, the effect on the EU white sugar production is limited to a fall of 1% under both
scenarios. The impact on the EU white sugar price is differentiated, decreasing by 7%
under the ambitious scenario and 5% under the conservative scenario. However, taking
into account the strong development in sugar production value expected over the
coming decade, notably due to the abolition of sugar quotas, the net effect on sugar
production compared to the current situation (2015) would remain largely positive
(+14% and +11% under the conservative and ambitious scenarios, respectively),
despite the effects of trade agreements.

15
Figure 16: Change in EU exports value of sugar by destinations and scenarios compared
to the baseline (2025, million euros)
Source: Authors' calculation from MAGNET results
6.7 Beverages and tobacco
Within this aggregated product category, for which the EU has a large positive trade
surplus, the beverage sector (primarily wine and spirits) represents the main share of EU
trade flows (almost 70% in 2015) and more than 85% for exports only. As this product
category is not covered by the partial equilibrium model, the study only provides the
cumulative impact of the considered FTAs on trade flows.
In line with expectations, results show that this sector would reap significant cumulative
gains from trade agreements, as total EU exports would increase by 700 million euros
under either scenario, with the trade surplus growing by 400-500 million euros.
The most interesting export opportunities are represented by Mercosur (+300 million
euros), Japan (+150) and Vietnam (+100). Exports to the USA are also expected to
increase slightly, but the growth prospects are limited, given the already low level of
tariffs.
6.8 On the effect of the Trans-Pacific Partnership
The TPP potentially affects the impact of the EU trade negotiations with partners taking
part in this regional agreement. This is in particular the case for the EU export markets
such as Japan, where competitive pigmeat and dairy producers such as the USA, New
Zealand and Australia also gain preferential market access.
The results show that the TPP, in combination with the trade scenarios, only affects the
EU pigmeat market. The preference erosion in Asian markets, in particular Japan, due to
the concessions obtained by the USA and Canada, even leads to a decrease in EU
pigmeat exports compared to the baseline, despite the increased market access for the
EU. Indeed, the preferential treatment accorded by Japan to these two important
exporters under the TPP is larger than the 25% and 50% for the EU, as modelled in the
two trade scenarios.

16
However, the impact of the TPP on the scenario results is limited for dairy. This
sensitivity analysis scenario therefore shows the importance of EU trade agreements to
get market access conditions that are at least similar to those of the partners within the
TPP, in order to ensure a level playing field for EU products on the Pacific markets.
7 Conclusion
This study fills a knowledge gap highlighted by EU Member States with regard to the
state of the agri-food sectors in the light of EU trade negotiations and agreements.
Although economic models do not reflect all aspects of trade in agricultural products, it
provides insights for policy makers and negotiators, as a contribution to finding a good
balance in further trade liberalisation.
The study clearly illustrates the great potential for European agricultural products on the
world market. The potential gains for the dairy and the pigmeat sectors are particularly
sizeable, but a number of other products benefit from trade opening, ranging from
commodities such as wheat to more high value/processed products of the agri-food
industry, such as alcoholic beverages (notably wine and spirits). The additional export
demand enhanced by trade agreements could translate into an important source of
growth, jobs and value added for the European agricultural and food sectors.
On the other hand, the study also shows the vulnerability of specific agricultural sectors
in the face of growing imports following increased market access. This is in particular the
case for beef, rice and, to a lesser extent, poultry and sugar. This confirms EU position
regarding the sensitive character of these products in trade negotiations. However, it is
important to recall that the results for these sectors as set out in this study represent
the impact of theoretical scenarios (tariff cuts of 50% and 25%) not of the introduction
of TRQs, which are commonly included in trade agreements for these sectors.
A successful conclusion of bilateral trade agreements, for both parties, will have to strike
a balance between the protection of sensitive products and the achieved market access
for offensive agricultural products.

17
List of abbreviations
CETA Comprehensive Economic and Trade Agreement
CGE Computable General Equilibrium
DG AGRI Directorate-General for Agriculture and Rural Development
EC European Commission
EU European Union
FTA Free Trade Agreement
F&V Fruit and Vegetable
GMO Genetically Modified Organism
HS Harmonised System (tariff nomenclature)
JRC Joint Research Centre
MAGNET Modular Applied GeNeral Equilibrium Tool
MERCOSUR Mercado Común del Sur
NTM Non-Tariff Measure
OECD Organisation for Economic Co-operation and Development
PE Partial Equilibrium
SIA Sustainability Impact Assessment
SMP Skimmed Milk Powder
SPS Sanitary and Phytosanitary Measures
TPP Trans-Pacific Partnership
TRQ Tariff Rate Quota
TTIP Transatlantic Trade and Investment Partnership
USA United States of America
WMP Whole Milk Powder
WTO World Trade Organisation

18
List of figures
Figure 1: Change in EU trade value of agri-food products by scenarios compared to the
baseline (2025, million euros) ................................................................................. 6
Figure 2: Change in EU producer prices by scenarios compared to the baseline (2025,
%) ...................................................................................................................... 7
Figure 3: Change in EU production volume by scenarios compared to baseline (2025, %)
........................................................................................................................... 7
Figure 4: Change in EU production value by scenarios compared to 2015 (2025, million
euros).................................................................................................................. 8
Figure 5: Change in EU production value by scenarios compared to 2015 (2025, %) ..... 8
Figures 6 and 7: Change in EU cheese and SMP balance sheet by scenarios compared to
the baseline (2025, thousand tonnes) ...................................................................... 9
Figure 8: Change in EU exports value of dairy by destinations and scenarios compared to
the baseline (2025, million euros) ........................................................................... 9
Figure 9: Change in EU imports value of beef & sheep meat by origins and scenarios
compared to the baseline (2025, million euros) ....................................................... 10
Figures 10 and 11: Change in EU beef & sheep balance sheet by scenarios compared to
the baseline (2025, thousand tonnes) .................................................................... 11
Figure 12: Change in EU imports value of pigmeat and poultry by origins and scenarios
compared to the baseline (2025, million euros) ....................................................... 12
Figures 13 and 14: Change in EU pigmeat and poultry balance sheet by scenarios
compared to the baseline (2025, thousand tonnes) ................................................. 12
Figure 15: Change in EU imports value of sugar by origin by scenarios compared to the
baseline (2025, million euros) ............................................................................... 14
Figure 16: Change in EU exports value of sugar by destinations and scenarios compared
to the baseline (2025, million euros) ..................................................................... 15


Europe Direct is a service to help you find answers to your questions about the European Union
Free phone number (*): 00 800 6 7 8 9 10 11
(*) Certain mobile telephone operators do not allow access to 00 800 numbers or these calls may be billed.
A great deal of additional information on the European Union is available on the Internet.
It can be accessed through the Europa server http://europa.eu
How to obtain EU publications
Our publications are available from EU Bookshop (http://bookshop.europa.eu),
where you can place an order with the sales agent of your choice.
The Publications Office has a worldwide network of sales agents.
You can obtain their contact details by sending a fax to (352) 29 29-42758.
XX-N
A-x
xxxx-E
N-N
doi:10.2788/918897
ISBN 978-92-79-63490-1
LB-N
A-2
8200-E
N-N