culvert scour assessment - us forest service€”332 culvert scour assessment lowe creek bed...
TRANSCRIPT

A—327
Site evaluations
Lowe Creek
Lowe Creek
Site Information
Site Location: Mt Hood NF, Forest Road 4671
Year Installed: Pre-1987
Lat/Long: 121°53’55.08”W Watershed Area (mi2): 6.0
44°56’55.13”N
Stream Slope (ft/ft)1: 0.0445 Channel Type: Step-pool
Bankfull Width (ft): 23.6 Survey Date: April 5, 20071Water surface slope extending up to 20 channel widths up and downstream of crossing.
Culvert Information
Culvert Type: Open-bottom arch Culvert Material: Annular CMP
Culvert Width: 19 ft Outlet Type: Hybrid projecting/mitered
Culvert Length: 70 ft Inlet Type: Hybrid projecting/mitered
Pipe Slope (structure slope): 0.05
Culvert Bed Slope: 0.035
(First hydraulic control upstream of inlet to first hydraulic control downstream of outlet.)
Culvert width as a percentage of bankfull width: 0.81
Alignment Conditions: Appears inline with natural channel.
Bed Conditions: Scoured at upstream end of pipe. Large cobbles to large boulders are creating steps in culvert.
Pipe Condition: Left footing severely undermined at upstream end. May be some piping around sides of pipe where erosion has occurred.
Hydrology
Discharge (cfs) for indicated recurrence interval
25% 2-yr Qbf
2 2-year 5-year 10-year 50-year 100-year
35 115 141 227 292 448 5202Bankfull flow estimated by matching modeled water surface elevations to field-identified bankfull elevations.

A—328
Culvert Scour Assessment
Lowe Creek
Figure 1—Plan view map.
Points represent survey points

A—329
Site evaluations
Lowe Creek
HISTOrY The exact installation date is unknown, but the culvert was included in the 1987 Western Federal Lands Highway Division (WFLHD) “Oregon Culvert Fish Passage Survey.” The field survey for the WFLHD study was conducted on November 27, 1987. The study describes the culvert as an “open bottom arch with boulders placed inside the barrel.” With respect to fish passage, Oregon Department of Fish and Wildlife (ODFW) staff described the culvert as an “excellent open bottom arch installation;” whereas WFLHD staff noted that the culvert was in “fair” condition, the foundation was in “poor” condition, and there was “moderate” outlet scour. The culvert hydraulics were considered “compatible” with the natural stream hydraulics. They go on to note that open-bottom arches with shallow foundations are susceptible to scour and recommend that if foundation requirements cannot be met (i.e., embedment depth), then closed-bottom pipes should be installed.
The following are photos from the WFLHD study:
Culvert inlet.
Typical stream channel. SITe DeSCrIPTIOn The Lowe Creek culvert is an open-bottom arch that projects from the roadfill. The culvert is characterized by a deep scour pool at the inlet, primarily concentrated along the left side of the culvert where significant footing scour and undermining has occurred. Downstream of the scour pool, the bed is aggraded and levels off forming a consistent riffle. The channel is against the left side of the culvert for most of its length. There has been deposition of material along the right footing at the inlet. There is a large (greater than 2-foot diameter) log just upstream and inside of the culvert. There is significant erosion at the sides of the culvert at the inlet and outlet.
The upstream representative reach consists of a moderate gradient step-pool channel. The upstream segment sits in a fairly confined and narrow valley. Channel banks are steep with high adjacent terraces that may only be active at infrequent floods. Large boulders and fallen trees line both banks. The reach consists of a series of steps and pools.
The downstream representative reach consists of a series of steep riffles interspersed with pools. A relatively extensive low (active) flood plain exists through this reach. Bed material was finer and there were small log jams.
A—330
Culvert Scour Assessment
Lowe Creek
SurveY SuMMArY Fourteen cross sections and a longitudinal profile were surveyed at the Lowe Creek crossing in April 2007 to characterize the culvert, an upstream representative reach, and a downstream representative reach. Representative cross sections in the culvert were taken through the downstream end of the pool and the riffle. One additional cross section was surveyed upstream to characterize the inlet as well as the contraction of flow. Another two cross sections were surveyed downstream of the culvert to characterize the outlet and the expansion of flow.
Four cross sections were surveyed to characterize the upstream representative reach; one at the upstream boundary, one at the downstream boundary, one through a step, and one through a pool. Four cross sections were also surveyed to characterize the downstream representative reach; one at the upstream boundary, one at the downstream boundary, one through a pool, and one through a riffle.
PrOfILe AnALYSIS SegMenT SuMMArY The profile analysis resulted in a total of eight profile segments. The two consecutive segments downstream of the outlet, though similar in gradient, were not combined in order to separate out the transition area from the downstream representative channel. The culvert consisted of two profile segments, the upstream one extending into the upstream transition area. The upstream culvert segment was compared to two representative profile segments, one in the upstream channel and one in the downstream channel. There was no suitable comparison for the downstream segment in the culvert. The upstream transition segment was compared to a representative profile segment in the downstream channel. The downstream transition segment was compared to two representative profile segments, one in the upstream channel and one in the downstream channel. See figure 2 and table 1.
SCOur COnDITIOnSObserved conditions Footing scour – The greatest amount of footing scour is at the upstream end on the left bank where the footing is undermined. The base of the footing is suspended above the bed 2.5 feet at the maximum depth of the scour pool. The lateral extent of scour under the footing reaches 4 feet at one location. Some of this scour may be the result of a large log (greater than 2-foot diameter) located at the inlet. Approximately 40 percent of the footing on the left bank is undermined and all of it is exposed. There is also scour around the sides of the pipe at the inlet and outlet and there may be some piping of flow around the culvert in these areas. The “poor” foundation rating from the WFLHD study and the suggestion regarding foundation requirements suggest that some foundation undermining may have been present in 1987, but likely less than in 2007 or there would have been more mention of it.
Culvert-bed adjustment – The culvert bed has reduced its slope since installation (assuming the culvert bed was constructed at the same gradient as the structure). This flattening appears to be mostly due to scour in the upstream portion of the pipe. There is still streambed material throughout the pipe and no bedrock is present on the bed.
Profile characteristics – The profile has a concave shape through the crossing (figure 2). This shape reflects scour at the inlet region. There is a natural valley transition in this area. Upstream is more confined with higher and less active flood-plain terraces than the downstream reach.
Residual depths – The single culvert residual depth is within the range of residual depths in corresponding profile segments in the natural channel (B and H) (figure 21). The single residual depth in the downstream transition is also within the range of corresponding profile segments in the natural channel (B and H). There was no residual depth in the corresponding profile segment for the upstream transition.

A—331
Site evaluations
Lowe Creek
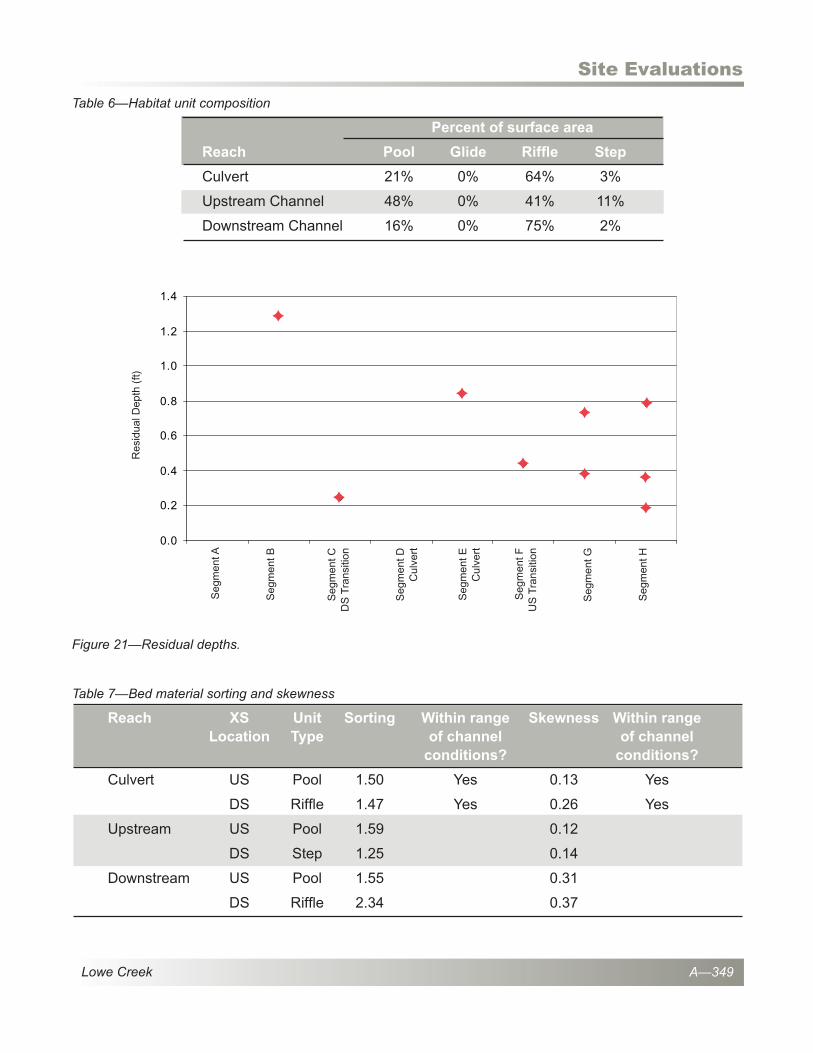
Substrate – Bed-material distributions are similar between the culvert and channel sample sites. The culvert has more coarse material than the downstream channel but similar abundance of coarse material as the upstream channel. The downstream channel has the greatest abundance of fine material. Sorting and skewness values in the culvert are within the range of those in the natural channel (table 7).
Predicted conditions *Note: As estimated in the model, backwater from the culvert affects portions of the upstream reach (figure 3). The backwater affects the upstream representative reach for the Q
50 and Q
100. For this
reason, hydraulic metrics for these flows are not used in the comparisons with culvert values.
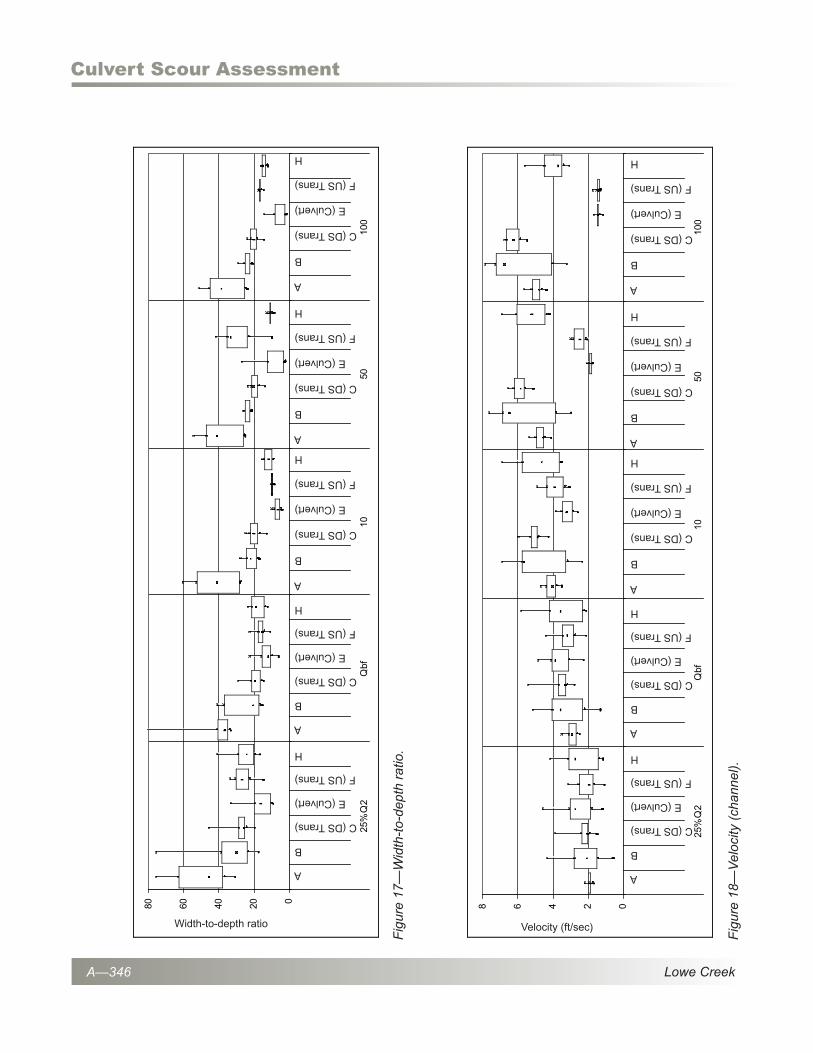
Cross-section characteristics – The culvert appears to affect most of the cross-section metrics at the Q
bf and above (figures 5 through
9 and 12 through 19). There is a dramatic reduction in top width and an increase in depth as flows rise. The culvert exhibits characteristics of outlet control, with culvert characteristics (i.e., barrel roughness, slope, and area) creating deep subcritical flow throughout most of the barrel length. The flow passes through critical depth near the downstream end. Cross-section characteristics at the upstream transition (F) are impacted by the culvert backwater at higher flows (Q
50 and Q
100). At lower flows, the flow has lower
width and greater depth than the corresponding profile segments (A), but this may be due partially to changes in valley confinement. Cross-section characteristics in the downstream transition (C) are mostly within the range of corresponding profile segments (B and H).
Shear stress – The modeling suggests that shear stress is low in the culvert due to backwater conditions that reduce the energy grade. Shear stress near the downstream end of the culvert is high where the flow passes through critical depth (figure 10). Shear stress in the upstream
transition (F) is greater than the corresponding profile segment (A) for flows up to the Q
10 but is
less at the Q50
and Q100
because of backwater effects (figures 10 and 19). Shear stress in the downstream transition (C) is within the range of corresponding profile segments (B and H).
Excess shear – The excess shear analysis shows the culvert as having lower potential for bed mobilization when compared to the upstream and downstream channels (figure 20). This is due to the backwater effect of the culvert that lowers the energy grade and therefore lowers the applied shear available to move material.
Velocity – The modeling suggests that velocity is low in the culvert due to backwater conditions that reduce the energy grade. Velocity near the downstream end of the culvert is high where the flow passes through critical depth (figure 11). Velocity in the upstream transition (F) is similar to the corresponding channel segment (A) at the Q
10 and below but is lower than the channel at the
Q50
and Q100
(figure 18) due to backwater effects. Velocity in the downstream transition (C) is within the range of corresponding channel segments (B and H) at all modeled flows.
Scour summary There is severe scour of the left bank footing at the inlet and extending downstream approximately 30 feet. This is a serious maintenance issue that needs to be addressed to ensure that the structural integrity of the crossing is not compromised. This scour may be partially related to culvert capacity, deposition of coarse material upstream of the inlet, and a large (greater than 2-foot diameter) midchannel log just upstream and inside of the culvert. The drop into the scour pool is larger than any drops observed in the reference reaches. This has also resulted in the deposition of material along the right footing at the inlet and the shifting of the channel towards the left. Downstream of the scour pool, the bed is aggraded and levels off forming a consistent riffle.
A—332
Culvert Scour Assessment
Lowe Creek
Bed material at the inlet has likely eroded out and redeposited at the downstream portion of the culvert, contributing to bed flattening.
Modeling suggests that flow geometry and hydraulics are highly impacted by the culvert, especially at high flows that cause backwater within and upstream of the culvert. The culvert appears to be under outlet control at high flows, with the length, roughness, and downstream conditions raising the elevation of the flow through much of the culvert. This condition serves to reduce channel velocity and shear stress through most of the culvert at very high flows (Q
50 and above). At these flows, the modeling
shows flow passing through critical depth near the downstream end of the culvert, with associated high shear stress and velocity that could cause scour at this location. Prior to the inlet scour, which widened the inlet area, the culvert may have exhibited inlet control conditions that contributed to the scour observed in the inlet area. At more frequent flood events, inlet control conditions may still be a concern, especially with respect to the potential for increased scour of the footing at the inlet
There is also significant erosion at the sides of the culvert at the inlet and outlet, possibly a result of flow contraction and expansion. Erosion at the left bank upstream of the inlet is further exacerbated by the coarse material and logs that have deposited upstream of the inlet, thus initiating lateral boundary adjustment.
AOP COnDITIOnS Cross-section complexity – The sum of squared height differences in the culvert cross sections are both within the range of those in the channel cross sections (table 3).
Profile complexity – Vertical sinuosity in the upstream culvert segment (E) is slightly greater than the values in the corresponding channel segments (B and H) (table 4). Vertical sinuosity in the upstream transition segment (F) is slightly greater than the value in the corresponding channel segment (A). Vertical sinuosity in the downstream transition segment (C) is within the range of values in the corresponding channel segments (B and H).
Depth distribution – The upstream culvert cross section has less channel margin habitat than the natural channel but the downstream culvert cross section is within the range of the natural channel (table 5).
Habitat units – Habitat-unit distribution in the culvert is within the range of that found in the natural channel upstream and downstream of the crossing (table 6).
Residual depths – The single culvert residual depth is within the range of residual depths in corresponding profile segments in the natural channel (B and H) (figure 21). The single residual depth in the downstream transition is also within the range of corresponding profile segments in the natural channel (B and H). There was no residual depth in the corresponding profile segment for the upstream transition.
Substrate – Bed-material distributions are similar between the culvert and channel sample sites. The culvert has more coarse material than the downstream channel but similar abundance of coarse material as the upstream channel. The downstream channel has the greatest abundance of fine material. Sorting and skewness values in the culvert are within the range of those in the natural channel (table 7).
A—333
Site evaluations
Lowe Creek
Large woody debris – There was one 2- to 3-foot-diameter piece of LWD present at the inlet to the culvert. The piece may have been a contributor to the scour present at the inlet. The representative channel had high LWD abundance (table 8). LWD formed steps and scour pools in the channel outside the crossing and played a primary role in habitat-unit creation and complexity. Features in the culvert did not mimic the role of wood in the natural channel.
AOP summary Complexity measures and site observations suggest that this is a good installation with respect to AOP. There is good flow concentration in the culvert that would support fish passage at low flows. The hydraulics at the Q
bf and below are
unaffected by the backwater effects described earlier and are assumed to be amenable to fish passage. There is also a dry bank along the right side suitable for passage of terrestrial organisms.
DeSIgn COnSIDerATIOnS This site is a poor installation with respect to scour but appears to be suitable for AOP. There are serious concerns with the structural integrity of the structure that are primarily related to the undermining of the left-bank footing at the upstream end of the culvert. Additionally, modeling suggests a severe effect on flow geometry and hydraulics at the Q
50 and above
that may create future scour problems within the pipe. This design could be improved by use of a wider culvert with greater capacity to convey high flood flows. It is also clear that the footing depth needs to be increased to extend below the depth of maximum potential scour.
There is also erosion on the sides of the culvert at the inlet and outlet. These areas should be stabilized with rock or concrete (e.g., wing-walls) to prevent erosion around the edges of the pipe.
Regular maintenance of the site is needed to remove woody debris, such as the large log that is located at the inlet and may be contributing to the inlet scour. Based on the presence of log jams in the natural channel, wood transport is common through this portion of Lowe Creek. Maintenance needs to be conducted to manage for this wood or the crossing needs to be made wide enough to convey wood.

A—334
Culvert Scour Assessment
Lowe Creek
Fig
ure
2—Lo
we
Cre
ek lo
ngitu
dina
l pro
file.
Tabl
e 1—
Seg
men
t com
paris
ons
80
85
90
95
10
0
10
5
11
0
11
5
05
01
00
15
02
00
25
03
00
35
04
00
45
05
00
Dis
tan
ce
alo
ng
be
d (f
ee
t)
Rela
tive
ele
vati
on (f
eet)
H
G
FE
DC
B
A
XS 1
3:
Peb
ble
coun
t
(poo
l)
XS 3
:
Peb
ble
coun
t(p
ool)
XS 1
2:
Peb
ble
coun
t(s
tep)
XS 8
:
Peb
ble
coun
t(p
ool)
XS 7
:
Peb
ble
coun
t(ri
ffle)
XS 2
:
Peb
ble
coun
t(ri
ffle)
Cul
vert
Rep
rese
ntat
ive C
hann
el
Rep
rese
ntat
ive C
hann
el
Larg
e lo
g in
inle
t
XS 1
XS 4
XS 5
XS 6
XS 9
XS 1
0XS
11
XS 1
4
A6
70
.02
9
B4
50
.04
9
C3
40
.04
3
D5
50
.01
7
E4
70
.05
5
F6
10
.03
2
G4
70
.07
8
H7
10
.05
8
Se
gm
en
t
Se
gm
en
t
Le
ng
th (
ft)
Se
gm
en
t G
rad
ien
t
EB
10
.7%
EH
4.9
%
Up
str
ea
m T
ran
sit
ion
FA
9.7
%
Do
wn
str
ea
m T
ran
sit
ion
CB
13
.4%
CH
26
.3%
Cu
lve
rt S
eg
me
nt
Re
pre
se
nta
tiv
e
Ch
an
ne
l Se
gm
en
t%
Dif
fere
nc
e in
G
rad
ien
t

A—335
Site evaluations
Lowe Creek
Tabl
e 2—
Sum
mar
y of
seg
men
ts u
sed
for
com
paris
ons
S
egm
ent
ran
ge
of
Man
nin
g's
n v
alu
es1
# o
f m
easu
red
XS
s #
of
inte
rpo
late
d X
Ss
A
0.
1126
– 0
.118
7 2
7
B
0.
1131
– 0
.119
7 2
5
C
0.
1115
– 0
.121
7 2
5
E
0.
0875
– 0
.129
8 2
6
F
0.
1298
– 0
.132
8 2
5
H
0.
1228
– 0
.133
6 2
61 O
btai
ned
usin
g eq
uatio
n fr
om J
arre
tt (1
984)
: n =
0.3
9S0.
38R
-0.1
6, w
here
S=
stre
am s
lope
; R=
hydr
aulic
rad
ius.
Jar
rett’
s eq
uatio
n on
ly a
pplie
d w
ithin
the
follo
win
g ra
nges
: S =
0.0
02 to
0.0
8, R
= 0
.5 ft
to 7
ft. F
or c
ross
-sec
tions
out
side
thes
e ra
nges
, n w
as c
ompu
ted
eith
er fr
om a
djac
ent
sect
ions
that
fell
with
in th
e ra
nges
, usi
ng th
e gu
idan
ce o
f Arc
emen
t and
Sch
neid
er (
1987
), o
r fr
om th
e H
EC
-RA
S r
ecom
men
datio
ns fo
r cu
lver
t m
odel
ing.
Fig
ure
3—H
EC
-RA
S p
rofil
e.
Sta
tions
with
dec
imal
val
ues
are
inte
rpol
ated
cro
ss s
ectio
ns p
lace
d al
ong
the
surv
eyed
pro
file.
01
00
20
03
00
40
08
5
90
95
10
0
10
5
11
0
11
5
Ma
in C
ha
nne
l Dis
tan
ce (
ft)
Elevation (ft)
Le
ge
nd
WS
Q
10
0
WS
Q
50
WS
Q
10
WS
Q
bf
WS
3
5 c
fs
Gro
un
d
1.5*
22.25*
2.5
33.5
44.15*
4.3
4.6
5.33333*
5.66666*
66.5
6.7
6.8
77.3
7.6
88.25
8.5
99.6
1010.3
10.65*
1111.2*
11.4
11.575*
11.7
11.75
1212.2
12.3
12.5
1313.2333*
13.4666*
13.7
14
Cul
vert
Elevation (ft)
A—336
Culvert Scour Assessment
Lowe Creek
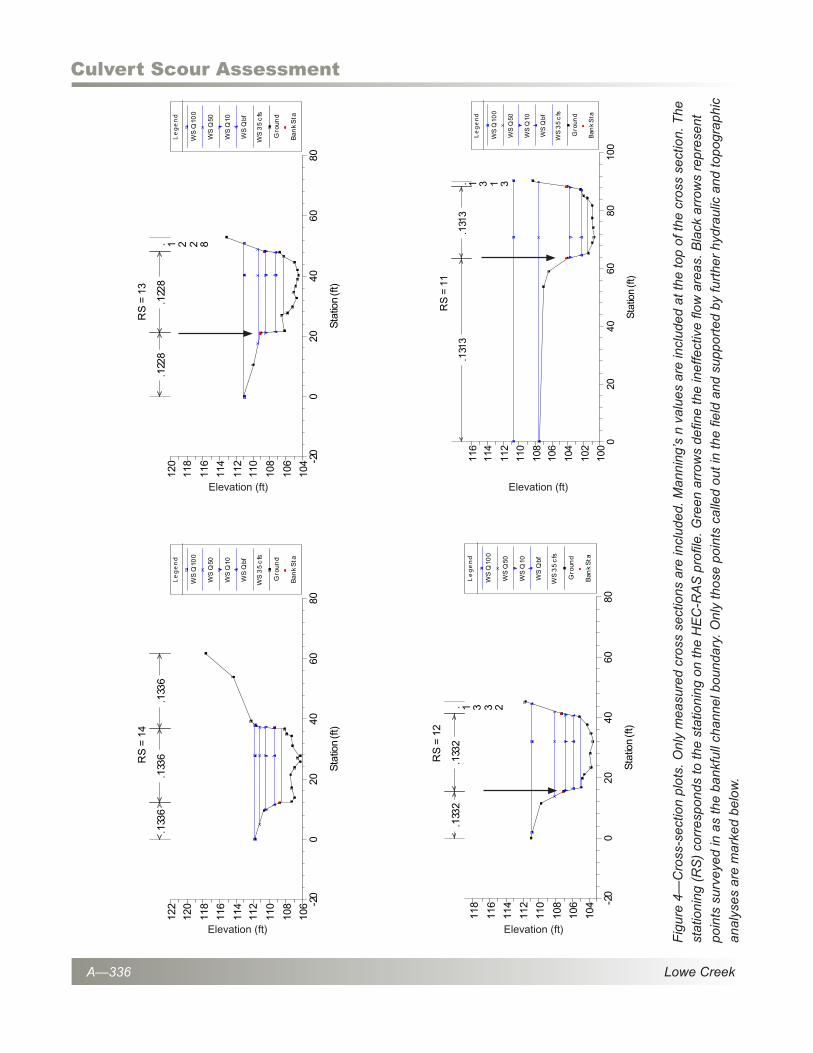
Fig
ure
4—C
ross
-sec
tion
plot
s. O
nly
mea
sure
d cr
oss
sect
ions
are
incl
uded
. Man
ning
’s n
val
ues
are
incl
uded
at t
he to
p of
the
cros
s se
ctio
n. T
he
stat
ioni
ng (
RS
) co
rres
pond
s to
the
stat
ioni
ng o
n th
e H
EC
-RA
S p
rofil
e. G
reen
arr
ows
defin
e th
e in
effe
ctiv
e flo
w a
reas
. Bla
ck a
rrow
s re
pres
ent
poin
ts s
urve
yed
in a
s th
e ba
nkfu
ll ch
anne
l bou
ndar
y. O
nly
thos
e po
ints
cal
led
out i
n th
e fie
ld a
nd s
uppo
rted
by
furt
her
hydr
aulic
and
topo
grap
hic
anal
yses
are
mar
ked
belo
w.
-20
020
4060
8010
6
108
110
112
114
116
118
120
122
R
S =
14
Sta
tion
(ft)
Elevation (ft)
Le
ge
nd
WS
Q10
0
WS
Q50
WS
Q10
WS
Qbf
WS
35
cfs
Gro
und
Ban
k S
ta
.133
6.1
336
.133
6
-20
020
4060
8010
4
106
108
110
112
114
116
118
120
R
S =
13
Sta
tion
(ft)
Elevation (ft)
Le
ge
nd
WS
Q10
0
WS
Q50
WS
Q10
WS
Qbf
WS
35
cfs
Gro
und
Ban
k S
ta
.122
8.1
228
. 1 2 2 8
-20
020
4060
80
104
106
108
110
112
114
116
118
R
S =
12
Sta
tion
(ft)
Elevation (ft)
Le
ge
nd
WS
Q10
0
WS
Q50
WS
Q10
WS
Qbf
WS
35
cfs
Gro
und
Ban
k S
ta
.133
2.1
332
. 1 3 3 2
020
4060
8010
010
0
102
104
106
108
110
112
114
116
R
S =
11
Sta
tion
(ft)
Elevation (ft)
Le
ge
nd
WS
Q10
0
WS
Q50
WS
Q10
WS
Qbf
WS
35
cfs
Gro
und
Ban
k S
ta
.131
3.1
313
. 1 3 1 3
Elevation (ft)Elevation (ft)
Elevation (ft)Elevation (ft)
A—337
Site evaluations
Lowe Creek
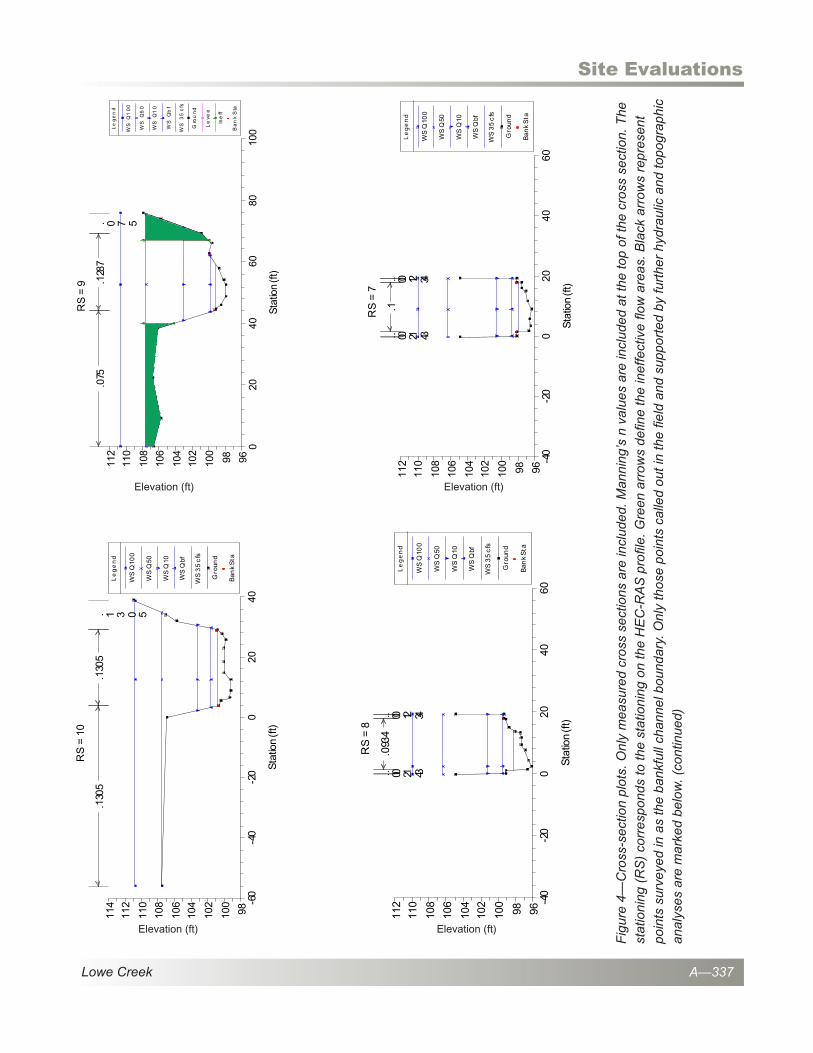
Fig
ure
4—C
ross
-sec
tion
plot
s. O
nly
mea
sure
d cr
oss
sect
ions
are
incl
uded
. Man
ning
’s n
val
ues
are
incl
uded
at t
he to
p of
the
cros
s se
ctio
n. T
he
stat
ioni
ng (
RS
) co
rres
pond
s to
the
stat
ioni
ng o
n th
e H
EC
-RA
S p
rofil
e. G
reen
arr
ows
defin
e th
e in
effe
ctiv
e flo
w a
reas
. Bla
ck a
rrow
s re
pres
ent
poin
ts s
urve
yed
in a
s th
e ba
nkfu
ll ch
anne
l bou
ndar
y. O
nly
thos
e po
ints
cal
led
out i
n th
e fie
ld a
nd s
uppo
rted
by
furt
her
hydr
aulic
and
topo
grap
hic
anal
yses
are
mar
ked
belo
w. (
cont
inue
d)
-60
-40
-20
020
409810
0
102
104
106
108
110
112
114
R
S =
10
Sta
tion
(ft)
Elevation (ft)
Le
ge
nd
WS
Q10
0
WS
Q50
WS
Q10
WS
Qbf
WS
35
cfs
Gro
und
Ban
k S
ta
.130
5.1
305
. 1 3 0 5
-40
-20
020
4060
9698100
102
104
106
108
110
112
R
S =
8
Sta
tion
(ft)
Elevation (ft)
Le
ge
nd
WS
Q10
0
WS
Q50
WS
Q10
WS
Qbf
WS
35
cfs
Gro
und
Ban
k S
ta
. 0 2 4. 0 1 3
.093
4. 0 1 3. 0 2 4
-40
-20
020
4060
9698100
102
104
106
108
110
112
R
S =
7
Sta
tion
(ft)
Elevation (ft)
Le
ge
nd
WS
Q10
0
WS
Q50
WS
Q10
WS
Qbf
WS
35
cfs
Gro
und
Ban
k S
ta
. 0 2 4. 0 1 3
.1. 0 1 3. 0 2 4
Elevation (ft)Elevation (ft)
Elevation (ft)
020
4060
8010
0969810
0
102
104
106
108
110
112
R
S =
9
Sta
tion
(ft)
Elevation (ft)
Le
ge
nd
WS
Q1
00
WS
Q5
0
WS
Q1
0
WS
Qb
f
WS
35
cfs
Gro
un
d
Le
vee
Ine
ff
Ba
nk
Sta
.075
.128
7. 0 7 5
Elevation (ft)
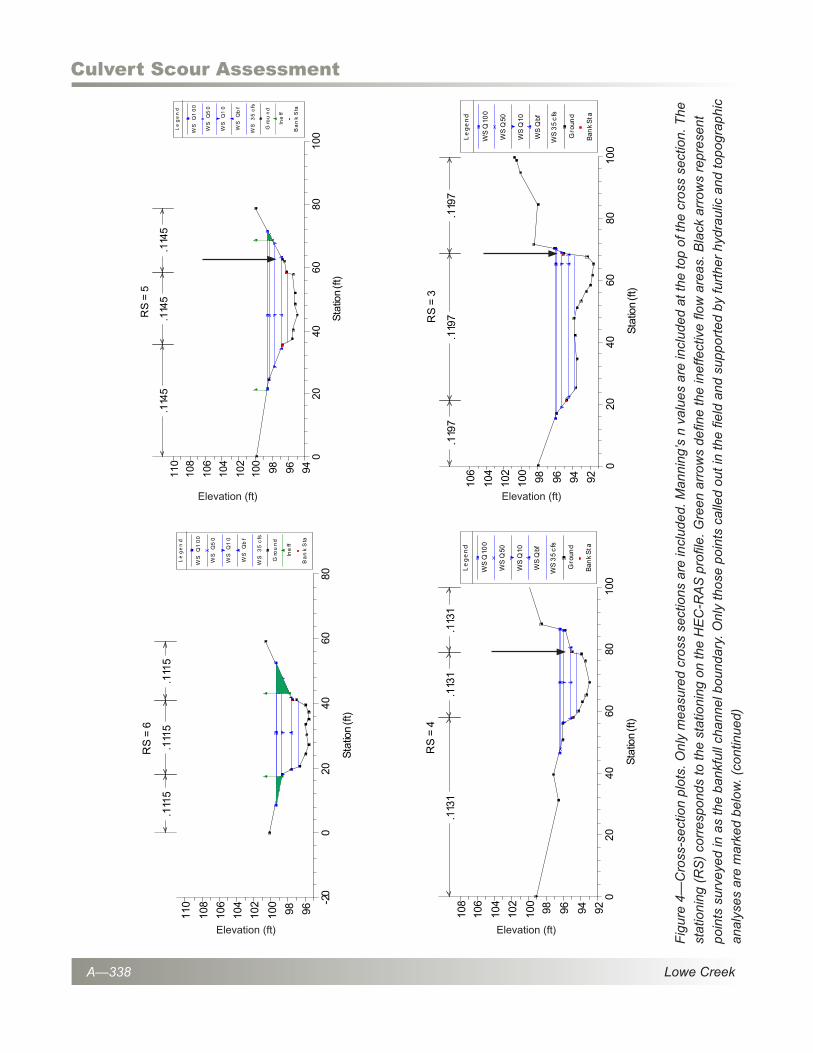
A—338
Culvert Scour Assessment
Lowe Creek
Fig
ure
4—C
ross
-sec
tion
plot
s. O
nly
mea
sure
d cr
oss
sect
ions
are
incl
uded
. Man
ning
’s n
val
ues
are
incl
uded
at t
he to
p of
the
cros
s se
ctio
n. T
he
stat
ioni
ng (
RS
) co
rres
pond
s to
the
stat
ioni
ng o
n th
e H
EC
-RA
S p
rofil
e. G
reen
arr
ows
defin
e th
e in
effe
ctiv
e flo
w a
reas
. Bla
ck a
rrow
s re
pres
ent
poin
ts s
urve
yed
in a
s th
e ba
nkfu
ll ch
anne
l bou
ndar
y. O
nly
thos
e po
ints
cal
led
out i
n th
e fie
ld a
nd s
uppo
rted
by
furt
her
hydr
aulic
and
topo
grap
hic
anal
yses
are
mar
ked
belo
w. (
cont
inue
d)
020
4060
8010
09294969810
0
102
104
106
108
R
S =
4
Sta
tion
(ft)
Elevation (ft)
Le
ge
nd
WS
Q10
0
WS
Q50
WS
Q10
WS
Qbf
WS
35
cfs
Gro
und
Ban
k S
ta
.113
1.1
131
.113
1
020
4060
8010
0
92949698100
102
104
106
R
S =
3
Sta
tion
(ft)
Elevation (ft)
Le
ge
nd
WS
Q10
0
WS
Q50
WS
Q10
WS
Qbf
WS
35
cfs
Gro
und
Ban
k S
ta
.119
7.1
197
.119
7
Elevation (ft)
Elevation (ft)
020
4060
8010
094969810
0
102
104
106
108
110
R
S =
5
Sta
tion
(ft)
Elevation (ft)
Le
ge
nd
WS
Q1
00
WS
Q5
0
WS
Q1
0
WS
Qb
f
WS
35
cfs
Gro
un
d
Ine
ff
Ba
nk
Sta
.114
5.1
145
.114
5
Elevation (ft)
-20
020
4060
80
9698100
102
104
106
108
110
R
S =
6
Sta
tion
(ft)
Elevation (ft)
Le
ge
nd
WS
Q1
00
WS
Q5
0
WS
Q1
0
WS
Qb
f
WS
35
cfs
Gro
un
d
Ine
ff
Ba
nk
Sta
.111
5.1
115
.111
5
Elevation (ft)

A—339
Site evaluations
Lowe Creek
Fig
ure
4—C
ross
-sec
tion
plot
s. O
nly
mea
sure
d cr
oss
sect
ions
are
incl
uded
. Man
ning
’s n
val
ues
are
incl
uded
at t
he to
p of
the
cros
s se
ctio
n. T
he
stat
ioni
ng (
RS
) co
rres
pond
s to
the
stat
ioni
ng o
n th
e H
EC
-RA
S p
rofil
e. G
reen
arr
ows
defin
e th
e in
effe
ctiv
e flo
w a
reas
. Bla
ck a
rrow
s re
pres
ent
poin
ts s
urve
yed
in a
s th
e ba
nkfu
ll ch
anne
l bou
ndar
y. O
nly
thos
e po
ints
cal
led
out i
n th
e fie
ld a
nd s
uppo
rted
by
furt
her
hydr
aulic
and
topo
grap
hic
anal
yses
are
mar
ked
belo
w. (
cont
inue
d)
020
4060
8010
0909294969810
0
102
104
106
R
S =
2
Sta
tion
(ft)
Elevation (ft)
Le
ge
nd
WS
Q1
00
WS
Q5
0
WS
Q1
0
WS
Qb
f
WS
35
cfs
Gro
un
d
Le
vee
Ba
nk
Sta
.112
6.1
126
.112
6
020
4060
8010
0
9092949698100
102
104
R
S =
1
Sta
tion
(ft)
Elevation (ft)
Le
ge
nd
WS
Q10
0
WS
Q50
WS
Q10
WS
Qbf
WS
35
cfs
Gro
und
Ban
k S
ta
.118
7.1
187
.118
7
Elevation (ft)
Elevation (ft)
Fig
ure
5—F
low
are
a (t
otal
) pr
ofile
plo
t.
05
01
00
15
02
00
25
03
00
35
04
00
0
10
0
20
0
30
0
40
0
50
0
60
0
Ma
in C
ha
nne
l Dis
tanc
e (
ft)
Flow Area (sq ft)
Le
ge
nd
Flo
w A
rea
Q1
00
Flo
w A
rea
Q5
0
Flo
w A
rea
Q1
0
Flo
w A
rea
Qb
f
Flo
w A
rea
35
cfs
Cul
vert
A
B
C
D
E
F G
Flow
H
Flow area (sq ft)

A—340
Culvert Scour Assessment
Lowe Creek
Fig
ure
6—W
ette
d pe
rimet
er.
Fig
ure
7—H
ydra
ulic
rad
ius.
05
01
00
15
02
00
25
03
00
35
04
00
0
20
40
60
80
10
0
12
0
Ma
in C
ha
nne
l Dis
tanc
e (
ft)
W.P. Total (ft)
Le
ge
nd
W.P
. T
ota
l Q
10
0
W.P
. T
ota
l Q
50
W.P
. T
ota
l Q
10
W.P
. T
ota
l Q
bf
W.P
. T
ota
l 35
cfs
Cul
vert
A
B
C
D
E
F G
Flow
H
05
01
00
15
02
00
25
03
00
35
04
00
02468
10
12
Ma
in C
ha
nne
l Dis
tanc
e (
ft)
Hydr Radius (ft)
Le
ge
nd
Hyd
r Ra
diu
s Q
10
0
Hyd
r Ra
diu
s Q
50
Hyd
r Ra
diu
s Q
10
Hyd
r Ra
diu
s Q
bf
Hyd
r Ra
diu
s 3
5 c
fs
Cul
vert
A
B
C
D
E
F G
Flow
H
W.P. total (ft) Hydraulic radius (ft)

A—341
Site evaluations
Lowe Creek
Fig
ure
8—To
p w
idth
.
Fig
ure
9—M
axim
um d
epth
.
05
01
00
15
02
00
25
03
00
35
04
00
0
20
40
60
80
10
0
Ma
in C
ha
nne
l Dis
tanc
e (
ft)
Top Width (ft)
Le
ge
nd
To
p W
idth
Q10
0
To
p W
idth
Q50
To
p W
idth
Q10
To
p W
idth
Qbf
To
p W
idth
35
cfs
Cul
vert
A
B
C
D
E
F G
Flow
H
05
01
00
15
02
00
25
03
00
35
04
00
02468
10
12
14
16
Ma
in C
ha
nne
l Dis
tanc
e (
ft)
Max Chl Dpth (ft)
Le
ge
nd
Ma
x C
hl D
pth
Q1
00
Ma
x C
hl D
pth
Q5
0
Ma
x C
hl D
pth
Q1
0
Ma
x C
hl D
pth
Qb
f
Ma
x C
hl D
pth
35
cfs
Cul
vert
A
B
C
D
E
F G
Flow
H
Top width (ft) Maximum channel depth (ft)

A—342
Culvert Scour Assessment
Lowe Creek
Fig
ure
10—
She
ar s
tres
s (c
hann
el)
profi
le.
Fig
ure
11—
Vel
ocity
(ch
anne
l) pr
ofile
plo
t.
05
01
00
15
02
00
25
03
00
35
04
00
0
10
20
30
40
50
Ma
in C
ha
nne
l Dis
tanc
e (
ft)
Shear Chan (lb/sq ft)
Le
ge
nd
Sh
ear
Ch
an Q
100
Sh
ear
Ch
an Q
50
Sh
ear
Ch
an Q
10
Sh
ear
Ch
an Q
bf
Sh
ear
Ch
an 3
5 c
fs
Cul
vert
A
B
C
D
E
F G
Flow
H
*Not
e: S
hear
at s
tatio
n 6.
5 fo
r th
e Q
50 a
nd Q
100
are
grea
ter
than
50
poun
ds p
er s
quar
e fo
ot a
nd a
re th
eref
ore
not s
how
n.
05
01
00
15
02
00
25
03
00
35
04
00
05
10
15
20
25
30
Ma
in C
ha
nne
l Dis
tanc
e (
ft)
Vel Chnl (ft/s)
Le
ge
nd
Ve
l Ch
nl Q
10
0
Ve
l Ch
nl Q
50
Ve
l Ch
nl Q
10
Ve
l Ch
nl Q
bf
Ve
l Ch
nl 3
5 c
fs
Cul
vert
A
B
C
D
E
F G
Flow
H
Shear channel (lbs/sq ft) Velocity channel (ft/sec)

A—343
Site evaluations
Lowe Creek
Bo
x P
lot
exp
lan
atio
n
Max
imum
val
ue
75th
per
cent
ile
Med
ian
(aka
50t
h pe
rcen
tile)
25th
per
cent
ile
Min
imum
val
ue
100%
of th
eva
lues
50%
of th
eva
lues
Fig
ure
12—
Flo
w a
rea
(tot
al).
0
50100
150
200
AB
C (
ds tr
ans)
E (
culv
) F (
us tr
ans)
HA
B
C (
ds tr
ans)
E (
culv
) F (
us tr
ans)
HA
B
C (
ds tr
ans)
E (
culv
) F (
us tr
ans)
HA
B
C (
ds tr
ans)
E (
culv
) F (
us tr
ans)
HA
B
C (
ds tr
ans)
E (
culv
) F (
us tr
ans)
H
25%
Q2
Qbf
1050
100
Flow
Are
a (f
t2) A
B
C (DS Trans)
E (Culvert)
F (US Trans)
H
A
B
C (DS Trans)
E (Culvert)
F (US Trans)
H
A
B
C (DS Trans)
E (Culvert)
F (US Trans)
H
A
B
C (DS Trans)
E (Culvert)
F (US Trans)
H
A
B
C (DS Trans)
E (Culvert)
F (US Trans)
H
Flow area (ft2)

A—344
Culvert Scour Assessment
Lowe Creek
Fig
ure
13—
Wet
ted
perim
eter
. F
igur
e 14
—H
ydra
ulic
rad
ius.
0
306090120
AB
C (
ds tr
ans)
E (
culv
) F (
us tr
ans)
HA
B
C (
ds tr
ans)
E (
culv
) F (
us tr
ans)
HA
B
C (
ds tr
ans)
E (
culv
) F (
us tr
ans)
HA
B
C (
ds tr
ans)
E (
culv
) F (
us tr
ans)
HA
B
C (
ds tr
ans)
E (
culv
) F (
us tr
ans)
H
25%
Q2
Qbf
1050
100
Wet
ted
Perim
eter
(ft)
0246
AB
C (
ds tr
ans)
E (
culv
) F (
us tr
ans)
HA
B
C (
ds tr
ans)
E (
culv
) F (
us tr
ans)
HA
B
C (
ds tr
ans)
E (
culv
) F (
us tr
ans)
HA
B
C (
ds tr
ans)
E (
culv
) F (
us tr
ans)
HA
B
C (
ds tr
ans)
E (
culv
) F (
us tr
ans)
H
25%
Q2
Qbf
1050
100
Hyd
raul
ic R
adiu
s (f
t)
A
B
C (DS Trans)
E (Culvert)
F (US Trans)
H
A
B
C (DS Trans)
E (Culvert)
F (US Trans)
H
A
B
C (DS Trans)
E (Culvert)
F (US Trans)
H
A
B
C (DS Trans)
E (Culvert)
F (US Trans)
H
A
B
C (DS Trans)
E (Culvert)
F (US Trans)
H
A
B
C (DS Trans)
E (Culvert)
F (US Trans)
H
A
B
C (DS Trans)
E (Culvert)
F (US Trans)
H
A
B
C (DS Trans)
E (Culvert)
F (US Trans)
H
A
B
C (DS Trans)
E (Culvert)
F (US Trans)
H
A
B
C (DS Trans)
E (Culvert)
F (US Trans)
H
Wetted perimeter (ft) Hydraulic radius (ft)

A—345
Site evaluations
Lowe Creek
Fig
ure
15—
Top
wid
th.
Fig
ure
16—
Max
imum
dep
th.
0
20406080100
AB
C (
ds tr
ans)
E (
culv
) F (
us tr
ans)
HA
B
C (
ds tr
ans)
E (
culv
) F (
us tr
ans)
HA
B
C (
ds tr
ans)
E (
culv
) F (
us tr
ans)
HA
B
C (
ds tr
ans)
E (
culv
) F (
us tr
ans)
HA
B
C (
ds tr
ans)
E (
culv
) F (
us tr
ans)
H
25%
Q2
Qbf
1050
100
Top
Wid
th (f
t) A
B
C (DS Trans)
E (Culvert)
F (US Trans)
H
A
B
C (DS Trans)
E (Culvert)
F (US Trans)
H
A
B
C (DS Trans)
E (Culvert)
F (US Trans)
H
A
B
C (DS Trans)
E (Culvert)
F (US Trans)
H
A
B
C (DS Trans)
E (Culvert)
F (US Trans)
H
Top width (ft)
02468
AB
C (
ds tr
ans)
E (
culv
) F (
us tr
ans)
HA
B
C (
ds tr
ans)
E (
culv
) F (
us tr
ans)
HA
B
C (
ds tr
ans)
E (
culv
) F (
us tr
ans)
HA
B
C (
ds tr
ans)
E (
culv
) F (
us tr
ans)
HA
B
C (
ds tr
ans)
E (
culv
) F (
us tr
ans)
H
25%
Q2
Qbf
1050
100
Max
imum
Dep
th (f
t)
8.4
-11
A
B
C (DS Trans)
E (Culvert)
F (US Trans)
H
A
B
C (DS Trans)
E (Culvert)
F (US Trans)
H
A
B
C (DS Trans)
E (Culvert)
F (US Trans)
H
A
B
C (DS Trans)
E (Culvert)
F (US Trans)
H
A
B
C (DS Trans)
E (Culvert)
F (US Trans)
H
Maximum depth (ft)
A—346
Culvert Scour Assessment
Lowe Creek
Fig
ure
17—
Wid
th-t
o-de
pth
ratio
.
Fig
ure
18—
Vel
ocity
(ch
anne
l).
020406080
AB
C (
ds tr
ans)
E (
culv
) F (
us tr
ans)
HA
B
C (
ds tr
ans)
E (
culv
) F (
us tr
ans)
HA
B
C (
ds tr
ans)
E (
culv
) F (
us tr
ans)
HA
B
C (
ds tr
ans)
E (
culv
) F (
us tr
ans)
HA
B
C (
ds tr
ans)
E (
culv
) F (
us tr
ans)
H
25%
Q2
Qbf
1050
100
Wid
th-t
o-de
pth
Rat
io
02468
AB
C (
ds tr
ans)
E (
culv
) F (
us tr
ans)
HA
B
C (
ds tr
ans)
E (
culv
) F (
us tr
ans)
HA
B
C (
ds tr
ans)
E (
culv
) F (
us tr
ans)
HA
B
C (
ds tr
ans)
E (
culv
) F (
us tr
ans)
HA
B
C (
ds tr
ans)
E (
culv
) F (
us tr
ans)
H
25%
Q2
Qbf
1050
100
Velo
city
(ft/
sec)
A
B
C (DS Trans)
E (Culvert)
F (US Trans)
H
A
B
C (DS Trans)
E (Culvert)
F (US Trans)
H
A
B
C (DS Trans)
E (Culvert)
F (US Trans)
H
A
B
C (DS Trans)
E (Culvert)
F (US Trans)
H
A
B
C (DS Trans)
E (Culvert)
F (US Trans)
H
Width-to-depth ratio
A
B
C (DS Trans)
E (Culvert)
F (US Trans)
H
A
B
C (DS Trans)
E (Culvert)
F (US Trans)
H
A
B
C (DS Trans)
E (Culvert)
F (US Trans)
H
A
B
C (DS Trans)
E (Culvert)
F (US Trans)
H
A
B
C (DS Trans)
E (Culvert)
F (US Trans)
H
Velocity (ft/sec)

A—347
Site evaluations
Lowe Creek
Fig
ure
19—
She
ar s
tres
s (c
hann
el).
Fig
ure
20—
Exc
ess
shea
r st
ress
.
05101520
AB
C (
ds tr
ans)
E (
culv
) F (
us tr
ans)
HA
B
C (
ds tr
ans)
E (
culv
) F (
us tr
ans)
HA
B
C (
ds tr
ans)
E (
culv
) F (
us tr
ans)
HA
B
C (
ds tr
ans)
E (
culv
) F (
us tr
ans)
HA
B
C (
ds tr
ans)
E (
culv
) F (
us tr
ans)
H
25%
Q2
Qbf
1050
100
Shea
r Str
ess
(lbs/
ft2)
Exc
ess
shea
r st
ress
is th
e ch
anne
l she
ar d
ivid
ed b
y th
e cr
itica
l she
ar fo
r be
d en
trai
nmen
t of t
he D
84 p
artic
le
size
. Val
ues
of e
xces
s sh
ear
grea
ter
than
1 in
dica
te b
ed m
ovem
ent f
or th
e D
84 p
artic
le s
ize.
01234
010
020
030
040
050
060
0
Dis
char
ge
(cfs
)
Exce
ss S
hear
(Ap
plie
d /
tcrit
)
US
Ch
an
ne
l (D
S p
eb
ble
co
un
t) -
ste
p
Cu
lve
rt (
DS
pe
bb
le c
ou
nt)
- r
iffle
DS
Ch
an
ne
l (D
S p
eb
ble
co
un
t) -
riff
le
A
B
C (DS Trans)
E (Culvert)
F (US Trans)
H
A
B
C (DS Trans)
E (Culvert)
F (US Trans)
H
A
B
C (DS Trans)
E (Culvert)
F (US Trans)
H
A
B
C (DS Trans)
E (Culvert)
F (US Trans)
H
A
B
C (DS Trans)
E (Culvert)
F (US Trans)
H
Shear stress (lbs/ft2) Excess shear (Applied/tcrit)

A—348
Culvert Scour Assessment
Lowe Creek
Table 3—Sum of squared height difference
reach XS unit Sum of squared Within range of Location type height difference channel conditions?
Culvert US Pool 0.06 Yes
DS Riffle 0.03 Yes
Upstream US Pool 0.05
DS Step 0.10
Downstream US Pool 0.04
DS Riffle 0.03
Table 4—Vertical sinuosity
Segment Location vertical Sinuosity (ft/ft)
A DS channel 1.001
B DS channel 1.009
C DS transition 1.007
D Culvert 1.000
E Culvert 1.010
F US transition 1.002
G US channel 1.016
H US channel 1.007
Table 5—Depth distribution
reach XS 25% Q2 Within range of
Location channel conditions?
Culvert US 1 No
DS 2 Yes
Upstream US 2
DS 2
Downstream US 3
DS 18
A—349
Site evaluations
Lowe Creek
Table 6—Habitat unit composition
Percent of surface area
Reach Pool Glide Riffle Step
Culvert 21% 0% 64% 3%
Upstream Channel 48% 0% 41% 11%
Downstream Channel 16% 0% 75% 2%
Figure 21—Residual depths.
Table 7—Bed material sorting and skewness
reach XS unit Sorting Within range Skewness Within range Location Type of channel of channel conditions? conditions?
Culvert US Pool 1.50 Yes 0.13 Yes
DS Riffle 1.47 Yes 0.26 Yes
Upstream US Pool 1.59 0.12
DS Step 1.25 0.14
Downstream US Pool 1.55 0.31
DS Riffle 2.34 0.37
0.0
0.2
0.4
0.6
0.8
1.0
1.2
1.4
Segment A Segment B
Segment C: DSTransition Segment D:
CulvertSegment E:
Culvert
Segment F: USTransition
Segment G Segment H
Residual depth (ft)
Seg
men
t A
Seg
men
t B
Seg
men
t C
DS
Tra
nsiti
on
Seg
men
t D
Cul
vert
Seg
men
t E
Cul
vert
Seg
men
t F
US
Tra
nsiti
on
Seg
men
t G
Seg
men
t H
Res
idua
l Dep
th (
ft)

A—350
Culvert Scour Assessment
Lowe Creek
Table 8—Large woody debris
reach Pieces/Channel Width
Culvert 0.34
` Upstream 3.43
Downstream 4.22
Terminology:
US = Upstream
DS = Downstream
RR = Reference reach
XS = Cross section

A—351
Site evaluations
Lowe Creek
View upstream through culvert. View downstream through culvert.
View downstream of culvert inlet. View of undercut left bank footing at upstream end of culvert.
Downstream reference reach. Upstream reference reach.
A—352
Culvert Scour Assessment
Lowe Creek
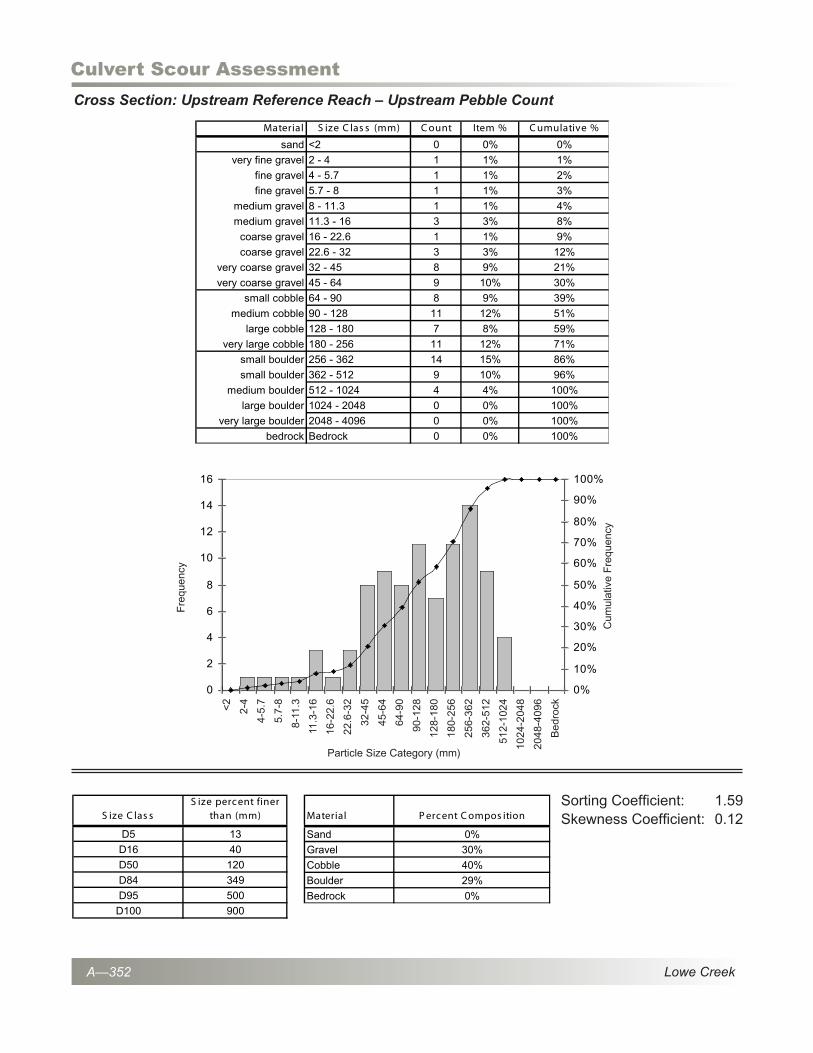
Cross Section: Upstream Reference Reach – Upstream Pebble Count
Sorting Coefficient: 1.59Skewness Coefficient: 0.12
Material S ize C las s (mm) C ount Item % C umulative %
sand <2 0 0% 0%
very fine gravel 2 - 4 1 1% 1%
fine gravel 4 - 5.7 1 1% 2%
fine gravel 5.7 - 8 1 1% 3%
medium gravel 8 - 11.3 1 1% 4%
medium gravel 11.3 - 16 3 3% 8%
coarse gravel 16 - 22.6 1 1% 9%
coarse gravel 22.6 - 32 3 3% 12%
very coarse gravel 32 - 45 8 9% 21%
very coarse gravel 45 - 64 9 10% 30%
small cobble 64 - 90 8 9% 39%
medium cobble 90 - 128 11 12% 51%
large cobble 128 - 180 7 8% 59%
very large cobble 180 - 256 11 12% 71%
small boulder 256 - 362 14 15% 86%
small boulder 362 - 512 9 10% 96%
medium boulder 512 - 1024 4 4% 100%
large boulder 1024 - 2048 0 0% 100%
very large boulder 2048 - 4096 0 0% 100%
bedrock Bedrock 0 0% 100%
0
2
4
6
8
10
12
14
16
<22 - 4
4 - 5.75.7 - 88 - 11.3
11.3 - 1616 - 22.622.6 - 3232 - 4545 - 6464 - 90
90 - 128128 - 180180 - 256256 - 362362 - 512
512 - 10241024 - 20482048 - 4096
Bedrock
Partic le Size Category (mm)
Frequency
0%
10%
20%
30%
40%
50%
60%
70%
80%
90%
100%
Cumulative Frequency
<2
2-4
4-5
.7
5.7
-8
8-1
1.3
11.3
-16
16-2
2.6
22.6
-32
32-4
5
45-6
4
64-9
0
90-1
28
128-1
80
180-2
56
256-3
62
362-5
12
512-1
024
1024-2
048
2048-4
096
Bedro
ck
Fre
quen
cy
Cum
ulat
ive
Fre
quen
cy
Particle Size Category (mm)
S ize C las sS ize perc ent finer
than (mm)
D5 13
D16 40
D50 120
D84 349
D95 500
D100 900
Material P erc ent C ompos ition
Sand 0%
Gravel 30%
Cobble 40%
Boulder 29%
Bedrock 0%
A—353
Site evaluations
Lowe Creek
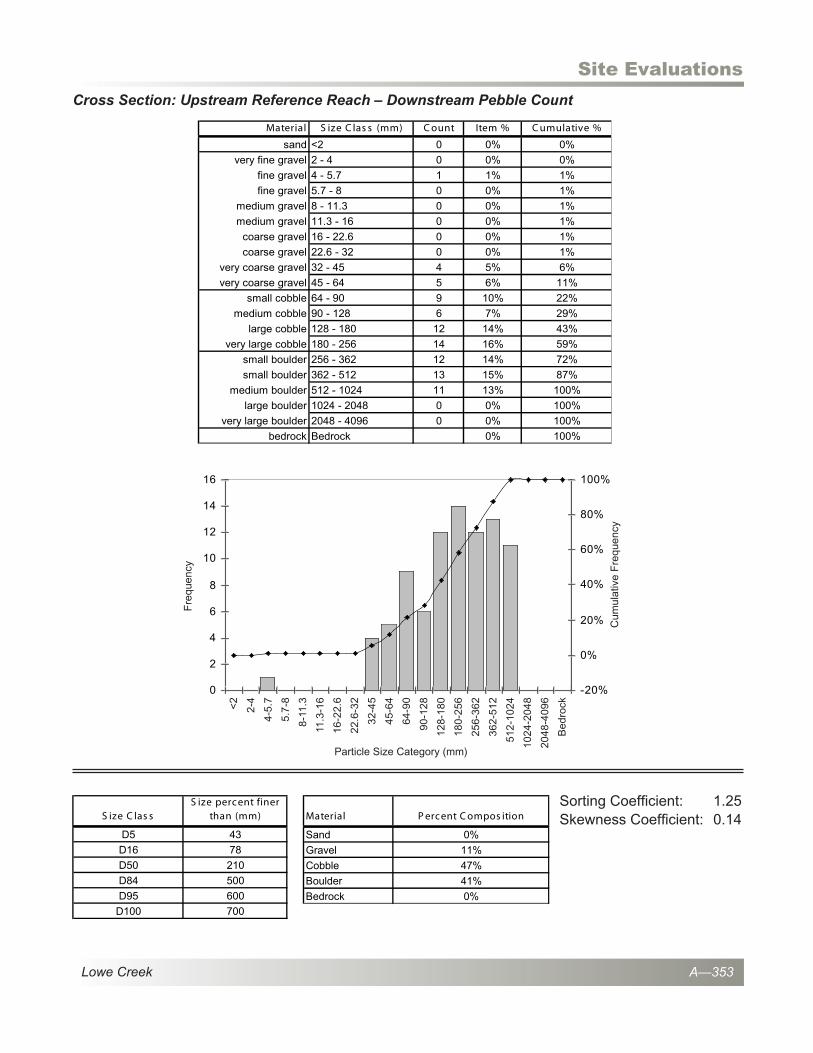
Cross Section: Upstream Reference Reach – Downstream Pebble Count
Sorting Coefficient: 1.25Skewness Coefficient: 0.14
Material S ize C las s (mm) C ount Item % C umulative %
sand <2 0 0% 0%
very fine gravel 2 - 4 0 0% 0%
fine gravel 4 - 5.7 1 1% 1%
fine gravel 5.7 - 8 0 0% 1%
medium gravel 8 - 11.3 0 0% 1%
medium gravel 11.3 - 16 0 0% 1%
coarse gravel 16 - 22.6 0 0% 1%
coarse gravel 22.6 - 32 0 0% 1%
very coarse gravel 32 - 45 4 5% 6%
very coarse gravel 45 - 64 5 6% 11%
small cobble 64 - 90 9 10% 22%
medium cobble 90 - 128 6 7% 29%
large cobble 128 - 180 12 14% 43%
very large cobble 180 - 256 14 16% 59%
small boulder 256 - 362 12 14% 72%
small boulder 362 - 512 13 15% 87%
medium boulder 512 - 1024 11 13% 100%
large boulder 1024 - 2048 0 0% 100%
very large boulder 2048 - 4096 0 0% 100%
bedrock Bedrock 0% 100%
0
2
4
6
8
10
12
14
16
<22 - 4
4 - 5.75.7 - 88 - 11.3
11.3 - 1616 - 22.622.6 - 3232 - 4545 - 6464 - 90
90 - 128128 - 180180 - 256256 - 362362 - 512
512 - 10241024 - 20482048 - 4096
Bedrock
Partic le Size Category (mm)
Frequency
-20%
0%
20%
40%
60%
80%
100%
Cumulative Frequency
<2
2-4
4-5
.7
5.7
-8
8-1
1.3
11.3
-16
16-2
2.6
22.6
-32
32-4
5
45-6
4
64-9
0
90-1
28
128-1
80
180-2
56
256-3
62
362-5
12
512-1
024
1024-2
048
2048-4
096
Bedro
ck
Fre
quen
cy
Cum
ulat
ive
Fre
quen
cy
Particle Size Category (mm)
S ize C las sS ize perc ent finer
than (mm)
D5 43
D16 78
D50 210
D84 500
D95 600
D100 700
Material P erc ent C ompos ition
Sand 0%
Gravel 11%
Cobble 47%
Boulder 41%
Bedrock 0%
A—354
Culvert Scour Assessment
Lowe Creek
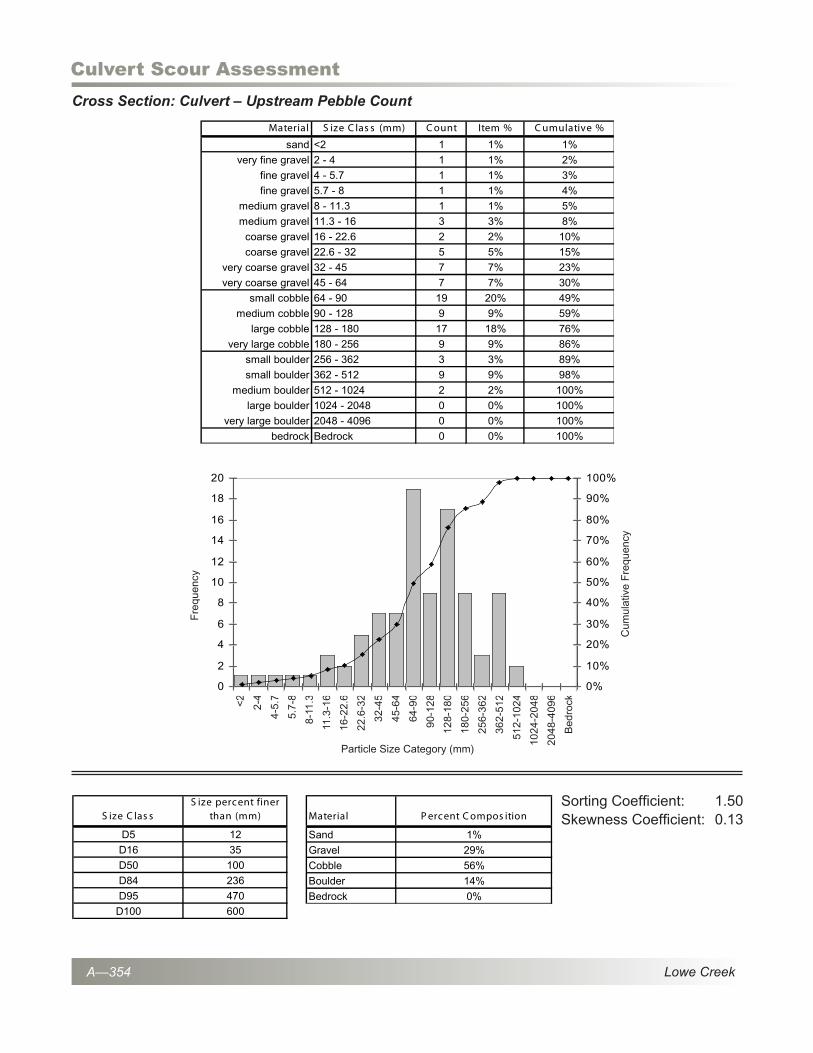
Cross Section: Culvert – Upstream Pebble Count
Sorting Coefficient: 1.50Skewness Coefficient: 0.13
<2
2-4
4-5
.7
5.7
-8
8-1
1.3
11.3
-16
16-2
2.6
22.6
-32
32
-45
45
-64
64
-90
90-1
28
128-1
80
180-2
56
256-3
62
362-5
12
512-1
024
1024-2
048
2048-4
096
Bedro
ck
Fre
quen
cy
Cum
ulat
ive
Fre
quen
cy
Particle Size Category (mm)
Material S ize C las s (mm) C ount Item % C umulative %
sand <2 1 1% 1%
very fine gravel 2 - 4 1 1% 2%
fine gravel 4 - 5.7 1 1% 3%
fine gravel 5.7 - 8 1 1% 4%
medium gravel 8 - 11.3 1 1% 5%
medium gravel 11.3 - 16 3 3% 8%
coarse gravel 16 - 22.6 2 2% 10%
coarse gravel 22.6 - 32 5 5% 15%
very coarse gravel 32 - 45 7 7% 23%
very coarse gravel 45 - 64 7 7% 30%
small cobble 64 - 90 19 20% 49%
medium cobble 90 - 128 9 9% 59%
large cobble 128 - 180 17 18% 76%
very large cobble 180 - 256 9 9% 86%
small boulder 256 - 362 3 3% 89%
small boulder 362 - 512 9 9% 98%
medium boulder 512 - 1024 2 2% 100%
large boulder 1024 - 2048 0 0% 100%
very large boulder 2048 - 4096 0 0% 100%
bedrock Bedrock 0 0% 100%
0
2
4
6
8
10
12
14
16
18
20
<22 - 4
4 - 5.75.7 - 88 - 11.3
11.3 - 1616 - 22.622.6 - 3232 - 4545 - 6464 - 90
90 - 128128 - 180180 - 256256 - 362362 - 512
512 - 10241024 - 20482048 - 4096
Bedrock
Partic le Size Category (mm)
Frequency
0%
10%
20%
30%
40%
50%
60%
70%
80%
90%
100%
Cumulative Frequency
S ize C las sS ize perc ent finer
than (mm)
D5 12
D16 35
D50 100
D84 236
D95 470
D100 600
Material P erc ent C ompos ition
Sand 1%
Gravel 29%
Cobble 56%
Boulder 14%
Bedrock 0%

A—355
Site evaluations
Lowe Creek
Cross Section: Culvert – Downstream Pebble Count
Sorting Coefficient: 1.47Skewness Coefficient: 0.26
Material S ize C las s (mm) C ount Item % C umulative %
sand <2 1 1% 1%
very fine gravel 2 - 4 1 1% 2%
fine gravel 4 - 5.7 0 0% 2%
fine gravel 5.7 - 8 0 0% 2%
medium gravel 8 - 11.3 1 1% 3%
medium gravel 11.3 - 16 2 2% 5%
coarse gravel 16 - 22.6 3 3% 9%
coarse gravel 22.6 - 32 2 2% 11%
very coarse gravel 32 - 45 5 5% 16%
very coarse gravel 45 - 64 7 7% 23%
small cobble 64 - 90 7 7% 31%
medium cobble 90 - 128 4 4% 35%
large cobble 128 - 180 16 17% 52%
very large cobble 180 - 256 13 14% 66%
small boulder 256 - 362 14 15% 81%
small boulder 362 - 512 14 15% 96%
medium boulder 512 - 1024 4 4% 100%
large boulder 1024 - 2048 0 0% 100%
very large boulder 2048 - 4096 0 0% 100%
bedrock Bedrock 0 0% 100%
0
2
4
6
8
10
12
14
16
18
<22 - 4
4 - 5.75.7 - 88 - 11.3
11.3 - 1616 - 22.622.6 - 3232 - 4545 - 6464 - 90
90 - 128128 - 180180 - 256256 - 362362 - 512
512 - 10241024 - 20482048 - 4096
Bedrock
Partic le Size Category (mm)
Frequency
0%
10%
20%
30%
40%
50%
60%
70%
80%
90%
100%
Cumulative Frequency
<2
2-4
4-5
.7
5.7
-8
8-1
1.3
11.3
-16
16-2
2.6
22.6
-32
32-4
5
45-6
4
64-9
0
90-1
28
128-1
80
180-2
56
256-3
62
362-5
12
512-1
024
1024-2
048
2048-4
096
Bedro
ck
Fre
quen
cy
Cum
ulat
ive
Fre
quen
cy
Particle Size Category (mm)
S ize C las sS ize perc ent finer
than (mm)
D5 18
D16 49
D50 165
D84 382
D95 504
D100 950
Material P erc ent C ompos ition
Sand 1%
Gravel 22%
Cobble 43%
Boulder 34%
Bedrock 0%
A—356
Culvert Scour Assessment
Lowe Creek
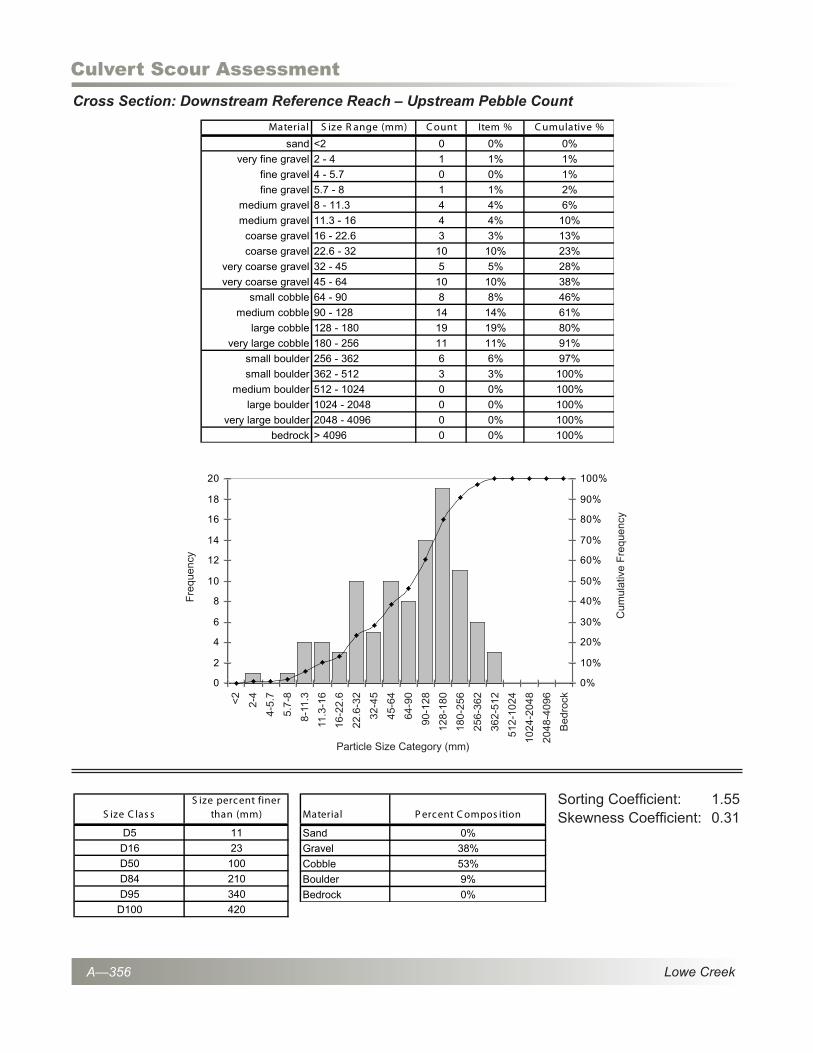
Cross Section: Downstream Reference Reach – Upstream Pebble Count
Sorting Coefficient: 1.55Skewness Coefficient: 0.31
Material S ize R ange (mm) C ount Item % C umulative %
sand <2 0 0% 0%
very fine gravel 2 - 4 1 1% 1%
fine gravel 4 - 5.7 0 0% 1%
fine gravel 5.7 - 8 1 1% 2%
medium gravel 8 - 11.3 4 4% 6%
medium gravel 11.3 - 16 4 4% 10%
coarse gravel 16 - 22.6 3 3% 13%
coarse gravel 22.6 - 32 10 10% 23%
very coarse gravel 32 - 45 5 5% 28%
very coarse gravel 45 - 64 10 10% 38%
small cobble 64 - 90 8 8% 46%
medium cobble 90 - 128 14 14% 61%
large cobble 128 - 180 19 19% 80%
very large cobble 180 - 256 11 11% 91%
small boulder 256 - 362 6 6% 97%
small boulder 362 - 512 3 3% 100%
medium boulder 512 - 1024 0 0% 100%
large boulder 1024 - 2048 0 0% 100%
very large boulder 2048 - 4096 0 0% 100%
bedrock > 4096 0 0% 100%
S ize C las sS ize perc ent finer
than (mm)
D5 11
D16 23
D50 100
D84 210
D95 340
D100 420
0
2
4
6
8
10
12
14
16
18
20
<22 - 4
4 - 5.75.7 - 88 - 11.3
11.3 - 1616 - 22.622.6 - 3232 - 4545 - 6464 - 90
90 - 128128 - 180180 - 256256 - 362362 - 512
512 - 10241024 - 20482048 - 4096
> 4096
Partic le Size Category (mm)
Frequency
0%
10%
20%
30%
40%
50%
60%
70%
80%
90%
100%
Cumulative Frequency
<2
2-4
4-5
.7
5.7
-8
8-1
1.3
11.3
-16
16-2
2.6
22.6
-32
32-4
5
45-6
4
64-9
0
90-1
28
128-1
80
180-2
56
256-3
62
362-5
12
512-1
024
1024-2
048
2048-4
096
Bed
rock
Fre
quen
cy
Cum
ulat
ive
Fre
quen
cy
Particle Size Category (mm)
Material P erc ent C ompos ition
Sand 0%
Gravel 38%
Cobble 53%
Boulder 9%
Bedrock 0%

A—357
Site evaluations
Lowe Creek
Cross Section: Downstream Reference Reach – Downstream Pebble Count
Sorting Coefficient: 2.34Skewness Coefficient: 0.37
Material S ize C las s (mm) C ount Item % C umulative %
sand <2 8 8% 8%
very fine gravel 2 - 4 1 1% 9%
fine gravel 4 - 5.7 0 0% 9%
fine gravel 5.7 - 8 3 3% 12%
medium gravel 8 - 11.3 0 0% 12%
medium gravel 11.3 - 16 2 2% 14%
coarse gravel 16 - 22.6 8 8% 22%
coarse gravel 22.6 - 32 9 9% 31%
very coarse gravel 32 - 45 5 5% 36%
very coarse gravel 45 - 64 9 9% 45%
small cobble 64 - 90 3 3% 48%
medium cobble 90 - 128 13 13% 61%
large cobble 128 - 180 9 9% 70%
very large cobble 180 - 256 8 8% 78%
small boulder 256 - 362 12 12% 90%
small boulder 362 - 512 7 7% 97%
medium boulder 512 - 1024 3 3% 100%
large boulder 1024 - 2048 0 0% 100%
very large boulder 2048 - 4096 0 0% 100%
bedrock Bedrock 0 0% 100%
0
2
4
6
8
10
12
14
<22 - 4
4 - 5.75.7 - 88 - 11.3
11.3 - 1616 - 22.622.6 - 3232 - 4545 - 6464 - 90
90 - 128128 - 180180 - 256256 - 362362 - 512
512 - 10241024 - 20482048 - 4096
Bedrock
Partic le Size Category (mm)
Frequency
0%
10%
20%
30%
40%
50%
60%
70%
80%
90%
100%
Cumulative Frequency
<2
2-4
4-5
.7
5.7
-8
8-1
1.3
11.3
-16
16-2
2.6
22.6
-32
32-4
5
45-6
4
64-9
0
90-1
28
128-1
80
180-2
56
256-3
62
362-5
12
512-1
024
1024-2
048
2048-4
096
Bedro
ck
Fre
quen
cy
Cum
ulat
ive
Fre
quen
cy
Particle Size Category (mm)
S ize C las sS ize perc ent finer
than (mm)
D5 1
D16 18
D50 100
D84 300
D95 430
D100 750
Material P erc ent C ompos ition
Sand 8%
Gravel 37%
Cobble 33%
Boulder 22%
Bedrock 0%