culture for development indicators - unesco · the culture for development indicators has been...
TRANSCRIPT
UNESCOCULTURE FOR DEVELOPMENT
INDICATORS Methodology Manual
United NationsEducational, Scientific and
Cultural Organization
Diversity ofCultural Expressions
Published in 2014 by the United Nations Educational, Scientific and Cultural Organization 7, place de Fontenoy, 75352 Paris 07 SP, France
© UNESCO 2014
ISBN 978-92-3-001227-4
This publication is available in Open Access under the Attribution-ShareAlike 3.0 IGO (CC-BY-SA 3.0 IGO) license (http://creativecommons.org/licenses/by-sa/3.0/igo/). By using the content of this publication, the users accept to be bound by the terms of use of the UNESCO Open Access Repository (www.unesco.org/open-access/terms-use-ccbysa-en).
The designations employed and the presentation of material throughout this publication do not imply the expression of any opinion whatsoever on the part of UNESCO concerning the legal status of any country, territory, city or area or of its authorities, or concerning the delimitation of its frontiers or boundaries.
The ideas and opinions expressed in this publication are those of the authors; they are not necessarily those of UNESCO and do not commit the Organization.
Cover and Graphic design: MH DesignIllustrations and Typeset: MH Design
Coordination and Project Management: Guiomar Alonso and Melika MediciWriting and Editing: Guiomar Alonso and Melika Medici with assistance from Keiko Nowacka, Guillaume Cohen and Molly SteinlageFunded by: AECIDTypeset: MH DesignPrinted by: UNESCOPrinted in France
The UNESCO Culture for Development Indicators: Methodology Manual has benefited from technical papers and contributions from the following experts: Lorna and George Abungu, Yvonne Donders, Simon Ellis, Omar Lopez, Christopher Madden, Adolfo Morrone, Andrew Puddephatt, David Throsby, and Alan Wagner.
The UNESCO Culture for Development Indicators: Methodology Manual can be downloaded at:www.unesco.org/creativity/cdis
United NationsEducational, Scientific and
Cultural Organization
Diversity ofCultural Expressions
METHODOLOGY MANUAL
TABLE OF CONTENTS
Foreword . . . . . . . . . . . . . . . . . . . . . . . . . . . . . . . . . . . . . . . . . . . . . . . . . . . . . . . . . . . . . . . . . . . . . . . . . . . . . . . . . . . . . . . . . . . 3
Introduction. . . . . . . . . . . . . . . . . . . . . . . . . . . . . . . . . . . . . . . . . . . . . . . . . . . . . . . . . . . . . . . . . . . . . . . . . . . . . . . . . . . . . . . . . 5
Acknowledgments . . . . . . . . . . . . . . . . . . . . . . . . . . . . . . . . . . . . . . . . . . . . . . . . . . . . . . . . . . . . . . . . . . . . . . . . . . . . . . . . . . . .7
OVERVIEW . . . . . . . . . . . . . . . . . . . . . . . . . . . . . . . . . . . . . . . . . . . . . . . . . . . . . . . . . . . . . . . . . . . . . . . . . . . . . . . . . . . . . . 9
ECONOMY DIMENSION . . . . . . . . . . . . . . . . . . . . . . . . . . . . . . . . . . . . . . . . . . . . . . . . . . . . . . . . . . . . . . . . 19I. RELEVANCE OF THE DIMENSION FOR CULTURE AND DEVELOPMENT. . . . . . . . . . . . . . . . . . . . . . . . . . . . . . . . 20
II. DEFINITIONS . . . . . . . . . . . . . . . . . . . . . . . . . . . . . . . . . . . . . . . . . . . . . . . . . . . . . . . . . . . . . . . . . . . . . . . . . . . . . . . . . 21
III. DATA SOURCES . . . . . . . . . . . . . . . . . . . . . . . . . . . . . . . . . . . . . . . . . . . . . . . . . . . . . . . . . . . . . . . . . . . . . . . . . . . . . . . 22
IV. STEP-BY-STEP APPROACH TO IDENTIFY CULTURE IN NATIONAL ACTIVITY, OCCUPATION AND
CONSUMPTION CLASSIFICATIONS . . . . . . . . . . . . . . . . . . . . . . . . . . . . . . . . . . . . . . . . . . . . . . . . . . . . . . . . . . . . . . . 23
V. CORE INDICATORS . . . . . . . . . . . . . . . . . . . . . . . . . . . . . . . . . . . . . . . . . . . . . . . . . . . . . . . . . . . . . . . . . . . . . . . . . . . . . 24
1 . Contribution of cultural activities to GDP . . . . . . . . . . . . . . . . . . . . . . . . . . . . . . . . . . . . . . . . . . . . . . . . . . . . . .24
2 . Cultural employment . . . . . . . . . . . . . . . . . . . . . . . . . . . . . . . . . . . . . . . . . . . . . . . . . . . . . . . . . . . . . . . . . . . . .28
3 . Household expenditures on culture . . . . . . . . . . . . . . . . . . . . . . . . . . . . . . . . . . . . . . . . . . . . . . . . . . . . . . . . . .31
APPENDIX I TO VI . . . . . . . . . . . . . . . . . . . . . . . . . . . . . . . . . . . . . . . . . . . . . . . . . . . . . . . . . . . . . . . . . . . . . . . . . . . . . . 35
EDUCATION DIMENSION . . . . . . . . . . . . . . . . . . . . . . . . . . . . . . . . . . . . . . . . . . . . . . . . . . . . . . . . . . . . . . . 45I. RELEVANCE OF THE DIMENSION FOR CULTURE AND DEVELOPMENT . . . . . . . . . . . . . . . . . . . . . . . . . . . . . . . . 46
II. CORE INDICATORS . . . . . . . . . . . . . . . . . . . . . . . . . . . . . . . . . . . . . . . . . . . . . . . . . . . . . . . . . . . . . . . . . . . . . . . . . . . . . 47
1 . Inclusive education . . . . . . . . . . . . . . . . . . . . . . . . . . . . . . . . . . . . . . . . . . . . . . . . . . . . . . . . . . . . . . . . . . . . . . .47
2 . Multilingual education . . . . . . . . . . . . . . . . . . . . . . . . . . . . . . . . . . . . . . . . . . . . . . . . . . . . . . . . . . . . . . . . . . . .49
3 . Arts education . . . . . . . . . . . . . . . . . . . . . . . . . . . . . . . . . . . . . . . . . . . . . . . . . . . . . . . . . . . . . . . . . . . . . . . . . .53
4 . Professional training in the culture sector . . . . . . . . . . . . . . . . . . . . . . . . . . . . . . . . . . . . . . . . . . . . . . . . . . . . .56
GOVERNANCE DIMENSION . . . . . . . . . . . . . . . . . . . . . . . . . . . . . . . . . . . . . . . . . . . . . . . . . . . . . . . . . . . . 61I. RELEVANCE OF THE DIMENSION FOR CULTURE AND DEVELOPMENT . . . . . . . . . . . . . . . . . . . . . . . . . . . . . . . . .62
II. DATA SOURCES . . . . . . . . . . . . . . . . . . . . . . . . . . . . . . . . . . . . . . . . . . . . . . . . . . . . . . . . . . . . . . . . . . . . . . . . . . . . . . . .62
III. CORE INDICATORS . . . . . . . . . . . . . . . . . . . . . . . . . . . . . . . . . . . . . . . . . . . . . . . . . . . . . . . . . . . . . . . . . . . . . . . . . . . . .63
1 . Standard setting framework for culture . . . . . . . . . . . . . . . . . . . . . . . . . . . . . . . . . . . . . . . . . . . . . . . . . . . . . . .63
2 . Policy and institutional framework for culture . . . . . . . . . . . . . . . . . . . . . . . . . . . . . . . . . . . . . . . . . . . . . . . . . .67
3 . Distribution of cultural infrastructures . . . . . . . . . . . . . . . . . . . . . . . . . . . . . . . . . . . . . . . . . . . . . . . . . . . . . . .70
4 . Civil society participation in cultural governance . . . . . . . . . . . . . . . . . . . . . . . . . . . . . . . . . . . . . . . . . . . . . . . .74
UNESCO CULTURE FOR DEVELOPMENT INDICATORS
SOCIAL PARTICIPATION DIMENSION . . . . . . . . . . . . . . . . . . . . . . . . . . . . . . . . . . . . . . . . . . . . . . . . . . . . 81I. RELEVANCE OF THE DIMENSION FOR CULTURE AND DEVELOPMENT . . . . . . . . . . . . . . . . . . . . . . . . . . . . . . . . .82
II. DATA SOURCES . . . . . . . . . . . . . . . . . . . . . . . . . . . . . . . . . . . . . . . . . . . . . . . . . . . . . . . . . . . . . . . . . . . . . . . . . . . . . . . .82
III. CORE INDICATORS . . . . . . . . . . . . . . . . . . . . . . . . . . . . . . . . . . . . . . . . . . . . . . . . . . . . . . . . . . . . . . . . . . . . . . . . . . . . . .83
1 . Participation in going-out cultural activities . . . . . . . . . . . . . . . . . . . . . . . . . . . . . . . . . . . . . . . . . . . . . . . . . . . .83
2 . Participation in identity-building cultural activities . . . . . . . . . . . . . . . . . . . . . . . . . . . . . . . . . . . . . . . . . . . . . .83
3 . Tolerance of other cultures . . . . . . . . . . . . . . . . . . . . . . . . . . . . . . . . . . . . . . . . . . . . . . . . . . . . . . . . . . . . . . . .88
4 . Interpersonal trust . . . . . . . . . . . . . . . . . . . . . . . . . . . . . . . . . . . . . . . . . . . . . . . . . . . . . . . . . . . . . . . . . . . . . . .90
5 . Freedom of self-determination . . . . . . . . . . . . . . . . . . . . . . . . . . . . . . . . . . . . . . . . . . . . . . . . . . . . . . . . . . . . .92
APPENDIX I TO II . . . . . . . . . . . . . . . . . . . . . . . . . . . . . . . . . . . . . . . . . . . . . . . . . . . . . . . . . . . . . . . . . . . . . . . . . . . . . . . . . . . . .97
GENDER EQUALITY DIMENSION . . . . . . . . . . . . . . . . . . . . . . . . . . . . . . . . . . . . . . . . . . . . . . . . . . . . . . .101I. RELEVANCE OF THE DIMENSION FOR CULTURE AND DEVELOPMENT . . . . . . . . . . . . . . . . . . . . . . . . . . . . . . . 102
II. DEFINITIONS . . . . . . . . . . . . . . . . . . . . . . . . . . . . . . . . . . . . . . . . . . . . . . . . . . . . . . . . . . . . . . . . . . . . . . . . . . . . . . . . . 103
III. CORE INDICATORS . . . . . . . . . . . . . . . . . . . . . . . . . . . . . . . . . . . . . . . . . . . . . . . . . . . . . . . . . . . . . . . . . . . . . . . . . . . . 104
1 . Gender equality objective outputs . . . . . . . . . . . . . . . . . . . . . . . . . . . . . . . . . . . . . . . . . . . . . . . . . . . . . . . . . .104
2 . Perception of gender equality . . . . . . . . . . . . . . . . . . . . . . . . . . . . . . . . . . . . . . . . . . . . . . . . . . . . . . . . . . . . .109
COMMUNICATION DIMENSION . . . . . . . . . . . . . . . . . . . . . . . . . . . . . . . . . . . . . . . . . . . . . . . . . . . . . . . . .115I. RELEVANCE OF THE DIMENSION FOR CULTURE AND DEVELOPMENT . . . . . . . . . . . . . . . . . . . . . . . . . . . . . . . 116
II. CORE INDICATORS . . . . . . . . . . . . . . . . . . . . . . . . . . . . . . . . . . . . . . . . . . . . . . . . . . . . . . . . . . . . . . . . . . . . . . . . . . . . 117 1 . Freedom of expression . . . . . . . . . . . . . . . . . . . . . . . . . . . . . . . . . . . . . . . . . . . . . . . . . . . . . . . . . . . . . . . . . .117 2 . Access and internet use . . . . . . . . . . . . . . . . . . . . . . . . . . . . . . . . . . . . . . . . . . . . . . . . . . . . . . . . . . . . . . . . .119 3 . Diversity of fictional content on public television . . . . . . . . . . . . . . . . . . . . . . . . . . . . . . . . . . . . . . . . . . . . . .122
APPENDIX I . . . . . . . . . . . . . . . . . . . . . . . . . . . . . . . . . . . . . . . . . . . . . . . . . . . . . . . . . . . . . . . . . . . . . . . . . . . . . . . . . . . . . . . 125
HERITAGE DIMENSION . . . . . . . . . . . . . . . . . . . . . . . . . . . . . . . . . . . . . . . . . . . . . . . . . . . . . . . . . . . . . . .129I. RELEVANCE OF THE DIMENSION FOR CULTURE AND DEVELOPMENT . . . . . . . . . . . . . . . . . . . . . . . . . . . . . . . 130
II. CORE INDICATOR . . . . . . . . . . . . . . . . . . . . . . . . . . . . . . . . . . . . . . . . . . . . . . . . . . . . . . . . . . . . . . . . . . . . . . . . . . . . . 131
1 . Heritage sustainability . . . . . . . . . . . . . . . . . . . . . . . . . . . . . . . . . . . . . . . . . . . . . . . . . . . . . . . . . . . . . . . . . . .131
TECHNICAL NOTE . . . . . . . . . . . . . . . . . . . . . . . . . . . . . . . . . . . . . . . . . . . . . . . . . . . . . . . . . . . . . . . . . . . . . . . . . . . . .139
METHODOLOGY MANUAL • 3
FOREWORD
As the international community shapes a new global agenda to follow 2015, we must ensure that the transformative power of culture is recognized as a driver and enabler of sustainable development.
This is UNESCO’s commitment, and the Organization is working at the global and national levels to broaden the debate about sustainable development and to document culture’s contribution to providing core economic and non-economic benefits. We need concrete evidence and data to make our case convincingly. This is why the UNESCO Culture for Development Indicators (CDIS) are so important.
Developed by UNESCO, with the support of the Government of Spain, these Indicators represent both a research and advocacy initiative.
In terms of research, the Indicators embody an innovative methodology that demonstrates culture’s multidimensional role in national development processes through facts and figures, by unveiling challenges and by highlighting opportunities for the future. As an advocacy initiative, the CDIS implementation tools provide guidance for maximum policy impact through culture’s integration into development strategies. In these ways, the Indicators contribute to implementing UNESCO’s 2005 Convention on the Protection and Promotion of the Diversity of Cultural Expressions – the first international legally-binding instrument to put culture and sustainable development at its core.
The Culture for Development Indicators has been implemented in 11 countries worldwide during two test phases. This has ensured verification of the pertinence and feasibility of the indicators, and it has generated unique data, while producing concrete impacts. I am pleased that participative implementation processes helped to build capacity in the area of cultural statistics. Implementation has also improved inter-institutional dialogue, and the use of innovative facts for more informed policies, development strategies and monitoring systems.
I wish to thank all partners who joined with UNESCO to create, test and validate this highly-demanded advocacy and policy tool. We started with 11 countries, but many more can benefit from this work. The 22 indicators offer an incredible wealth of information, which can be refined at the national and local level, to develop transversal readings, and to widen the collection of dimensions covered. This CDIS Methodology Manual is a major step forward in capturing and sharing the story of culture for development – our task now is to take this message everywhere, as it is particularly relevant for the implementation of the post-2015 development agenda.
Irina BokovaDirector-General of UNESCO

4 • UNESCO CULTURE FOR DEVELOPMENT INDICATORS
METHODOLOGY MANUAL • 5
INTRODUCTION
The UNESCO Convention on the Protection and Promotion of the Diversity of Cultural Expressions (2005) calls for the integration of culture in development policies at all levels in order to create a favourable environment for sustainable development and foster the diversity of cultural expressions. The UNESCO Culture for Development Indicators (CDIS) project proposes a novel methodology to demonstrate through empirical data culture’s role as both a driver and enabler of sustainable development processes, as acknowledged by several Resolutions adopted by the UN General Assembly.1
To assess the multidimensional role of culture in development, the CDIS project addresses culture not only as a sector of activity but also in terms of values and norms that orient human action. Thus, this innovative tool encourages an inclusive vision of culture’s interactions with development extending beyond economic benefits to explore more intangible benefits such as social cohesion, tolerance and inclusion. To this end, the CDIS methodology examines seven key policy dimensions: Economy, Education, Governance, Social Participation, Gender Equality, Communication and Heritage.
The present Methodology Manual is a step-by-step guide, not only to the construction of the twenty-two indicators covering these seven dimensions, but also to their use for maximum policy impact. It provides detailed and easy-to-follow instructions for collecting and processing data, constructing indicators and interpreting them according to the national context. Accompanied by the CDIS Implementation Toolkit, the Manual contributes to building capacities in statistics and promoting inter-institutional dialogue on culture and development. We are confident that the new data gathered thanks to the CDIS paved the way for informed policies and enhanced integration of culture in development strategies and monitoring systems.
The CDIS project has indeed already generated concrete impacts ranging from Ecuador’s integration of indicators to monitor cultural objectives in national development plans to informing a cultural policy framework in Cambodia and successfully advocating for the inclusion of culture in the 2014-2018 UNPAF in Namibia. To learn more about these and other encouraging examples of achievements, consult the CDIS website at www.unesco.org/creativity/CDIS.
Undoubtedly, the main reason for the CDIS’ success is the participative method that lies at the core of the initiative. The elaboration of the methodology is the result of a highly participative four-year applied research process involving the participation of renowned international experts, a vast pool of in-house UNESCO expertise, and most importantly, the stakeholders directly concerned by the project. A wide range of national stakeholders took part in the construction of the methodology and its extensive field testing in 11 countries2 worldwide, including statics institutes; ministries of culture, planning, social affairs and education, among others; civil society organizations; academics; and bilateral and multilateral development agencies. Directly inspired by this process, the CDIS Methodology Manual reflects a pragmatic and flexible approach, overcoming traditional obstacles linked to the arduous nature of cultural statistics, and is specifically adapted to the needs and circumstances of low and middle-income countries. Thanks to the resolute commitment of all stakeholders involved we have been able to together build the CDIS methodology and guarantee its pertinence and efficiency.
1. Resolution A/RES/65/166 of 2010, Resolution A/RES/66/208 of 2011, Resolution A/RES/68/223 of 2013, and Resolution A/RES/69/230 of 2014.
2. Bosnia and Herzegovina, Burkina Faso, Cambodia, Colombia, Ecuador, Ghana, Namibia, Peru, Swaziland, Uruguay and Viet Nam.
6 • UNESCO CULTURE FOR DEVELOPMENT INDICATORS
While the CDIS project represents a significant leap forward in the area of cultural statistics and the promotion of the culture and development agenda, the next step is to expand the critical mass of countries benefiting from implementation of the CDIS, thus adding to the collection of success stories at the country level and improving the availability of data on culture for development worldwide. The CDIS can thereby contribute to a more comprehensive understanding of culture’s relationship to development globally, foster the integration of cultural indicators in development measurement systems, and impact international policy agendas. To this end, we encourage you to benefit from this new advocacy and policy tool, by implementing the CDIS Methodology Manual in your own countries and sharing the findings and results obtained at both the national and international levels.
Alfredo Pérez de ArmiñánUNESCO Assistant Director-General for Culture
METHODOLOGY MANUAL • 7
ACKNOWLEDGMENTS
The Culture for Development Indicators (CDIS) Methodology Manual is the product of a highly collaborative applied research process spanning over a period of five years. Naturally, a considerable number of individuals, national public administrations and statistics institutes as well as civil society organizations have provided their advice, input and support for the CDIS formulation, field testing and implementation.
We are most grateful to the Spanish Government, who provided the generous financial support that simply made possible CDIS’s research process in the first place. Between 2009 and 2014 AECID made available the necessary resources to explore and innovate, which allowed the production of valuable new tools for the entire culture and development community for years to come.
Also, the CDIS methodology would have never become a reality without the vision, support and guidance of Francesco Bandarin, Danielle Cliche and Paola Leoncini Bartoli, UNESCO Directors and Senior Officials who believed in this project from the very beginning and supported it relentlessly all the way through.
We are indebted to the following authors and their contribution to the preliminary Methodology Manual: Lorna and George Abungu, Simon Ellis, Yvonne Donders, Anamari Laaksonen, Omar López Olarte, Christopher Madden, Adolfo Morrone Andrew Puddephatt and Alan Wagner. Their ideas provided the UNESCO CDIS team with first elements for the construction of the indicators.
The initial set of CDIS indicators was the result of the tremendous input from different country team leaders, civil servants from national public administrations and experts: Stefania Abakerli, Rafael Arias, José Manuel Argilés, César Aguiar, Roamina Boarini, Javier Brun, Yvonne Donders, Francisco D´Almeida, Johannes Jutting, Maté Kovacks, Omar López Olarte, Adolfo Morrone, Alma Mrgan-Slipicevic, Ana Muñoz Llabrés, Ernesto Piedras and Andrew Puddephatt. Either in their individual capacity or in representation of their respective institutions (AECID, OECD, OCPA, World Bank), they all contributed to the early development of the CDIS through two dedicated expert meetings in December 2009 and October 2011.
Special thanks go to David Throsby, Professor at Macquarie University in Australia, for his particular contribution to the formalization of the CDIS Analytical Framework and the many long and rich conversations on inputs, processes and outputs of culture to development. Thanks to Omar López Olarte, and Adolfo Morrone for their involvement in the development of the economic and participation indicators. We also thank Helmut Anheier and Yudhishthir Raj Isar for their inspiring work on indicator suites within the 2008-12 Culture and Globalization Series, which set the path for the research approach we took for the CDIS. Alfons Martinell gave us the lead to start developing composite indicators in the area of governance, which we later applied to other areas, including gender and heritage. Roamina Boarini was very generous in sharing with us OECD’s Better life index approach, commenting on CDIS methodology and validating the robustness of the indicator design process.
Many other colleagues at UNESCO contributed very valuable inputs overall; Lydia Ruprecht and Sobhi Tawil, from the Education Research and Foresight Team, Wijayananda Jayaweera and Saorla McCabe from the Communication Sector exposed their operational expertise on the UNESCO media development indicators, and German de Solinis shared his approach to social participation issues. Jane Freedman and Jan Lundius, from Gender Equality Team assisted with the gender dimension. Jose Pessoa and Hendrik van der Pool from the UNESCO Institute of Statistics (UIS) were instrumental in the development of CDIS through their invaluable and constructive criticism. We also want to thank Marc Bernal for his input on education matters and Lydia Deloumeaux for her time spent carefully reviewing the different versions of the CDIS roadmaps.
Our Culture Sector colleagues also devoted their time and expertise, extensively commenting on the initial drafts and contributing in particular to the challenging area of the heritage dimension. Our thanks go to: Patricia Albrecht, Giovanni Boccardi, Fernando Brugman, Veronique Dauge, Peter Debrine, Berta de Sancristobal, Ludovico Folin-Calabri, Francisco Gómez Durán, Maria Gropa, Nada al Hassan, Anne Lemaistre, Maria Miñana, Anahit Minasyan, Mauro Rosi, Mechtild Rossler, Galia Saouma-Forero, Marc Patry, Petya Totcharova and Ron von Oers. Particular
8 • UNESCO CULTURE FOR DEVELOPMENT INDICATORS
thanks to Dorine Dubois, Jean-Yves Le Saux, Caroline Munier, Lynne Patchett and Ann Belinda Preis for their unwavering support to the overall project and for promoting the CDIS Methodology.
During the preparation of the of CDIS Methodology Manual and its field testing in 12 countries, the UNESCO CDIS Team received practical suggestions for the refinement and increased validity of the Manual from many of our colleagues in Field Offices. We are indebted to: Carl Ampah, Sophie Archambault, Nampa Asino, Damir Dijakovic, Philippe Delanghe, Hanh Duong Bich, Helvi Elago, Anne Lemaistre, Monserrat Martell, Boyson Ngondo, Mojisola Okuribido-Seriki, Alcira Sandoval, Magaly Robalino Campos, Sinisa Sesum, and Frederic Vacheron. We thank all of them for their time, insight and dedication. Some of them still show today their continuing commitment to the project by rolling out CDIS in the regions they work in.
We also want to thank the national experts, academics and representatives of statistics institutes, public administrations and National Commissions to UNESCO, who acted as leading partners during the two test waves and provided expert advice on the feasibility and relevance of the CDIS indicators for policy purposes. A special thanks to: Rosemary Andrade, Dora Arizaga, Juliana Barrero Castelllanos, Hernán Cabrera, Chenda Chhay, Elena Cusimano, Akune Dake, Anna Danielli, Susana Dominzain, Deborah Duarte, Luz Fabiola Figueroa Cárdenas, Nelago Indongo, Liliana González Jiménez, Phumzile Hlophe, Johanna Mahuth Tafur, Alma Mrgan-Slipicevic, Alejandra Maria Muñoz, Yago Namaro, Erica Ndalikokule, Mariela Ninna Noriega, Temahlubi Nkambule, Bourheima Ouédraogo, Désiré Ouédraogo, Bernice Ofosu-Baadu, Rosario Radakovich, Natalia Ríos, Jacqueline Sacramento, Placide Some, Bayardo Tobar, Julio Cesar Vega Guanilo, Cecilia Vide, Andrea Vignolo and Hazel Zungu.
The national workshops held in 12 countries during the testing of the CDIS Methodology Manual relied on the support and active participation of many institutions, development partners, civil society organizations and individuals which are too numerous to name here. These national events were held between April 2011 and December 2014 in Bosnia and Herzegovina, Burkina Faso, Cambodia, Costa Rica, Colombia, Ecuador, Ghana, Namibia, Peru, Swaziland, Uruguay and Viet Nam, where the input of the participants was vital to understanding the validity and utility of the CDIS at the country level.
Thanks are also due to the secretarial support for the Manual´s preparation and project administrative backstopping: Esperanza San Jose, Samira Zinini, Marlene Zenie-Raffin, Abdelghani Baakrim, Elena Constantinou, Oriol Freixa, Jessica Jeavons, Cristina Puerta and Fabien Testoni, who despite their heavy workloads have contributed to move the CDIS project forward.
Finally, we express our most sincere gratitude to the different members of the UNESCO CDIS team who have shared this incredible adventure since the beginning. Thanks to all for their invaluable research, editing, and logistical support throughout the project: Sophia Labadi, who assisted in launching the CDIS; George Radice, who finalized the literature review and run the website for several years; Guillaume Cohen, whose incredible talent and mathematical acumen brought the indicators to life; Caroline Bordoni, who designed the first version of the Manual; Jay Corless, who came up with the info graphics and overall concept of the Culture for Development DNA; Maro Haas, who developed CDIS graphic chart and has shown an incredible patience and detail in laying out the manual in three languages; Keiko Nowacka, whose talented writing coupled with her expertise in gender gave the contours of the first version of the Manual and deepened the research while following CDIS testing at the country level; Naima Bourgaut, whose training in policy analysis contributed to the finalization of CDIS products, revised and edited the French version of the Manual, developed templates and tools for CDIS implementation including excel sheets and visuals while following CDIS implementation in several countries; Molly Steinlage, whose development training helped research new CDIS areas, but who also thoroughly reviewed the many changes in the Methodology Manual, systematized CDIS roll-out processes, established tools of intervention and analysis, and effectively ensured data validation of the last batch of countries; Annya Crane, whose versatile interdisciplinary background helped to effectively coordinate the finalization of the Methodology Manual, contributed to developing the online tools and communication materials and supported country roll out.
Guiomar Alonso Cano Melika Medici Caucino
UNESCO CDIS Team
METHODOLOGY MANUAL • 9
OVERVIEW
The UNESCO Culture for Development Indicators (CDIS)* is a comprehensive set of 22 quantitative and qualitative indicators grouped under 7 dimensions which set out to illuminate the role of culture in development, particularly in low- to middle-income countries. The CDIS aims to provide an evidence-based and informed approach to the introduction of culture into national and international development strategies as well as to cultural policy formulation.
The development and implementation of the CDIS is occurring in an evolving global context which is now at a critical stage. The world is now turning its attention to the post-MDG development agenda, which will come into play after 2015. There is widespread discussion as to how national and international development policies should be refocused in the post-2015 era so that they can be more effective in promoting inclusive social and economic development, reducing disadvantage, and enhancing prospects for peace. In this context, the role of culture is of particular concern; in what ways does it contribute directly or indirectly to development processes? And which indicators can measure such contribution?
Much development effort over many decades has been directed to the fundamental objectives of eliminating poverty and reducing inequality. However, the success of development strategies in improving human well-being depends on recognising the cultural context within which development occurs. In other words, since culture is intrinsic to society and permeates all aspects of life, it actually constitutes the environment in which development happens. Furthermore, culture creates the conditions which facilitate economic and social progress, and therefore, becomes an enabler of development. For example, it is now well understood that interventions in areas such as health, education, communications, social inclusion and environmental protection will be more effective if they are attuned to the cultural dimensions of the society in which they are being applied.
But culture’s role in development goes further than this. The cultural sector makes a direct contribution in its own right to economic growth and social improvement. The cultural and creative industries, for example, generate incomes, employment and other economic benefits while at the same time providing an avenue for cultural fulfilment, both at the national and the local level. In this and many other ways culture can be interpreted not just as an enabler but also as a driver of development processes.
In proposing strategies for the post-2015 era, it is important to adopt a sound analytical framework within which to understand and interpret development processes in different locational contexts. In particular, a systematic view is needed of the ways in which culture’s role in development is to be properly recognised and represented in development policy-making. The CDIS, whose practical application is described in this Methodology Manual, needs to be interpreted within such a context.
The purpose of this overview is to present the CDIS´ framework of analysis which integrates culture and development in a manner that is consistent with contemporary theoretical and applied thinking in this field. This framework provides a basis for considering how the CDIS indicators can be useful in contributing to an understanding of culture’s role in development, and in informing processes of policy development in countries where they are being rolled out.
Working definitions
In order to ensure understanding of fundamental concepts underpinning this Methodology Manual, we need to begin by defining two key terms: culture and development.
While acknowledging the wide range of existing definitions and the conceptual ambiguity surrounding them, the CDIS definitions are deliberately restricted and respond to the project’s specific needs and purposes.
* The CDIS is hereafter referred to in the singular form in order to emphasize the project as a whole and as a combined collection of indicators, as opposed to the plural form which would emphasize individual indicators within the whole.
10 • UNESCO CULTURE FOR DEVELOPMENT INDICATORS
Culture
‘Culture’ has been defined in literally hundreds of ways. For CDIS purposes we refer to culture in two distinct but related senses which draw inspiration from the 2001 UNESCO Universal Declaration on Cultural Diversity1:
First, in its functional sense, meaning an organized sector of activity dealing with the diverse manifestations – past and present – of human intellectual and artistic creativity and comprising individuals, organizations and institutions responsible for their transmission and renewal. The arts and cultural expressions, together with these individuals and institutions constitute what is commonly regarded as the “cultural sector”, a demarcated policy domain, concerned mainly with heritage and creativity.
Culture as a sector of activity includes, but not exclusively, cultural workers, artists and other creative professionals; commercial (for-profit) businesses; not-for-profit firms in the arts and culture; public cultural institutions, such as museums and galleries, heritage sites, libraries etc.; education and training institutions in the arts; government agencies and ministries responsible for arts and cultural affairs; NGOs and civil society involved in cultural activity.
Second, in its anthropological sense, referring to the people’s way of life – the different values, norms, knowledge, skills, individual and collective beliefs – that guide individual and collective action.
In this sense of values and norms, culture is understood as a stock of intangible renewable resources upon which people draw inspiration and through which they express the meaning they give to their existence and its development.
Development
Similarly, the term ‘Development’ has been defined in many different ways. Drawing from Our Creative Diversity, the Report of the World Commission on Culture and Development2, the CDIS refers to development as:
“... the process of enlarging people’s choices [that...] enhances the effective freedom of the people involved to pursue whatever they have reason to value”.
Thus, CDIS, adopts the broad sense of human development, which is about “expanding the richness of human life, rather than simply the richness of the economy in which human beings live”3. This approach focuses on people and their opportunities and choices.
Building on the above definitions, the CDIS is set up to explore how culture – as a sector of activity and as the values and norms that guide human action – facilitates, enables and multiplies opportunities for individuals and societies to expand their choices, to foster a sense of well-being and to cope with processes of change.
Launched in 2009, the objectives of the project were to :
NN contribute to the operationalization of the culture-for-development agenda by offering countries an advocacy and policy tool intended to demonstrate – with quantitative and qualitative data – how culture and development interact;
NN assess the environment in place for sustaining and enhancing cultural assets and processes for development;
NN reinforce capacities in data collection and analysis related to culture and development;
NN promote an evidence-based process of policy formulation and implementation.
The CDIS project
1. http://unesdoc.unesco.org/images/0012/001271/127160m.pdf 2. Mahbub Ul Haq and three other human development pioneers – Keith Griffin, Terry McKinley and Paul Streeten – were members of the World
Commission and had a strong influence on the vision of development the runs through Our Creative Diversity. 3. 2015 marks 25 years since the first Human Development Report introduced a new approach for advancing human wellbeing. The concept has
been refined while keeping its central characteristics http://hdr.undp.org/en/humandev
METHODOLOGY MANUAL • 11
Analytical Framework
The theoretical and conceptual underpinnings of CDIS draw inspiration from the framework established in 1996 by the UN/UNESCO World Commission on Culture and Development. In its Report, Our Creative Diversity, the Commission launched a bold call for action to the international community to view culture as not only a “means” of development, but as an important “end” in its own right. The Report identified 9 distinct policy domains; from education and youth to media policies, pluralism, environment or gender equality, Our Creative Diversity analyzed the impact of culture on other areas of society and the economy, proposing to bring culture in from the periphery of development thinking and place it in centre stage.
Overall, Our Creative Diversity provided a comprehensive conceptual framework for describing and analyzing the multifaceted relationship between culture and development. It formed the backbone of subsequent initiatives to follow its recommendations and strategies. Indeed, the 1998 and 2000 UNESCO World Culture Reports, the 2004 UNDP Human Development Report Cultural Liberty in Today’s Diverse World, the 2007 Spanish international cooperation´s Culture and Development Strategy as well as many other attempts to build cultural indicators/indices derive from the holistic development paradigm put forward in Our Creative Diversity.
The CDIS framework of analysis further draws inspiration from the creative economy discourse, the sustainability paradigm put forward by the 2005 Convention on the Protection and Promotion of the Diversity of Cultural Expressions4 and the practice accumulated over the last 10 years in large scale culture and development interventions5. Thus, the framework recognises the dual role of culture both as enabler and driver of development, and acknowledges the multiple roles of culture in development -- as a source of economic and social progress, and also as an object of development in its own right. Sustainability provides an appropriate overarching paradigm for such a framework, allowing a whole systems view of development in which culture plays a role6.
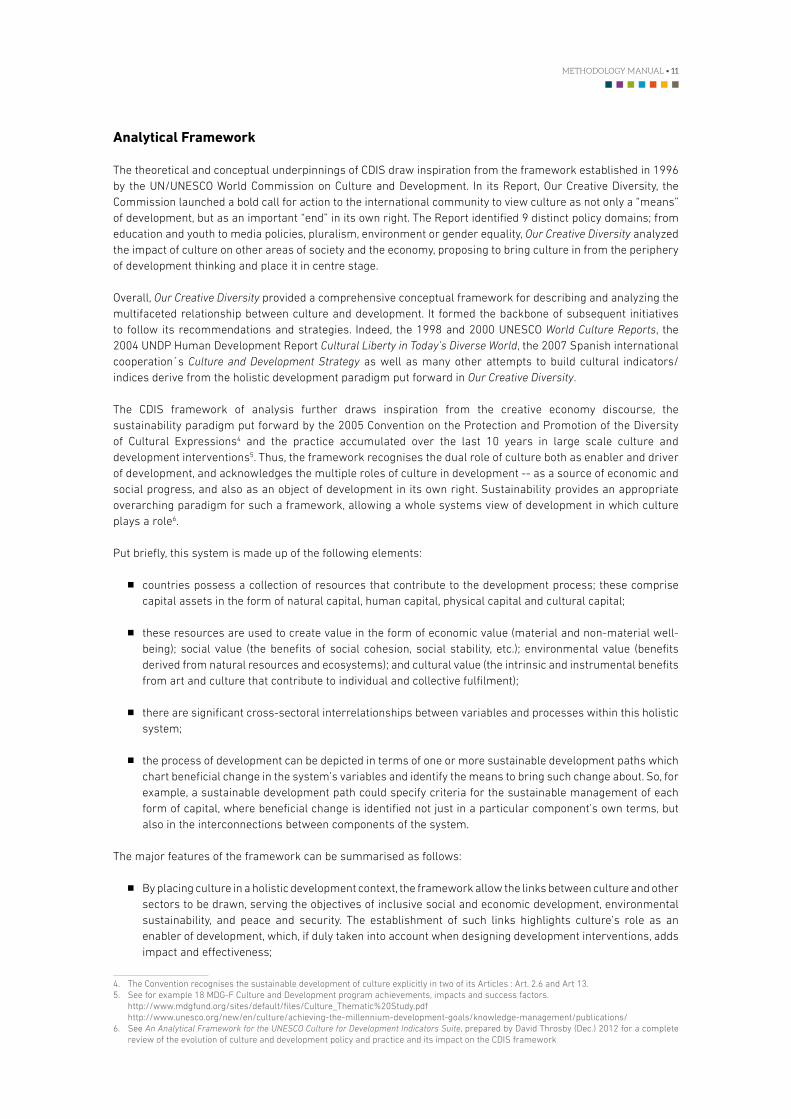
Put briefly, this system is made up of the following elements:
NN countries possess a collection of resources that contribute to the development process; these comprise capital assets in the form of natural capital, human capital, physical capital and cultural capital;
NN these resources are used to create value in the form of economic value (material and non-material well-being); social value (the benefits of social cohesion, social stability, etc.); environmental value (benefits derived from natural resources and ecosystems); and cultural value (the intrinsic and instrumental benefits from art and culture that contribute to individual and collective fulfilment);
NN there are significant cross-sectoral interrelationships between variables and processes within this holistic system;
NN the process of development can be depicted in terms of one or more sustainable development paths which chart beneficial change in the system’s variables and identify the means to bring such change about. So, for example, a sustainable development path could specify criteria for the sustainable management of each form of capital, where beneficial change is identified not just in a particular component’s own terms, but also in the interconnections between components of the system.
The major features of the framework can be summarised as follows:
NN By placing culture in a holistic development context, the framework allow the links between culture and other sectors to be drawn, serving the objectives of inclusive social and economic development, environmental sustainability, and peace and security. The establishment of such links highlights culture’s role as an enabler of development, which, if duly taken into account when designing development interventions, adds impact and effectiveness;
4. The Convention recognises the sustainable development of culture explicitly in two of its Articles : Art. 2.6 and Art 13. 5. See for example 18 MDG-F Culture and Development program achievements, impacts and success factors. http://www.mdgfund.org/sites/default/files/Culture_Thematic%20Study.pdf http://www.unesco.org/new/en/culture/achieving-the-millennium-development-goals/knowledge-management/publications/6. See An Analytical Framework for the UNESCO Culture for Development Indicators Suite, prepared by David Throsby (Dec.) 2012 for a complete
review of the evolution of culture and development policy and practice and its impact on the CDIS framework
12 • UNESCO CULTURE FOR DEVELOPMENT INDICATORS
NN At the same time, it allows culture’s role as a driver of development to be identified by recognizing the sector’s direct contribution to the generation of economic, social and cultural value, as well as the necessity of sustaining and enhancing cultural capital assets which can themselves be understood as constitutive elements and objectives of development;
NN The framework is explicitly based on the principles of culturally sustainable development, including those related to the long-term management of cultural assets, and the requirements for equity and inclusion in access to cultural life and the safeguarding and enshrinement of fundamental cultural rights.
Within this framework of analysis, the CDIS aims to illuminate the fact that this multi-faceted and holistic system demonstrates a mutually reinforcing and beneficial relationship between culture and development processes. A virtuous circle is created by this symbiosis. Culture shapes the multidimensional people-centred development in many ways, ranging from the fostering of economic growth, creativity and innovation, to the empowerment of communities and the encouragement of a sense of inclusion. In turn, the achievement of such development allows the realisation of key overarching development objectives established at the national and international level, based on the values of equality, human rights and sustainability. The virtuous circle is then completed by this development, the outcomes of which are understood as beneficial change, further reinforcing and improving the environment that allows the sustaining and enhancement of cultural assets for future development.
In summary, culture and development cannot be seen as opposite forces, one of tradition and one of change, but rather they must be articulated as parts of one and the same cycle of on-going beneficial transformation, with feedback effects and mutual dependencies emphasised in a holistic development system.
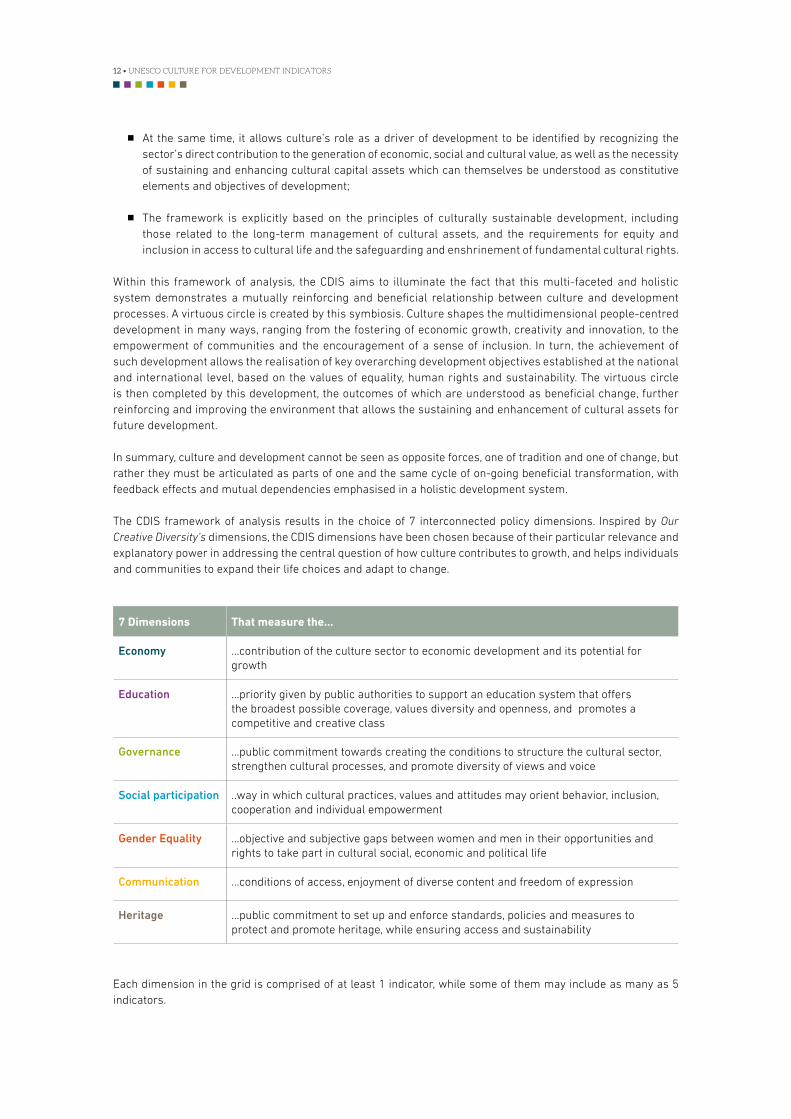
The CDIS framework of analysis results in the choice of 7 interconnected policy dimensions. Inspired by Our Creative Diversity’s dimensions, the CDIS dimensions have been chosen because of their particular relevance and explanatory power in addressing the central question of how culture contributes to growth, and helps individuals and communities to expand their life choices and adapt to change.
7 Dimensions That measure the…
Economy …contribution of the culture sector to economic development and its potential for growth
Education …priority given by public authorities to support an education system that offers the broadest possible coverage, values diversity and openness, and promotes a competitive and creative class
Governance …public commitment towards creating the conditions to structure the cultural sector, strengthen cultural processes, and promote diversity of views and voice
Social participation ..way in which cultural practices, values and attitudes may orient behavior, inclusion, cooperation and individual empowerment
Gender Equality …objective and subjective gaps between women and men in their opportunities and rights to take part in cultural social, economic and political life
Communication …conditions of access, enjoyment of diverse content and freedom of expression
Heritage …public commitment to set up and enforce standards, policies and measures to protect and promote heritage, while ensuring access and sustainability
Each dimension in the grid is comprised of at least 1 indicator, while some of them may include as many as 5 indicators.
METHODOLOGY MANUAL • 13
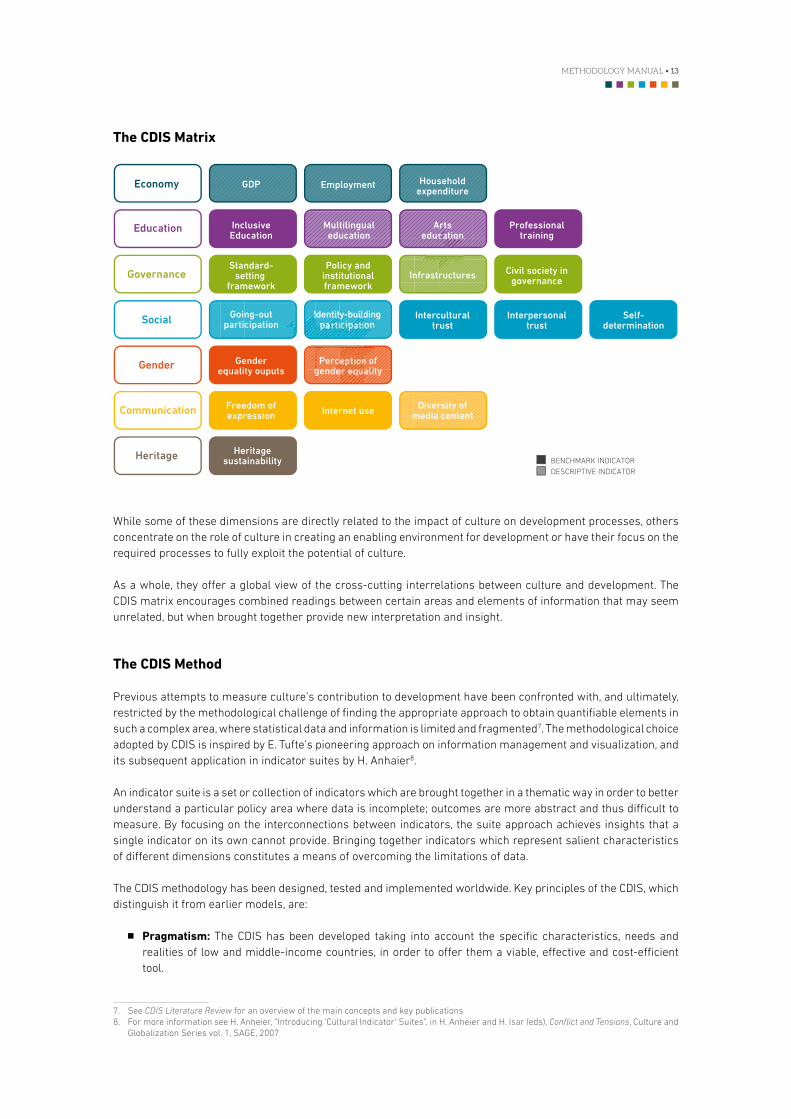
The CDIS MatrixCDIS MATRIX
BENCHMARK INDICATORDESCRIPTIVE INDICATOR
Economy
Education
Governance
Social
Gender
Communication
Heritage
GDP
InclusiveEducation
Standard-setting
framework
Employment Householdexpenditure
Artseducation
Professionaltraining
Policy andinstitutionalframework
Civil society ingovernance
Interculturaltrust
Interpersonaltrust
Self-determination
Genderequality ouputs
Freedom ofexpression Internet use
Heritagesustainability
Multilingualeducation
Infrastructures
Identity-buildingparticipation
Going-outparticipation
Perception ofgender equality
Diversity ofmedia content
While some of these dimensions are directly related to the impact of culture on development processes, others concentrate on the role of culture in creating an enabling environment for development or have their focus on the required processes to fully exploit the potential of culture.
As a whole, they offer a global view of the cross-cutting interrelations between culture and development. The CDIS matrix encourages combined readings between certain areas and elements of information that may seem unrelated, but when brought together provide new interpretation and insight.
The CDIS Method
Previous attempts to measure culture’s contribution to development have been confronted with, and ultimately, restricted by the methodological challenge of finding the appropriate approach to obtain quantifiable elements in such a complex area, where statistical data and information is limited and fragmented7. The methodological choice adopted by CDIS is inspired by E. Tufte’s pioneering approach on information management and visualization, and its subsequent application in indicator suites by H. Anhaier8.
An indicator suite is a set or collection of indicators which are brought together in a thematic way in order to better understand a particular policy area where data is incomplete; outcomes are more abstract and thus difficult to measure. By focusing on the interconnections between indicators, the suite approach achieves insights that a single indicator on its own cannot provide. Bringing together indicators which represent salient characteristics of different dimensions constitutes a means of overcoming the limitations of data.
The CDIS methodology has been designed, tested and implemented worldwide. Key principles of the CDIS, which distinguish it from earlier models, are:
NN Pragmatism: The CDIS has been developed taking into account the specific characteristics, needs and realities of low and middle-income countries, in order to offer them a viable, effective and cost-efficient tool.
7. See CDIS Literature Review for an overview of the main concepts and key publications 8. For more information see H. Anheier, “Introducing ‘Cultural Indicator’ Suites”, in H. Anheier and H. Isar (eds), Conflict and Tensions, Culture and
Globalization Series vol. 1, SAGE, 2007
14 • UNESCO CULTURE FOR DEVELOPMENT INDICATORS
NN Broad participation: The CDIS methodology has been established through a highly collaborative applied research process spanning a 5-year period and involving international experts, national public administrations from key development fields (culture, economy, social, gender, communication, etc.), national statistics and research institutes and civil society organizations. CDIS implementation at the country level is based on the participation of a broad array of stakeholders in the process of data collection and analysis in order to foster dialogue across institutions and policy sectors and build consensus around decision-making on culture and development.
NN Flexibility and adaptability: The CDIS value domestic sources and address the limitations of national cultural statistics by utilizing secondary sources, offering a flexible implementation scheme and accepting the construction of alternative and additional indicators. This allows CDIS to suit different national contexts and levels of data availability
NN Multidimensionality: The CDIS are modeled as an indicator suite or matrix to facilitate transversal analysis and to provide a holistic and inclusive illustration of the relationship between culture and development.
NN Capacity-building and policy impact: The CDIS does not only produce data and knowledge, but goes further by building national capacities for data collection and for the interpretation of cultural statistics for policy purposes.
The Culture for Development DNA
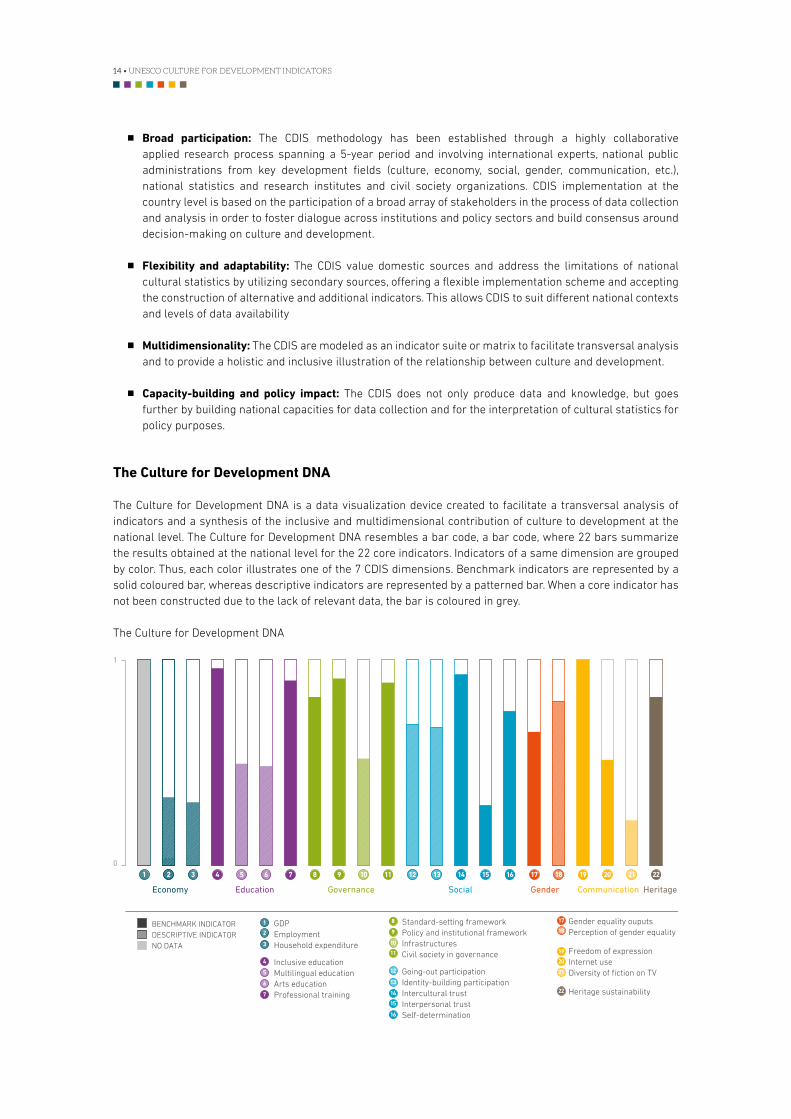
The Culture for Development DNA is a data visualization device created to facilitate a transversal analysis of indicators and a synthesis of the inclusive and multidimensional contribution of culture to development at the national level. The Culture for Development DNA resembles a bar code, a bar code, where 22 bars summarize the results obtained at the national level for the 22 core indicators. Indicators of a same dimension are grouped by color. Thus, each color illustrates one of the 7 CDIS dimensions. Benchmark indicators are represented by a solid coloured bar, whereas descriptive indicators are represented by a patterned bar. When a core indicator has not been constructed due to the lack of relevant data, the bar is coloured in grey.
The Culture for Development DNA
4
5
6
7
Inclusive educationMultilingual educationArts educationProfessional training
8
9
10
11
Standard-setting frameworkPolicy and institutional frameworkInfrastructuresCivil society in governance
Gender equality ouputsPerception of gender equality
Freedom of expressionInternet useDiversity of fiction on TV
Heritage sustainability
17
18
19
20
21
22
18161413122
Economy Education Governance Social Gender Communication Heritage
BENCHMARK INDICATORDESCRIPTIVE INDICATORNO DATA
12
13
14
15
16
Going-out participationIdentity-building participationIntercultural trustInterpersonal trustSelf-determination
1
2
3
GDPEmploymentHousehold expenditure
22212019181716151413121110987654321
0
1
CULTURE FOR DEVELOPMENT DNA
METHODOLOGY MANUAL • 15
The Culture for Development DNA is inspired by the concept of DNA, which is the hereditary material in humans and almost all other organisms. The sequence of a limited number of components – chemical bases – determines the information available for building and maintaining an organism. Likewise, each country’s culture and development components – dimensions – are structurally similar, yet they may be organized and expressed in different ways, making each Culture for Development DNA unique.
The analogy with the DNA structure helps to represent in a simple manner the complex and constantly changing relationship between culture and development. It illustrates the environment and particular conditions resulting from a matrix of policies, measures, trends and attitudes which have an impact on the contribution of culture to sustainable development in a given country. It also allows for a comparative understanding of results among countries while at the same time avoiding rankings.
Finally, it must be noted that there is an important distinction to be made between a mapping of a country’s present state or situation and its rate of change, where the latter would be measured by improvement or decline over time in variables which represent the extent of economic, social and cultural growth. As it stands now, the CDIS is primarily directed at providing a snapshot of the current situation, whereas any attempt to establish the extent of the beneficial changes derived from the development process would require comparative data for a given set of variables over time. Moreover, it is not the objective of the CDIS to identify or investigate causal relationships; it rather reveals correlations, and correlations are not explanations. However, the CDIS is meant to trigger national discussions and debates investigating such possible relationships.
Building process: The CDIS journey
Developing the CDIS methodology has required the contribution of many actors. It has involved extensive in-house research, broad consultation with development experts, practitioners, culture experts and statisticians, as well as rigorous testing and participatory implementation in 12 countries.
8 scoping papers on CDIS dimensions and a first international expert meeting held in December 2009 led to an initial set of 40 indicators. A Preliminary Methodological Manual was written providing easy-to-use “roadmaps” with practical guidance on the collection of data and construction of indicators.
The CIDS prototype was then tested in 6 countries (Bosnia and Herzegovina, Colombia, Costa Rica, Ghana, Uruguay and Viet Nam) and a second expert meeting was held in 2011 to review the country results. At this stage, several indicators were eliminated as well as an intermediary layer of sub-dimensions. New indicators were designed and tested in 6 additional countries (Burkina Faso, Cambodia, Ecuador, Namibia Peru and Swaziland). This second test phase allowed the CDIS team to fully validate the final set of indicators after intense research and methodological refinement. The final CDIS methodology is coined in the present Methodology Manual.
The construction of national Culture for Development DNAs and the compilation of the Global CDIS Database was then accomplished after analyzing and harmonizing the data from 11 countries 24 national workshops to discuss and validate results brought together a large number of stakeholders from ministries, national statistics institutes, academics, development agencies and civil society. Such a participatory implementation process has been instrumental in fostering national ownership of results and the future use of the CDIS at the policy level. Finally, all technical and interpretation outcomes of the CDIS rollout have been compiled in comprehensive country Technical Reports and Analytical briefs.
A complementary ‘lessons-learned based’ CDIS toolset has also been developed in order to guide and facilitate further effective implementation processes of the indicators elsewhere. The combined CDIS toolset provides detailed technical guidance for data collection, calculation, construction and analysis of the indicators for final results. The CDIS toolset comprises the present Methodology Manual and a companion Implementation Toolkit. It also includes Data Tables that have been created to offer a common framework for data processing at the national level, as well as the reference Global CDIS Database.
16 • UNESCO CULTURE FOR DEVELOPMENT INDICATORS
The way forward
This introductory chapter to the Methodology Manual has shown how the CDIS articulates with contemporary understanding of the role of culture in sustainable development. The framework presented here provides an analytical context for the interpretation of CDIS´ dimensions and indicators.
The next chapters guide data collection and analysis for the constructions of the 22 CDIS indicators and give suggestions on data sources, calculation methods troubleshooting advice and elements to interpret their results. But the CDIS journey continues along the following lines of further improvement:
NN expanding the number of countries covered in order to enrich the Global CDIS Database and to allow further analysis;
NN refining the systems of visualisation to assist in analysis of the data, and to facilitate awareness-raising and policy-making initiatives;
NN improving the system of indicators in order to enlarge the dimensions covered, multiply benchmark indicators and to allow investigation of correlations/causalities between variables;
NN adapting the indicators to regional and local level
NN identifying core cultural indicators to be included in global instruments of measurement of development.
The CDIS currently constitutes a first step. In some countries it has been a first step in bringing stakeholders to discuss culture and development, a first step to policy benchmarking for culture and/or a step to investing in statistical systems that address culture-related issues. Although these might be small steps compared to other areas, they are effective to articulate a vision and provide evidence-based arguments to make the case for culture in its diversity and complexity, in a post-2015 world.

METHODOLOGY MANUAL • 17


Core Indicators Description
CONTRIBUTION OF CULTURAL ACTIVITIES TO GDP
Percentage of the contribution of private and formal cultural activities to Gross Domestic Product
CULTURAL EMPLOYMENT Percentage of persons engaged in cultural occupations within the total employed population
HOUSEHOLD EXPENDITURES ON CULTURE
Percentage of household final consumption expenditures on cultural activities, goods and services set against total household consumption expenditures
ECONOMY
20 • UNESCO CULTURE FOR DEVELOPMENT INDICATORS
EC
ON
OM
Y
I. RELEVANCE OF THE DIMENSION FOR CULTURE AND DEVELOPMENT
Over the past 20 years, culture as a productive sector has played an increasingly important role in national economies. Cultural activities and industries are becoming drivers for growth, enabling the diversification of national economies, generating income and creating employment in developing, emerging and OECD economies. For the most part, data that may support the above remains unconsolidated and with many gaps. Yet, the following estimates illustrate the global economic contribution of cultural and creative products. The sector, broadly considered, accounted for 3.4% of global GDP in 2007 and was worth nearly US$1.6 trillion: this represents almost double international tourism receipts for the same year.1 It is, for example, estimated that the cultural and creative industries contribute around 2.6% of the total GDP in the European Union and 6.4% in the USA.2 In 2008, the value of world exports of creative goods and services reached USD 592 billion, indicating an annual growth rate of 14% over six consecutive years.3 Moreover, the creative and cultural industries are one of the most dynamic and rapidly expanding sectors in the global economy, with a growth rate of 17.6% in the Middle East, 13.9% in Africa, 11.9% in Latin America, 9.7% in Asia, 6.9% in Oceania, and 4.3% in North and Central America.4 The demand and consumption of cultural and creative products and media services is also expanding exponentially, driven by the increasing importance of digital and mobile distribution and the changes in the ways culture is being created and distributed.
In addition, the products and services generated by cultural activities and industries are a powerful vector for social and cultural development due to their dual nature – both economic and cultural. This dual nature adds value and goes beyond their capacity to create employment, revenues and incomes. By providing an outlet for creative expression, experimentation, and entrepreneurism, they foster the creative as well as the social capital of a country. In this regard, the culture and creative sectors are “risk takers”, investing in new talents and new aesthetics that contribute to the diversity of cultural expressions and enlarge consumer choices. They also produce multiple synergies and positive spill-over effects in areas such as the access and use of new information and communication technologies (NICTs) by the general public or the stimulation of research, product and service innovation. Importantly, the diversity and strength of the culture sector at the national level highlights the degree to which infrastructure and policies are in place to facilitate the translation of creativity and innovation to entrepreneurial skills and expertise as well as the production of positive social externalities.
The CDIS and the Millennium Development Goals (MDGs): This dimension is related to the MDG Goal 1 “Eradicate Extreme Poverty and Hunger” which includes targets for the achievement of full and productive employment and decent work for all, including women and young people. The CDIS seeks to demonstrate and highlight the potential of culture as a motor of economic development that can generate income and create employment. The results of its application at the country level could thus contribute to the measurement of the achievements obtained in the implementation of MDG 1.
Objective of the Dimension
This dimension examines the contribution of the culture sector to economic development through three core indicators:
NN Contribution of cultural activities to GDP;NN Cultural employment; and NN Household expenditures on culture.
Through these three core indicators, the CDIS is contributing to obtain key data demonstrating the contribution of the culture sector to the economic development of countries. Moreover, through its methodology, it is also helping to initiate the alignment of national statistics related to the economy of culture with international standards.
1. The Creative Economy Report, UNCTAD (2008), p.25 2. The Creative Economy Report, UNCTAD (2010), p.23 3. The Creative Economy Report, UNCTAD (2010), p.23 4. Media and Entertainment Outlook, PricewaterhouseCoopers (2008)
METHODOLOGY MANUAL • 21
EC
ON
OM
Y
Note: Taking into account the level of capacities in cultural statistics and the availability of data in most middle, middle-low and low-income countries, the CDIS adopts a simplified and pragmatic
approach inspired by the UNESCO Framework for Cultural Statistics (2009). The elaboration of the core indicators of the Economic Dimension should, therefore, be considered as a first step in the process of reinforcing technical capacities and information systems on the measurement of the contribution of culture to development at the national level by pointing out priority areas of intervention and major potentials and gaps requiring further explorations for policy-making.
II. DEFINITIONS
The concepts and definitions used for the three core indicators are based on:
NN UN System of National Accounts 2008 (SNA)5 NN UNESCO Framework for Cultural Statistics (FCS)6 NN International Labor Organization (ILO) standards and guidelines7
In order to establish a general understanding of the key terms related to the three core indicators, the following definitions and reference guidelines are suggested for use.
Cultural goods and services:8 products that are distinguished from other economic goods and services because they “encompass artistic, aesthetic, symbolic and spiritual values.”
Central cultural domains:9 common sets of culturally productive industries, activities and practices directly associated with the creation, production, distribution and enjoyment of central cultural content:
NN Cultural and Natural Heritage;NN Performance and Celebration;NN Visual Arts and Crafts;NN Books and Press;NN Audio-visual and Interactive Media; NN Design and Creative Services; andNN Intangible Cultural Heritage (transversal domain).
Equipment and supporting cultural domains: supporting industries as well as ancillary services that facilitate or enable the creation, production and distribution of products that make part of central cultural domains (e.g. printing, television apparatus or IPods) as defined by the UNESCO Framework for Cultural Statistics (2009).
Cultural production activities: activities that are under the responsibility of an individual or group of people that transform inputs (labour force, goods and services, and capital) into goods and services (outputs), which are remunerated and fall within a cultural domain.10 Not all activities that are part of cultural domains are part of production. Cultural production includes market and non-market activities. Non-market activities include those of non-profit and government entities that offer their products free of charge or for non-significant prices.11
However, for methodological reasons, the CDIS core indicator on the contribution of cultural activities to GDP only assesses the contribution of private and formal cultural production activities to GDP.
Establishments: the statistical units to measure production. Establishments are active in just one location and concentrate on a sole or main activity that generates at least half of the total value added. An enterprise can be made up of one or more establishments. The establishments that make up the enterprise may in turn develop differing main activities.
5. http://unstats.un.org/unsd/nationalaccount/docs/SNA2008.pdf 6. UNESCO, Framework for Cultural Statistics (2009), http://www.uis.unesco.org/template/pdf/cscl/framework/FCS_2009_EN.pdf 7. http://www.ilo.org/global/statistics-and-databases/standards-and-guidelines/lang--en/index.htm 8. UNESCO, Framework for Cultural Statistics (2009), p.22 9. UNESCO, Framework for Cultural Statistics (2009), p.23 10. The System of National Accounts (SNA) includes all the activities performed for the production of goods and services and excludes all
domestic or personal household activities (e.g. cleaning, house repairs and meal serving) that are not remunerated. 11. These play a very important cultural role in the performing arts, heritage or services such as libraries and museums.
22 • UNESCO CULTURE FOR DEVELOPMENT INDICATORS
EC
ON
OM
Y
The CDIS Economy Dimension focuses on establishments engaged in cultural activities related to central cultural domains (covering establishments such as publishing and broadcasting enterprises, theatre and dance companies, museums, libraries), and equipment and supporting cultural domains (covering establishments such as telecommunications enterprises).
Employment in cultural activities: includes persons employed in jobs within establishments operating in the culture sector. Establishments dedicated to cultural activities may comprise cultural but also non-cultural occupations, as happens in management, technical and commercial occupations. Indeed, in the same establishment dedicated to a cultural activity (e.g. a publishing company), there can be different people engaged in jobs linked to cultural occupations, such as illustrators, writers and editors, and other people with jobs associated to non-cultural occupations like managers, accountants, clerks and sales people.
Employment in cultural occupations: includes persons that perform tasks and duties “that are carried out: to
generate, develop, preserve or reflect cultural or symbolic and spiritual meaning; to create, produce and disseminate cultural goods and services, which generally contain intellectual property rights; and for the purpose of artistic expression”.12 Cultural occupations refer to people who had a productive cultural occupation during a given time. It includes persons that are employed in establishments dedicated to cultural activities but also by establishments belonging to other non-cultural sectors, for example, designers in the cloth industry or architects in the building industry.
For the purpose of the CDIS, employment in central cultural occupations is distinguished from employment in equipment and support cultural occupations.
III. DATA SOURCES
The sources (economic and household surveys and censuses), where data should be obtained for the construction of the three core indicators use activity, occupation and consumption classifications.
These classifications organize the information of activities, occupations and consumption according to purposes into codes, necessary for economic and social accounting and statistical purposes. The construction of the proposed indicators requires the identification of culture in these classifications. The following International Standard Classifications for activities, occupations and consumption are guidelines for the national classifications used by countries.13
NN The International Standard Industrial Classification of Economic Activities (ISIC): this classification consists of categories used to collect and report statistics according to productive activities.
NN The International Standard Classification of Occupations (ISCO): this classification categorizes occupations according to the specific characteristics of job duties and tasks.
NN The Classification of Individual Consumption According to Purpose (COICOP): this classification divides the purpose of individual consumption expenditures incurred by households. The classification units are transactions.
Most countries use adaptations of these international standards. Some countries may use a different model, but in most cases the national classification used can be harmonized or subsumed within the above international standard classifications.
12. UNESCO, Framework for Cultural Statistics (2009), p.40 13. Promoted by the UN Statistics Division (http://unstats.un.org/unsd/cr/registry) and the Department of Statistics of the International Labour
Organization (ILO) http://www.ilo.org/public/english/bureau/stat/isco/index.htm
METHODOLOGY MANUAL • 23
EC
ON
OM
Y
IV. STEP-BY-STEP APPROACH TO IDENTIFY CULTURE IN NATIONAL ACTIVITY, OCCUPATION AND CONSUMPTION CLASSIFICATIONSThe following three steps should be followed for the identification of culture in national activity, product and occupation classifications in order to construct the indicators of this dimension.
>> STEP 1: Identification of central and equipment/supporting cultural domains in International Standard Classifications . The FCS (2009) conducted a detailed selection of activities and occupations that make up part of central cultural and equipment/supporting cultural domains in the last versions of these classifications: ISIC Rev.4 (4 digits) and ISCO-08 (4 digits). Given the pragmatic approach of the CDIS, a more reduced selection of culture domains is employed for the construction of the Economy Dimension’s indicators as explained in Appendix I. The codes selected for the indicators “Percentage of the contribution of private and formal cultural activities to GDP” and “Percentage of persons engaged in cultural occupations within the total employed population” are presented in Appendixes II and III respectively.14
Moreover, a specific selection of household expenditures that are part of central cultural and equipment/supporting cultural domains in COICOP is presented in Appendix IV in order to guide the construction of the indicator “Household final consumption expenditures on cultural goods and services”.
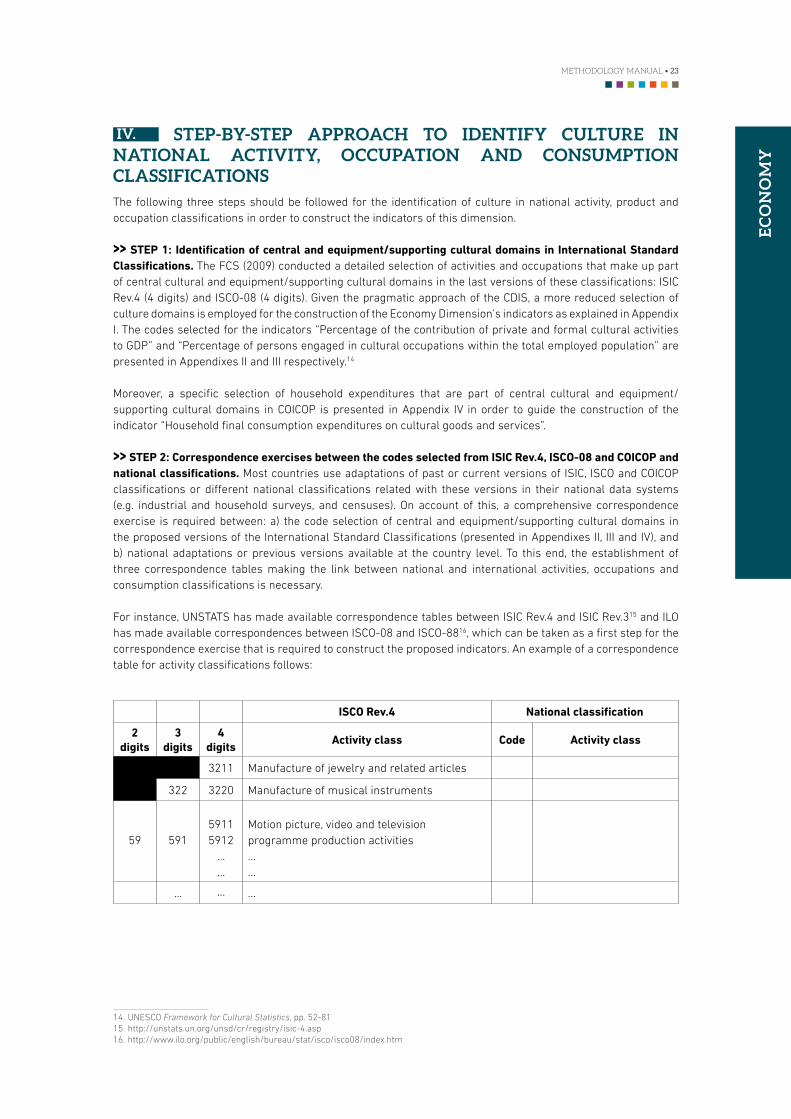
>> STEP 2: Correspondence exercises between the codes selected from ISIC Rev .4, ISCO-08 and COICOP and national classifications . Most countries use adaptations of past or current versions of ISIC, ISCO and COICOP classifications or different national classifications related with these versions in their national data systems (e.g. industrial and household surveys, and censuses). On account of this, a comprehensive correspondence exercise is required between: a) the code selection of central and equipment/supporting cultural domains in the proposed versions of the International Standard Classifications (presented in Appendixes II, III and IV), and b) national adaptations or previous versions available at the country level. To this end, the establishment of three correspondence tables making the link between national and international activities, occupations and consumption classifications is necessary.
For instance, UNSTATS has made available correspondence tables between ISIC Rev.4 and ISIC Rev.315 and ILO has made available correspondences between ISCO-08 and ISCO-8816, which can be taken as a first step for the correspondence exercise that is required to construct the proposed indicators. An example of a correspondence table for activity classifications follows:
ISCO Rev .4 National classification
2 digits
3 digits
4 digits
Activity class Code Activity class
3211 Manufacture of jewelry and related articles
322 3220 Manufacture of musical instruments
59 59159115912
……
Motion picture, video and television programme production activities……
… … …
14. UNESCO Framework for Cultural Statistics, pp. 52-81 15. http://unstats.un.org/unsd/cr/registry/isic-4.asp 16. http://www.ilo.org/public/english/bureau/stat/isco/isco08/index.htm
24 • UNESCO CULTURE FOR DEVELOPMENT INDICATORS
EC
ON
OM
Y
Note: The Data Tables of each of the three indicators of the Economy Dimension provide a framework to undertake correspondence exercises. Please fill the Tables according to the relevant national
classification paying special attention to its level of disaggregation (4, 3 or 2-digit level codes).
>> STEP 3: Construction of indicators depends on the digit level of available national classifications: as explained above, some cultural activities, occupations and types of expenditures are difficult to identify in national classifications, where the level of disaggregation is too low or insufficient. Some 3-digit level codes and even 2-digit level codes can also be directly taken but many other codes may present a high level of code aggregation in sources and they will require estimations to separate cultural activities, occupations and expenditures from non-cultural ones.
Thus, in order to reach a comparable understanding of results at the international level while still ensuring that data remains reliable, it is critical to:
NN Provide the digit level of the national classification employed to construct the indicators in the Data Tables; and
NN Closely follow the selection of codes proposed by the present Methodology Manual for the construction of the indicators with data at the 4, 3 and 2-digit levels.
Naturally, the precision and relevance of the final indicators are strongly reduced when digit level codes decrease. However, at the 3-digit level, final indicators will succeed in giving relatively accurate insights into the contribution of culture to the economy. At the 2-digit level, the indicators will only succeed in giving a first, basic snapshot of the contribution of culture to the economy and serve as a guide for further research and policy action in this area.
Note: In order to obtain accurate and relevant data to construct these indicators (ideally at the 4- or 3-digit code level) collaboration with national statistical institutes is essential. Thus, it may be
useful to establish a Memorandum of Understanding or other formal agreement with such institutes for the implementation of the CDIS at the national level.
V. CORE INDICATORS
1. CONTRIBUTION OF CULTURAL ACTIVITIES TO GDP
Introduction
Culture contributes to national GDP. This indicator assesses the weight of the culture sector in the national economy by looking at the primary income of employees employed in the formal economy.17 This refers to those who carry out creative activities and produce symbolic products as well as those with responsibility for equipment and supporting materials that serve the creation, production and distribution of cultural activities, goods and services. By looking at the income and value added generated by formal and private cultural activities, this indicator shows that these activities contribute to a country’s production, help to diversify the economy, generate income and sustain livelihoods.
>> Description: Percentage of the contribution of private and formal cultural activities to Gross Domestic Product
Purpose
This indicator assesses the contribution of central and equipment/supporting cultural activities to GDP. It intends to provide insights into the overall contribution of the culture sector to the economy in a given country.
17. Understood as the part of an economy that is taxed, monitored by some form of government, and included in the Gross National Product (GNP).
METHODOLOGY MANUAL • 25
EC
ON
OM
Y
Note: This indicator looks at the added value provided only by private and formal cultural activities.
Data Sources
NN National AccountsNN Industry surveys and censusesNN Service and commercial surveysNN Small establishment surveysNN Government recordsNN Household income and expenditure surveysNN Household enterprise surveys NN Labour Force SourcesNN Cultural special surveys, artist registers, etc.NN Private sector sources. e.g. special surveys done by guilds or media announcers.
Calculation Method
There are two main options to construct this indicator: the production and the income approaches. Only the production approach is presented below since it is easier and more commonly used.
The following steps should be followed:
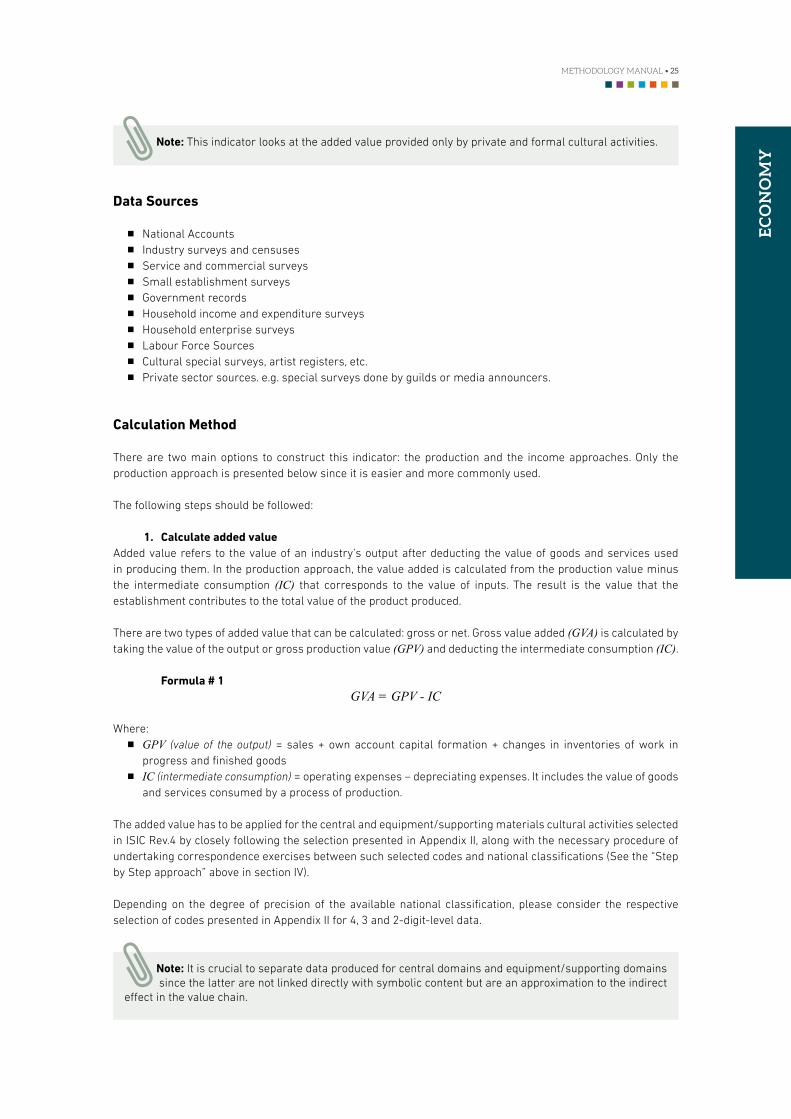
1 . Calculate added valueAdded value refers to the value of an industry’s output after deducting the value of goods and services used in producing them. In the production approach, the value added is calculated from the production value minus the intermediate consumption (IC) that corresponds to the value of inputs. The result is the value that the establishment contributes to the total value of the product produced.
There are two types of added value that can be calculated: gross or net. Gross value added (GVA) is calculated by taking the value of the output or gross production value (GPV) and deducting the intermediate consumption (IC).
Formula # 1 GVA = GPV - IC
Where:NN GPV (value of the output) = sales + own account capital formation + changes in inventories of work in
progress and finished goodsNN IC (intermediate consumption) = operating expenses – depreciating expenses. It includes the value of goods
and services consumed by a process of production.
The added value has to be applied for the central and equipment/supporting materials cultural activities selected in ISIC Rev.4 by closely following the selection presented in Appendix II, along with the necessary procedure of undertaking correspondence exercises between such selected codes and national classifications (See the “Step by Step approach” above in section IV).
Depending on the degree of precision of the available national classification, please consider the respective selection of codes presented in Appendix II for 4, 3 and 2-digit-level data.
Note: It is crucial to separate data produced for central domains and equipment/supporting domains since the latter are not linked directly with symbolic content but are an approximation to the indirect
effect in the value chain.
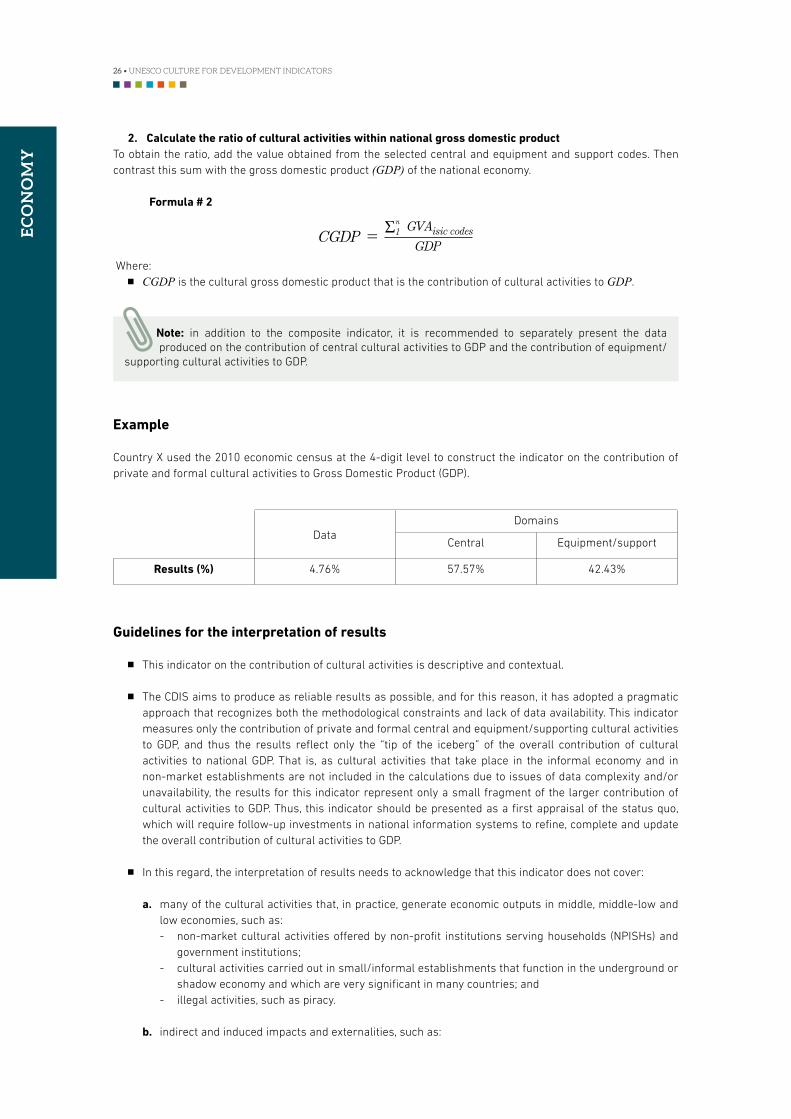
26 • UNESCO CULTURE FOR DEVELOPMENT INDICATORS
EC
ON
OM
Y
2 . Calculate the ratio of cultural activities within national gross domestic product To obtain the ratio, add the value obtained from the selected central and equipment and support codes. Then contrast this sum with the gross domestic product (GDP) of the national economy.
Formula # 2
CGDP = GVAisic codes
GDPR
n
1
Where:NN CGDP is the cultural gross domestic product that is the contribution of cultural activities to GDP.
Note: in addition to the composite indicator, it is recommended to separately present the data produced on the contribution of central cultural activities to GDP and the contribution of equipment/
supporting cultural activities to GDP.
Example
Country X used the 2010 economic census at the 4-digit level to construct the indicator on the contribution of private and formal cultural activities to Gross Domestic Product (GDP).
DataDomains
Central Equipment/support
Results (%) 4.76% 57.57% 42.43%
Guidelines for the interpretation of results
NN This indicator on the contribution of cultural activities is descriptive and contextual.
NN The CDIS aims to produce as reliable results as possible, and for this reason, it has adopted a pragmatic approach that recognizes both the methodological constraints and lack of data availability. This indicator measures only the contribution of private and formal central and equipment/supporting cultural activities to GDP, and thus the results reflect only the “tip of the iceberg” of the overall contribution of cultural activities to national GDP. That is, as cultural activities that take place in the informal economy and in non-market establishments are not included in the calculations due to issues of data complexity and/or unavailability, the results for this indicator represent only a small fragment of the larger contribution of cultural activities to GDP. Thus, this indicator should be presented as a first appraisal of the status quo, which will require follow-up investments in national information systems to refine, complete and update the overall contribution of cultural activities to GDP.
NN In this regard, the interpretation of results needs to acknowledge that this indicator does not cover:
a . many of the cultural activities that, in practice, generate economic outputs in middle, middle-low and low economies, such as: - non-market cultural activities offered by non-profit institutions serving households (NPISHs) and
government institutions;- cultural activities carried out in small/informal establishments that function in the underground or
shadow economy and which are very significant in many countries; and- illegal activities, such as piracy.
b . indirect and induced impacts and externalities, such as:
METHODOLOGY MANUAL • 27
EC
ON
OM
Y
- cultural attendees’ spending on hotels, restaurants and transportation associated with cultural activities;18
- other potential benefits of culture, such as the region’s attractiveness for people and businesses; and- economic valuations that do not involve consumption, for example, the value given to cultural assets
because of their impact on future generations and their value to society or for philanthropic reasons.
Note: To learn more about issues related to the calculation of the global contribution of the culture sector to the GDP, please refer to the Going Further section in Appendix V.
NN Although only providing a partial picture, the indicator offers valuable information of the income generated by cultural activities at the national level, as well as a relevant disaggregation by central and equipment/supporting cultural activities. It will serve to quantitatively demonstrate how the culture sector contributes to growth, economic diversification, and helps to generate income and sustain livelihoods. For many countries, this will represent the first time that such an assessment of their culture sector’s weight in the national economy has been undertaken.
NN At the national level, it is highly recommended when presenting the results to compare the contribution to GDP of cultural activities (as well as of central cultural activities) with other economic sectors with similar or higher contributions. This will allow for a clearer picture of the weight of the culture sector in relation to other economic sectors within the national economy. Moreover, it would be also useful to compare the rates of growth over time (through a time series) between key economic sectors and the culture sector. In general terms, world trends in this sector indicate higher turnovers than for other sectors and industries, showing greater dynamism and overtaking more traditional sectors, such as manufacturing.
NN As stated above, a restricted picture of the overall contribution of cultural activities to GDP is obtained with 4-digit level data. With 2 or 3-digit levels of data, the picture is even more restricted. This means that the interpretation of figures needs to be thoroughly contextualized.
- For countries with 3-digit level data, the indicator will provide relatively accurate insights into the contribution of formal and private cultural activities to GDP, even if the following selected codes concerning central cultural activities (e.g. cultural education; renting of video tapes and disks; news agency activities; retail sale of books, newspapers and stationary in specialized stores; manufacture of jewelry and related articles) and equipment/supporting activities (e.g. retail sale of audio and video equipment in specialized stores and web portals) are not considered in the final calculation.
- For countries with 2-digit level data, the indicator will provide a basic snapshot of the contribution of culture to the economy. This can serve to guide further research and policy action in this area. Indeed, at the 2-digit level the final results will have only considered 7 codes categorized as corresponding to central cultural activities and 2 codes categorized as corresponding to equipment/supporting cultural activities. In addition, “software publishing”, which is considered at the 4- and 3-digit level data as an equipment/supporting activity, is embedded at the 2-digit level with other key central cultural activities and is thus counted as such.
NN Finally, it is important to note that since this indicator is aligned with international statistical standards, it represents a significant investment in bringing national classifications in line with international classification systems and allowing a comparable understanding of results at the international level. However, comparisons can only be made between countries using exactly the same codes selected under the CDIS Methodology and the same digit level of data.
Note: If, according to the available data, the proposed methodology does not provide an approximate estimation of the contribution of culture to the economy, a multi-dimensional approach based on the
experience developed to assess the cultural economy in Mali may be useful for your country. Please refer to Appendix VI for more details.
18. To give an indication of the importance of ancillary impacts of arts attendees, it is estimated that in the USA the impact of arts attendees was about one-and-a-half times the impact of the arts organizations’ own expenditures. Arts and Economic Prosperity, Americans for the Arts, June 2002.
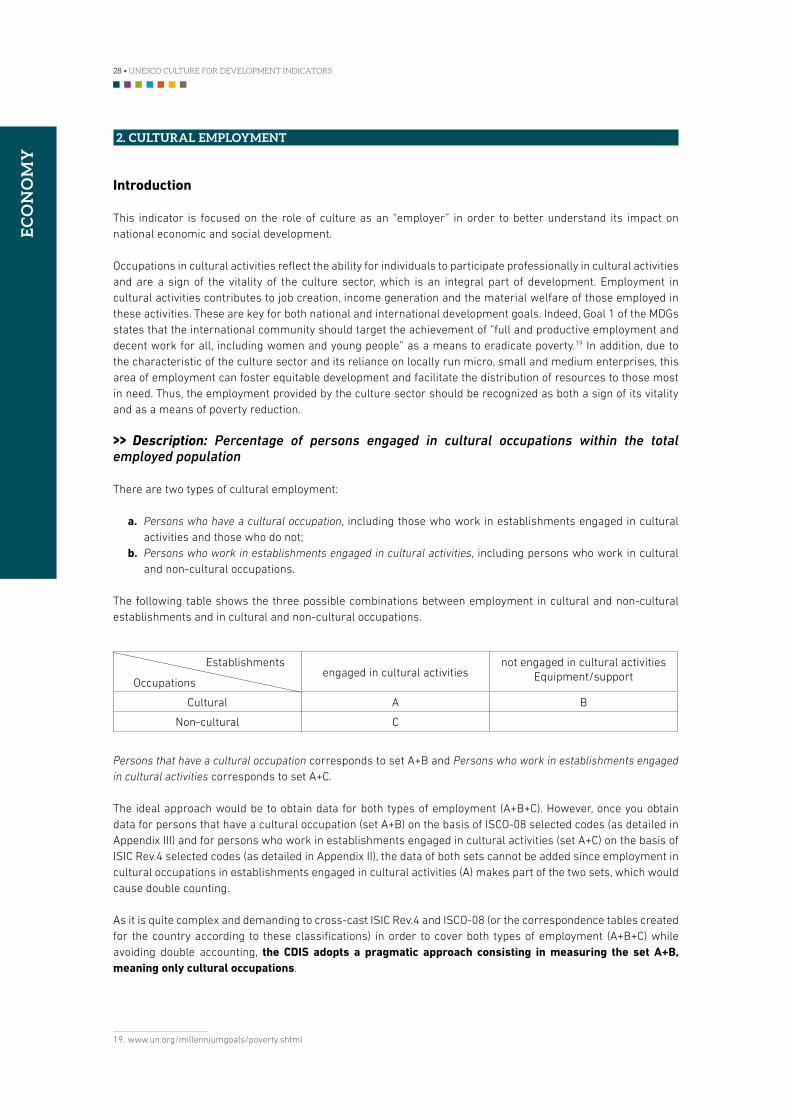
28 • UNESCO CULTURE FOR DEVELOPMENT INDICATORS
EC
ON
OM
Y
2. CULTURAL EMPLOYMENT
Introduction
This indicator is focused on the role of culture as an “employer” in order to better understand its impact on national economic and social development.
Occupations in cultural activities reflect the ability for individuals to participate professionally in cultural activities and are a sign of the vitality of the culture sector, which is an integral part of development. Employment in cultural activities contributes to job creation, income generation and the material welfare of those employed in these activities. These are key for both national and international development goals. Indeed, Goal 1 of the MDGs states that the international community should target the achievement of “full and productive employment and decent work for all, including women and young people” as a means to eradicate poverty.19 In addition, due to the characteristic of the culture sector and its reliance on locally run micro, small and medium enterprises, this area of employment can foster equitable development and facilitate the distribution of resources to those most in need. Thus, the employment provided by the culture sector should be recognized as both a sign of its vitality and as a means of poverty reduction.
>> Description: Percentage of persons engaged in cultural occupations within the total employed population
There are two types of cultural employment:
a . Persons who have a cultural occupation, including those who work in establishments engaged in cultural activities and those who do not;
b . Persons who work in establishments engaged in cultural activities, including persons who work in cultural and non-cultural occupations.
The following table shows the three possible combinations between employment in cultural and non-cultural establishments and in cultural and non-cultural occupations.
Establishments engaged in cultural activities
not engaged in cultural activities Equipment/support Occupations
Cultural A B
Non-cultural C
Persons that have a cultural occupation corresponds to set A+B and Persons who work in establishments engaged in cultural activities corresponds to set A+C.
The ideal approach would be to obtain data for both types of employment (A+B+C). However, once you obtain data for persons that have a cultural occupation (set A+B) on the basis of ISCO-08 selected codes (as detailed in Appendix III) and for persons who work in establishments engaged in cultural activities (set A+C) on the basis of ISIC Rev.4 selected codes (as detailed in Appendix II), the data of both sets cannot be added since employment in cultural occupations in establishments engaged in cultural activities (A) makes part of the two sets, which would cause double counting.
As it is quite complex and demanding to cross-cast ISIC Rev.4 and ISCO-08 (or the correspondence tables created for the country according to these classifications) in order to cover both types of employment (A+B+C) while avoiding double accounting, the CDIS adopts a pragmatic approach consisting in measuring the set A+B, meaning only cultural occupations.
19. www.un.org/millenniumgoals/poverty.shtml
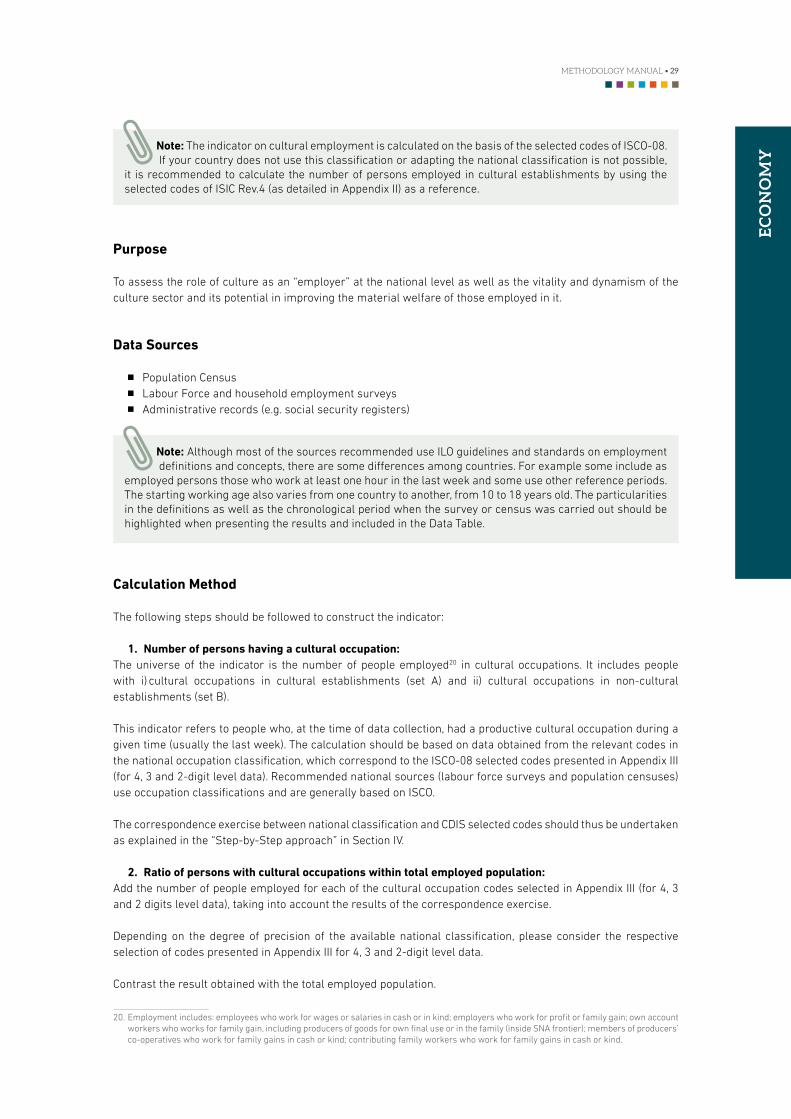
METHODOLOGY MANUAL • 29
EC
ON
OM
Y
Note: The indicator on cultural employment is calculated on the basis of the selected codes of ISCO-08. If your country does not use this classification or adapting the national classification is not possible,
it is recommended to calculate the number of persons employed in cultural establishments by using the selected codes of ISIC Rev.4 (as detailed in Appendix II) as a reference.
Purpose
To assess the role of culture as an “employer” at the national level as well as the vitality and dynamism of the culture sector and its potential in improving the material welfare of those employed in it.
Data Sources
NN Population CensusNN Labour Force and household employment surveysNN Administrative records (e.g. social security registers)
Note: Although most of the sources recommended use ILO guidelines and standards on employment definitions and concepts, there are some differences among countries. For example some include as
employed persons those who work at least one hour in the last week and some use other reference periods. The starting working age also varies from one country to another, from 10 to 18 years old. The particularities in the definitions as well as the chronological period when the survey or census was carried out should be highlighted when presenting the results and included in the Data Table.
Calculation Method
The following steps should be followed to construct the indicator:
1 . Number of persons having a cultural occupation:The universe of the indicator is the number of people employed20 in cultural occupations. It includes people with i) cultural occupations in cultural establishments (set A) and ii) cultural occupations in non-cultural establishments (set B).
This indicator refers to people who, at the time of data collection, had a productive cultural occupation during a given time (usually the last week). The calculation should be based on data obtained from the relevant codes in the national occupation classification, which correspond to the ISCO-08 selected codes presented in Appendix III (for 4, 3 and 2-digit level data). Recommended national sources (labour force surveys and population censuses) use occupation classifications and are generally based on ISCO.
The correspondence exercise between national classification and CDIS selected codes should thus be undertaken as explained in the “Step-by-Step approach” in Section IV.
2 . Ratio of persons with cultural occupations within total employed population: Add the number of people employed for each of the cultural occupation codes selected in Appendix III (for 4, 3 and 2 digits level data), taking into account the results of the correspondence exercise.
Depending on the degree of precision of the available national classification, please consider the respective selection of codes presented in Appendix III for 4, 3 and 2-digit level data.
Contrast the result obtained with the total employed population.
20. Employment includes: employees who work for wages or salaries in cash or in kind; employers who work for profit or family gain; own account workers who works for family gain, including producers of goods for own final use or in the family (inside SNA frontier); members of producers’ co-operatives who work for family gains in cash or kind; contributing family workers who work for family gains in cash or kind.
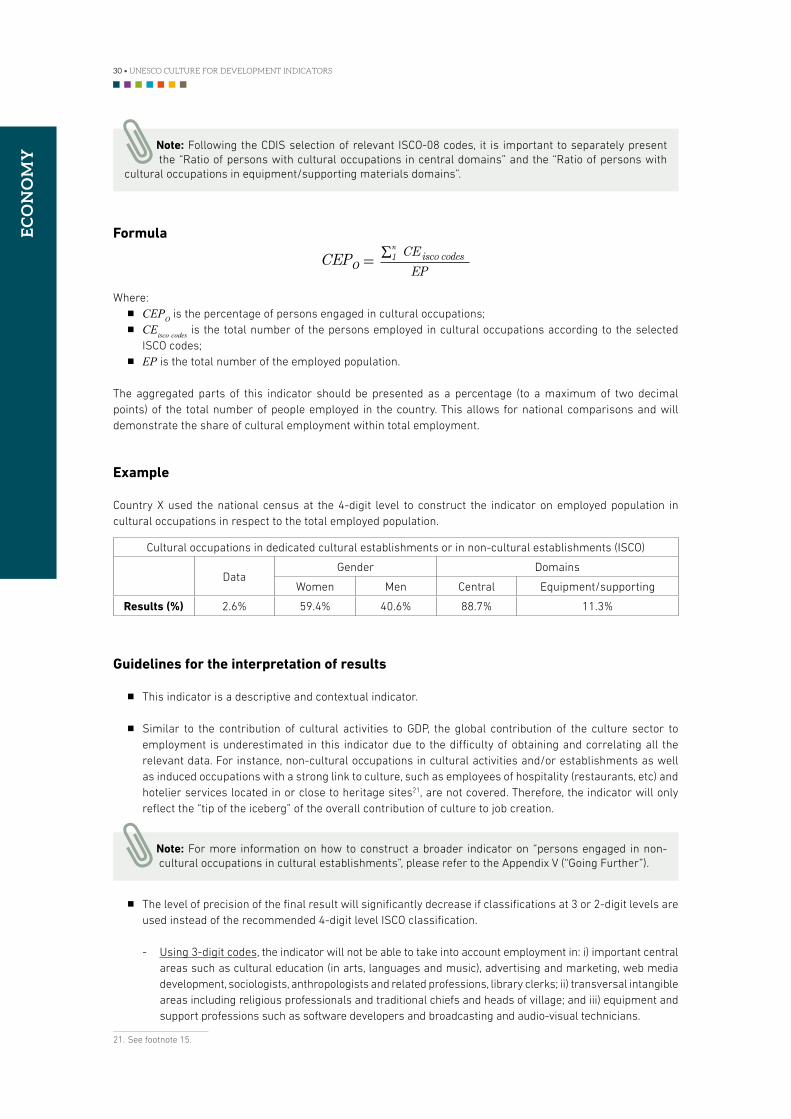
30 • UNESCO CULTURE FOR DEVELOPMENT INDICATORS
EC
ON
OM
Y
Note: Following the CDIS selection of relevant ISCO-08 codes, it is important to separately present the “Ratio of persons with cultural occupations in central domains” and the “Ratio of persons with
cultural occupations in equipment/supporting materials domains”.
Formula
CEPo = CEisco codes
EPR
n
1
Where:NN CEPO is the percentage of persons engaged in cultural occupations;NN CEisco codes is the total number of the persons employed in cultural occupations according to the selected
ISCO codes;NN EP is the total number of the employed population.
The aggregated parts of this indicator should be presented as a percentage (to a maximum of two decimal points) of the total number of people employed in the country. This allows for national comparisons and will demonstrate the share of cultural employment within total employment.
Example
Country X used the national census at the 4-digit level to construct the indicator on employed population in cultural occupations in respect to the total employed population.
Cultural occupations in dedicated cultural establishments or in non-cultural establishments (ISCO)
DataGender Domains
Women Men Central Equipment/supporting
Results (%) 2.6% 59.4% 40.6% 88.7% 11.3%
Guidelines for the interpretation of results
NN This indicator is a descriptive and contextual indicator.
NN Similar to the contribution of cultural activities to GDP, the global contribution of the culture sector to employment is underestimated in this indicator due to the difficulty of obtaining and correlating all the relevant data. For instance, non-cultural occupations in cultural activities and/or establishments as well as induced occupations with a strong link to culture, such as employees of hospitality (restaurants, etc) and hotelier services located in or close to heritage sites21, are not covered. Therefore, the indicator will only reflect the “tip of the iceberg” of the overall contribution of culture to job creation.
Note: For more information on how to construct a broader indicator on “persons engaged in non-cultural occupations in cultural establishments”, please refer to the Appendix V (“Going Further”).
NN The level of precision of the final result will significantly decrease if classifications at 3 or 2-digit levels are used instead of the recommended 4-digit level ISCO classification.
- Using 3-digit codes, the indicator will not be able to take into account employment in: i) important central areas such as cultural education (in arts, languages and music), advertising and marketing, web media development, sociologists, anthropologists and related professions, library clerks; ii) transversal intangible areas including religious professionals and traditional chiefs and heads of village; and iii) equipment and support professions such as software developers and broadcasting and audio-visual technicians.
21. See footnote 15.
METHODOLOGY MANUAL • 31
EC
ON
OM
Y
- Using 2-digit codes, the indicator will only provide a very basic snapshot of cultural employment as only two ISCO-08 codes will be considered: i) code 26, which includes many core cultural professionals such as actors, musicians, dancers, translators, film directors etc, but also non-cultural professions such as lawyers, judges and economists, and ii) code 73, related essentially to artisan professionals. Moreover, no disaggregation between central and equipment and support cultural occupations could be made.
NN Despite the above considerations, the indicator produced following the CDIS approach at the 4 or even 3-digit level offers valuable information on cultural employment at the national level. It provides a picture of its contribution and weight, demonstrating with quantitative data (for the very first time in many countries) how the culture sector contributes to job creation and the material welfare of those employed in this sector. In addition, it also allows for a detailed and disaggregated snapshot of employment in central and equipment/supporting cultural professions and gives some basic indications of the employment status of women and men in this sector.
NN At the national level, it is highly recommended when presenting the results to compare the share of cultural occupations within total employment with other major sectors with similar or higher contributions. This helps to contextualize results and to obtain a better picture of the real weight of the culture sector as an employer.
NN Moreover, to fully understand the importance of cultural employment for national development, it is highly recommended to go beyond the information given by the present core indicator. This can be achieved by collecting, whenever possible, additional data on key policy topics such as: social characteristics of employees (gender, ethnic group, age, education and training levels), job status, average working hours, job stability, secondary occupations, unemployment and underemployment. For this reason, it is requested to disaggregate the results by gender and cultural domains in the Data Table and to present them in the form of percentages of the total population employed in the sector. Moreover, country teams are strongly encouraged to take this opportunity to make additional disaggregations according to key demographic variables.
NN Finally, since the indicator is aligned with international standards, its results will be comparable between countries using the same calculation methodology. However, it is important to keep in mind that comparisons can only be made between countries using exactly the same codes selected under the CDIS Methodology and the same digit level of data.
3. HOUSEHOLD EXPENDITURES ON CULTURE
Introduction
Expenditures on culture by institutions and residents in a given country are related to economic development since they reflect the allocation of income supporting national and foreign cultural production. Moreover, individual consumption expenditures in cultural activities, goods and services incurred by households provides an insight into the size and the potential of the national market for culture and demonstrates how much a society values culture through economic flows. Assessing expenditures is also an indirect way of approximating the positive influence of the modern economy on culture as it shows the extent to which society values the amount and quality of the supply offered by this type of economy. Finally, actual expenditures may also serve as an indication of the potential for expansion of the culture sector.
>> Description: Percentage of household final consumption expenditures on cultural activities, goods and services set against total household final consumption expenditures
Purpose
To assess how resident households of a given country value cultural goods and services through market transactions and the allocation of income supporting national and foreign cultural production; and to obtain insight into the size and the potential of the national market for cultural activities, goods and services.
32 • UNESCO CULTURE FOR DEVELOPMENT INDICATORS
EC
ON
OM
Y
Definition
Household final consumption expenditures on cultural activities, goods and services consists of all purchases incurred by resident households of a country22 on individual cultural goods and services provided at prices that are economically and non-economically significant.23 It includes expenditures on cultural products such as books, commercial cinema tickets, theatre performances and chargeable entrances to museums. It covers household resident expenditures not only on cultural goods and services produced in the country but also those imported and bought abroad.
Note: This indicator will neither cover all cultural household consumptions nor the contribution of culture to national product from the perspective of spending since: i) it includes imports; ii) does not
include the value of exports; iii) excludes the majority of non-market products; and iv) leaves out certain spending on cultural products that are not financed directly by households, such as design services and advertisements.
Data Source
NN Household income and expenditure surveys
Household surveys are the preferred option. Many countries carry out income and spending surveys, which provide a disaggregation of spending on cultural products. The advantage is that it is easier to compile this information from household surveys than production data: they also tend to include expenditures that are difficult to capture by other means (such as online purchases). Some countries make these surveys annually and some sporadically (3-10 years). The chronological period reference has to be clearly noted if using this source.
Other sources that offer information from a supply perspective are:
NN Industry surveys and censusesNN Service surveysNN Small establishment surveys
Data can be used from these other sources where production is registered. This requires taking the values of the final market products produced during the period, minus exports and plus imports. The disadvantage of this option is that it requires a detailed exploration of diverse industrial surveys and in many countries the levels of code disaggregation of product classifications in the existing industrial sources makes it difficult to identify cultural goods and services. Another weakness of these supply sources is that they are not able to distinguish whether expenditures are made by resident households or by non-resident households. In many cases, they will not reveal purchases made abroad by resident households. In countries where input/output or supply/use tables exist and are constructed in their national accounts, the levels of disaggregation for cultural products should be explored.
Calculation Method
1 . Calculation of household final consumption expenditures on cultural goods and services: This variable consists of the value of all expenditures of households during a year on central and equipment/supporting cultural goods and services according to the COICOP codes selection presented in Appendix IV.
Using the COICOP selection of central and equipment/supporting cultural expenditures (Appendix IV), follow the procedure outlined in the Step-by-Step Approach (see Section IV above) in order to identify culture in the national
22. A household is considered to be resident when it has a centre of predominant economic interest in a country. That is when it engages for an extended period (one year or more) in economic activities on this territory.
23. It also includes barter transactions, goods and services received in kind (different from government and on profit organizations NPISHs transfers), and goods produced by the same household.
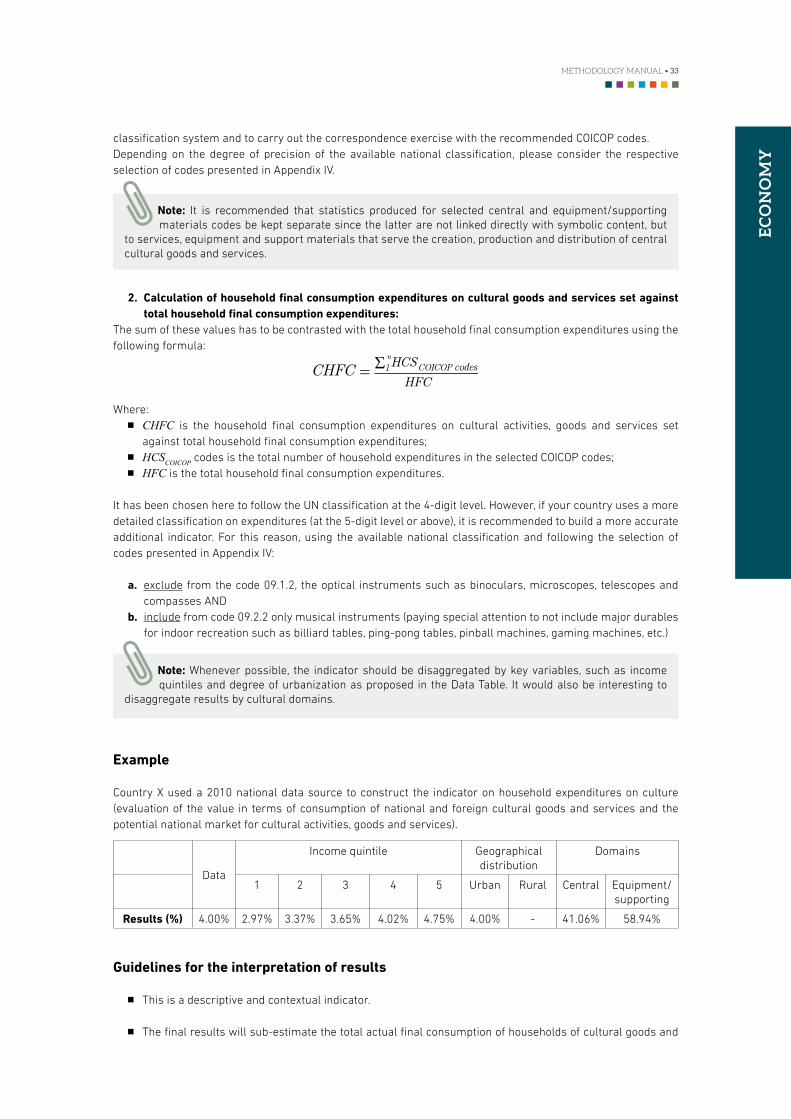
METHODOLOGY MANUAL • 33
EC
ON
OM
Y
classification system and to carry out the correspondence exercise with the recommended COICOP codes.Depending on the degree of precision of the available national classification, please consider the respective selection of codes presented in Appendix IV.
Note: It is recommended that statistics produced for selected central and equipment/supporting materials codes be kept separate since the latter are not linked directly with symbolic content, but
to services, equipment and support materials that serve the creation, production and distribution of central cultural goods and services.
2 . Calculation of household final consumption expenditures on cultural goods and services set against total household final consumption expenditures:
The sum of these values has to be contrasted with the total household final consumption expenditures using the following formula:
CHFC = HCSCOICOP codes
HFCR1
n
Where:NN CHFC is the household final consumption expenditures on cultural activities, goods and services set
against total household final consumption expenditures;NN HCSCOICOP codes is the total number of household expenditures in the selected COICOP codes;NN HFC is the total household final consumption expenditures.
It has been chosen here to follow the UN classification at the 4-digit level. However, if your country uses a more detailed classification on expenditures (at the 5-digit level or above), it is recommended to build a more accurate additional indicator. For this reason, using the available national classification and following the selection of codes presented in Appendix IV:
a . exclude from the code 09.1.2, the optical instruments such as binoculars, microscopes, telescopes and compasses AND
b . include from code 09.2.2 only musical instruments (paying special attention to not include major durables for indoor recreation such as billiard tables, ping-pong tables, pinball machines, gaming machines, etc.)
Note: Whenever possible, the indicator should be disaggregated by key variables, such as income quintiles and degree of urbanization as proposed in the Data Table. It would also be interesting to
disaggregate results by cultural domains.
Example
Country X used a 2010 national data source to construct the indicator on household expenditures on culture (evaluation of the value in terms of consumption of national and foreign cultural goods and services and the potential national market for cultural activities, goods and services).
Data
Income quintile Geographical distribution
Domains
1 2 3 4 5 Urban Rural Central Equipment/ supporting
Results (%) 4.00% 2.97% 3.37% 3.65% 4.02% 4.75% 4.00% - 41.06% 58.94%
Guidelines for the interpretation of results
NN This is a descriptive and contextual indicator.
NN The final results will sub-estimate the total actual final consumption of households of cultural goods and
34 • UNESCO CULTURE FOR DEVELOPMENT INDICATORS
EC
ON
OM
Y
services. For instance, it does not cover the value of cultural goods and services acquired by resident households and provided by non-profit institutions serving households (NPISHs) at prices that are not economically significant (eg. in-kind social transfers). It does not, therefore, include goods and services such as museum and public library services and free public cultural events, which may represent an important share of the final household consumption of cultural activities, goods and services.24 Moreover, at the recommended 4-digit level, a central cultural expenditure such as “musical instruments” will not be included as it cannot be separated from “major durables for indoor recreation”.
NN Despite these limitations, this indicator offers significant insights into how resident households value national and foreign cultural goods and services through market transactions, as well as concerning the size and the potential of the national market for cultural activities, goods and services.
NN Whenever possible, it is recommended to analyze the results according to the disaggregation criteria proposed in the Data Table, namely by income quintiles, urban/rural, central and equipment/supporting cultural goods and services. This would help to obtain a more accurate picture of cultural consumption patterns of the overall population as well as that of particular social groups. For example, it may be interesting to explore the percentage of expenditures of different income groups in relation to total expenditures in cultural goods and services, but also the typology of cultural expenditures by each income group.
NN It is recommended to explore how this indicator enhances the information obtained from the indicator on value added of cultural production. For instance, a country may create a lot of value added but export most of the products it generates. Value added shows how much culture contributes to income generation, but does not reveal how much the country’s residents enjoy and value the production it generates. Focusing on spending makes it thus possible to assess this valuation, as well as that of the production from other countries.
///////////////////// GUIDELINES FOR THE OVERALL ANALYSIS OF THE DIMENSION /////////////////////////
NN The three indicators of the Economy Dimension should be understood and analyzed as descriptive output indicators, as they refer to the whole country rather than to individuals, and help to assess the vitality and dynamism of the culture sector in general, and of cultural industries in particular.
NN It is critical to establish a correlation of results between, not only these three indicators, but also with the other indicators of the CDIS in order to obtain a global and broader picture of the opportunities and challenges of the contribution of culture to development at the national level. Thus, cross-analysis should be established with indicators related to cultural infrastructure (Governance Dimension), freedom of expression and diversity of fictional content (Communication Dimension), investment in highly trained cultural professionals (Education Dimension) or cultural participation (Social Participation Dimension). The indicators of the Economy Dimension are also important to keep in mind when considering transversal themes, such as creativity or the cultural cycle.
24. The reason for not including the valuation of those consumptions is because in many countries it is difficult to track and disaggregate information of all of these government and non-profit institutions expenditures for a particular sector, such as culture. It would require highly demanding procedures and probably the application of special surveys.
METHODOLOGY MANUAL • 35
EC
ON
OM
Y
APPENDIX I
Selection of central and equipment/supporting materials cultural domains in ISIC Rev .4 and ISCO-08
The Standard Industrial Classification of All Economic Activities ISIC Rev.4 at the 4-digit level and the International Standard Classification of Occupations ISCO 08 at the 4-digit level are the most convenient classifications, as stated by the UNESCO Framework for Cultural Statistics (FCS, 2009), to select the activities and occupations that belong to cultural domains. They are the current standards and they allow examining the culture sector in detail because of their levels of disaggregation, particularly for new media and services, designing and crafts occupations. Although these classifications still have problems identifying certain cultural activities, they are better than previous versions.
The FCS (2009) identified cultural, equipment and supporting materials and related domains in these classification versions25. In the classification selection done by the FCS (2009) there are some codes that include cultural activities and occupations together with non-cultural ones (in the education and management codes for instance). FCS has also selected codes that are considered as a part of equipment and supporting materials domains that are required for cultural and non-cultural production processes. On the other hand, the two versions of ISIC Rev.4 and ISCO-08 are very recent. The great majority of countries still use adaptations of past versions of these classifications, mainly ISCO-88 and ISIC Rev. 3, and even some older versions. Also, the data collected in the sources that can be used to obtain cultural statistics, such as censuses, labor force surveys, industrial surveys and household expenditures surveys, is in some countries registered or available at only the 2 or 3-digit levels.
The identification of cultural domains in ISIC Rev.4 and ISCO-08 was the best option for the FCS (2009), since it is a framework expected to be useful in years to come, and because it also allows for the identification of culture in a clearer manner. However, because of the reasons above, in short-term initiatives, the total adoption of FCS (2009) selection will require many procedures and estimations that demand resources and time. This is why the CDIS adopts a pragmatic and operational approach selecting the central cultural and equipment/supporting materials activity and occupation codes presented in Appendices II and III. By themselves, these codes require estimations that could be demanding when countries use sources with classifications different from ISIC and ISCO or when they use classifications coded with fewer digit levels. Adopting this restrictive approach will not only be less expensive and manageable, but it is wide enough to offer valuable information around advocacy and policy issues related to the contribution of the culture sector to the national economy, since it extends to most of the central cultural domains and the most relevant equipment/supporting materials domains.
25. Related domains that “are linked to the broader definition of culture, encompassing social and recreational activities”: this set includes cultural tourism and sports and recreational activities. These are also incorporated in the model as equipment/supporting materials cultural domains.

36 • UNESCO CULTURE FOR DEVELOPMENT INDICATORS
EC
ON
OM
Y
FOUR-DIGIT LEVEL
Central cultural activities (four digits)
ISIC Rev.4 code
Activity class
3211 Manufacture of jewelry and related articles
3220 Manufacture of music instruments
4761 Retail sale of books, newspapers and stationary in specialized stores
4762 Retail sale of music and video recordings in specialized stores
5811 Book publishing
5813 Publishing of newspapers, journals and periodicals
5819 Other publishing activities
5911 Motion picture, video and television programme production activities
5912 Motion picture, video and television programme post-production activities
5913 Motion picture video and television programme distribution activities
5914 Motion picture projection activities
5920 Sound recording and music publishing activities
6010 Radio broadcasting
6020 Television programming and broadcasting activities
6391 News agency activities
7110 Architectural and engineering activities and related technical consultancy
7220 Research and experimental development on social sciences and humanities
7310 Advertising
7410 Specialized design activities
7420 Photographic activities
7722 Renting of video tapes and disks
8542 Cultural education
9000 Creative, arts and entertainment activities
9101 Library and archives activities
9102 Museums activities and operation of historical sites and buildings
9103 Botanical and zoological gardens and nature reserves activities
Equipment/supporting materials cultural activities (four digits)
ISIC Rev.4 code
Activity class
1811 Printing
1812 Services activities related to printing
1820 Reproduction of recorded media
2640 Manufacture of consumer electronics
4742 Retail sale of audio and video equipment in specialized stores
5820 Software publishing
6110 Wired telecommunications activities
6120 Wireless telecommunications activities
6130 Satellite telecommunications activities
6312 Web portals
APPENDIX II
Selection of central and equipment/supporting cultural activities in the International Standard Industrial Classification of Economic Activities (ISIC Rev .4)
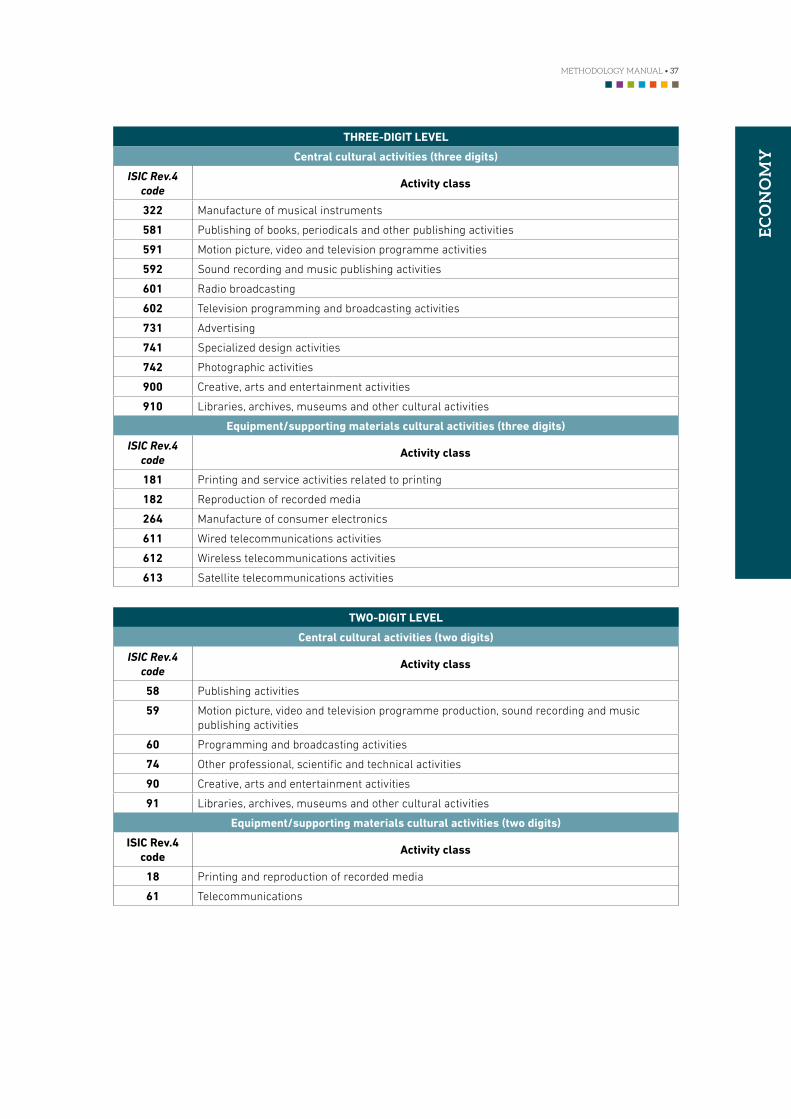
METHODOLOGY MANUAL • 37
EC
ON
OM
Y
TWO-DIGIT LEVEL
Central cultural activities (two digits)
ISIC Rev.4 code
Activity class
58 Publishing activities
59 Motion picture, video and television programme production, sound recording and music publishing activities
60 Programming and broadcasting activities
74 Other professional, scientific and technical activities
90 Creative, arts and entertainment activities
91 Libraries, archives, museums and other cultural activities
Equipment/supporting materials cultural activities (two digits)
ISIC Rev .4 code
Activity class
18 Printing and reproduction of recorded media
61 Telecommunications
THREE-DIGIT LEVEL
Central cultural activities (three digits)
ISIC Rev.4 code
Activity class
322 Manufacture of musical instruments
581 Publishing of books, periodicals and other publishing activities
591 Motion picture, video and television programme activities
592 Sound recording and music publishing activities
601 Radio broadcasting
602 Television programming and broadcasting activities
731 Advertising
741 Specialized design activities
742 Photographic activities
900 Creative, arts and entertainment activities
910 Libraries, archives, museums and other cultural activities
Equipment/supporting materials cultural activities (three digits)
ISIC Rev.4 code
Activity class
181 Printing and service activities related to printing
182 Reproduction of recorded media
264 Manufacture of consumer electronics
611 Wired telecommunications activities
612 Wireless telecommunications activities
613 Satellite telecommunications activities
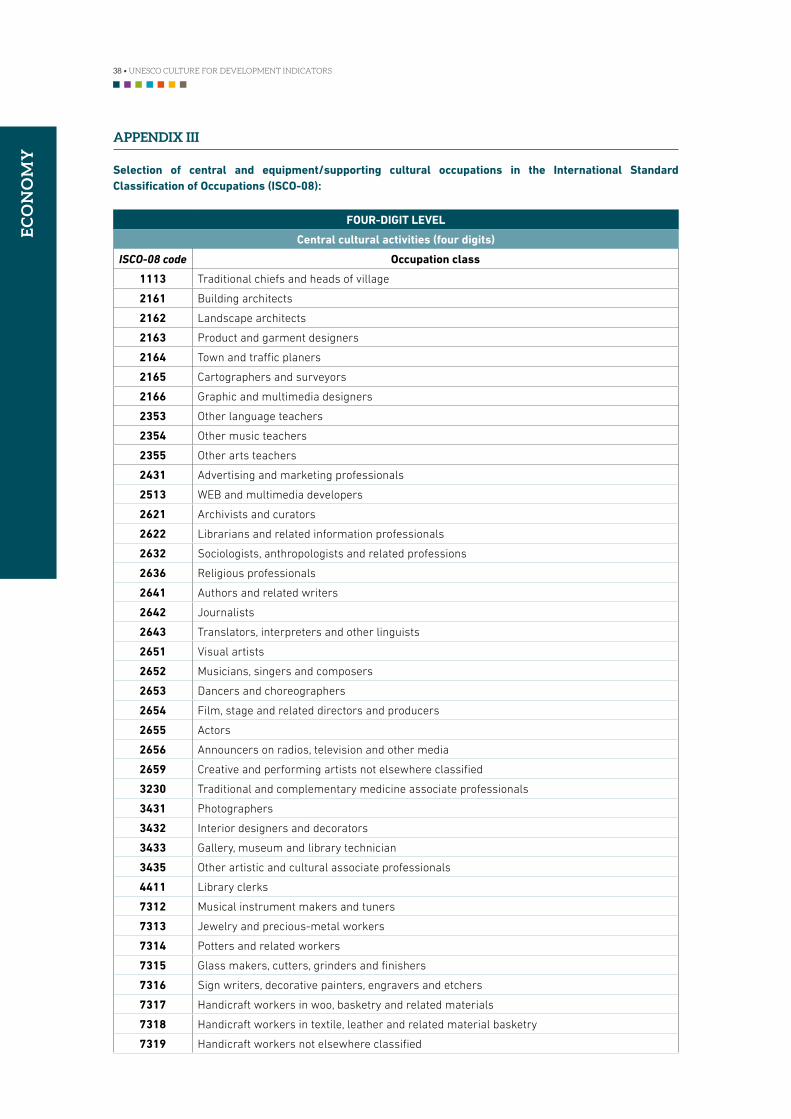
38 • UNESCO CULTURE FOR DEVELOPMENT INDICATORS
EC
ON
OM
Y
FOUR-DIGIT LEVEL
Central cultural activities (four digits)
ISCO-08 code Occupation class
1113 Traditional chiefs and heads of village
2161 Building architects
2162 Landscape architects
2163 Product and garment designers
2164 Town and traffic planers
2165 Cartographers and surveyors
2166 Graphic and multimedia designers
2353 Other language teachers
2354 Other music teachers
2355 Other arts teachers
2431 Advertising and marketing professionals
2513 WEB and multimedia developers
2621 Archivists and curators
2622 Librarians and related information professionals
2632 Sociologists, anthropologists and related professions
2636 Religious professionals
2641 Authors and related writers
2642 Journalists
2643 Translators, interpreters and other linguists
2651 Visual artists
2652 Musicians, singers and composers
2653 Dancers and choreographers
2654 Film, stage and related directors and producers
2655 Actors
2656 Announcers on radios, television and other media
2659 Creative and performing artists not elsewhere classified
3230 Traditional and complementary medicine associate professionals
3431 Photographers
3432 Interior designers and decorators
3433 Gallery, museum and library technician
3435 Other artistic and cultural associate professionals
4411 Library clerks
7312 Musical instrument makers and tuners
7313 Jewelry and precious-metal workers
7314 Potters and related workers
7315 Glass makers, cutters, grinders and finishers
7316 Sign writers, decorative painters, engravers and etchers
7317 Handicraft workers in woo, basketry and related materials
7318 Handicraft workers in textile, leather and related material basketry
7319 Handicraft workers not elsewhere classified
APPENDIX III
Selection of central and equipment/supporting cultural occupations in the International Standard Classification of Occupations (ISCO-08):
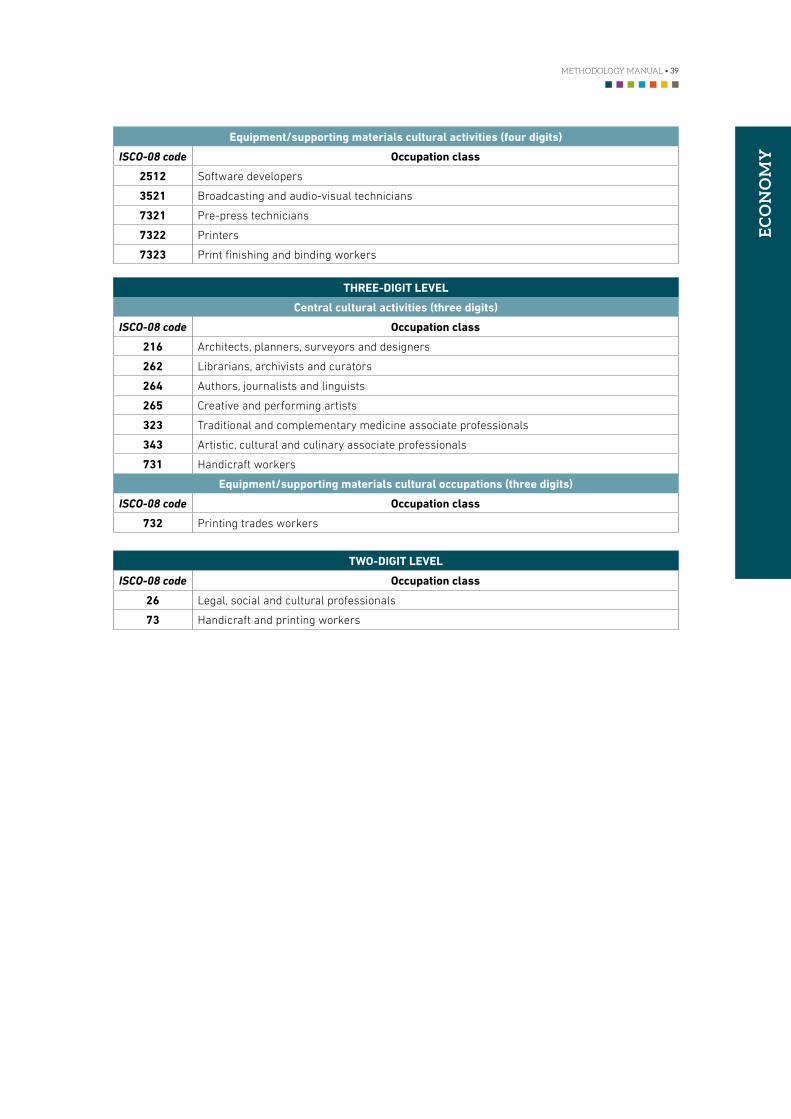
METHODOLOGY MANUAL • 39
EC
ON
OM
Y
Equipment/supporting materials cultural activities (four digits)
ISCO-08 code Occupation class
2512 Software developers
3521 Broadcasting and audio-visual technicians
7321 Pre-press technicians
7322 Printers
7323 Print finishing and binding workers
THREE-DIGIT LEVEL
Central cultural activities (three digits)
ISCO-08 code Occupation class
216 Architects, planners, surveyors and designers
262 Librarians, archivists and curators
264 Authors, journalists and linguists
265 Creative and performing artists
323 Traditional and complementary medicine associate professionals
343 Artistic, cultural and culinary associate professionals
731 Handicraft workers
Equipment/supporting materials cultural occupations (three digits)
ISCO-08 code Occupation class
732 Printing trades workers
TWO-DIGIT LEVEL
ISCO-08 code Occupation class
26 Legal, social and cultural professionals
73 Handicraft and printing workers
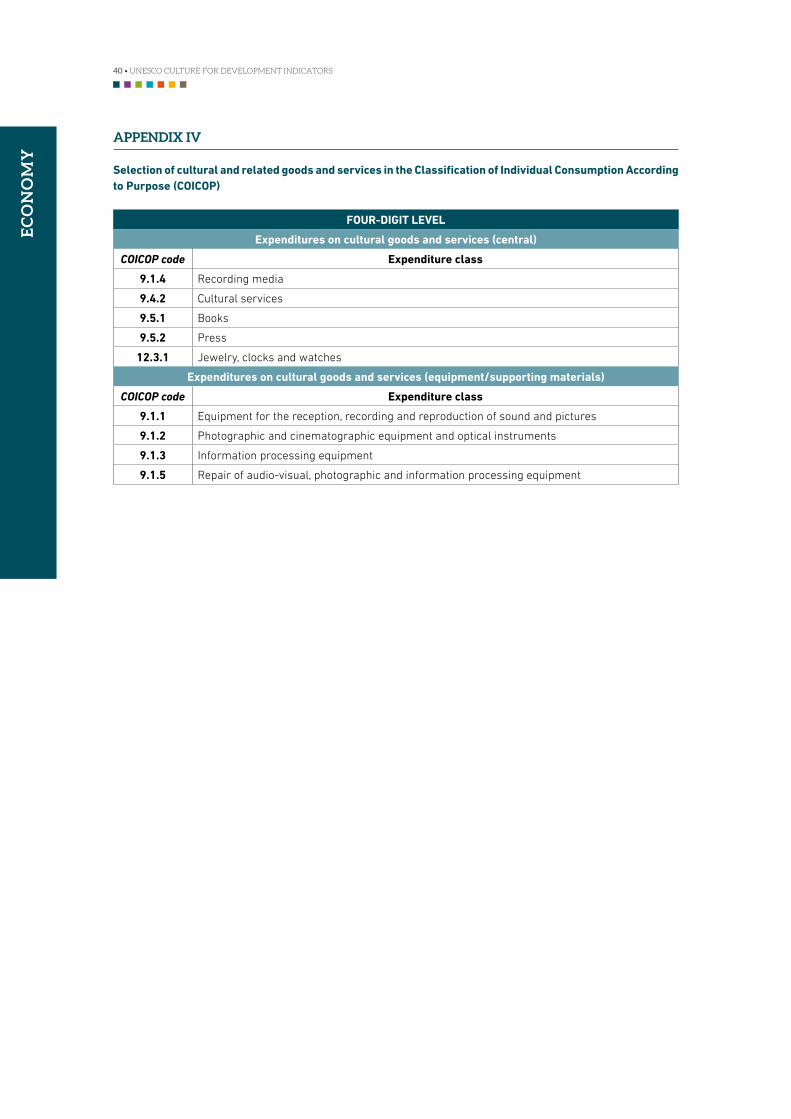
40 • UNESCO CULTURE FOR DEVELOPMENT INDICATORS
EC
ON
OM
Y
FOUR-DIGIT LEVEL
Expenditures on cultural goods and services (central)
COICOP code Expenditure class
9 .1 .4 Recording media
9 .4 .2 Cultural services
9 .5 .1 Books
9 .5 .2 Press
12 .3 .1 Jewelry, clocks and watches
Expenditures on cultural goods and services (equipment/supporting materials)
COICOP code Expenditure class
9 .1 .1 Equipment for the reception, recording and reproduction of sound and pictures
9 .1 .2 Photographic and cinematographic equipment and optical instruments
9 .1 .3 Information processing equipment
9 .1 .5 Repair of audio-visual, photographic and information processing equipment
APPENDIX IV
Selection of cultural and related goods and services in the Classification of Individual Consumption According to Purpose (COICOP)
METHODOLOGY MANUAL • 41
EC
ON
OM
Y
APPENDIX V
Going Further
INDICATOR: CONTRIBUTION OF CULTURAL ACTIVITIES TO GDP
>> Description: Percentage of the contribution of private and formal cultural activities to Gross Domestic Product
Taking into account that most countries do not have any measurement of the contribution of cultural activities to GDP and that capacities and statistical systems still need to be reinforced to achieve accurate, comprehensive and comparable measures, it is recommended, in the framework of the CDIS initiative, to concentrate efforts on cultural market formal production.
In parallel, and whenever possible, an analysis of all other existing sources should be done to capture non-market, informal and own-account production activities. To this end, it would be recommended to make inquiries on the base year of each country’s National Accounts and explore possibilities to obtain information from this benchmark exercise. After this exploration, feasibility may be determined and decisions taken in whether non-market, informal and own-account production activities could be partially or totally covered or not covered at all.
a . For non-market activities the value of the output (GPV) is obtained through adding the production costs, which include the compensation of employees and the intermediate consumption. The calculation of non-market production requires a careful revision of other existing sources that may involve some challenges. For instance, government records usually do not have disaggregated information which permits the identification of cultural domains in the different administrative levels of countries; household income and expenditure surveys are done sporadically in some countries (3 to 10 years); not all countries carry out small and household enterprise surveys; the size of the samples in these surveys is often too small to have representativeness of cultural domains.
b . For informal, own-account and illegal production activities (some of which makes part of what is called the non-observed economy) a demanding revision of other sources is required: household income and expenditures surveys, labor force surveys, household establishment surveys and small establishment surveys. In the implementation of National Accounts, countries regularly do a detailed revision of all these types of sources in a base benchmark year. During that year, economic establishment surveys are carried out in some countries. They are usually repeated every 5 to 10 years. According to the results, estimations are then done for the following years. In many countries the only surveys that are conducted annually are corporation establishment surveys and, in certain countries, the small establishment surveys. Typically, all other surveys are conducted only during the base year.
INDICATOR: CULTURAL EMPLOYMENT
>> Description: Ratio of persons with cultural occupations within the total employed population
If it is possible to cross data for occupations and for activities, it is recommended to also construct a broader indicator on cultural employment including “persons that have a cultural occupation” and “persons who work in establishments engaged in cultural activities with a non-cultural occupation” (set A + B + C) following these guidelines:
1. Number of persons engaged in cultural and creative employment:The universe chosen to be taken for the indicator is now (set A+B+C). It can be seen as the sum of two components: the number of people employed in cultural occupations and the number of people with non-cultural occupations engaged in cultural establishments.
The formula to apply in this approach should be the sum of these two components.
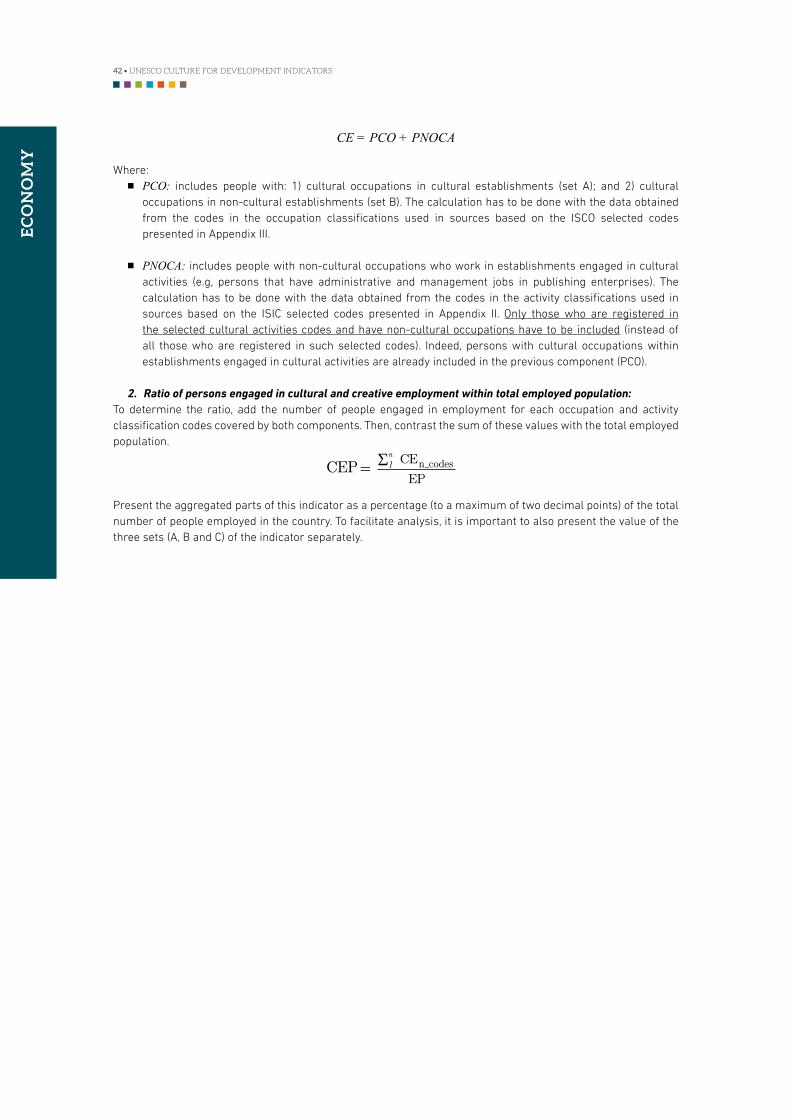
42 • UNESCO CULTURE FOR DEVELOPMENT INDICATORS
EC
ON
OM
Y
CE = PCO + PNOCA
Where:NN PCO: includes people with: 1) cultural occupations in cultural establishments (set A); and 2) cultural
occupations in non-cultural establishments (set B). The calculation has to be done with the data obtained from the codes in the occupation classifications used in sources based on the ISCO selected codes presented in Appendix III.
NN PNOCA: includes people with non-cultural occupations who work in establishments engaged in cultural activities (e.g, persons that have administrative and management jobs in publishing enterprises). The calculation has to be done with the data obtained from the codes in the activity classifications used in sources based on the ISIC selected codes presented in Appendix II. Only those who are registered in the selected cultural activities codes and have non-cultural occupations have to be included (instead of all those who are registered in such selected codes). Indeed, persons with cultural occupations within establishments engaged in cultural activities are already included in the previous component (PCO).
2. Ratio of persons engaged in cultural and creative employment within total employed population: To determine the ratio, add the number of people engaged in employment for each occupation and activity classification codes covered by both components. Then, contrast the sum of these values with the total employed population.
CEP = CEn _codes
EPR
n
1
Present the aggregated parts of this indicator as a percentage (to a maximum of two decimal points) of the total number of people employed in the country. To facilitate analysis, it is important to also present the value of the three sets (A, B and C) of the indicator separately.
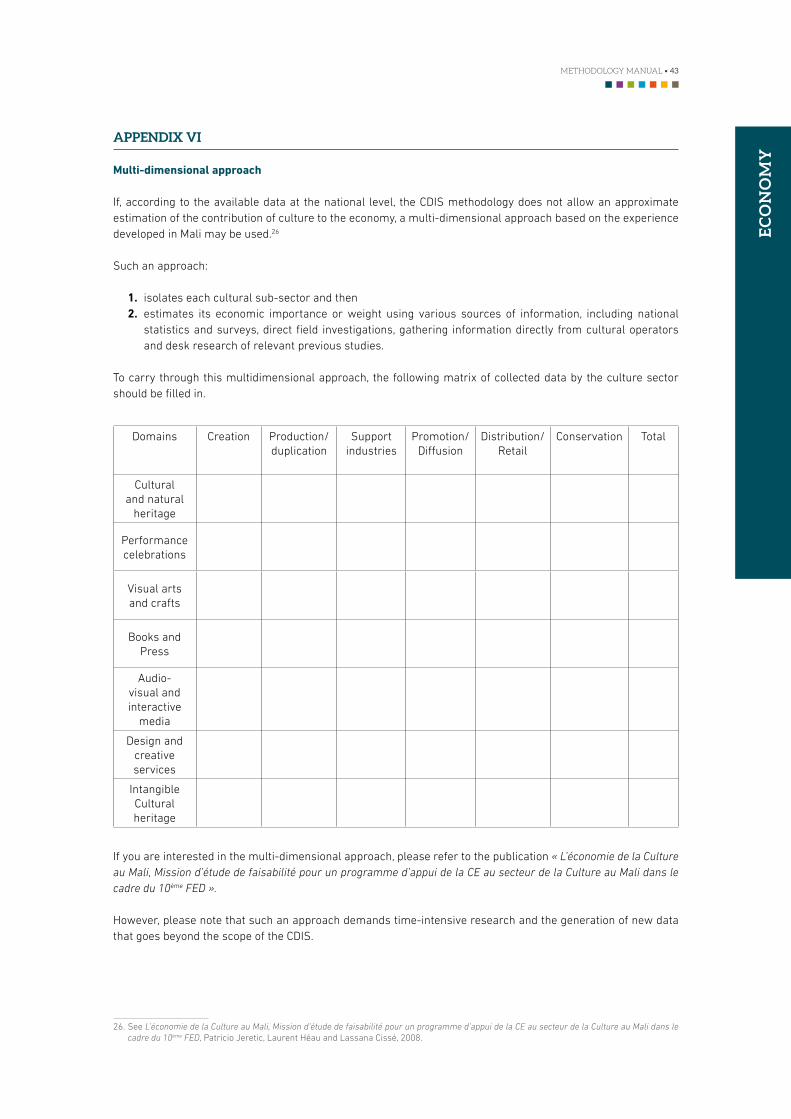
METHODOLOGY MANUAL • 43
EC
ON
OM
Y
APPENDIX VI
Multi-dimensional approach
If, according to the available data at the national level, the CDIS methodology does not allow an approximate estimation of the contribution of culture to the economy, a multi-dimensional approach based on the experience developed in Mali may be used.26
Such an approach:
1 . isolates each cultural sub-sector and then 2 . estimates its economic importance or weight using various sources of information, including national
statistics and surveys, direct field investigations, gathering information directly from cultural operators and desk research of relevant previous studies.
To carry through this multidimensional approach, the following matrix of collected data by the culture sector should be filled in.
Domains Creation Production/duplication
Support industries
Promotion/Diffusion
Distribution/ Retail
Conservation Total
Cultural and natural
heritage
Performance celebrations
Visual arts and crafts
Books and Press
Audio-visual and interactive
media
Design and creative services
Intangible Cultural heritage
If you are interested in the multi-dimensional approach, please refer to the publication « L’économie de la Culture au Mali, Mission d’étude de faisabilité pour un programme d’appui de la CE au secteur de la Culture au Mali dans le cadre du 10ème FED ».
However, please note that such an approach demands time-intensive research and the generation of new data that goes beyond the scope of the CDIS.
26. See L’économie de la Culture au Mali, Mission d’étude de faisabilité pour un programme d’appui de la CE au secteur de la Culture au Mali dans le cadre du 10ème FED, Patricio Jeretic, Laurent Héau and Lassana Cissé, 2008.

Core Indicators Description
INCLUSIVE EDUCATION Index of average years of schooling of the population between the ages of 17 and 22, adjusted to reflect inequalities
MULTILINGUAL EDUCATION Percentage of instructional hours dedicated to promoting multilingualism in relation to the total number of instructional hours dedicated to languages (grades 7-8)
ARTS EDUCATION Percentage of instructional hours dedicated to arts education in relation to the total number of instructional hours (grades 7-8)
PROFESSIONAL TRAINING IN THE CULTURE SECTOR
Index of coherency and coverage of technical and vocational education and training (TVET) and tertiary education in the field of culture
EDUCATION
46 • UNESCO CULTURE FOR DEVELOPMENT INDICATORS
ED
UC
AT
ION
I. RELEVANCE OF THE DIMENSION FOR CULTURE AND DEVELOPMENT
All women and men have a right to education. Established and protected by the Universal Declaration of Human Rights1 and acknowledged as one of the five basic cultural rights,2 the right to education provides individuals with the critical knowledge and skills required to become empowered citizens capable of adapting to change and contributing to their society, economy and culture.
Education is essential to inclusive and sustainable human development, and critical for the emergence of knowledge-based societies, capable of devising innovative strategies in order to face future challenges. It is estimated that each additional year of schooling raises average annual Gross Domestic Product (GDP) growth by 0.37%.3 An educated population has positive effects on other key areas of development, such as lower rates of maternal and infant mortality4, lower rates of HIV infection and AIDS, and the promotion of environmental sustainability. Furthermore, education plays a key role in promoting social inclusion, tolerance and respect for diversity. It has been proven that education builds and spreads shared values and attitudes, fosters the integration and participation of everyone, and of marginalized communities in particular, and creates positive opportunities for social interaction and connectivity. Lastly, it should be emphasised that school curricula are greatly influenced by their cultural context: from teaching methods to textbooks, cultural and social references permeate learning both in form and content. Education, and in particular culture-sensitive teaching materials and methods, is therefore crucial in initiating people in their culture and society.
For these reasons, education is a priority of the Millennium Development Goals (MDGs). The Culture for Development Indicators (CDIS) and the Millennium Development Goals (MDGs): This dimension is related directly to MDG 2 “Achieve universal primary education,” which aims to “ensure that, by 2015, children everywhere, boys and girls alike, will be able to complete a full course of primary schooling.”5
Although primary education constitutes the indispensable educational bedrock, the CDIS Education dimension goes one step further by encompassing secondary, vocational and tertiary education. It is thus assumed that the knowledge and skills acquired throughout the educational cycle are crucial to a country’s cultural, economic and social development. Indeed, they are instrumental in empowering the population by increasing its employment opportunities, they provide a platform for acquiring specialized skills and broadening horizons for personal development, thus enabling full participation in one’s community – an essential component of human development.
Objective of the Dimension
The links between education, culture and development are highlighted through an analysis of the priority given by the public authorities to the development of an education system that, from primary to higher education, encourages:
NN the broadest possible coverage for 10 years of schooling (for primary and the first two years of secondary education6) in order for all individuals to enjoy the right to education and benefit from a key environment for the construction, learning and transmission of cultural values, aptitudes and skills as well as of personal and social empowerment.
NN the valorization of interculturality, cultural diversity and creativity and the promotion of the appreciation of culture among the public;
NN the promotion of a competitive creative class.
1. Article 26 of the Universal Declaration of Human Rights (1948): “(1) Everyone has the right to education. Education shall be free, at least in the elementary and fundamental stages. Elementary education shall be compulsory. Technical and professional education shall be made generally available and higher education shall be equally accessible to all on the basis of merit. (2) Education shall be directed to the full development of the human personality and to the strengthening of respect for human rights and fundamental freedoms. It shall promote understanding, tolerance and friendship among all nations, racial or religious groups, and shall further the activities of the United Nations for the maintenance of peace. (3) Parents have a prior right to choose the kind of education that shall be given to their children.”
2. UNESCO World Report Investing in Cultural Diversity and Intercultural DIalogue, (UNESCO, 2009), pp. 227-228. 3. Education Counts: Towards the Millennium Development Goals (UNESCO, 2010) http://unesdoc.unesco.org/images/0019/001902/190214e.pdf 4. A child born to a mother who can read is 50% more likely to live beyond age 5. Ibid. 5. Primary-school enrolment in developing regions reached 89% in 2008, but despite the advances made in many regions, it is likely that this
target will not be achieved in 2015. 6. The first two years of secondary education are also defined within the CDIS as “basic secondary education”.
METHODOLOGY MANUAL • 47
ED
UC
AT
ION
II. CORE INDICATORS
1. INCLUSIVE EDUCATION
Introduction
Primary and secondary education enables individuals to acquire basic skills and competencies in order to become empowered citizens capable of actively taking part in their culture, society and economy. Furthermore, the years spent being educated are crucial to the emergence of positive connections and interactions among different social and cultural groups and to the building and spreading of shared values and attitudes essential to the development of human capital and social cohesion within the community.
Basic learning needs (…) comprise both essential learning tools (such as literacy, oral expression, numeracy, and problem solving) and the basic learning content (such as knowledge, skills, values,
and attitudes) required by human beings to be able to survive, to develop their full capacities, to live and work in dignity, to participate fully in development, to improve the quality of their lives, to make informed decisions, and to continue learning.7
Source: The Jomtien Declaration (1990)
7
>> Description: Index of average years of schooling of the population between the ages of 17 and 22, adjusted to reflect existing inequalities
Purpose
To evaluate:
1 . the implementation of the cultural right to education in primary and the first two years of secondary education;
2 . the extent to which children and young people can, on an equal footing, take up positive opportunities for interaction and integration and have access to the knowledge, values and skills required to contribute to their society’s development and their own continuing personal development;
3 . the levels of deprivation and marginalization in education in the country.
Definitions
The following working definitions have been used to devise this indicator:8
Education deprivation: People who have fewer than four years of education are considered to be living in education deprivation, four years being viewed as the minimum required to acquire the most basic literacy and numeracy skills. The marginalized typically fall below a social minimum threshold for years of education.
Target population: This is a reference group or target population of adults between the ages of 17 and 22. This section of the population is far enough beyond the standard primary-school completion to provide a reliable profile of those who have completed four years of schooling.
Data Sources
NN Official national data sources, usually obtainable from the central statistical office and/or the Ministry of Education;
7. World declaration on Education for All, (1990), http://www.unesco.org/education/pdf/JOMTIE_E.PDF 8. These definitions are based on the EFA Global Monitoring Report, Reaching the marginalized (UNESCO, 2010).
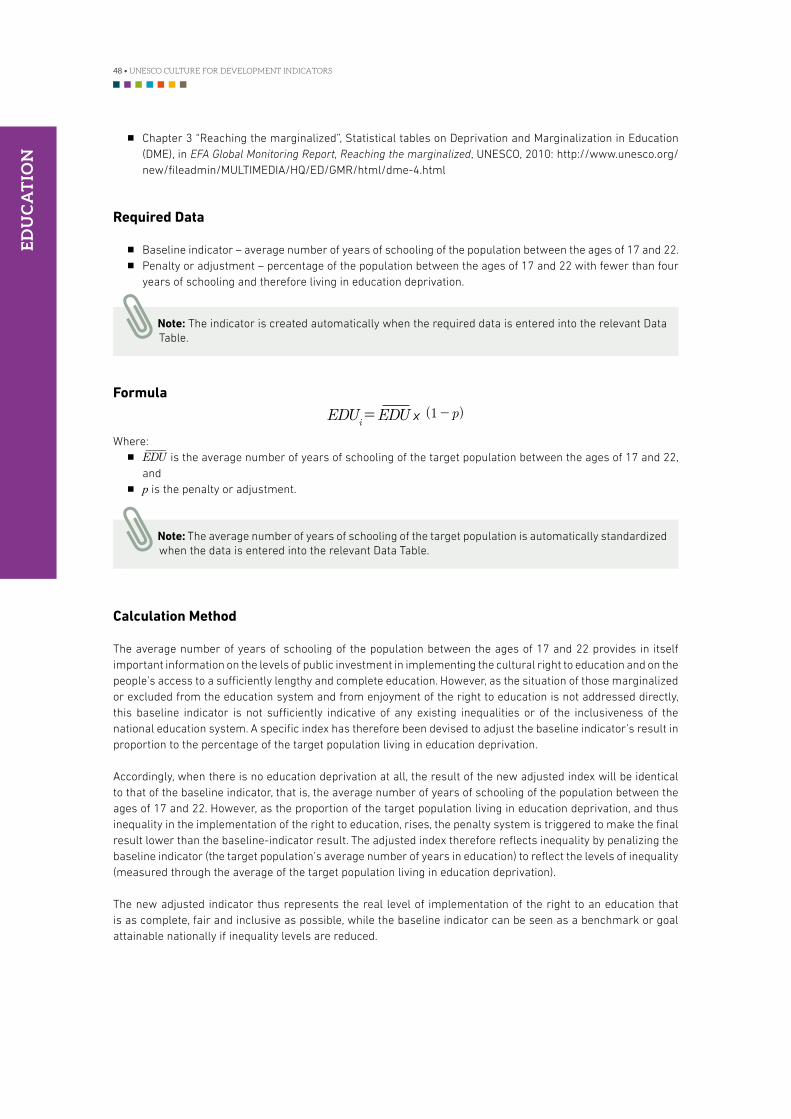
48 • UNESCO CULTURE FOR DEVELOPMENT INDICATORS
ED
UC
AT
ION
NN Chapter 3 “Reaching the marginalized”, Statistical tables on Deprivation and Marginalization in Education (DME), in EFA Global Monitoring Report, Reaching the marginalized, UNESCO, 2010: http://www.unesco.org/new/fileadmin/MULTIMEDIA/HQ/ED/GMR/html/dme-4.html
Required Data
NN Baseline indicator – average number of years of schooling of the population between the ages of 17 and 22.NN Penalty or adjustment – percentage of the population between the ages of 17 and 22 with fewer than four
years of schooling and therefore living in education deprivation.
Note: The indicator is created automatically when the required data is entered into the relevant Data Table.
Formula
EDUi = EDU X (1 - p)
Where:NN is the average number of years of schooling of the target population between the ages of 17 and 22,
andNN p is the penalty or adjustment.
Note: The average number of years of schooling of the target population is automatically standardized when the data is entered into the relevant Data Table.
Calculation Method
The average number of years of schooling of the population between the ages of 17 and 22 provides in itself important information on the levels of public investment in implementing the cultural right to education and on the people’s access to a sufficiently lengthy and complete education. However, as the situation of those marginalized or excluded from the education system and from enjoyment of the right to education is not addressed directly, this baseline indicator is not sufficiently indicative of any existing inequalities or of the inclusiveness of the national education system. A specific index has therefore been devised to adjust the baseline indicator’s result in proportion to the percentage of the target population living in education deprivation.
Accordingly, when there is no education deprivation at all, the result of the new adjusted index will be identical to that of the baseline indicator, that is, the average number of years of schooling of the population between the ages of 17 and 22. However, as the proportion of the target population living in education deprivation, and thus inequality in the implementation of the right to education, rises, the penalty system is triggered to make the final result lower than the baseline-indicator result. The adjusted index therefore reflects inequality by penalizing the baseline indicator (the target population’s average number of years in education) to reflect the levels of inequality (measured through the average of the target population living in education deprivation).
The new adjusted indicator thus represents the real level of implementation of the right to an education that is as complete, fair and inclusive as possible, while the baseline indicator can be seen as a benchmark or goal attainable nationally if inequality levels are reduced.
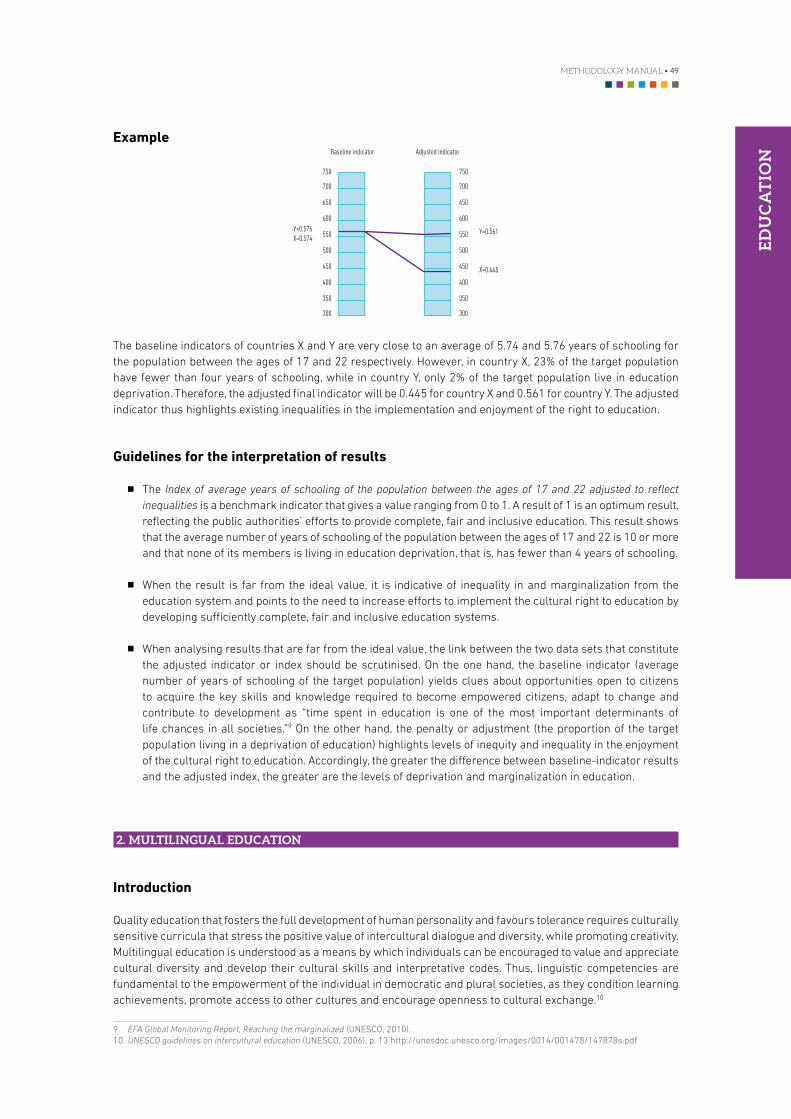
METHODOLOGY MANUAL • 49
ED
UC
AT
ION
Example
750
700
650
600
550
300
350
450
500
400
750
700
650
600
550
300
350
450
500
400
Baseline indicator Adjusted indicator
Y=0.576X=0.574
Y=0.561
X=0.445
The baseline indicators of countries X and Y are very close to an average of 5.74 and 5.76 years of schooling for the population between the ages of 17 and 22 respectively. However, in country X, 23% of the target population have fewer than four years of schooling, while in country Y, only 2% of the target population live in education deprivation. Therefore, the adjusted final indicator will be 0.445 for country X and 0.561 for country Y. The adjusted indicator thus highlights existing inequalities in the implementation and enjoyment of the right to education.
Guidelines for the interpretation of results
NN The Index of average years of schooling of the population between the ages of 17 and 22 adjusted to reflect inequalities is a benchmark indicator that gives a value ranging from 0 to 1. A result of 1 is an optimum result, reflecting the public authorities’ efforts to provide complete, fair and inclusive education. This result shows that the average number of years of schooling of the population between the ages of 17 and 22 is 10 or more and that none of its members is living in education deprivation, that is, has fewer than 4 years of schooling.
NN When the result is far from the ideal value, it is indicative of inequality in and marginalization from the education system and points to the need to increase efforts to implement the cultural right to education by developing sufficiently complete, fair and inclusive education systems.
NN When analysing results that are far from the ideal value, the link between the two data sets that constitute the adjusted indicator or index should be scrutinised. On the one hand, the baseline indicator (average number of years of schooling of the target population) yields clues about opportunities open to citizens to acquire the key skills and knowledge required to become empowered citizens, adapt to change and contribute to development as “time spent in education is one of the most important determinants of life chances in all societies.”9 On the other hand, the penalty or adjustment (the proportion of the target population living in a deprivation of education) highlights levels of inequity and inequality in the enjoyment of the cultural right to education. Accordingly, the greater the difference between baseline-indicator results and the adjusted index, the greater are the levels of deprivation and marginalization in education.
2. MULTILINGUAL EDUCATION
Introduction
Quality education that fosters the full development of human personality and favours tolerance requires culturally sensitive curricula that stress the positive value of intercultural dialogue and diversity, while promoting creativity. Multilingual education is understood as a means by which individuals can be encouraged to value and appreciate cultural diversity and develop their cultural skills and interpretative codes. Thus, linguistic competencies are fundamental to the empowerment of the individual in democratic and plural societies, as they condition learning achievements, promote access to other cultures and encourage openness to cultural exchange.10
9. EFA Global Monitoring Report, Reaching the marginalized (UNESCO, 2010). 10. UNESCO guidelines on intercultural education (UNESCO, 2006), p. 13 http://unesdoc.unesco.org/images/0014/001478/147878s.pdf
50 • UNESCO CULTURE FOR DEVELOPMENT INDICATORS
ED
UC
AT
ION
In an increasingly globalized world, learning one or more widely-used foreign languages is essential not only to increase opportunities for employment and professional development, but also to provide access to a wider range of cultural information, knowledge and expressions and to encourage interculturality.
However, multilingual education consists in learning not only a foreign language, but also local or regional languages used in that society, whether they be acknowledged as official languages or not. Indeed, the learning of those languages boosts the minority peoples’ educational opportunities and empowerment, further enhances understanding among social and cultural groups and builds social cohesion. Local and regional languages play a key role in conveying particular worldviews and different ways of meaning. Thus, the teaching of, and instruction in, those languages contributes to consolidate the value of each culture as a framework of meaning offering possibilities for personal development. Furthermore, these languages are generally spoken by linguistic minorities who face greater learning difficulties when taught in an unfamiliar language. The provision of education in their mother tongue, therefore, lessens inequalities of access to education and educational opportunities. Similarly, teaching materials and lessons based on the language and culture of the dominant group tend to further marginalize minorities.
In conclusion, the promotion of bilingualism and multilingualism, namely teaching two or more languages within the education system, yields important insights about the cultural sensitivity of the education curricula and the level of encouragement of interculturality. Moreover, it is directly linked to the respect of fundamental rights.11
>> Description: Percentage of instructional hours dedicated to promoting multilingualism in relation to the total number of instructional hours dedicated to languages in the first two years of secondary school (grades 7-8)
Purpose
To evaluate the extent to which multilingualism is promoted in basic secondary education as an approximation of the levels of promotion of interculturality, and valorization and understanding of cultural diversity within the education system, both at the national and international levels.
The annual percentage of instructional hours dedicated to promoting bilingualism or multilingualism in the first two years of secondary education, in relation to the total number of hours dedicated to teaching languages is therefore used as a proxy.
Definitions
Below are the working definitions for this indicator:12
Official school curriculum: This is based on the list of subjects taught and the instructional time allocated to these, the intended lessons or syllabi delineating the topics to be taught and official directives or guidelines concerning pedagogy and assessments.13
Bilingual and multilingual education is the use of two or more languages as media of instruction.14 Although the teaching of and instruction in two or more languages equally contributes to the promotion of multilingualism, only the instructional hours dedicated to teaching languages, be they international, local, regional, official or national, have been taken into account in devising this indicator.
Official or national languages taught in school: This refers to the combination of all instructional time allocated to the official language(s) of the country.
11. Multilingual education is “an essential component of intercultural education in order to encourage understanding between different population groups and ensure respect for fundamental rights”, Education in a multilingual world (UNESCO, 2003).
12. These definitions, with the exception of the definitions of bilingual and multilingual education and official school curriculum, are based on the International Bureau of Education (IBE) classifications: http://www.ibe.unesco.org/es.html. It must be borne in mind that these classifications are not necessarily the same as in Ethnologue: Languages of the World (Gordon, 2005, 15th edition, Dallas, SIL International): http://www.ethnologue.com.
13. Table 10 “Education and curricula“, in World Report Investing in cultural diversity and intercultural dialogue (UNESCO, 2009). 14. Education in a multilingual world (UNESCO, 2003).
METHODOLOGY MANUAL • 51
ED
UC
AT
ION
Local or regional languages taught in school: This refers to time devoted to non-official indigenous languages, namely, those spoken by a significant cultural minority in the country.
International languages taught in school: This refers to instructional time allocated to non-official international or exogenous languages.
Total annual instructional hours devoted to languages: This indicates the total time dedicated annually to teaching languages, whether international, local, regional, official or national. To calculate this value for each grade, three factors must be taken into account: (a) the length of the established school year; (b) the number of teaching periods allocated to each language in each grade, and (c) the average length of the aforementioned periods (of classes or hours), expressed in minutes.
Data Sources
NN National official school curriculum-based sources obtained from the Ministry of Education or other public bodies.
NN Most recent ‘World Data on Education’ report for your country, International Bureau of Education: www.ibe.unesco.org
NN Ethnologue. Languages of the World: http://www.ethnologue.com/ethno_docs/distribution.asp?by=country
Note: Even if your country is covered by the international sources suggested, they should be compared, whenever possible, with national official curriculum-based data sources, obtainable from
national educational or statistical bodies, so that data on the teaching of local or regional languages can be confirmed.
Calculation Method
In the relevant boxes in the Data Table:
1 . Enter the number of official or national languages in your country and the number of official or national languages taught during the first two years of secondary school as official or national languages (that is, not taught as “international languages” or “local or regional languages”);
2 . Enter the number of your country’s local or regional languages, as defined in the CDIS working definitions, and the number of local or regional languages taught in the first two years of secondary school;
Note: If the CDIS working definitions differ from your country’s definitions of “official or national languages”, “local or regional languages” and “international languages”, please give the national
definitions used to develop this indicator. UNESCO’s Atlas of the World’s Languages in Danger may also be used as a reference.15
15
3 . Use the relevant sources to identify the annual percentage of instructional hours dedicated to promote: - official or national languages; - local or regional languages and; - international languages; as a percentage of the total annual instructional hours dedicated to languages in the first two years of secondary school (grades 7-8).
Elective hours dedicated to teaching languages in the first two years of secondary school should not be considered for the construction of this indicator. Thus, when identifying the annual percentage of instructional hours dedicated to promoting official or national languages, local or regional languages, and international languages, please
15. See the interactive Atlas of the World’s languages in Danger at: http://www.unesco.org/culture/languages-atlas/index.php?hl=en&page=atlasmap
52 • UNESCO CULTURE FOR DEVELOPMENT INDICATORS
ED
UC
AT
ION
only take into consideration the compulsory instructional hours dedicated to teaching languages according to the official curricula. However, in order to improve the interpretation and contextualisation of the results, it is recommended to specify the possibility of elective hours dedicated to teaching languages in the ‘comments cell’ of the Data Table, as well as in the Technical Report.
Educational programmes greatly differ from one country to another. For example, distinct curricula may exist due to the presence of multiple educational programmes or regional particularities. In such cases, it is recommended to calculate the average of the instructional hours dedicated to promoting official or national languages, local or regional languages, and international languages based on the the distinct official curricula.
Note: The relevant annual percentages of instructional hours should be entered, as indicated, in the Data Table. However, the total number of instructional hours dedicated to each type of language
taught may also be used.
The result for the indicator is produced automatically once the relevant data is included in the Data Table. In order to measure the annual percentage of instructional hours dedicated to promoting multilingualism in the first two years of secondary school in relation to the total annual hours of teaching dedicated to languages, the indicator calculates the annual percentage of instructional hours dedicated to local or regional languages and international languages. Furthermore, in order to acknowledge and highlight the effort, investment and priority given to multilingualism when more than one national language is not only officially recognized but also taught in the education system – and particularly in secondary education – the final indicator result is increased as follows: when two official or national languages are taught in secondary schools, by a percentage equivalent to half of the value of the annual percentage of instructional hours dedicated to official or national languages; when three official or national languages are taught, it is increased by two-thirds of that value, and so on.
In order to facilitate the interpretation of results, a graph is automatically generated in the Data Table depicting the breakdown of teaching time awarded to the three types of languages studied. This graph illustrates the respective importance awarded to each type of language, in regards to the teaching time allocated.
Formula
Indicator = ILR + II + (1 - 1B ) x ION
Where:NN ION is the annual percentage of instructional hours dedicated to official or national languages during
the first two years of secondary school, in relation to the total number of hours dedicated to teaching languages;
NN ILR is the annual percentage of instructional hours dedicated to local or regional languages during the first two years of secondary school, in relation to the total number of hours dedicated to teaching languages;
NN II is the annual percentage of instructional hours dedicated to international languages during the first two years of secondary school, in relation to the total number of hours dedicated to teaching languages;
NN B is the number of official or national languages taught in secondary school.
Guidelines for the interpretation of results
NN This is a contextual and descriptive indicator intended to evaluate the extent to which multilingualism, interculturality and cultural diversity valorization and understanding (at both national and international levels) are encouraged in basic secondary education.
NN The indicator value varies from 0 to 100%, with 0% representing a situation in which, during the first two years of secondary school (grades 7-8), 100% of the instructional hours dedicated to teaching languages are used to promote only one official or national language and 100% representing a situation in which,

METHODOLOGY MANUAL • 53
ED
UC
AT
ION
during the first two years of secondary school (grades 7-8), 0% of the instructional hours dedicated to teaching languages is used to promote at least one official or national language.
NN It is, therefore, important to stress that the interpretation of the results of this indicator, intended to evaluate the level of promotion of multilingualism in the education system, will differ from one national context to another and that an effort must be made to interpret and compare the results with other CDIS indicators so that the results will be more meaningful and significant. A low percentage of hours dedicated to teaching at least a second language (whether official, regional, local or international) generally means that linguistic diversity is not encouraged through education and that efforts fall short when promoting interculturality and enhancing the valorization of cultural diversity, both nationally and internationally. Nor is 100% an ideal result, as it denotes disregard for secondary-school pupils’ needs to continue to learn at least one official or national language, which strengthens their own identity and basic skills acquisition for full personal capacity building and continued learning.
NN When interpreting and contextualizing the results, the number of national, official, local and regional languages existing in the country must be taken into account in order to gauge the extent to which that country’s own linguistic diversity is held in high regard, promoted and appreciated. It is similarly interesting to compare language teaching in primary and secondary schools whenever possible in order to analyse trends in the teaching of the various types of languages studied throughout the school curriculum.
NN Lastly, this contextual or descriptive indicator provides qualitative information on the national education system, complementing the data obtained from the other Education core indicators.
Note: The first CDIS test phase showed that it was difficult to use the proposed indicator to give prominence to the (often recent) efforts made nationally to enhance and promote linguistic diversity
in the education system, particularly in regard to local or regional languages. Therefore, if the main indicator proposed yields inconclusive results, one or more additional indicators based on relevant national sources should be used to complement this dimension and permit an evaluation of the extent to which the public authorities encourage and/or restrict the teaching of and instruction in local or regional and minority and/or indigenous language(s) in the education system.
For example, during the first test phase, one of the test countries devised two additional indicators in order to reflect efforts to boost bilingual education and revitalize and spread the country’s indigenous languages, on the one hand, and, on the other hand, to strengthen indigenous ethnic and cultural identity, through knowledge and the enhanced value of traditional practices and indigenous values, know-how, skills and wisdom.
Additional indicators submitted:NN Coverage in indigenous areas of schools teaching lessons in indigenous languages (Indigenous schools
teaching lessons in indigenous languages/Total number of indigenous schools).NN Coverage in indigenous areas of schools providing lessons on indigenous culture (Indigenous schools
providing lessons on indigenous culture/Total number of indigenous schools). Source: Department of Indigenous Education of the Ministry of Public Education
3. ARTS EDUCATION
Introduction
Like multilingual education, arts education is important for human development and favouring the development of cultural skills and human creativity. The purpose of arts education is to develop individual skills including cognitive and creative skills, implement human and cultural rights to education, foster cultural participation and improve the quality of education.16
16. See: http://portal.unesco.org/culture/es/ev.php-URL_ID=30335&URL_DO=DO_TOPIC&URL_SECTION=201.html
54 • UNESCO CULTURE FOR DEVELOPMENT INDICATORS
ED
UC
AT
ION
Arts education nurtures creativity and innovation, strengthens creative and artistic talent and provides a basis for the appreciation of cultural expressions and diversity by educating the public and broadening horizons for personal development and cultural participation. Arts education is therefore recommended as a component of school curricula throughout schooling (primary and secondary).
>> Description: Percentage of instructional hours dedicated to arts education in relation to the total number of instructional hours in the first two years of secondary school (grades 7-8)
Purpose
To evaluate the extent to which arts education is valued in basic secondary education as an approximation of the levels of encouragement in the education system of creativity and creative talents, as well as the promotion of the appreciation of cultural expressions and the “desire for culture” among the youth.
The percentage of yearly instructional hours dedicated to arts education during the first two years of secondary school (grades 7-8) is, therefore, used as a proxy.
Definitions
The following working definitions have been built into this indicator:17
Arts education: consists of many sub-disciplines such as drawing, painting, sculpture, design, craft skills, music,
drama, literature, dance, circus, photography, digital arts, cinematography and video and new emerging forms of popular artistic expression.18
Yearly instructional hours dedicated to arts education: means the total time dedicated to arts education per year, for the first two years of secondary school. To calculate this quantity for each grade and country, three components are taken into account: (a) the duration of the working school year; (b) the number of teaching periods allocated to each arts subject in each grade level; and (c) the average duration of these aforementioned periods (lessons or hours), expressed in minutes.
Official school curriculum: This is based on the list of subjects taught and the instructional time allocated to these, the intended lessons or syllabi delineating the topics to be taught and official directives or guidelines concerning pedagogy and assessments.
Data Sources
NN Official school curricula and national official statistics based on the former, that may be obtained from the Ministry of Education or other relevant public bodies;
NN Most recent ‘World Data on Education’ report for your country, International Bureau of Education: www.ibe.unesco.org
Calculation Method
Using the official school curriculum, identify the percentage of annual instructional hours intended for arts education in relation to the total number of instructional hours for all subjects in the first two years of secondary school (grades 7-8), and insert the result in the relevant Data Table.
17. These definitions, with the exception of the definition of “art education” are taken from Table 10 “Education and curricula“, in World Report Investing in cultural diversity and intercultural dialogue (UNESCO, 2009).
18. This working definition is based on Informe sobre la encuesta de implementación del plan de trabajo para la educación artística [Report on the investigation into the implementation of the working plan for artistic education] (UNESCO, 2010), p. 14
METHODOLOGY MANUAL • 55
ED
UC
AT
ION
Elective hours dedicated to teaching arts in the first two years of secondary school should not be considered for the construction of this indicator. Thus, when identifying the percentage of instructional hours dedicated to arts education, please only take into consideration the compulsory instructional hours according to the official curricula. However, in order to improve the interpretation and contextualisation of the results, it is recommended to specify the possibility of elective hours dedicated to arts education in the ‘comments cell’ of the Data Table, as well as in the Technical Report.
Educational programmes greatly differ from one country to another. For example, distinct curricula may exist due to the presence of multiple educational programmes or regional particularities. In such cases, it is recommended to calculate the average of the instructional hours dedicated to arts education based on the distinct official curricula.
In all cases, in the Technical Report please specify the sources, method of calculation and formulae used at the national level, as well as the sub-disciplines included in arts education according to the official school curriculum.
Note: When, and only when, the indicator cannot be constructed using national sources, Table 10 “Education and curricula” in the 2009 UNESCO World Report Investing in cultural diversity and
intercultural dialogue19 could be used as a source to construct an alternative indicator. In this case, please insert, in the relevant Data Table, the data for your country taken from the “Arts” sub-column in the “Emphasis on Curriculum Categories as % of Median Yearly Instructional Hours” for grades 7-8. This result represents the percentage of median yearly instructional hours dedicated to arts education during the first two years of secondary school (grades 7-8).
19
Example
In Country X, in 2010, the yearly instructional hours in arts, in relation to the total instructional hours, was 10.9% in primary schools (grades 1-6) and 3.3% in the first two years of secondary school (grades 7-8).
Guidelines for the interpretation of results
NN This is a contextual and descriptive indicator for evaluating how much value and emphasis is given in the first two years of secondary school to promoting creativity and creative talent as well as to educating the public to appreciate cultural expressions and cultivating their “desire for culture.”
NN The indicator result is expressed as a percentage. This must be interpreted in the light of the national context, bearing in mind world and regional averages as well as the ratio, in terms of instructional hours, to other academic disciplines. It is also interesting to observe trends in the average of the yearly instructional hours intended for arts education from grades 1-6 (primary education) and 7-8 (first two years of secondary school) in order to evaluate the extent to which arts education is appreciated throughout school life and regarded as a core subject. In order to facilitate the recommended comparisons and analyses, reference may be made to data in Table 10, “Education and curricula”, in UNESCO World Report Investing in cultural diversity and intercultural dialogue.
NN This contextual and descriptive indicator also provides qualitative information on the national education system, complementing the data obtained from the other core indicators of the CDIS Education dimension.
19. Table 10 “Education and curricula”, World Report Investing in cultural diversity and intercultural dialogue (UNESCO, 2009), pp. 320-327
56 • UNESCO CULTURE FOR DEVELOPMENT INDICATORS
ED
UC
AT
ION
4. PROFESSIONAL TRAINING IN THE CULTURE SECTOR
Introduction
To tap into the full economic and developmental potential of culture, current and future cultural operators and professionals must be able to acquire and develop artistic, creative, technical, technological and managerial skills and competences so that they may express and manifest their creativity, transform it into economically viable activities, goods and services and effectively manage cultural businesses, institutions and events (museums, festivals, cultural business ventures, SMEs, etc.). The importance of technical and cultural management training should therefore be stressed. Indeed, although skills such as identifying possible sources of revenue, balancing budgets and managing an organization are common to other business sectors, the special characteristics of the culture sector call for considering culture-specific aspects in order to reinforce artistic abilities through entrepreneurship and management skills.
Ultimately, appropriate technical, vocational and tertiary training is as essential to artistic and creative fields (which are the raw materials of cultural industries and activities) as it is to cultural management (which allows those industries and activities to be consolidated and economically viable). Indeed, the existence of a comprehensive educational framework covering different types of training (technical/vocational and tertiary/higher) and the multiple cultural fields or domains (visual arts, performing arts, audio-visual, heritage, books and publishing, design, etc.), is essential to foster the emergence and consolidation of a creative class and a body of competent and dynamic cultural professionals capable of maximizing the economic and social potential of culture in order to boost their own and their communities’ development. The existence of a coherent and complete technical and tertiary educational framework in the field of culture is therefore one of the decisive factors in encouraging the creation of enabling environments for the emergence of a dynamic culture sector, as enshrined in the Convention on the Protection and Promotion of the Diversity of Cultural Expressions.20
The Culture for Development Indicators (CDIS) and the Millennium Development Goals (MDGs): This core indicator is related to MDG 1 “Eradicate extreme poverty and hunger”, particularly the second target of achieving full and productive employment and decent work for all, including women and young people. As an endogenous capacity-builder and promoter of human rights, sustainable development and democracy, quality technical and tertiary education in the field of culture is instrumental in promoting knowledge-based societies, which are key factors of cultural, economic and social development.
>> Description: Index of coherency and coverage of technical and vocational education and training (TVET) and tertiary education systems in the field of culture
Purpose
The purpose of this indicator is to evaluate the extent to which the public and private-dependent national education system is sufficiently comprehensive in providing various types of training (technical, vocational and tertiary) in different cultural fields to current and future cultural professionals. Significant insights are thus obtained on the levels of public-sector investment aimed at fostering the emergence of a dynamic and competitive “creative class.”
To that end, the existence of government-funded educational institutions, both public and private, for technical or vocational, and tertiary or higher education in the 5 selected cultural fields (heritage, music, fine/visual/applied arts, cultural management and film/image) is used as a proxy.
Definitions
Below are the working definitions for this indicator:
20. Specifically Article 14 “Cooperation for development” of the Convention on the Protection and Promotion of the Diversity of Cultural Expressions.
METHODOLOGY MANUAL • 57
ED
UC
AT
ION
Tertiary education: “Any education entered after successful completion of secondary education, which may include vocational post-secondary education (leading to a certificate) and higher education (leading to a degree)”.21
Technical education: This comprehensive term refers to those aspects of the educational process involving, in addition to general education, the study of technologies and related sciences, and the acquisition of practical skills, attitudes, understanding and knowledge relating to occupations in various sectors of economic and social life. Technical and vocational education is further understood to be: (a) an integral part of general education; (b) a means of preparing for occupational fields and for effective participation in the world of work; (c) an aspect of lifelong learning and a preparation for responsible citizenship; (d) an instrument for promoting sustainable development that respects the environment.22
In developing this indicator, consideration must be given to educational institutions that: i) provide training aimed at professionals in the culture sector, including professions that support the creation, production and distribution of cultural activities, goods and services (sound, lighting, etc.); ii) whose courses are consistent with the aforementioned characteristics and are aimed at young people or adults without requiring them to have successfully completed secondary education; and iii) whose courses and trainings result in some form of officially recognized certificate or diploma.
Educational institutions are entities that provide instructional or education-related services to individuals and other educational institutions.23
Public educational institutions are classified as either public or private according to whether a public agency or a private entity has the ultimate power to make decisions concerning the institution’s affairs. An institution is classified as public if it is controlled and managed directly by a public education authority or agency, or controlled and managed either by a government agency directly or by a governing body (council, committee, etc.), most of whose members are either appointed by a public authority or elected by public franchise.24
Government-dependent private institution: A distinction is made between government-dependent and independent private institutions on the basis of the degree of a private institution’s dependence on funding from government sources. A government-dependent private institution is one that receives more than 50% of its core funding from government agencies. An independent private institution is one that receives less than 50% of its core funding from government agencies.25
Note: In many countries, private institutions and associations provide most or all technical and vocational training courses. For the purposes of the CDIS, only private institutions and/or associations
that may be characterized as “government-dependent private institutions” in accordance with the proposed working definition are taken into account.
Data Sources
NN National official sources obtained from the Ministry of Education or other relevant public body.NN UNESCO Online Portal to Recognized Higher Education Institutions.26
21. Campbell, C. & Rozsnyai, C., Quality Assurance and the Development of Course Programmes, Papers on Higher Education Regional University Network on Governance and Management of Higher Education in South-East Europe (UNESCO, 2002).
22. Revised Recommendation concerning Technical and Vocational Education (UNESCO, 2001): http://unesdoc.unesco.org/images/0012/001246/124687e.pdf
23. Global Education Digest 2010, Comparing Education Statistics Across the World, (UIS, 2010), pp. 261-262 24. Global Education Digest 2010, Comparing Education Statistics Across the World (UIS, 2010), pp. 261-262 25. Global Education Digest 2010, Comparing Education Statistics Across the World (UIS, 2010), pp. 261-26226. See: http://www.unesco.org/new/en/education/resources/unesco-portal-to-recognized-higher-education-institutions
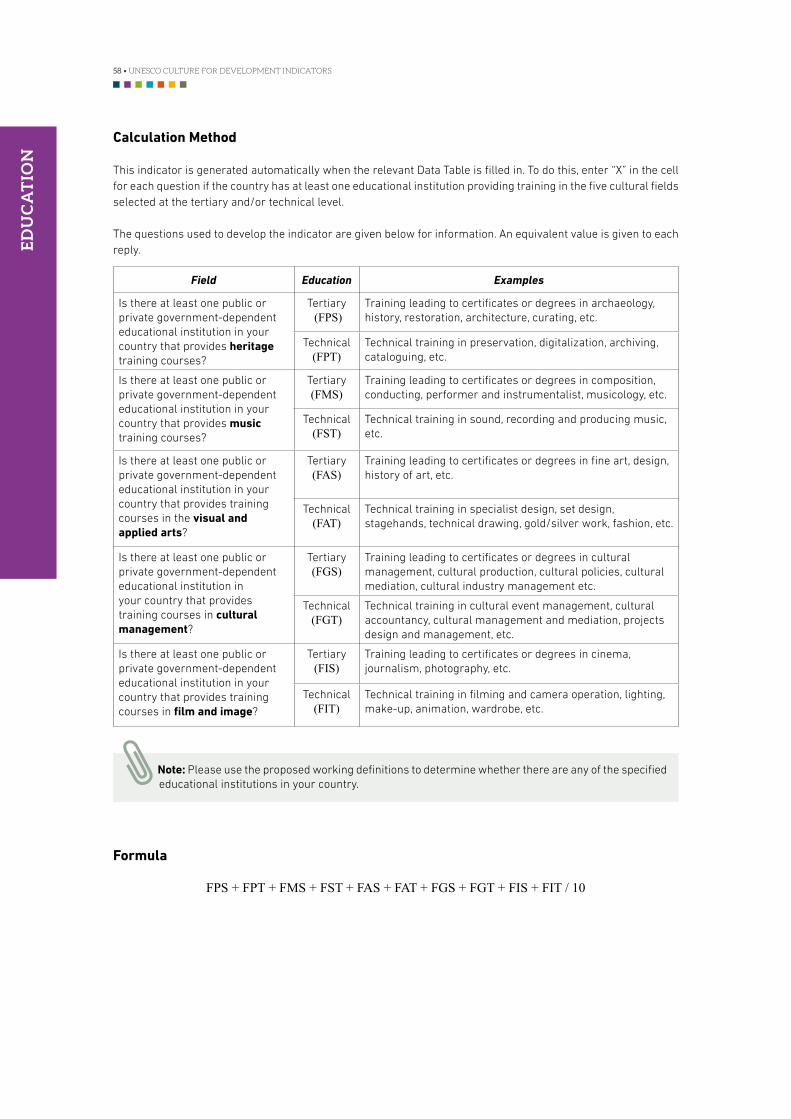
58 • UNESCO CULTURE FOR DEVELOPMENT INDICATORS
ED
UC
AT
ION
Calculation Method
This indicator is generated automatically when the relevant Data Table is filled in. To do this, enter “X” in the cell for each question if the country has at least one educational institution providing training in the five cultural fields selected at the tertiary and/or technical level.
The questions used to develop the indicator are given below for information. An equivalent value is given to each reply.
Field Education Examples
Is there at least one public or private government-dependent educational institution in your country that provides heritage training courses?
Tertiary (FPS)
Training leading to certificates or degrees in archaeology, history, restoration, architecture, curating, etc.
Technical(FPT)
Technical training in preservation, digitalization, archiving, cataloguing, etc.
Is there at least one public or private government-dependent educational institution in your country that provides music training courses?
Tertiary(FMS)
Training leading to certificates or degrees in composition, conducting, performer and instrumentalist, musicology, etc.
Technical(FST)
Technical training in sound, recording and producing music, etc.
Is there at least one public or private government-dependent educational institution in your country that provides training courses in the visual and applied arts?
Tertiary(FAS)
Training leading to certificates or degrees in fine art, design, history of art, etc.
Technical(FAT)
Technical training in specialist design, set design, stagehands, technical drawing, gold/silver work, fashion, etc.
Is there at least one public or private government-dependent educational institution in your country that provides training courses in cultural management?
Tertiary(FGS)
Training leading to certificates or degrees in cultural management, cultural production, cultural policies, cultural mediation, cultural industry management etc.
Technical(FGT)
Technical training in cultural event management, cultural accountancy, cultural management and mediation, projects design and management, etc.
Is there at least one public or private government-dependent educational institution in your country that provides training courses in film and image?
Tertiary(FIS)
Training leading to certificates or degrees in cinema, journalism, photography, etc.
Technical(FIT)
Technical training in filming and camera operation, lighting, make-up, animation, wardrobe, etc.
Note: Please use the proposed working definitions to determine whether there are any of the specified educational institutions in your country.
Formula
FPS + FPT + FMS + FST + FAS + FAT + FGS + FGT + FIS + FIT / 10
METHODOLOGY MANUAL • 59
ED
UC
AT
ION
Guidelines for the interpretation of results
NN The Degree of coherency and coverage of the national technical and tertiary education system in the field of culture is a benchmark indicator that gives a result ranging from 0 to 1. A result of 1 or close to 1 shows that the national public and government-dependent private education system is largely consistent and comprehensive in offering to current and future cultural professionals various types of training courses (technical, vocational and tertiary or higher) in different fields of culture-related studies and that the national authorities are manifestly interested and willing to invest in this field. Indeed, a result close to 1 means that the country provides a varied and coherent range of training at various levels in the field of culture, covering a variety of interrelated and interdependent spheres, in line with the needs of the various links in the value chain of the cultural cycle. Thus, when the result is far from the benchmark, special attention should be paid to any uncovered fields or spheres and types of training. Indeed, such lack of provision can hinder the emergence of a dynamic cultural class and the development of competitive local cultural enterprises and industries.
NN To better understand the significance of the results, these should be analysed and interpreted against the
national context and compared with other CDIS Education indicators and with CDIS indicators for other dimensions, such as economy, participation and social cohesion, governance and communication.

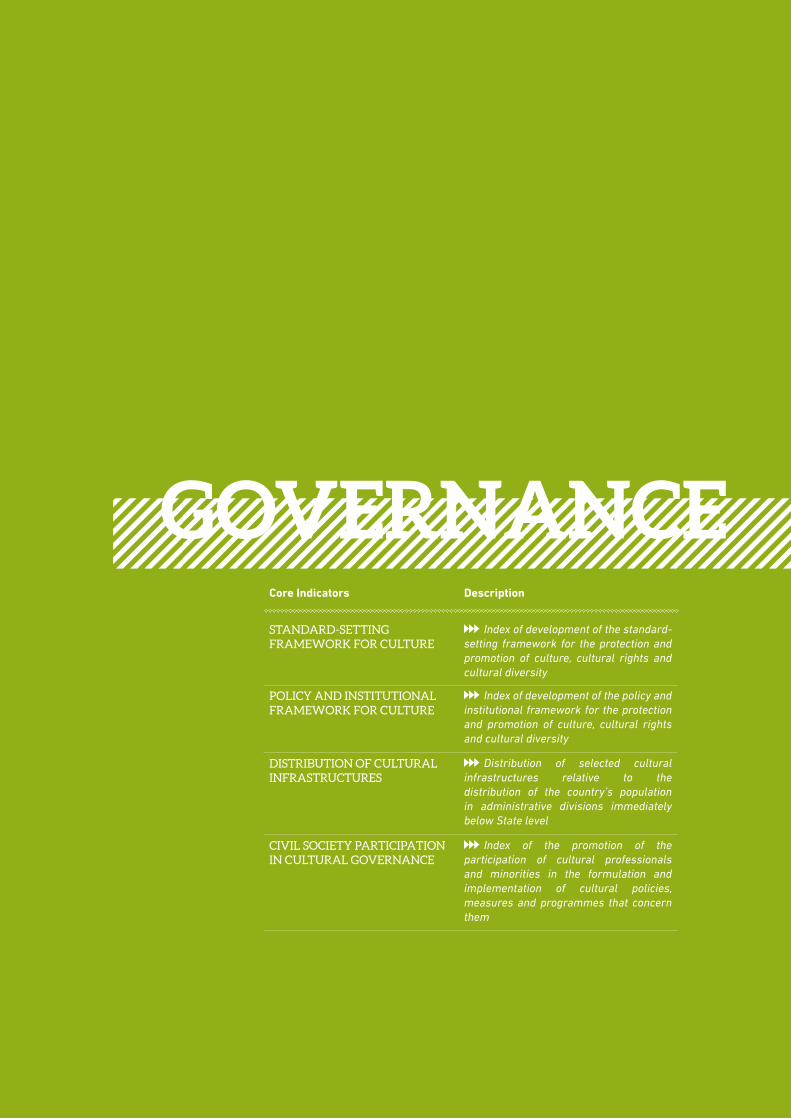
Core Indicators Description
STANDARD-SETTING FRAMEWORK FOR CULTURE
Index of development of the standard-setting framework for the protection and promotion of culture, cultural rights and cultural diversity
POLICY AND INSTITUTIONAL FRAMEWORK FOR CULTURE
Index of development of the policy and institutional framework for the protection and promotion of culture, cultural rights and cultural diversity
DISTRIBUTION OF CULTURAL INFRASTRUCTURES
Distribution of selected cultural infrastructures relative to the distribution of the country’s population in administrative divisions immediately below State level
CIVIL SOCIETY PARTICIPATION IN CULTURAL GOVERNANCE
Index of the promotion of the participation of cultural professionals and minorities in the formulation and implementation of cultural policies, measures and programmes that concern them
GOVERNANCE
62 • UNESCO CULTURE FOR DEVELOPMENT INDICATORS
GO
VE
RN
AN
CE
I. RELEVANCE OF THE DIMENSION FOR CULTURE AND DEVELOPMENT
This dimension deals with regulations, policies, measures, institutional mechanisms and cultural infrastructures put in place by public authorities to structure dynamic cultural sectors, strengthen cultural processes, and protect and promote cultural diversity in all its forms.1 It provides an overview of a country’s system of cultural governance and institutionality, thus offering a first insight of the conditions under which cultural rights are exercised. The exercise of these rights is considered a crucial element in the process of developing peaceful societies in which individuals have the opportunity to lead full, creative lives in accordance with what they value, and thus in promoting inclusive, rights-based human development.2
Cultural governance encompasses, on the one hand, standard-setting frameworks and public policies and, on the other hand, institutional capabilities and cultural infrastructures. All four aspects are recognized as indispensable for the creation of favourable environments that enable culture to fully contribute to human development.3 Similarly, UNESCO promotes a cultural approach to development, on the grounds that recognizing the cultural specificity of lifestyles, production methods and forms of governance is vital to sustainable development.4
Objective of the Dimension
This dimension addresses the degree of commitment and action by the public authorities in formulating and implementing standard-setting, policy and institutional frameworks and making available infrastructures and institutional mechanisms that serve to achieve participatory and inclusive cultural development, implement cultural rights, promote diversity and boost the development potential of culture.
The aim is to evaluate commitments, efforts and results in relation to cultural governance and institutionality and to address the processes through which cultural policies are formulated and implemented and cultural rights recognized and applied.
Thereby, the purpose is to analyse the standard-setting and institutional system and mechanisms of culture with a view to gain a better understanding of the challenges, potential, and shortcomings in this area in light of national development needs.
II. DATA SOURCESThe standard-setting framework indicator is a structural indicator based on instruments of protection for cultural rights and promotion of cultural development and cultural diversity. Consequently, data is mainly available from the databases of United Nations agencies and from national legislative databases and official journals. Some of the most useful sources of international data are:
NN Office of the High Commissioner for Human Rights: http://www.ohchr.org/EN/Pages/WelcomePage.aspx NN United Nations Office of Legal Affairs: http://untreaty.un.org/olaNN UNESCO databases: www.unesco.org
1. For CDIS purposes, cultural diversity is understood in its broad meaning following the Universal Declaration on Cultural Diversity (2001). Article 4 of the Convention on the Protection and Promotion of the Diversity of Cultural Expressions (2005) specifies: “Cultural diversity refers to the manifold ways in which the cultures of groups and societies find expression. These expressions are passed on within and among groups and societies. Cultural diversity is made manifest not only through the varied ways in which the cultural heritage of humanity is expressed, augmented and transmitted through the variety of cultural expressions, but also through diverse modes of artistic creation, production, dissemination, distribution and enjoyment, whatever the means and technologies used.” Cultural diversity thus means the manifold forms of expression of the cultures of groups and societies that constitute identity and meaning and are a source of inspiration for the creativity of present and future generations. At least 14 UNESCO standard-setting instruments, including conventions, declarations and recommendations, directly or indirectly promote cultural diversity in this broad meaning (see http://www.unesco.org/new/en/culture/themes/normative-action/cultural-diversity/).
2. A full analysis of the conditions under which cultural rights are implemented and exercised requires a transversal reading of the whole set of indicators dealing with the implementation and enjoyment of such rights, using the CDIS matrix of indicators.
3. “Human development requires more than health, education, a decent standard of living and political freedom. People’s cultural identities must be recognized and accommodated by the state, and people must be free to express these identities without being discriminated against in other aspects of their lives.” United Nations Development Programme (UNDP), Human Development Report 2004 (New York, 2004), p. 6.
4. UNESCO, World Report 2009, pp. 178-181.
METHODOLOGY MANUAL • 63
GO
VE
RN
AN
CE
The indicators for policy and institutional framework, cultural infrastructures and civil society participation in cultural governance are structural and process indicators. Data is mainly available from national legislative and administrative databases, cultural atlases, directories, national studies and official journals.
Note: In view of the availability of data internationally, the proposed indicators are mainly structural indicators (reflecting the ratification and adoption of legal instruments, their incorporation into
national law and the existence of basic institutional mechanisms to facilitate the realization of rights) measuring de jure compliance with internationally agreed treaties and principles and, to a lesser extent, process indicators (showing the policy instruments and efforts deployed de facto to implement cultural rights and internationally agreed culture and development principles). It is hoped that the problems identified and the methodologies developed in the course of generating structural indicators will provide a basis for expanding the range of indicators, thus creating more solid process indicators, and if possible, results or output indicators (which measure de facto enjoyment of rights and the efficiency and effectiveness of the policies implemented).
II. CORE INDICATORS
1. STANDARD-SETTING FRAMEWORK FOR CULTURE
Introduction
As in other areas of intervention, States’ positions regarding culture are officially expressed in the standard-setting instruments adopted at the international and regional levels (which embody the obligations entered into and the principles accepted) and those adopted at the national level (which express the efforts made to operationalize and implement them effectively).
Thus, the level of commitment to internationally agreed standards relating to culture, cultural diversity and cultural rights provides a structural indication of the degree of priority given to culture and the approaches and areas of work prioritized by the public authorities.
In addition, national standards, laws and regulations prescribe action to be taken by the different State administrations and other interested parties in the private sector and civil society and provide valuable information on the main objectives of public action in the cultural sphere. They also play a crucial role in creating environments conducive to the emergence of dynamic cultural sectors and the promotion of cultural vitality.
>> Description: Index of development of the standard-setting framework for the protection and promotion of culture, cultural rights and cultural diversity
Purpose
This indicator analyses the following aspects:
NN the extent to which the key international legal instruments affecting cultural development, cultural rights and cultural diversity have been ratified and/or adopted, and national legal frameworks established to recognize and implement the obligations accepted;
NN the extent to which national legislation and regulations govern the interventions implemented by the State and other interested parties which aim to promote cultural sectors and processes from a development perspective;
NN the fundamental goals and approaches of public cultural policy and action.
64 • UNESCO CULTURE FOR DEVELOPMENT INDICATORS
GO
VE
RN
AN
CE
Definition
Standard-setting framework for culture: This refers to the whole body of culture-related constitutional, legal and regulatory provisions in force in a State, and the international, regional or bilateral treaties and instruments it has ratified.
Calculation Method
This is a qualitative structural indicator presented as a checklist. To assess the degree of development of the standard-setting framework for the protection and promotion of culture, cultural rights and cultural diversity, a number of basic components have been selected and classified into two major levels.
1 . The supranational or international level, encompassing a number of legal instruments whose ratification or adoption demonstrates the commitment and resolve of public authorities to implement measures that give effect to the principles, areas of action and rights for which they provide. The ratification of an international or regional treaty or the signing of a bilateral cultural cooperation agreement is not a neutral act. It is evidence of a particular concern about the issue addressed and a determination to take action in that regard. This level, whose overall weighting in the final indicator is one third of the total value, comprises four components:
a . main binding international instruments affecting the cultural sphere that have been ratified by the State (weighting: 40% of the total for the level);
b . universal recommendations and declarations (also known as soft law)5 whose content and principles have been specifically incorporated into national laws and/or regulations and therefore integrated into the country’s standard-setting provisions (weighting: 10% of the total for the level);
c . binding regional instruments ratified by the State, revealing the resolve of the public authorities to strengthen, refine and complete the commitments adopted internationally (weighting: 25% of the total for the level); and
d . bilateral cultural cooperation agreements signed by the State, reflecting an intention to give high priority to the cultural sphere in bilateral relations (weighting: 25% of the total for the level).
2 . The national level, focusing on a country’s domestic law and standard-setting framework, allows an assessment of whether the national standard-setting framework incorporates and builds on the obligations accepted and principles agreed upon at the supranational level and results in, or at least contributes to, the promotion of cultural sectors and processes from a development perspective. This level, whose weighting is two thirds of the final indicator, comprises two components:
a . the national constitution, the essential consideration being the extent to which it enshrines the main cultural rights6 (weighting: 1/3 of the total for the national level); and
b . national laws and regulations, which provide an overview of the national standard-setting framework organizing the actions of the different State administrations and other interested parties in the sphere of culture, indications of which cultural sectors are deemed to be of national priority for cultural, historical or economic reasons, and valuable information about the main goals and approaches of public policy and action in the cultural sphere (weighting: 2/3 of the total for the national level).
A specific value has been assigned to each of the two levels of the standard-setting framework indicator. Thus, the national level has twice the weight of the supranational level, since its impact on the effective realization
5. Even though international recommendations and declarations are considered “soft law” insofar as they have no binding force and are not directly applicable, they can have great legal importance. These standard-setting instruments contain guidelines, political declarations or codes of conduct that exert pressure on States and other actors to adopt a particular approach or to act in a certain way in a specific cultural sphere. Recommendations and declarations can become “hard law” in future binding agreements, or can lead to the creation of ordinary law. It is also possible that they may be taken into account and even integrated into national standard-setting and/or political systems (very often as a result of civil society influence). This last assumption is the one analyzed as part of the CDIS “Standard-setting Framework” indicator.
6. As there is no universally accepted catalogue of cultural rights, the list included in the UNESCO World Report Investing in Cultural Diversity and Intercultural Dialogue has been taken as the starting point for CDIS purposes. Cultural rights are therefore held to include: (i) the right to an education that fully respects cultural identity; (ii) the right to participate in cultural life; (iii) the right to benefit from scientific progress and its applications; (iv) the right to protection of moral and material interests resulting from any scientific, literary or artistic production of which the person concerned is the author; and (v) the free exercise of scientific research and creative activity.
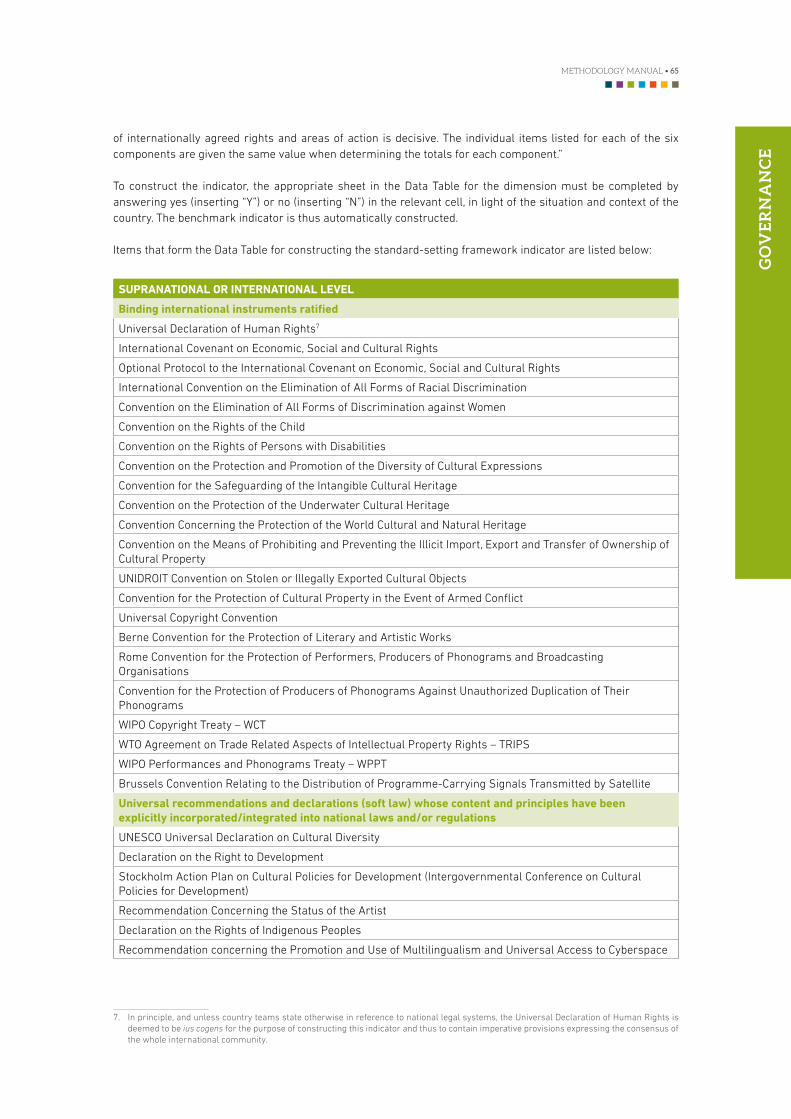
METHODOLOGY MANUAL • 65
GO
VE
RN
AN
CE
of internationally agreed rights and areas of action is decisive. The individual items listed for each of the six components are given the same value when determining the totals for each component.”
To construct the indicator, the appropriate sheet in the Data Table for the dimension must be completed by answering yes (inserting “Y”) or no (inserting “N”) in the relevant cell, in light of the situation and context of the country. The benchmark indicator is thus automatically constructed.
Items that form the Data Table for constructing the standard-setting framework indicator are listed below:7
SUPRANATIONAL OR INTERNATIONAL LEVEL
Binding international instruments ratified
Universal Declaration of Human Rights7
International Covenant on Economic, Social and Cultural Rights
Optional Protocol to the International Covenant on Economic, Social and Cultural Rights
International Convention on the Elimination of All Forms of Racial Discrimination
Convention on the Elimination of All Forms of Discrimination against Women
Convention on the Rights of the Child
Convention on the Rights of Persons with Disabilities
Convention on the Protection and Promotion of the Diversity of Cultural Expressions
Convention for the Safeguarding of the Intangible Cultural Heritage
Convention on the Protection of the Underwater Cultural Heritage
Convention Concerning the Protection of the World Cultural and Natural Heritage
Convention on the Means of Prohibiting and Preventing the Illicit Import, Export and Transfer of Ownership of Cultural Property
UNIDROIT Convention on Stolen or Illegally Exported Cultural Objects
Convention for the Protection of Cultural Property in the Event of Armed Conflict
Universal Copyright Convention
Berne Convention for the Protection of Literary and Artistic Works
Rome Convention for the Protection of Performers, Producers of Phonograms and Broadcasting Organisations
Convention for the Protection of Producers of Phonograms Against Unauthorized Duplication of Their Phonograms
WIPO Copyright Treaty – WCT
WTO Agreement on Trade Related Aspects of Intellectual Property Rights – TRIPS
WIPO Performances and Phonograms Treaty – WPPT
Brussels Convention Relating to the Distribution of Programme-Carrying Signals Transmitted by Satellite
Universal recommendations and declarations (soft law) whose content and principles have been explicitly incorporated/integrated into national laws and/or regulations
UNESCO Universal Declaration on Cultural Diversity
Declaration on the Right to Development
Stockholm Action Plan on Cultural Policies for Development (Intergovernmental Conference on Cultural Policies for Development)
Recommendation Concerning the Status of the Artist
Declaration on the Rights of Indigenous Peoples
Recommendation concerning the Promotion and Use of Multilingualism and Universal Access to Cyberspace
7. In principle, and unless country teams state otherwise in reference to national legal systems, the Universal Declaration of Human Rights is deemed to be ius cogens for the purpose of constructing this indicator and thus to contain imperative provisions expressing the consensus of the whole international community.
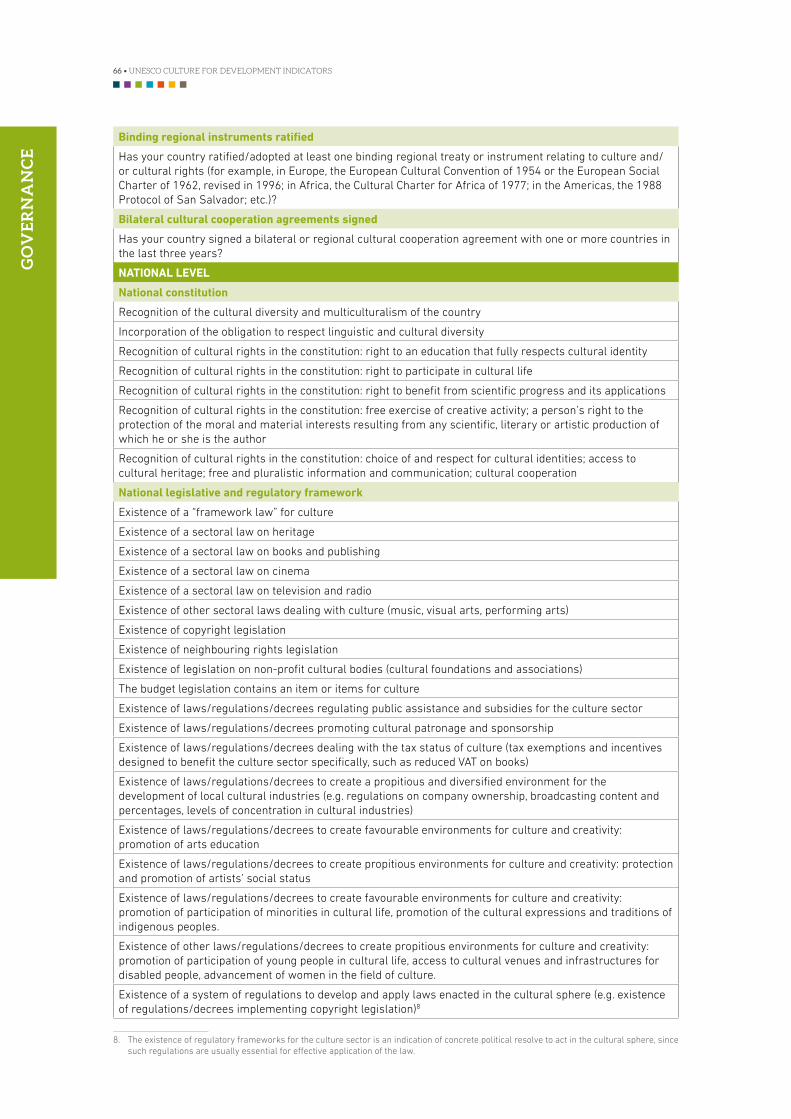
66 • UNESCO CULTURE FOR DEVELOPMENT INDICATORS
GO
VE
RN
AN
CE
8
8. The existence of regulatory frameworks for the culture sector is an indication of concrete political resolve to act in the cultural sphere, since such regulations are usually essential for effective application of the law.
Binding regional instruments ratified
Has your country ratified/adopted at least one binding regional treaty or instrument relating to culture and/or cultural rights (for example, in Europe, the European Cultural Convention of 1954 or the European Social Charter of 1962, revised in 1996; in Africa, the Cultural Charter for Africa of 1977; in the Americas, the 1988 Protocol of San Salvador; etc.)?
Bilateral cultural cooperation agreements signed
Has your country signed a bilateral or regional cultural cooperation agreement with one or more countries in the last three years?
NATIONAL LEVEL
National constitution
Recognition of the cultural diversity and multiculturalism of the country
Incorporation of the obligation to respect linguistic and cultural diversity
Recognition of cultural rights in the constitution: right to an education that fully respects cultural identity
Recognition of cultural rights in the constitution: right to participate in cultural life
Recognition of cultural rights in the constitution: right to benefit from scientific progress and its applications
Recognition of cultural rights in the constitution: free exercise of creative activity; a person’s right to the protection of the moral and material interests resulting from any scientific, literary or artistic production of which he or she is the author
Recognition of cultural rights in the constitution: choice of and respect for cultural identities; access to cultural heritage; free and pluralistic information and communication; cultural cooperation
National legislative and regulatory framework
Existence of a “framework law” for culture
Existence of a sectoral law on heritage
Existence of a sectoral law on books and publishing
Existence of a sectoral law on cinema
Existence of a sectoral law on television and radio
Existence of other sectoral laws dealing with culture (music, visual arts, performing arts)
Existence of copyright legislation
Existence of neighbouring rights legislation
Existence of legislation on non-profit cultural bodies (cultural foundations and associations)
The budget legislation contains an item or items for culture
Existence of laws/regulations/decrees regulating public assistance and subsidies for the culture sector
Existence of laws/regulations/decrees promoting cultural patronage and sponsorship
Existence of laws/regulations/decrees dealing with the tax status of culture (tax exemptions and incentives designed to benefit the culture sector specifically, such as reduced VAT on books)
Existence of laws/regulations/decrees to create a propitious and diversified environment for the development of local cultural industries (e.g. regulations on company ownership, broadcasting content and percentages, levels of concentration in cultural industries)
Existence of laws/regulations/decrees to create favourable environments for culture and creativity: promotion of arts education
Existence of laws/regulations/decrees to create propitious environments for culture and creativity: protection and promotion of artists’ social status
Existence of laws/regulations/decrees to create favourable environments for culture and creativity: promotion of participation of minorities in cultural life, promotion of the cultural expressions and traditions of indigenous peoples.
Existence of other laws/regulations/decrees to create propitious environments for culture and creativity: promotion of participation of young people in cultural life, access to cultural venues and infrastructures for disabled people, advancement of women in the field of culture.
Existence of a system of regulations to develop and apply laws enacted in the cultural sphere (e.g. existence of regulations/decrees implementing copyright legislation)8

METHODOLOGY MANUAL • 67
GO
VE
RN
AN
CE
Guidelines for the interpretation of results
NN This is a benchmark indicator with a final value ranging from 0 to 1, with 1 representing the ideal or optimum result. When the result obtained is well below the ideal value, special attention should be paid to areas that appear to be less covered and regulated in order to ascertain the possible causes and consequences of these deficiencies in light of the country’s situation.
NN The particular characteristics of the issues analysed mean that this benchmark indicator should be treated with caution. Although it does provide a rapid overview of the degree of development of the standard-setting framework for the protection and promotion of culture, cultural rights and cultural diversity, its value added derives from a detailed analysis of the individual results for each item in light of the country’s situation as well as of the degree of linkage between the different standard-setting levels (international, regional, bilateral, constitutional, legal and regulatory) and the existence of positive synergies and/or deficiencies. Some elements that may be worth analysing on the basis of this indicator are:
a . the overall priority given by the State to culture; b . cultural sectors (e.g., heritage, cinema, books, etc.) treated as being of national priority from the point of view
of standard-setting development and/or those that have no regulatory support or only minimal support;c . the correlation between ratification of instruments and actual results and impacts, when results are
analysed in relation to the other indicators of this dimension;d . the existence of a consistent regulatory framework designed to protect and promote culture and the
culture sector from a development perspective.
2. THE POLICY AND INSTITUTIONAL FRAMEWORK
Introduction
For legislation and regulations dealing with culture, cultural diversity and cultural rights to be implemented in an effective and useful way, their constituent principles, rights and obligations must be translated into public policies. Administrative structures with the requisite capabilities must be in place and be gradually strengthened and adapted to changing contexts, so that policies can be implemented and evaluated. Thus, public policies and political and administrative processes, structures, mechanisms and systems are vital to guarantee and promote effective and efficient management in the cultural sphere that nurtures cultural sectors and processes from a development perspective.
In this context, it is believed that cultural decentralization, understood as a combination of administrative, fiscal and political functions and relationships, plays an important role in ensuring that decision-making reflects as far as possible the citizens’ needs and desires (thereby nurturing creative potential throughout the country) and in providing equal access to cultural goods and services.
>> Description: Index of development of the policy and institutional framework for the protection and promotion of culture, cultural rights and cultural diversity
Purpose
This indicator analyses the following aspects:
NN the priority strategies and areas of action forming the action programme established by the public authorities to promote cultural sectors and processes from a development perspective;
NN the main characteristics of the political and administrative system responsible for implementing the standard-setting framework for culture and for formulating, applying and managing cultural policies (type of bodies and position in the hierarchy, main areas of competence, etc.);
NN the degree to which governance of culture is decentralized.
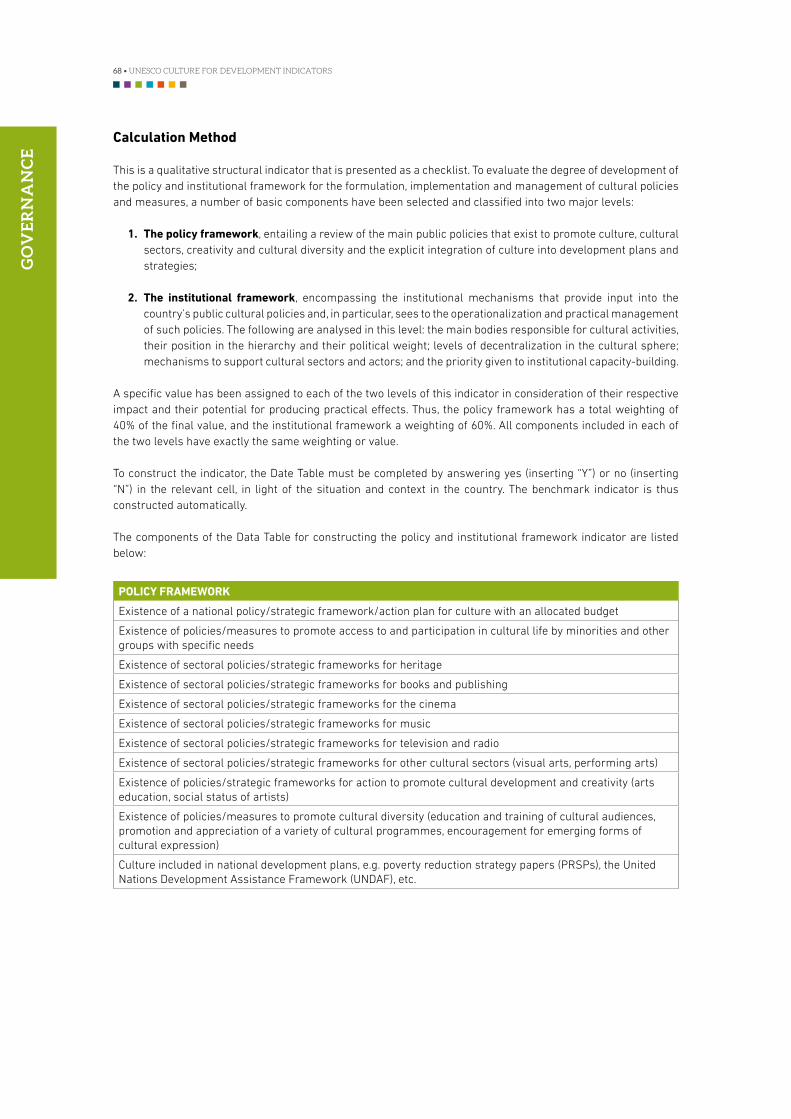
68 • UNESCO CULTURE FOR DEVELOPMENT INDICATORS
GO
VE
RN
AN
CE
Calculation Method
This is a qualitative structural indicator that is presented as a checklist. To evaluate the degree of development of the policy and institutional framework for the formulation, implementation and management of cultural policies and measures, a number of basic components have been selected and classified into two major levels:
1 . The policy framework, entailing a review of the main public policies that exist to promote culture, cultural sectors, creativity and cultural diversity and the explicit integration of culture into development plans and strategies;
2 . The institutional framework, encompassing the institutional mechanisms that provide input into the country’s public cultural policies and, in particular, sees to the operationalization and practical management of such policies. The following are analysed in this level: the main bodies responsible for cultural activities, their position in the hierarchy and their political weight; levels of decentralization in the cultural sphere; mechanisms to support cultural sectors and actors; and the priority given to institutional capacity-building.
A specific value has been assigned to each of the two levels of this indicator in consideration of their respective impact and their potential for producing practical effects. Thus, the policy framework has a total weighting of 40% of the final value, and the institutional framework a weighting of 60%. All components included in each of the two levels have exactly the same weighting or value.
To construct the indicator, the Date Table must be completed by answering yes (inserting “Y”) or no (inserting “N”) in the relevant cell, in light of the situation and context in the country. The benchmark indicator is thus constructed automatically.
The components of the Data Table for constructing the policy and institutional framework indicator are listed below:
POLICY FRAMEWORK
Existence of a national policy/strategic framework/action plan for culture with an allocated budget
Existence of policies/measures to promote access to and participation in cultural life by minorities and other groups with specific needs
Existence of sectoral policies/strategic frameworks for heritage
Existence of sectoral policies/strategic frameworks for books and publishing
Existence of sectoral policies/strategic frameworks for the cinema
Existence of sectoral policies/strategic frameworks for music
Existence of sectoral policies/strategic frameworks for television and radio
Existence of sectoral policies/strategic frameworks for other cultural sectors (visual arts, performing arts)
Existence of policies/strategic frameworks for action to promote cultural development and creativity (arts education, social status of artists)
Existence of policies/measures to promote cultural diversity (education and training of cultural audiences, promotion and appreciation of a variety of cultural programmes, encouragement for emerging forms of cultural expression)
Culture included in national development plans, e.g. poverty reduction strategy papers (PRSPs), the United Nations Development Assistance Framework (UNDAF), etc.

METHODOLOGY MANUAL • 69
GO
VE
RN
AN
CE
INSTITUTIONAL FRAMEWORK
Existence of a ministry of culture or a culture secretariat with ministerial status at the State level
Culture is represented by a State ministry/secretariat in the Council of Ministers (present at regular meetings of the Government)
Existence of a “culture committee” in the parliament/main national legislature
A number of cultural responsibilities are decentralized to regional/provincial authorities, which have a budget for this area (locally allocated or decentralized)
A number of cultural responsibilities are decentralized to local/municipal authorities, which have a budget for this area (locally allocated or decentralized)
In cases of decentralization, the majority of the regional/provincial governments have established special institutional structures for culture (secretariats, departments, etc.)
In cases of decentralization, the majority of the local/municipal governments have established special institutional structures/positions for culture (councillors, directors, etc.)
Existence of organizations dedicated to the promotion of one or more cultural sectors (music, dance, cinema, etc.) at the national level, with public funding in full or in part.
Existence of an authority that regulates audio-visual media (with responsibilities that include granting broadcasting licences, monitoring competition rules, penalizing publishers, distributors and operators of audio-visual services that fail to fulfill their obligations, advisory functions in the area of policies and regulations)
Existence of public systems of subsidies or financial assistance to support the culture sector
Existence of mechanisms and processes for monitoring, evaluating and reviewing cultural policy
Existence of training programmes for officials and/or workers in the public administration for culture in the last 12 months
Guidelines for the interpretation of results:
NN This is a benchmark indicator with a final value ranging from 0 to 1, with 1 representing the ideal or optimum result. When the result obtained is well below the ideal value, special attention should be paid to areas and components that are not covered by the policy, institutional and administrative system and mechanisms, and the possible causes and consequences of these deficiencies should be analysed within the context of the country’s situation.
NN The particular characteristics of the issues analysed mean that this benchmark indicator should be treated with caution. Although it does provide a rapid overview of the degree of development of the policy and institutional framework in place to promote cultural sectors and processes from a development perspective, its value added is derived from a detailed analysis of the individual results for each item in light of the country’s situation as well as the degree of linkage between the different levels covered by the dimension (standard-setting, policy, and administrative/institutional) and the existence of positive synergies and/or shortcomings.
NN Some elements that may be worth analysing on the basis of this indicator are:
a . the existence of a consistent and comprehensive policy system or of any gaps and shortcomings, which also provides an indication of the resolve of public authorities to fulfill and implement the standard-setting framework identified above;
b . the level of overall priority given by public authorities to culture, in view of the extent to which the subject has been developed at the policy level;
c . cultural sectors deemed to be of national priority and/or those that have no policy and/or strategic support or only minimal support;
d . the existence of a coherent administrative and institutional framework and mechanisms designed to create favourable environments for the emergence of dynamic cultural sectors and the promotion of cultural vitality;
e . the main characteristics of the political and administrative system responsible for formulating, applying and managing cultural policies (type of bodies, position in the hierarchy, main responsibilities, political weight, etc.);
70 • UNESCO CULTURE FOR DEVELOPMENT INDICATORS
GO
VE
RN
AN
CE
f . the extent and essential characteristics of cultural governance and management decentralization processes.
Ultimately, the aim is to consider the inherent potential and challenges of the country’s policy and administrative system and mechanisms, ensuring effective management that promotes cultural sectors and processes from a development perspective.
3. DISTRIBUTION OF CULTURAL INFRASTRUCTURES
Introduction
Cultural infrastructures play a key role in promoting cultural education, empowerment and participation, fostering integration and reducing exclusion and marginalization while improving citizens’ quality of life.
Cultural infrastructures are also crucial in creating environments conducive to the emergence of dynamic cultural sectors and clusters, as they are a source of not only cultural and social but also economic vitality in areas where they are located. Cultural operators face severe difficulties in establishing viable cultural ventures when there is a lack of basic infrastructure, such as access to capital, facilities for creation, production, distribution and dissemination, and training. For these reasons, cultural infrastructure is essential if culture is to “work” for development nationally.
>> Description: Distribution of selected cultural infrastructures relative to the distribution of the country’s population in administrative divisions immediately below State level
Purpose
To assess the degree of equity, in relation to the population and the administrative divisions in which they reside, of the coverage and distribution throughout the country of the selected cultural facilities and infrastructures for public use with a view to:
NN Promote widespread cultural participation and broad, egalitarian access to culture and cultural life;NN Provide an enabling environment for culture professionals and businesses to create, produce, promote and
disseminate their work.
Three categories of basic facilities and infrastructures have been selected as a benchmark or proxy, namely museums, libraries and media resource centres, and exhibition venues dedicated to the performing arts. This indicator is also a process indicator that provides additional indications of the degree of practical implementation of the standard-setting, policy and institutional framework analysed in the previous indicators of this dimension.
Note: This indicator presents the general distribution of the selected cultural infrastructures by main administrative divisions immediately below State level (regions, provinces or departments,
depending on the country), which may mask large disparities in terms of size, internal population distribution, geographical situation, etc. Consequently, the results obtained can and must only be read in light of the country’s context and specificities.
Definitions
For constructing this indicator, the following working definitions are proposed:
Administrative division (departments/regions/provinces): A first step in constructing this indicator is to count the number of selected cultural infrastructures active in each of the main administrative divisions immediately

METHODOLOGY MANUAL • 71
GO
VE
RN
AN
CE
below State level. For the sake of comparability, the recommended benchmark is the ISO 3166-29 international standard for country codes and codes for their sub-divisions, which lists the administrative sub-divisions of over 230 countries. The name used for the main administrative division immediately below State level varies from one country to another. Thus, the relevant divisions will be departments in Colombia, provinces in Burkina Faso and Viet Nam and regions in the United Republic of Tanzania.
Museum: A non-profit, permanent institution in the service of society and open to the public, which acquires, conserves, researches, communicates and exhibits sets and collections of historical, artistic, scientific and technical value or of any other cultural nature for the purposes of education, study and enjoyment.10
Museums play a key role in the preservation, protection, safeguarding, restoration, appreciation, transmission and interpretation of cultural heritage and contemporary creations. Their very existence is an important evidence of public commitment to cultural heritage and creativity, as they embody public resolve and determination to safeguard, protect and promote heritage and artistic creativity by means of tangible action such as the construction and management of permanent infrastructure.
Libraries and media resource centres: Libraries and media resource centres “occur in a variety of societies, in differing cultures and at different stages of development. Although the varied contexts in which they operate inevitably result in differences in the services they provide, and the way those services are delivered, they normally have characteristics in common, which can be defined as follows: A public library is an organization established, supported and funded by the community, either through local, regional or national government or through some other form of community organization, it provides access to knowledge, information and works of the imagination through a range of resources and services and is equally available to all members of the community regardless of race, nationality, age, gender, religion, language, disability, economic and employment status and educational attainment.”11
On the basis of this definition, libraries and media resource centres are deemed for the purposes of this indicator to be organizations whose main function is to maintain a collection, and through the services of the staff responsible for their management, to facilitate the use of different types of materials and written and audio-visual media necessary to meet their users’ information, research, education and leisure needs, and which are funded by public authorities. This definition includes, for example, national, regional, municipal and community public libraries, public university libraries and specialized libraries, among others, but not primary and/or secondary school libraries. Likewise, if a same space incorporates different functions (library, media resource centre, documentation centre) recognized by the present working definition, for the construction of the indicator, only one infrastructure should be counted for the category of libraries and media resource centres.
As the 1994 IFLA/UNESCO Manifesto states: “The public library, the local gateway to knowledge, provides a basic condition for lifelong learning, independent decision-making and cultural development of the individual and social groups”. Consequently, libraries and media resource centres are considered to be basic cultural facilities when evaluating cultural infrastructures available to citizens.
Exhibition venues dedicated to the performing arts: For the purposes of this indicator, exhibition venues dedicated to the performing arts mean physical cultural facilities (such as venues, buildings or physical sites) intended specifically for cultural use, set up and fitted out for this purpose, and devoted mainly to the dissemination, distribution and public performance of theatre, poetry, live music, dance, circus, puppetry, song and variety shows subsumed under Performance and Celebration category.12 These facilities must have a minimum of 100 seats for spectators. The definition includes indoor venues (such as theatres and auditoria), permanent outdoor sites equipped, set up and fitted out for the performing arts (such as open-air amphitheatres) and arts centres, cultural centres and other multi-domain and multi-purpose cultural venues dedicated to the dissemination of various types of cultural activities as part of their programming (such as performances,
9. See: http://www.iso.org/iso/country_codes. 10. This working definition draws on the definition in ICOM, Statutes (2007), http://icom.museum/the-vision/museum-definition/. 11. The Public Library Service: the IFLA/UNESCO Guidelines for Development 2001. 12. UNESCO Framework for Cultural Statistics, UIS (2009), p. 26.
72 • UNESCO CULTURE FOR DEVELOPMENT INDICATORS
GO
VE
RN
AN
CE
exhibitions and screenings), provided that they comply with the characteristics and conditions described.13 Cinemas are not included in this definition, however.
If a same space incorporates various venues for the performing arts, as recognized by the present working definition, for the construction of the indicator, only one infrastructure should be counted for the category of exhibition venues dedicated to the performing arts.
This working definition is supply-based and focuses on venues and sites used for the exhibition and dissemination of the performing arts, and not on cultural products, such as concerts or plays, or cultural establishments, such as dance or theatre companies, even when they are wholly or partly financed from public funds. Likewise, it does not include training, research or documentation centres, institutes or firms operating in the performing arts sector if their main activities and functions do not include the dissemination and exhibition of performing arts events in a dedicated venue that comply with the characteristics and requirements indicated.
Data Sources
NN Registry/directory/listings of cultural infrastructures and national, regional and international cultural registry/directory/listings.
NN National cultural information systems.NN Countries’ internal directories. Some directories are online. In other cases they have been published and
can be requested, for example, from culture ministries.
Calculation Method
To construct the indicator, the relevant cells must be completed on the appropriate sheet of the Data Table stating, for each of the country’s administrative divisions as identified in accordance with the “Definitions” section (provinces, departments or regions):
NN the name of the administrative division considered (name of the province, department or region concerned);NN numerical values for cultural infrastructures (i.e., the number of museums, libraries and media resource
centres, and exhibition venues dedicated to the performing arts) open, operational and accessible to the public;
NN the number of inhabitants, according to the most recent national census.
Note: Do not forget to refer to the working definitions adopted by the CDIS to identify the administrative divisions and cultural infrastructures selected for consideration.
Likewise, when one cultural infrastructure fulfills the requirements for more than one of the listed categories of infrastructures in the working definitions, it should be counted in each of these categories. For example, if a cultural center incorporates both a library and an exhibition venue, according to the working definitions, this cultural center should be counted once as a library and once as an exhibition venue.
On the basis of these data, the following are automatically constructed in the Data Table:
NN The percentage of the country’s total population living in each of the country’s administrative divisions relative to the country’s total population;
NN The percentage of museums, libraries and media resource centres and venues dedicated to the performing arts present in each of the country’s administrative divisions as a share of all the country’s museums, libraries and media resource centres and venues dedicated to the performing arts;
13. The working definition proposed draws heavily on the final report “Les infrastructures culturelles dans la municipalité; Nomenclature, recensement et état des lieux” compiled by Serge Bernier and Pascale Marcotte for the Ministry of Culture, Communications and the Status of Women, the Culture and Communications Observatory of the Quebec Institute of Statistics and Les Arts de la Ville (2010).
METHODOLOGY MANUAL • 73
GO
VE
RN
AN
CE
NN The relative standard deviation for each of the three categories of selected cultural infrastructure, as well as the average relative standard deviation across all categories of cultural infrastructure, which serve to measure the variation of results from the mean and thus as a proxy indicator for the equality of distribution across administrative divisions and by population.
Guidelines for the interpretation of results
NN This is a descriptive and exploratory indicator whose purpose is to evaluate levels of equity in the distribution of the selected cultural infrastructures by administrative division and by population. The results can be used, in particular:
a . to evaluate the overall harmony and homogeneity of coverage of the selected cultural infrastructures around the country;
b . to identify the administrative divisions (and the populations living in them) that are in a situation of disadvantage;
c . to identify the administrative divisions and population groups that have higher levels of coverage;d . to visualize the situation of provinces, departments or regions with particular conditions (outliers) that
call for a specific effort of interpretation and contextualization (for example, a region with large internal disparities in the distribution of population and the selected infrastructures may obtain a relatively low score when in fact there are areas within it that have a level of infrastructure coverage by population far above the average and other areas with a level far below the average; and vice versa).
NN The average relative standard deviation, as well as the relative standard deviation for each of the three categories of selected cultural infrastructure, serve to measure the variation of results from the mean and thus act as a proxy for measuring the equality of distribution across administrative divisions and by population. A situation in which the types of infrastructure are distributed among the population with perfect equity would yield a ratio of 1. For example, if the administrative division concerned is home to 10% of the country’s population and has 10% of all its libraries, it will have a ratio of 1, and this division can thus be said to have balanced infrastructure coverage relative to its population, in comparison with the rest of the country. However, if an administrative division has 30% of the country’s population and 15% of its libraries, the ratio will be 0.5 (less than the 1 which provides the standard of perfect equity) and can be considered as disadvantaged. Conversely, an administrative division that contains 10% of the country’s population and 30% of its libraries will have a ratio of 3, and will thus clearly be very well placed relative to the rest of the country.
NN In interpreting the results, it is advisable to pay special attention to the situation of regions/departments/provinces whose levels of selected cultural infrastructures coverage are low in relation to the percentage of the population they represent and to other regions, and which are thus in a situation of relative disadvantage. It should be recalled once again that this indicator evaluates overall levels of equality in the distribution of cultural infrastructures by population and territory and that the goal will not always necessarily be an absolutely equitable distribution of infrastructures. So that, to raise their significance and relevance, differences and imbalances must be interpreted and contextualized in light of the country’s situation as regards geography, policy, occupation of the territory, etc.
NN It should also be emphasized that this indicator provides information about the relative level of disadvantage of parts of the country’s territory and the population living there, but particularly about overall inequalities in terms of distribution of the coverage of the selected cultural infrastructures throughout the country in relation to the percentage of inhabitants living in each administrative division. Therefore, this indicator requires a substantial effort of contextualization for its interpretation. In fact, the interpretation of the result obtained will differ depending on national contexts, and a qualitative analysis of the different elements composing it will be required to obtain a fuller picture of the degree of coverage and access to basic cultural infrastructures by territory and population. For example, in many countries it is possible that there will be outliers that ought to be analysed specifically in light of the country’s situation. This will be the case, for example, for a region that contains the State’s capital. It can be presumed that the region will have a larger percentage of cultural infrastructures than other regions of the country (15% of the total) and at the same time a proportionately larger percentage of the population (25% of the total). It can be
74 • UNESCO CULTURE FOR DEVELOPMENT INDICATORS
GO
VE
RN
AN
CE
consider that for the most part, it would be a mistake to regard these regions as overall disadvantaged. One possible explanation to be analysed in greater detail using supplementary data would be the existence of major disparities within this administrative division itself with, for example, very well equipped area, containing 10% of all national infrastructures but only 5% of the country’s total population, and another containing only 5% of the total infrastructures but 20% of the country’s total population. The result for the administrative division considered will be low overall, when it actually contains the most favoured area in the whole country. The average tends to blur differences and extremes, which is why contextualization and interpretation of results are needed.
NN Similarly, in interpreting the results it must be borne in mind that in cases where the number of selected infrastructures in the country as a whole is homogeneous but extremely low, it may appear that an encouraging result has been obtained, with low levels of inequality in coverage and access between regions and citizens, whereas in fact all regions and all citizens are in a situation of deprivation and marginalization because the cultural infrastructures network is virtually non-existent throughout the country. Similarly, if the incremental number of infrastructures increases in all administrative divisions and distribution remains unchanged, levels of inequality in the distribution will not change either, even though the level of coverage and overall access to cultural infrastructures have increased in absolute terms.
NN Some further elements that may be worth analysing on the basis of this indicator are:
a . the level of equity in the distribution of each of the types of cultural infrastructure analysed, and of all of them together, which may provide interesting pointers to matters such as the level of cultural decentralization;
b . differences of coverage for the different types of cultural infrastructures by administrative division;c . cultural infrastructures by region and population, thereby identifying areas that may be disadvantaged
as regards of coverage of cultural infrastructures; etc.
NN Lastly, it is worth collating the data obtained from this indicator with other results from the CDIS matrix, such as data on participation in cultural activities (Social Participation dimension) or household spending on cultural goods and services (Economy dimension).
4. CIVIL SOCIETY PARTICIPATION IN CULTURAL GOVERNANCE
Introduction
Participation and access are essential to cultural empowerment,14 to the implementation and enjoyment of human rights and to progress towards inclusive human development. The promotion of pluralism and cultural diversity largely depends on opportunities for access to and participation in policy and decision-making. Consequently, the participation of minorities and marginalized groups in shaping the standards and policies that regulate and influence their cultural life is an expression of the right to take part and participate in cultural life, as recognized by Article 27 of the Universal Declaration of Human Rights,15 the Declaration on the Rights of Persons Belonging to National or Ethnic, Religious and Linguistic Minorities16 and a number of human rights instruments adopted at the international and regional levels.17 Thus, the Declaration on the Rights of Persons Belonging to National or Ethnic, Religious and Linguistic Minorities explicitly acknowledges their right to participate in decision-making and requires that national policies and programmes take legitimate interests of people belonging to minorities
14. Understood as a dynamic, evolving process whereby individuals are gradually able to develop knowledge, skills and capabilities for understanding, appreciating and enjoying different forms of cultural and artistic expression in a critical and open spirit.
15. “Everyone has the right freely to participate in the cultural life of the community, to enjoy the arts and to share in scientific advancement and its benefits.”
16. The rights of people belonging to minorities is set out and defined in the 1992 Declaration on the Rights of Persons Belonging to National or Ethnic, Religious and Linguistic Minorities. The Declaration is the first complete universal instrument to establish norms in this area, which include the right to enjoy their own culture, to participate in cultural life and in decision-making about the minority to which they belong, and to establish and maintain their own associations.
17. For example, see Article 15, paragraph 1 (a), of the International Covenant on Economic, Social and Cultural Rights and resolution 10/23 of the Human Rights Council, which highlight three main interrelated components in the right to participate in or form part of cultural life, namely (a) participation in cultural life, (b) access to it and (c) opportunity to contribute to it. This right also includes the right not to participate.
METHODOLOGY MANUAL • 75
GO
VE
RN
AN
CE
into account. In regard to cultural policies and measures, the Convention on the Protection and Promotion of the Diversity of Cultural Expressions promotes participatory systems of governance that are open to a variety of voices, including civil society,18 in policy-making and in the design and implementation of measures and programmes so that they take into consideration the particular conditions and needs of all members of society. Similarly, the Convention urges Parties to create in their territory an environment that encourages individuals and social groups to create, produce, disseminate, distribute and have access to their own cultural expressions, paying due attention to the special circumstances and needs of […] various social groups, including persons belonging to minorities and indigenous peoples.19
One of the intrinsic characteristics of culture is that it involves a large variety of actors (artists, creators, audiences, professional associations, civil society, legislators and decision-makers, cultural industries, etc.). Consequently, and looking beyond the participation of minorities and marginalized groups, culture requires broadly based participatory processes to formulate and implement useful and effective policies and measures that meet the needs of the individuals and communities for which they are intended. On this point, the Convention on the Protection and Promotion of the Diversity of Cultural Expressions acknowledges the fundamental role played by civil society in protecting and promoting the diversity of cultural expressions and the importance of encouraging its active participation in the preparation, management, evaluation and implementation of cultural policies and measures. 20 These indispensable processes of participatory cultural policy-making can also serve as a model for other policy areas, such as the environment and education.
Good cultural governance practices should encourage civil society participation in decision-making. This can be achieved through specific legislation or institutional agreements and mechanisms that ensure civil society representation, thus effectively promoting pluralism and cultural diversity, and combating socio-cultural exclusion. The aim is thus to ensure that representatives of civil society, and culture professionals and minorities in particular, are suitably represented, consulted and have a say in decisions that affect them so that, as far as possible, they feel a sense of shared responsibility for these decisions.
>> Description: Index of the promotion of the participation of cultural professionals and minorities in the formulation and implementation of cultural policies, measures and programmes that concern them
Purpose
This indicator evaluates the opportunities open to civil society – and to culture sector professionals and minorities in particular – to participate in the formulation and implementation of cultural policies, measures and programmes that concern them, both nationally and at the regional/municipal/local level.
To this end, the existence or non-existence of specific institutional structures and mechanisms to promote civil society involvement in cultural governance is used as a proxy, and their main characteristics are examined.
Definitions
For constructing this indicator, the following working definitions are proposed:
Minorities: Article 1 of the 1992 United Nations Declaration on the Rights of Persons belonging to National or Ethnic, Religious and Linguistic Minorities refers to minorities on the basis of their national or ethnic, cultural, religious and linguistic identity and provides that States shall protect their existence. There is, however, no internationally agreed definition of which groups constitute minorities.
18. Article 3 of the Operational Guidelines of the Convention on the Protection and Promotion of the Diversity of Cultural Expressions dealing with the role and participation of civil society provides: “For the purposes of this Convention, civil society means non-governmental organizations, non-profit organizations, professionals in the culture sector and associated sectors, groups that support the work of artists and cultural communities.”
19. See Article 7.1 (a) “Measures to promote cultural expressions” of the Convention on the Protection and Promotion of the Diversity of Cultural Expressions.
20. See Article 11 “Participation of civil society” of the Convention on the Protection and Promotion of the Diversity of Cultural Expressions.

76 • UNESCO CULTURE FOR DEVELOPMENT INDICATORS
GO
VE
RN
AN
CE
To construct this indicator, the following working definition of “minorities” has been adopted: “The term ‘minorities’ […] designates marginalized or vulnerable groups who live in the shadow of majority populations with a different and dominant cultural ideology. These groups share systems of values and sources of self-esteem that often are derived from sources quite different from those of the majority culture. The term “minorities” embraces four different categories of groups:
NN Autochthonous or indigenous peoples, whose line of descent can be traced to the aboriginal inhabitants of the country having a particular relationship with their territories and an accentuated feeling of ownership of what they consider to be their land;
NN Territorial minorities, groups with a long cultural tradition who have lived in national contexts where minorities are numerous […];
NN Non-territorial minorities or nomads, groups with no particular attachment to a territory;NN Immigrants who will tend to negotiate collectively their cultural and religious presence in a particular
society.”21 Organized representatives of culture sector professionals: To construct this indicator, a broad working definition
applicable to very diverse national contexts is used. The term “organized representatives of culture sector professionals” is thus used to mean any association, union, non-profit organization, network, non-governmental organization, guild, foundation, corporation or organized representative structure independent of government and legally constituted or at least publicly recognized (by being affiliated to an international network, federation or association, for example) whose main function involves the defense and promotion of the interests of its members and the attainment of aims relating to its activities. It may be general in character (cultural associations) or sectoral (such as professional associations of arts managers, cultural educators, producers or museologists).
Calculation method
This is a qualitative process indicator presented as a checklist. To rate the degree to which public authorities promote participation by civil society in the formulation and implementation of cultural policies, measures and programmes that concern it, a number of basic components have been selected and classified into two major segments, then assigned an equivalent weighting.
1 . Participation by organized representatives of minorities analyses, both nationally and at the regional/municipal/local level, the existence of consultation and participation mechanisms for minorities and the main characteristics of these mechanisms.
2 . Participation by organized representatives of culture sector professionals analyses, both nationally and at the regional/municipal/local level, the existence of consultation and participation mechanisms for culture sector professionals and the main characteristics of these mechanisms.
To construct the indicator, it is necessary to complete the relevant Data Table by placing an “X” in the “Reply” cell provided in accordance with the context and situation of the country. The benchmark indicator is thus automatically constructed.
The components of the Data Table for constructing the civil society participation indicator are listed below:
21. Our Creative Diversity, p. 71
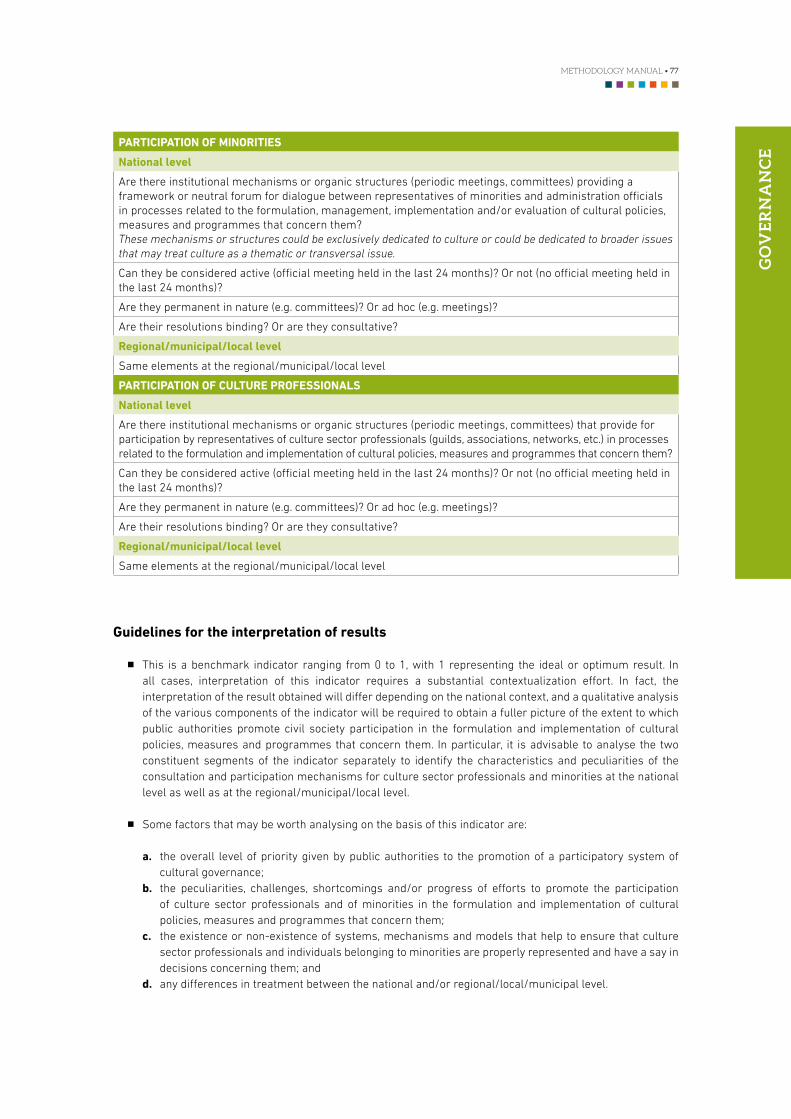
METHODOLOGY MANUAL • 77
GO
VE
RN
AN
CE
PARTICIPATION OF MINORITIES
National level
Are there institutional mechanisms or organic structures (periodic meetings, committees) providing a framework or neutral forum for dialogue between representatives of minorities and administration officials in processes related to the formulation, management, implementation and/or evaluation of cultural policies, measures and programmes that concern them?These mechanisms or structures could be exclusively dedicated to culture or could be dedicated to broader issues that may treat culture as a thematic or transversal issue.
Can they be considered active (official meeting held in the last 24 months)? Or not (no official meeting held in the last 24 months)?
Are they permanent in nature (e.g. committees)? Or ad hoc (e.g. meetings)?
Are their resolutions binding? Or are they consultative?
Regional/municipal/local level
Same elements at the regional/municipal/local level
PARTICIPATION OF CULTURE PROFESSIONALS
National level
Are there institutional mechanisms or organic structures (periodic meetings, committees) that provide for participation by representatives of culture sector professionals (guilds, associations, networks, etc.) in processes related to the formulation and implementation of cultural policies, measures and programmes that concern them?
Can they be considered active (official meeting held in the last 24 months)? Or not (no official meeting held in the last 24 months)?
Are they permanent in nature (e.g. committees)? Or ad hoc (e.g. meetings)?
Are their resolutions binding? Or are they consultative?
Regional/municipal/local level
Same elements at the regional/municipal/local level
Guidelines for the interpretation of results
NN This is a benchmark indicator ranging from 0 to 1, with 1 representing the ideal or optimum result. In all cases, interpretation of this indicator requires a substantial contextualization effort. In fact, the interpretation of the result obtained will differ depending on the national context, and a qualitative analysis of the various components of the indicator will be required to obtain a fuller picture of the extent to which public authorities promote civil society participation in the formulation and implementation of cultural policies, measures and programmes that concern them. In particular, it is advisable to analyse the two constituent segments of the indicator separately to identify the characteristics and peculiarities of the consultation and participation mechanisms for culture sector professionals and minorities at the national level as well as at the regional/municipal/local level.
NN Some factors that may be worth analysing on the basis of this indicator are:
a . the overall level of priority given by public authorities to the promotion of a participatory system of cultural governance;
b . the peculiarities, challenges, shortcomings and/or progress of efforts to promote the participation of culture sector professionals and of minorities in the formulation and implementation of cultural policies, measures and programmes that concern them;
c . the existence or non-existence of systems, mechanisms and models that help to ensure that culture sector professionals and individuals belonging to minorities are properly represented and have a say in decisions concerning them; and
d . any differences in treatment between the national and/or regional/local/municipal level.
78 • UNESCO CULTURE FOR DEVELOPMENT INDICATORS
GO
VE
RN
AN
CE
////////////////////// GUIDELINES FOR THE OVERALL ANALYSIS OF THE DIMENSION ////////////////////////
NN A comparative reading of the indicators of the Governance dimension yields information on the correlation between the ratification of international instruments, the development of a national standard-setting and regulatory framework mechanism, the formulation of policies to implement it and the organization of an institutional and administrative system, including cultural infrastructures, to encourage participation by all. A comparative reading thus provides an overview of the model of governance as well as of the “density” of the cultural institutionality currently operating, which can be of assistance in identifying its strengths and weaknesses and in analysing the connections between the different links of this model of governance.
NN Correlating the results of the indicators of this dimension with other CDIS indicators is also crucial. A transversal reading of the indicators of the Governance dimension together with other indicators for dimensions, such as Economy, Social Participation, or Communication, yields valuable information on the extent to which cultural rights have been enshrined and are being implemented. Likewise, a detailed analysis of particular components of the indicators for this dimension can be useful for completing or illustrating the results of indicators for other dimensions. If the Economy dimension reveals that a particular sector is contributing strongly (or particularly weakly) to GDP or employment, for example, it may be worth studying its level of coverage in standard-setting and policy terms and the existing infrastructures in order to obtain pointers to its real development potential.

METHODOLOGY MANUAL • 79
GO
VE
RN
AN
CE

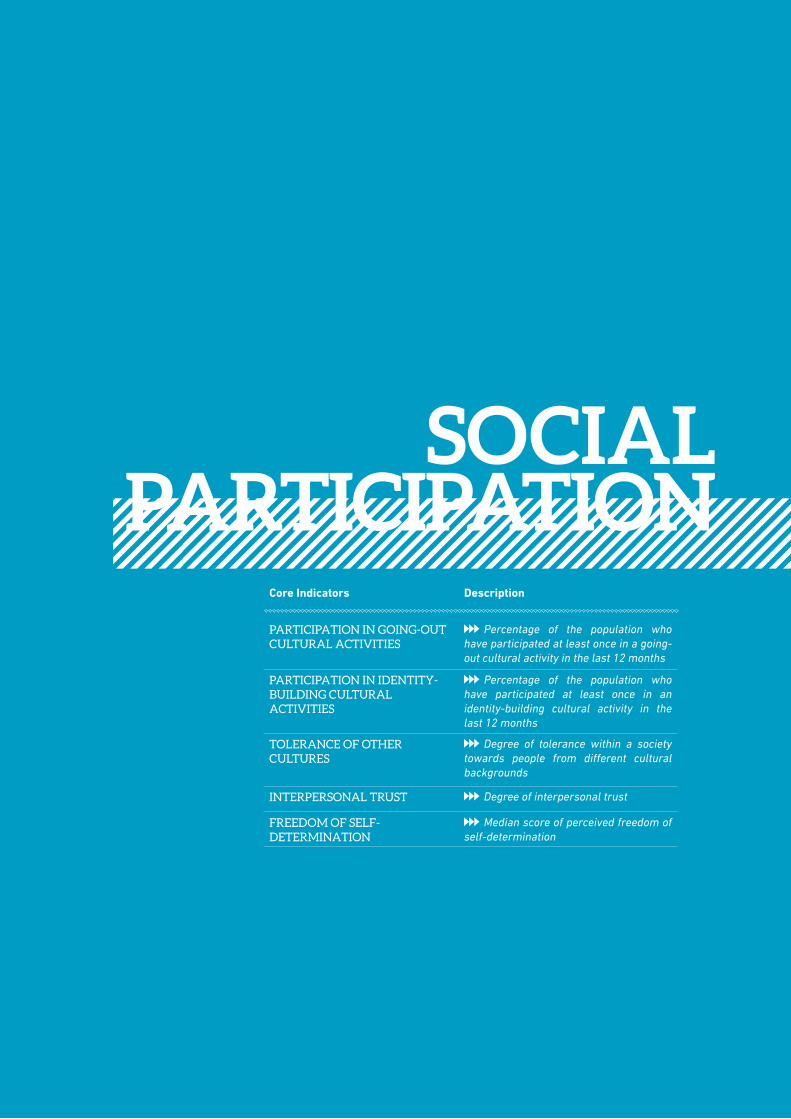
Core Indicators Description
PARTICIPATION IN GOING-OUT CULTURAL ACTIVITIES
Percentage of the population who have participated at least once in a going-out cultural activity in the last 12 months
PARTICIPATION IN IDENTITY-BUILDING CULTURAL ACTIVITIES
Percentage of the population who have participated at least once in an identity-building cultural activity in the last 12 months
TOLERANCE OF OTHER CULTURES
Degree of tolerance within a society towards people from different cultural backgrounds
INTERPERSONAL TRUST Degree of interpersonal trust
FREEDOM OF SELF-DETERMINATION
Median score of perceived freedom of self-determination
SOCIAL PARTICIPATION
82 • UNESCO CULTURE FOR DEVELOPMENT INDICATORS
SOC
IAL
PA
RT
ICIP
AT
ION
I. RELEVANCE OF THE DIMENSION FOR CULTURE AND DEVELOPMENT
Culture plays a central role in sustaining and enhancing individuals’ and communities’ quality of life and well-being. Cultural practices, assets and expressions are also key vehicles for the creation, transmission and reinterpretation of values, aptitudes and convictions through which individuals and communities express the meanings they give to their lives and their own development. Those values, aptitudes and convictions shape the nature and quality of social relationships, have a direct impact on a sense of integration, empowerment, trust, tolerance of diversity and cooperation and orient individual and collective action. As they are inherited from a community’s previous generations and undergo adaptation and extension by current members of the community, they are being constantly redefined and transformed in response to cultural diversity, evolving value systems and means of creative expression.
Moreover, how individuals perceive their ability to make decisions and act on them, as well as their level of inclusion and the quality of the relationships with their community, defines the levels of social capital of a particular society. Culture is thus decisive in improving human capabilities and enhancing social capital, both building blocks of enabling (and evolving) environments for inclusive, sustainable and human-centered development. Indeed, development cannot be achieved without human co-operation within a society and the constant reorganization of “cultural allegiances to enable human beings with different ideals of a good life to live compatibly in a living biosphere.1”
Building on the above-mentioned premises, and considering that being able to benefit from and participate in cultural life is one means of experiencing positive social connections and well-being in addition to being a cultural human right largely recognized by the international community, this dimension looks first at options provided for choice-based cultural participation2 and social inclusion.
Then, it focuses on the cultural skills and values which influence individuals’ social interactions, sense of belonging and social connectivity. Finally, this dimension focuses on individuals’ sense of empowerment and freedom to make their own choices according to what they value and drive development.
Objective of the Dimension
This dimension is interested in demonstrating how cultural practices, values and attitudes impact individuals and communities’ sense of inclusion, cooperation and empowerment, which thus lead to orienting their actions. By doing so, this dimension highlights the multi-dimensional ways culture influences the preservation and enhancement of an enabling environment for social progress and development.
II. DATA SOURCES
Survey data is the most useful and relevant source of data for the indicators of this dimension. It has the advantage of offering more precise information since it can usually be disaggregated according to demographic variables (e.g. age, sex, education level, etc.). This allows for more precise insights into the studied phenomena, for example concerning the patterns of cultural participation amongst certain groups.
National statistical offices are generally responsible for the collection of this type of data. It is, therefore, recommended to start the process of identifying relevant data sources with the national statistical office. However, if your national statistical office does not carry out these types of surveys, below is a list of useful data sources that can either complement national sources, or, if necessary, can be used to fully construct the indicators:
1. Arizpe, Lourdes, Conviviality: the role of civil society in culture and development” (2000); www.crim.unam.mx/cultura/ponencias/pon2.htm2. Within the CDIS framework, choice-based cultural participation refers to the possibility individuals have to participate in cultural life in all its
diversity as well as their capacity to choose and modify their own cultural practices and activities (including the choice to not participating). In this sense, choice-based cultural participation encompasses both access to and contribution to cultural life. It also entails the ability to establish diverse and evolving cultural allegiances and identities.
METHODOLOGY MANUAL • 83
SOC
IAL
PA
RT
ICIP
AT
ION
NN The World Values Survey (WVS)3: http://www.worldvaluessurvey.org NN The Global Barometer Series4: http://www.globalbarometer.netNN The Gallup World Poll (WP)5: http://www.gallup.com/Home.aspxNN The International Social Survey Program (ISSP)6: http://www.issp.orgNN The Harmonised European Time Use Surveys (HETUS): https://www.testh2.scb.se/tus/tus/StatMeanMact2.
htmlNN The European Union Statistics on Income and Living Conditions (EU-SILC): http://epp.eurostat.ec.europa.
eu/portal/page/portal/microdata/eu_silc
Note: Some of the sources above are Europe-specific; it is worthwhile to check whether there may be equivalent data sources available for your country.
III. CORE INDICATORS
1. PARTICIPATION IN GOING-OUT CULTURAL ACTIVITIES
2. PARTICIPATION IN IDENTITY-BUILDING CULTURAL ACTIVITIES
Introduction
The right to participate in cultural life is a universal human right enshrined in the Universal Declaration of Human Rights, which states that “Everyone has the right to freely participate in the cultural life of the community, to enjoy the arts and to share its scientific advancement and its benefits” (art. 27). Moreover, the International Covenant on Economic, Social and Cultural Rights calls on states to recognise the right of everyone to take part in cultural life (art. 15.1.a).
Choice-based cultural participation plays a formative role in building up individual capabilities through exposure to and production of a rich and diversified range of cultural expressions and resources. Indeed, it contributes to the development of critical thinking as well as to a continuous learning process about creativity and cultural diversity. Moreover, cultural participation offers experiences of what is meaningful for each person, and therefore leads to the constant construction and transmission of individual and collective values influencing how individuals express themselves, understand diversity and adapt to change both collectively and as an individual.
Choice-based cultural participation is also a vector of enhanced well-being and mutual understanding.7 Indeed, it provides opportunities for individuals to experience positive social connections with their community as well as cultural diversity, which fosters feelings of integration, inclusion and mutual respect. Research shows that when
3. The WVS is a worldwide investigation of socio-cultural and political change. The WVS in collaboration with European Values Study (EVS) carried out representative national surveys in 97 societies containing almost 90 percent of the world’s population. The WVS follows a harmonized methodology and uses a core questionnaire translated into local languages. All interviews are conducted face to face by a local field organization and are supervised by academic researchers. Data can be accessed online or can be downloaded completely free of charge.
4. The Global barometer Survey (GBS) is a comprehensive effort to measure the social, political, and economic atmosphere around the world. It is based on a common module of questions contained in regional barometer surveys. Global barometer is based in the idea of self-governance. For instance, each regional barometer directs its own roster of research institutes located in the 50 countries where surveys are conducted. Online data analysis of each country is compiled in the following link: http://www.jdsurvey.net/gbs/gbs.jsp. For additional regional specific questions, see the original surveys: Afro Barometer (www.afrobarometer.org), Arab Barometer (www.arabbarometer.org), Asian Barometer (www.asianbarometer.org) and Latino Barometro (www.latinobarometro.org).
5. The GWP is carried out each year in more than 140 countries representing 95 percent of the world’s adult population. WP asks a standard set of core questions that have been translated into the major languages of the respective countries. The target population is the entire civilian, non-institutionalized, aged 15 and over population.
6. The ISSP is an annual programme of cross-national collaboration on surveys covering topics which are important for social science research. It brings together pre-existing social science projects and coordinates research goals, thereby adding a cross-national, cross-cultural perspective to the individual national studies. The ISSP researchers especially concentrate on developing questions that are meaningful and relevant to all countries, and can be expressed in an equivalent manner in all relevant languages. In 2007, the ISSP carried out a special module on leisure time and sports that will be of special interest for measuring cultural participation.
7. Article 2.7 of the Convention on the Protection and Promotion of the Diversity of Cultural Expressions states that: “Equitable access to a rich and diversified range of cultural expressions from all over the world and access of cultures to the means of expressions and dissemination constitute important elements for enhancing cultural diversity and encouraging mutual understanding”.

84 • UNESCO CULTURE FOR DEVELOPMENT INDICATORS
SOC
IAL
PA
RT
ICIP
AT
ION
an individual is or feels unable to participate in cultural life, then the opposite is also true: he/she feels excluded and marginalized from society.8
Thus, individual benefits of cultural participation can translate into community strengths since higher levels of cultural participation are linked to stronger social capital. Since cultural participation can help individuals to feel ‘included’ in their community, this reduces the risk of social tension. This is of particular relevance in poly-ethnic and multicultural societies, where equal and inclusive access to cultural life by all groups can be an effective means of fostering mutual understanding.
The levels of cultural participation are therefore strongly linked to development since they reflect levels of social capital and individual and collective sense of inclusion and well-being.
>> Description:
1. Percentage of the population who have participated at least once in a going-out cultural activity in the last 12 months
2. Percentage of the population who have participated at least once in an identity-building cultural activity in the last 12 months
Purpose
These core indicators measure the levels of cultural participation in order to assess the degree of cultural vitality, social engagement in cultural activities and potential divisions or exclusions within a society.
These indicators are also useful for providing an overview of the patterns of cultural participation of the population, particularly when disaggregation by demographic variables is possible.
Definitions
Defining cultural activities in order to measure levels of participation is a minefield. Indeed, a wide range of activities are considered as cultural practices all over the world and classifications and definitions differ from country to country (and even within a range of national surveys). Thus, while acknowledging some degree of flexibility in their interpretation, for the purpose of comparability, the following working definitions should be followed.
Cultural practices can be defined according to three categories:
1 . Home-based: refers to the amount of time spent watching TV, listening to the radio, watching and listening to recorded sound and images, reading and using the computer and the Internet.
2 . Going-out: includes visits to cultural venues, such as cinemas, theatres, concerts, museums, monuments and heritage sites.
3 . Identity-building: covers amateur cultural practices, membership of cultural associations9, popular culture, ethnic culture, community practices and youth culture.10
On the basis of this definition, for the purpose of the CDIS, cultural participation will refer only to going-out and identity-building cultural practices.11
8. A. Morrone and T. De Mauro, Livelli di partecipazione alla vita della cultura in Italia, Fondazione Mondo Digitale, Roma (2008). 9. Due to the difficulty to integrate the measurement of amateur practices and membership in cultural associations in the framework of the
synthetics indicators proposed by the CDIS, these two categories would not be taken into account in the CDIS indicator on participation in identity-building cultural activities.
10. A. Morrone, Guidelines for measuring cultural participation (UNESCO Institute of Statistics, 2006). 11. Home based activities such as reading a book or watching television will thus not be considered in the framework of the CDIS cultural
participation indicators.
METHODOLOGY MANUAL • 85
SOC
IAL
PA
RT
ICIP
AT
ION
Going-out activities are relevant because:NN people actively choose to go out to attend a particular cultural activity;NN they imply physical places for encounters to occur between audiences and artists, as well as among
audiences, and thus high degrees of social interaction and connectivity.
Identity-building activities are relevant because:NN they are often at the core of the intangible cultural heritage of a society or a group;NN they represent a large share of the activities carried out by people and are too often invisible in official
statistics.
Cultural participation: Cultural participation includes cultural practices that may involve consumption as well as activities that are undertaken within the community, reflecting quality of life, traditions and beliefs. It includes attendance at formal and for-fee events, such as going to a movie or to a concert, as well as informal cultural action, such as participating in community cultural activities and amateur artistic productions, or everyday activities like reading a book. Cultural participation covers both active and passive behaviour; it includes the person who is listening to a concert and the person who practices music.12
On the basis of this definition, the CDIS indicators on cultural participation will address the following cultural activities:
NN Attendance to movies/cinema/film festivals;NN Attendance to the theatre or to a dance show;NN Attendance to live musical performances;NN Attendance to historical/cultural parks or heritage sites;NN Attendance to museums, art galleries or crafts expositions;NN Attendance to national or local festivals;NN Participation in community celebrations of cultural/historic events;NN Participation in community rites/events/ceremonies.
Data Source
NN National official survey data (e.g. cultural participation surveys, time user surveys).
For constructing these two core indicators, access to micro-data (individual response data) is required. To this end, an official or formal request to the institution holding the data will be required in most countries. Micro-data will also allow for a more precise picture of the patterns of cultural participation through disaggregation according to demographic characteristics.
Note: If no survey data on cultural participation is available at the country level, please consult the UNESCO CDIS Team to discuss alternatives.
Appendix I contains guidelines and recommendations for countries that do not have surveys including questions related to cultural participation and are interested in:
a . creating a survey on cultural participation, which looks at going-out and identity-building activities; and/or
b . adapting and improving existing surveys on cultural participation in order to foster internationally comparable results for going-out and identity-building activities.
The guidelines contain information on how to develop surveys on cultural participation, collect data and construct indicators.
12. Framework for Cultural Statistics, UNESCO, 2009, p. 45.
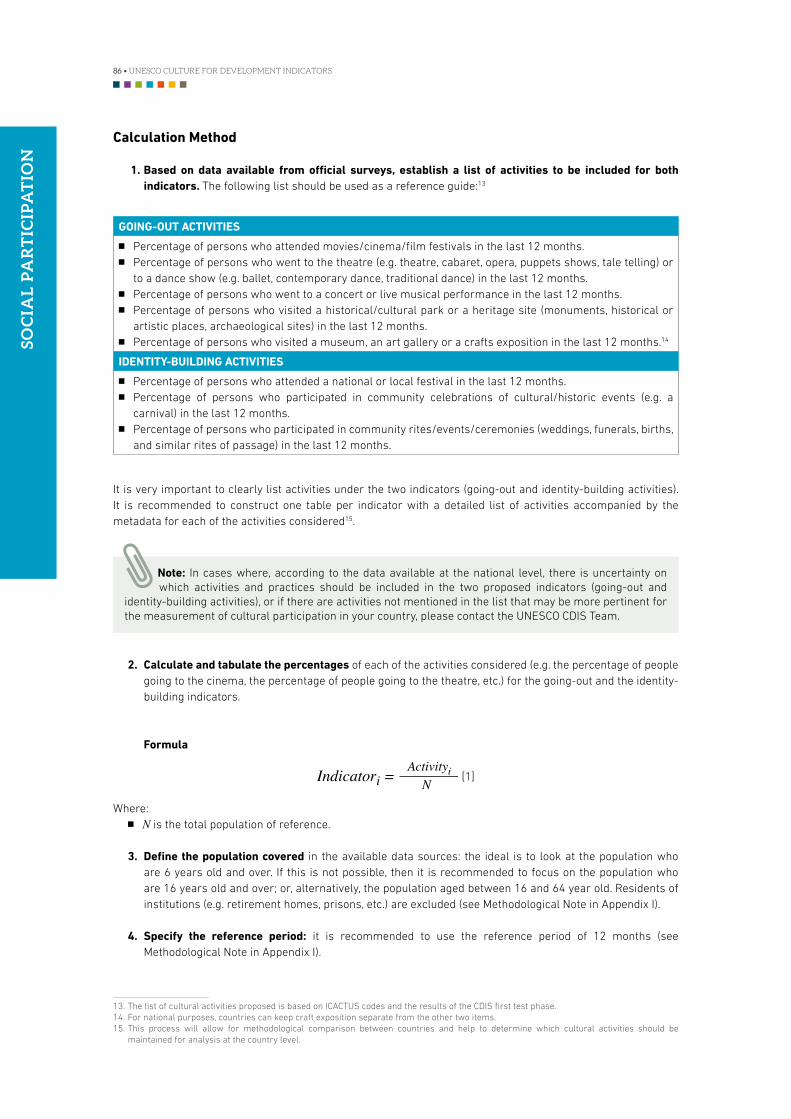
86 • UNESCO CULTURE FOR DEVELOPMENT INDICATORS
SOC
IAL
PA
RT
ICIP
AT
ION
Calculation Method
1 . Based on data available from official surveys, establish a list of activities to be included for both indicators . The following list should be used as a reference guide:13
14
GOING-OUT ACTIVITIES
NN Percentage of persons who attended movies/cinema/film festivals in the last 12 months.NN Percentage of persons who went to the theatre (e.g. theatre, cabaret, opera, puppets shows, tale telling) or
to a dance show (e.g. ballet, contemporary dance, traditional dance) in the last 12 months.NN Percentage of persons who went to a concert or live musical performance in the last 12 months.NN Percentage of persons who visited a historical/cultural park or a heritage site (monuments, historical or
artistic places, archaeological sites) in the last 12 months.NN Percentage of persons who visited a museum, an art gallery or a crafts exposition in the last 12 months.14
IDENTITY-BUILDING ACTIVITIES
NN Percentage of persons who attended a national or local festival in the last 12 months.NN Percentage of persons who participated in community celebrations of cultural/historic events (e.g. a
carnival) in the last 12 months.NN Percentage of persons who participated in community rites/events/ceremonies (weddings, funerals, births,
and similar rites of passage) in the last 12 months.
It is very important to clearly list activities under the two indicators (going-out and identity-building activities). It is recommended to construct one table per indicator with a detailed list of activities accompanied by the metadata for each of the activities considered15.
Note: In cases where, according to the data available at the national level, there is uncertainty on which activities and practices should be included in the two proposed indicators (going-out and
identity-building activities), or if there are activities not mentioned in the list that may be more pertinent for the measurement of cultural participation in your country, please contact the UNESCO CDIS Team.
2 . Calculate and tabulate the percentages of each of the activities considered (e.g. the percentage of people going to the cinema, the percentage of people going to the theatre, etc.) for the going-out and the identity-building indicators.
Formula
Indicatori =Activityi
N [1]
Where:NN N is the total population of reference.
3 . Define the population covered in the available data sources: the ideal is to look at the population who are 6 years old and over. If this is not possible, then it is recommended to focus on the population who are 16 years old and over; or, alternatively, the population aged between 16 and 64 year old. Residents of institutions (e.g. retirement homes, prisons, etc.) are excluded (see Methodological Note in Appendix I).
4 . Specify the reference period: it is recommended to use the reference period of 12 months (see Methodological Note in Appendix I).
13. The list of cultural activities proposed is based on ICACTUS codes and the results of the CDIS first test phase. 14. For national purposes, countries can keep craft exposition separate from the other two items. 15. This process will allow for methodological comparison between countries and help to determine which cultural activities should be
maintained for analysis at the country level.
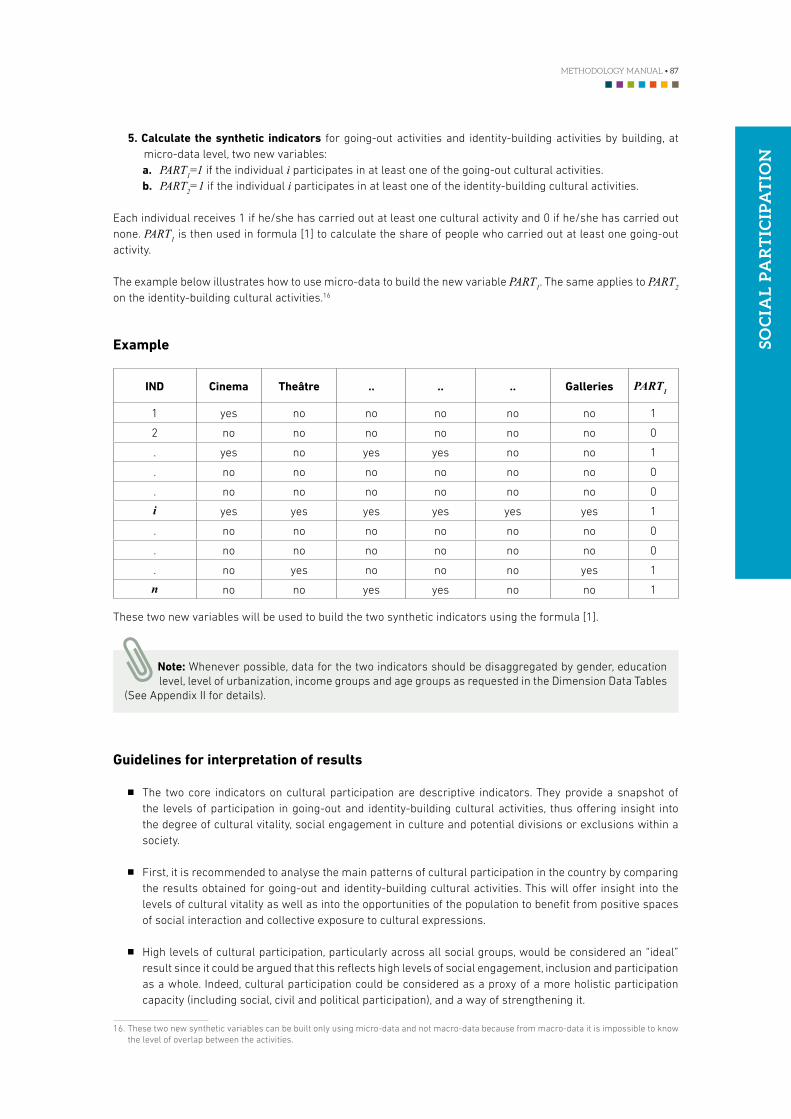
METHODOLOGY MANUAL • 87
SOC
IAL
PA
RT
ICIP
AT
ION
5 . Calculate the synthetic indicators for going-out activities and identity-building activities by building, at micro-data level, two new variables:a . PART1=1 if the individual i participates in at least one of the going-out cultural activities.b . PART2=1 if the individual i participates in at least one of the identity-building cultural activities.
Each individual receives 1 if he/she has carried out at least one cultural activity and 0 if he/she has carried out none. PART1 is then used in formula [1] to calculate the share of people who carried out at least one going-out activity.
The example below illustrates how to use micro-data to build the new variable PART1. The same applies to PART2 on the identity-building cultural activities.16
Example
IND Cinema Theâtre . . . . . . Galleries PART1
1 yes no no no no no 1
2 no no no no no no 0
. yes no yes yes no no 1
. no no no no no no 0
. no no no no no no 0
i yes yes yes yes yes yes 1
. no no no no no no 0
. no no no no no no 0
. no yes no no no yes 1
n no no yes yes no no 1
These two new variables will be used to build the two synthetic indicators using the formula [1].
Note: Whenever possible, data for the two indicators should be disaggregated by gender, education level, level of urbanization, income groups and age groups as requested in the Dimension Data Tables
(See Appendix II for details).
Guidelines for interpretation of results
NN The two core indicators on cultural participation are descriptive indicators. They provide a snapshot of the levels of participation in going-out and identity-building cultural activities, thus offering insight into the degree of cultural vitality, social engagement in culture and potential divisions or exclusions within a society.
NN First, it is recommended to analyse the main patterns of cultural participation in the country by comparing the results obtained for going-out and identity-building cultural activities. This will offer insight into the levels of cultural vitality as well as into the opportunities of the population to benefit from positive spaces of social interaction and collective exposure to cultural expressions.
NN High levels of cultural participation, particularly across all social groups, would be considered an “ideal” result since it could be argued that this reflects high levels of social engagement, inclusion and participation as a whole. Indeed, cultural participation could be considered as a proxy of a more holistic participation capacity (including social, civil and political participation), and a way of strengthening it.
16. These two new synthetic variables can be built only using micro-data and not macro-data because from macro-data it is impossible to know the level of overlap between the activities.
88 • UNESCO CULTURE FOR DEVELOPMENT INDICATORS
SOC
IAL
PA
RT
ICIP
AT
ION
NN Non-participation in cultural activities or low levels of participation, especially if reserved for selected social groups, should be analysed with even more attention. Indeed, such results could be considered as a sign of social fragmentation or marginalization. Thus, special attention should be given to marginalized individuals and groups that do not participate (or participate less). To this end, the breakdown of data according to the demographic variables proposed (gender, education, urbanization, income and age) is crucial.
NN When contextualizing and interpreting results, it is important to consider their interaction with the other indicators of the CDIS matrix, such as the distribution of cultural infrastructures (Governance Dimension) and household expenditures on culture (Economic Dimension), among others.
NN This core indicator also contributes to assessing transversal themes, such as the implementation of cultural rights, conviviality and social cohesion, and the cultural cycle.
3. TOLERANCE OF OTHER CULTURES
Introduction
Modern societies are characterised by multiculturalism, where different cultures and a diversity of local and foreign cultural expressions co-exist in the same territory. As Our Creative Diversity pointed out, “no culture is an island”:17 all cultures are the enriched by-products of a combination of influences and traditions borrowed from others. Drawing on cultural diversity as a resource for strengthening social cohesion can be an effective long-term investment in national development with benefits for the economy, creativity (through exposure to different cultural forms and traditions), and conflict reduction. Indeed, pluralism, including cultural pluralism, has significant social benefits for sustainable development.18
Cultural values, aptitudes and norms which encourage tolerance of diversity, openness and respect for all contribute to avoid tension and to promote social harmony and cohesion, especially in polyethnic and multicultural countries. Therefore, measuring the levels of tolerance towards individuals and groups with different cultural backgrounds provides insights into levels of potential interconnectedness between cultures as well as of the potential of a given society to draw on cultural diversity as a resource for development.
In order to assess whether cultural differences are perceived in a given society as alien and unacceptable, or as an enriching and valuable experience, the proposed indicator follows the Inglehart approach. Inglehart and al. have shown that tolerant people tend to accept all diverse groups as neighbours while intolerant people would like to have only people similar to them as neighbours.19
>> Description: Degree of tolerance within a society towards people from different cultural backgrounds
Purpose
This indicator is intended to evaluate the degree of tolerance and openness to diversity, thus providing insight into the levels of interconnectedness within a given society.
Data Sources
NN World Values Survey (WVS)NN Official National SurveysNN Regional Surveys
17. J. Pérez de Cuéllar, Our Creative Diversity, UNESCO, (1996), p. 5418. Our Creative Diversity, pp. 55-57 19. R. Inglehart et al., “Development, freedom, and rising of happiness”, Perspective on psychological science (2008), vol. 3, n. 4.

METHODOLOGY MANUAL • 89
SOC
IAL
PA
RT
ICIP
AT
ION
Calculation Method The calculation method will differ depending on the data source available. The calculation methods are organized in order of preference of data source.
1 . World Values Survey: Using V35, V37 and V39 (in the V43MD_MDI section): “People that responded that they would not like to
have as neighbours”, calculate the percentage of people who do not mention that having the following groups as a neighbour is undesirable:
a . People of a different raceb . Immigrants/foreign workersc . People of different religion
2 . Official national or regional surveys: Using appropriate questions included in the most recent official national or regional survey, measure
the levels of trust towards:
a . People of a different raceb . Immigrants/foreign workersc . People of different religion
Ideally, the wording of the question should be the same as in the WVS (see above). The percentages of people who trust each of the items need to be reflected in the Data Table.
Note: For many countries, the national or regional surveys will not include questions identical to those of the WVS. In such cases, please identify the most relevant questions available in order to construct
an alternative indicator on the tolerance of other cultures. For instance, when using the Latino Barometer, you could refer to Question A505218 and select the items that are most relevant for your country.
In all cases, please specify in the Technical Report the exact wording of the questions used to construct this alternative indicator, as well as all the possible responses and the results obtained for each of them. Based on this data please construct the final result reflecting the percentage of people who do not mind (or like) having people of different cultural backgrounds or origins (people of a different race, religions, and/or immigrants) as neighbours. Create a new sheet for the alternative indicator in the Data Table of the Social Participation Dimension, and insert the final result and raw data, being sure to specify the calculations used.
Note: Whenever possible, all data should be disaggregated by gender and age groups as requested in the Data Table. Additional breakdowns according to variables such as education level, urbanization,
income levels, etc. are also recommended whenever the available data source allows it. For example, WVS proposes: age of the respondent, education level, employment status, gender, marital status, occupation, religious practice and subjective social class (head of household). See Appendix II for details.
Formula
For all alternatives proposed, the synthetic indicator can be built using the share of people who trust each of the listed groups. The synthetic indicator is a simple sum of the shares divided by its maximum:
DoC = Rfi
Ni=1
k /k [2]
Where:NN fi is the number of people who trust item iNN N is the population of reference, and NN k the number of items considered (three using the WVS).
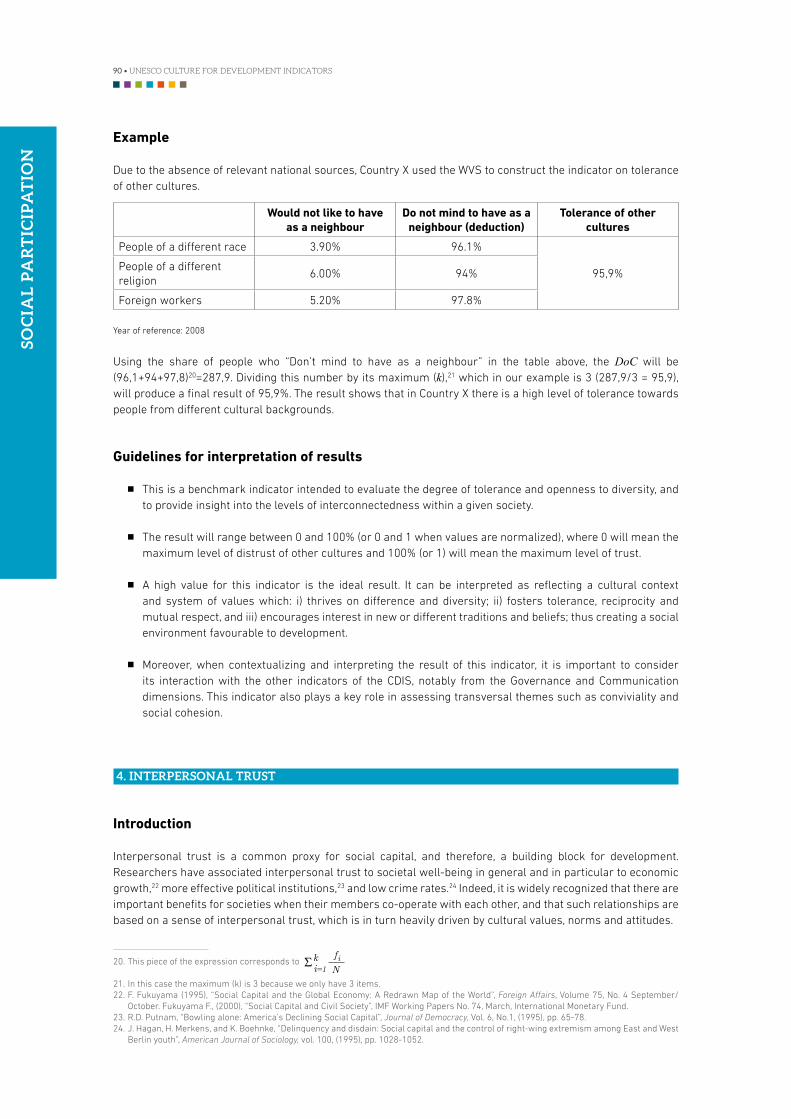
90 • UNESCO CULTURE FOR DEVELOPMENT INDICATORS
SOC
IAL
PA
RT
ICIP
AT
ION
Example
Due to the absence of relevant national sources, Country X used the WVS to construct the indicator on tolerance of other cultures.
Would not like to have as a neighbour
Do not mind to have as a neighbour (deduction)
Tolerance of other cultures
People of a different race 3.90% 96.1%
95,9%People of a different religion
6.00% 94%
Foreign workers 5.20% 97.8%
Year of reference: 2008
Using the share of people who “Don’t mind to have as a neighbour” in the table above, the DoC will be (96,1+94+97,8)20=287,9. Dividing this number by its maximum (k),21 which in our example is 3 (287,9/3 = 95,9), will produce a final result of 95,9%. The result shows that in Country X there is a high level of tolerance towards people from different cultural backgrounds.
Guidelines for interpretation of results
NN This is a benchmark indicator intended to evaluate the degree of tolerance and openness to diversity, and to provide insight into the levels of interconnectedness within a given society.
NN The result will range between 0 and 100% (or 0 and 1 when values are normalized), where 0 will mean the maximum level of distrust of other cultures and 100% (or 1) will mean the maximum level of trust.
NN A high value for this indicator is the ideal result. It can be interpreted as reflecting a cultural context and system of values which: i) thrives on difference and diversity; ii) fosters tolerance, reciprocity and mutual respect, and iii) encourages interest in new or different traditions and beliefs; thus creating a social environment favourable to development.
NN Moreover, when contextualizing and interpreting the result of this indicator, it is important to consider its interaction with the other indicators of the CDIS, notably from the Governance and Communication dimensions. This indicator also plays a key role in assessing transversal themes such as conviviality and social cohesion.
4. INTERPERSONAL TRUST
Introduction
Interpersonal trust is a common proxy for social capital, and therefore, a building block for development. Researchers have associated interpersonal trust to societal well-being in general and in particular to economic growth,22 more effective political institutions,23 and low crime rates.24 Indeed, it is widely recognized that there are important benefits for societies when their members co-operate with each other, and that such relationships are based on a sense of interpersonal trust, which is in turn heavily driven by cultural values, norms and attitudes.
20. This piece of the expression corresponds to
21. In this case the maximum (k) is 3 because we only have 3 items. 22. F. Fukuyama (1995), “Social Capital and the Global Economy: A Redrawn Map of the World”, Foreign Affairs, Volume 75, No. 4 September/
October. Fukuyama F., (2000), “Social Capital and Civil Society”, IMF Working Papers No. 74, March, International Monetary Fund. 23. R.D. Putnam, “Bowling alone: America’s Declining Social Capital”, Journal of Democracy, Vol. 6, No.1, (1995), pp. 65-78. 24. J. Hagan, H. Merkens, and K. Boehnke, “Delinquency and disdain: Social capital and the control of right-wing extremism among East and West
Berlin youth”, American Journal of Sociology, vol. 100, (1995), pp. 1028-1052.
METHODOLOGY MANUAL • 91
SOC
IAL
PA
RT
ICIP
AT
ION
On the contrary, low levels of interpersonal trust are a strong indicator of a society with cultural values and norms that stifle co-operation, and by consequence, make it difficult to improve individuals’ capabilities and opportunities. 25
The canonical question developed by Rosenberg in 1956, “Generally speaking, would you say that most people can be trusted or that you need to be very careful in dealing with people?”26 is cultural because it relates to moralistic trust and it is the sort of cultural behaviour people learn through religion, family or education. This question highlights what people should think rather than what they actually think. This is a powerful indicator highlighting levels of trust within the community, which has been adopted as a proxy for social capital in other global indices.27
>> Description: Degree of interpersonal trust
Purpose
This indicator assesses the level of trust and sense of solidarity and cooperation within a given society, thus providing insight into its social capital.
Data Sources
NN National surveys including the Rosenberg questionNN Regional surveys including the Rosenberg question (Latino Barometer: Interpersonal Trust (A60112); Asian
Barometer: Most people can be trusted (Q024); Afro Barometer: Most people can be trusted, or Trust other (nationality)
NN World Values Survey (WVS)NN Gallup World Poll (GPW)
Calculation Method
This indicator can be constructed using the most recent data for your country included in the three following data sources, organized by preference:
1 . Official national or regional surveys, implementing the following Rosenberg question: “Generally speaking, would you say that most people can be trusted or that you need to be very careful in dealing with people?
a . Most people can be trusted.b . Need to be very careful.”
2 . World Values Survey: The Rosenberg question has been included in the WVS since 1981 to measure interpersonal trust: “V23.-
Generally speaking, would you say that most people can be trusted or that you need to be very careful in dealing with people?
a . Most people can be trusted.b . Need to be very careful.”
For options 1) and 2) the indicator will be the percentage of people that reply “most people can be trusted” to the Rosenberg question.
25. A. Morrone et al. “How Good is Trust? Measuring Trust and its Role for the Progress of Societies”, (2009/03), work document from OECD.26. M. J. Rosenberg, “Cognitive structure and attitudinal affect”, The Journal of Abnormal and Social Psychology, (1956, n. 53), pp. 367-372 27. For example, it has been used in the recent OECD publication, How’s life?. (2011).
92 • UNESCO CULTURE FOR DEVELOPMENT INDICATORS
SOC
IAL
PA
RT
ICIP
AT
ION Note: If you use as a data source the Rounds 1 to 4 of the Afro Barometer, which offers 4 possible
responses (instead of two), the indicator will be the percentage of people that reply “a lot” to the relevant question.
3 . Gallup World Poll
If your country is not covered by the WVS, the 2005 Gallup World Poll included the Rosenberg question. However, it does not collect this question in its standard annual survey.
Note: Whenever possible, all data should be disaggregated by sex and age groups as requested in the Dimension Data Table. Additional breakdowns according to variables such as education level,
urbanization, income levels, etc. are also recommended whenever the available data source allows. See Appendix II for details.
Example
Country X used the 2005 WVS (value V23) to construct the indicator on interpersonal trust. Levels of interpersonal trust seem to be very low, as only 14.5% of the population consider that most people can be trusted.
WVS allows for a large series of disaggregation that may highlight interesting results. For instance, in country X, people aged fifty and over, in particular men, tend to trust more than younger generations.
Guidelines for interpretation of results
NN This is a benchmark indicator assessing the level of trust and sense of solidarity and cooperation within a given society, thus providing insight into its social capital. A result close to 100% of people replying “most people can be trusted” to the Rosenberg question (or 1 when values are normalized between 0 and 1) is the ideal.
NN The higher the percentage, the higher the levels of interpersonal trust and feelings of mutual cooperation and solidarity, and as a consequence, the higher the levels of social capital. Cultural values, attitudes and norms will then have proved to foster cooperation among the members of the society and to contribute to nurturing social capital and development.
NN Even if the indicator is phrased in “positive” terms, it is important to also consider levels of interpersonal mistrust when analyzing the results. Lows level of interpersonal trust are an indicator of a society with cultural values, attitudes and norms that stifle co-operation, and by consequence, make it difficult to improve individuals’ capabilities and opportunities towards development. Moreover, this is where disaggregation according to key variables can play an important role in deciphering which groups are more likely to mistrust and orient the research on the causes of mistrust.
NN When contextualizing and interpreting the results for this indicator, it is important to consider the interaction with the other indicators of the Social Participation dimension, as well as with the global matrix of CDIS indicators for assessing transversal themes such as conviviality and social cohesion.
5. FREEDOM OF SELF-DETERMINATION
Introduction
Self-determination is recognized as an individual’s human right in Article 1 of the International Covenant on Civil and Political Rights and the International Covenant on Economic, Social and Cultural Rights which states that “All
METHODOLOGY MANUAL • 93
SOC
IAL
PA
RT
ICIP
AT
ION
peoples have the right of self-determination. By virtue of that right they freely determine their political status and freely pursue their economic, social and cultural development”.
Self-determination describes a state in which individuals feel that they possess the freedom to make their own choices over time,28 including in respect to making choices regarding their cultural participation and cultural allegiances. Self-determination implies the individual’s right to live the life they choose, according to their own values and beliefs. In this sense, self-determination is strongly linked to cultural values, aptitudes and convictions through which individuals and communities express the meanings they give to their lives and their own development.
Self-determination is about empowerment and is strongly linked to the right to development.29 Indeed, the Declaration on the Right to Development establishes in Article 1.1 that “The right to development is an inalienable human right by virtue of which every human person and all peoples are entitled to participate in, contribute to, and enjoy economic, social, cultural and political development, in which all human rights and fundamental freedoms can be fully realized” and in Article 1.2 that the “The human right to development also implies the full realization of the right of peoples to self-determination”.
Individuals feel empowered when they can act independently according to what they value without fear or concern of reprisals from others, including authority figures. This tends to boost individual well-being and life satisfaction, which is a phenomenon found across many different societies and cultures.30
On the contrary, in situations where self-determination is perceived to be restricted by an external force or body, there are negative implications for human development. Individuals feel frustrated in their ability to actively engage or express themselves and their capabilities to develop are undermined. Moreover, restrictions on self-determination can have a profoundly negative impact on respect for cultural diversity: such restrictions can include the inability to participate freely in cultural life and development, to express cultural allegiances or identities, or to produce creative works due to external prohibitions.
>> Description: Median score of perceived freedom of self-determination
Purpose
This indicator focuses on the percentage of people who think that they have control over their lives in order to assess the levels of implementation of the individual’s right of self-determination, that is, to live the life they choose, according to their own values and beliefs. Thus, this indicator evaluates individuals’ sense of empowerment to decide and orientate their development.
Data sources
NN National official surveys with questions related to freedom of self-determinationNN World Values Survey (WVS)NN Regional surveys with questions related to freedom of self-determination, such as the Latino Barometer
Calculation Method
This indicator can be constructed using the following data sources.
28. According to the self-determination theory (SDT) of Ryan and Deci. R. M. Ryan and E. L. Deci, “Self-determination theory and the facilitation of intrinsic motivation, social development and well-being”, American Psychologist 55, (2000), pp. 68-78.
29. The right to development was proclaimed in the Declaration on the Right to Development, adopted in 1986 by the United Nations General Assembly (GA) in its resolution 41/128. This right is also recognized in the African Charter on Human and Peoples’ Rights and the Arab Charter on Human Rights and re-affirmed in several instruments including the 1992 Rio Declaration on Environment and Development, the 1993 Vienna Declaration and Programme of Action, the Millennium Declaration, the 2002 Monterrey Consensus, the 2005 World Summit Outcome Document and the 2007 Declaration on the Rights of Indigenous Peoples.
30. V. I. Chirkov, Culture, personal autonomy and individualism: their relationships and implications for personal growth and well-being (University of Saskatchewan, 2001).
94 • UNESCO CULTURE FOR DEVELOPMENT INDICATORS
SOC
IAL
PA
RT
ICIP
AT
ION
1 . World Values Survey:Through V46, the WVS proposes respondents to evaluate their own level of perceived freedom of self-determination using a scale, where 1 means “none at all” and 10 means “a great deal”.
V 46. Some people feel they have completely free choice and control over their lives, while other people feel that they do have no real effect on what happens to them. Please use this scale where 1 means “no choice at all” and 10 means “a great deal of choice” to indicate how much freedom of choice and control you feel you have over the way your life turns out (code one number):
Not at all A great deal
1 2 3 4 5 6 7 8 9 10
Based on this data source, construct the indicator by calculating the median of the score given by the individuals:
a . Calculate the cumulated percentages; b . underline the two items around 50%; andc . calculate the median with the following formula.
Formula
median = 50% - yk
yk+1
- yk
+k
Where:NN k is the response just before 50%, and NN yk is the associated cumulated percentage.
See a detailed example below.
The indicator will then be the median of the score given by the individuals to V46. The higher the median, the higher the level of perceived freedom of self-determination is in the given country.
2 . Official national or regional surveysIf in your country, there exists an official national or regional survey that includes a question related to freedom of self-determination using a wording very similar to V46 of the WVS, and including the same scale in the scope of possible responses (1-10), then this source should be privileged.
Note: If you use as data source the Latino Barometer, please refer to question “Scale of freedom to choose” (A119) which is identical to V 46 of the World Values Survey.
In this case, the indicator would be constructed in the same way as for the WVS. That is, calculate the median of the score given by the individuals to the relevant question. Similarly, the higher the median, the higher the level of perceived freedom of self-determination is in the given country.31
Note: If your national data source contains a relevant question on freedom of self-determination using a different scale in the scope of possible responses than the one proposed by WVS, please
contact UNESCO CDIS Team in order to construct an appropriate indicator for your country.
31. The median is less affected by extreme values and is considered as a more consistent indicator than the average for skewed distributions. Indeed, by focusing on a “hypothetical completely average person” (the one who split the higher half of the population from the lower half) the median score of perceived self-determination is not affected by outliers and gives an accurate picture of a skewed distribution.
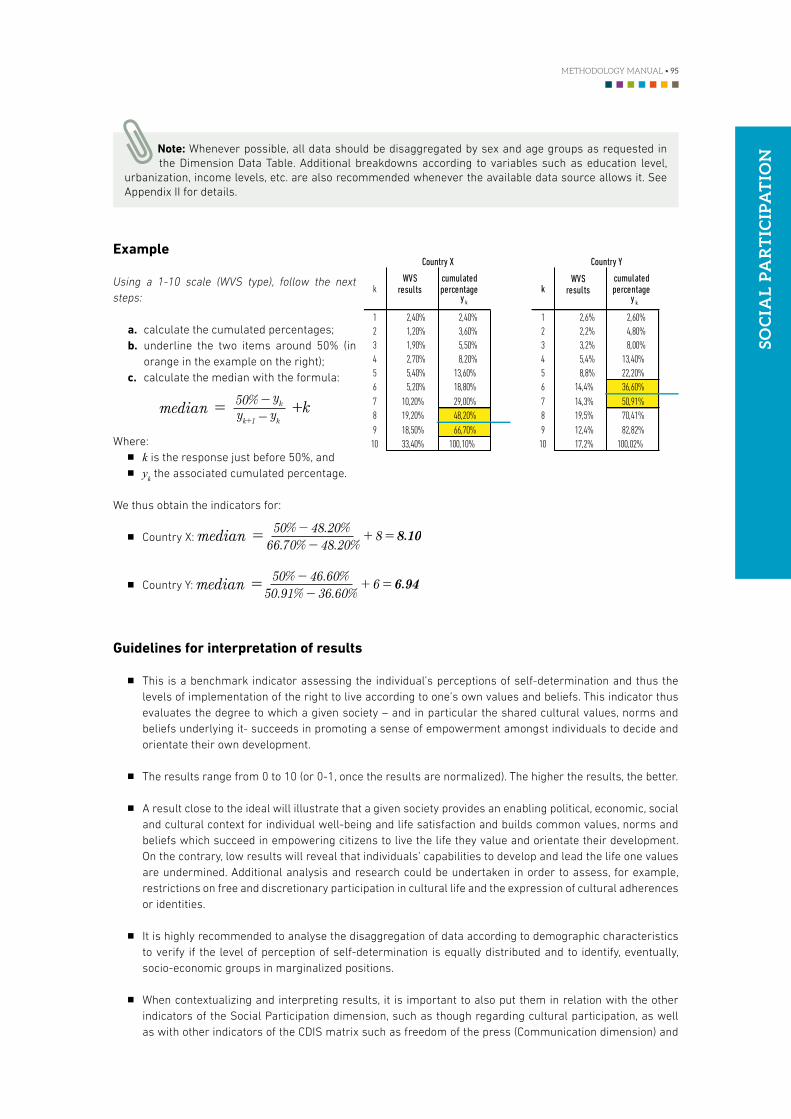
METHODOLOGY MANUAL • 95
SOC
IAL
PA
RT
ICIP
AT
ION
Note: Whenever possible, all data should be disaggregated by sex and age groups as requested in the Dimension Data Table. Additional breakdowns according to variables such as education level,
urbanization, income levels, etc. are also recommended whenever the available data source allows it. See Appendix II for details.
Example
Using a 1-10 scale (WVS type), follow the next steps:
a . calculate the cumulated percentages; b . underline the two items around 50% (in
orange in the example on the right);c . calculate the median with the formula:
median = 50% - yk
yk+1
- yk
+k
Where:NN k is the response just before 50%, and NN yk the associated cumulated percentage.
We thus obtain the indicators for:
NN Country X: median = 50% - 48.20%+ 8 = 8.10
66.70% - 48.20%
NN Country Y: median = 50% - 46.60%+ 6 = 6.94
50.91% - 36.60%
Guidelines for interpretation of results
NN This is a benchmark indicator assessing the individual’s perceptions of self-determination and thus the levels of implementation of the right to live according to one’s own values and beliefs. This indicator thus evaluates the degree to which a given society – and in particular the shared cultural values, norms and beliefs underlying it- succeeds in promoting a sense of empowerment amongst individuals to decide and orientate their own development.
NN The results range from 0 to 10 (or 0-1, once the results are normalized). The higher the results, the better.
NN A result close to the ideal will illustrate that a given society provides an enabling political, economic, social and cultural context for individual well-being and life satisfaction and builds common values, norms and beliefs which succeed in empowering citizens to live the life they value and orientate their development. On the contrary, low results will reveal that individuals’ capabilities to develop and lead the life one values are undermined. Additional analysis and research could be undertaken in order to assess, for example, restrictions on free and discretionary participation in cultural life and the expression of cultural adherences or identities.
NN It is highly recommended to analyse the disaggregation of data according to demographic characteristics to verify if the level of perception of self-determination is equally distributed and to identify, eventually, socio-economic groups in marginalized positions.
NN When contextualizing and interpreting results, it is important to also put them in relation with the other indicators of the Social Participation dimension, such as though regarding cultural participation, as well as with other indicators of the CDIS matrix such as freedom of the press (Communication dimension) and
WVS results
cumulated percentage
cumulated percentage
y k
1 2,40% 2,40% 1 2,6% 2,60%2 1,20% 3,60% 2 2,2% 4,80%3 1,90% 5,50% 3 3,2% 8,00%4 2,70% 8,20% 4 5,4% 13,40%5 5,40% 13,60% 5 8,8% 22,20%6 5,20% 18,80% 6 14,4% 36,60%7 10,20% 29,00% 7 14,3% 50,91%8 19,20% 48,20% 8 19,5% 70,41%9 18,50% 66,70% 9 12,4% 82,82%
10 33,40% 100,10% 10 17,2% 100,02%
Country X
WVS resultskk
Country Y
y k
96 • UNESCO CULTURE FOR DEVELOPMENT INDICATORS
SOC
IAL
PA
RT
ICIP
AT
ION
participation of civil society in cultural governance (Governance dimension). Indeed, this indicator can play a key role in assessing transversal themes such as the implementation of cultural rights, conviviality and social cohesion.
Alternative indicator
If your country is not covered by the WVS and does not have an equivalent data source available, an alternative data source including a relevant question on the perception of freedom of self-determination found in national, regional or international surveys could be considered.
Ideally, the question should be presented in the form of a yes/no question. This is for instance the format used in the Gallup World Poll (GWP), which includes the following question “In this country are you satisfied or dissatisfied with your freedom to choose what you do with your life?” with yes/no as possible answers.
Using GWP or a similar national data source, you may obtain two kinds of results. Either: i) the percentage of people satisfied with their level of freedom of self-determination is higher than the percentage of people who are dissatisfied; or ii) the percentage of people satisfied with their level of freedom of self-determination is lower than the percentage of people who are dissatisfied.
On this basis, you may construct an estimation of the core indicator proposed as follows:
NN If the percentage of people satisfied with their level of freedom of self-determination is higher than 50%, use the following formula:
estimation = 5 X (50%+2yes% - 100%)yes%
NN If the percentage of people satisfied with their level of freedom of self-determination is lower than 50%, use the following formula:
estimation = 5 2 X no% = 5
2 X(1-yes%)
The assumption is that answering “no” is equivalent to an answer between 1 and 5; and that answering “yes” is equivalent to an answer between 6 and 10 in a “1 to 10 scale” model such as the WVS. The same type of calculation of the median is then applied.
Once again, the higher the estimation, the higher the level of freedom of self-determination is.
This alternative is however very basic and its predictive power low.32 Therefore, it should only be used if there are no other alternatives. The results obtained with such a basic indicator will just be an estimation and should be interpreted with care.
32. It is evident that the level of self-determination lies on a continuum and it is poorly measured with a dichotomous question.
METHODOLOGY MANUAL • 97
SOC
IAL
PA
RT
ICIP
AT
ION
APPENDIX I
Methodological note for the calculation of the core indicators on cultural participation
If there are no official data sources in your country which allow for the construction of the core indicators on cultural participation, it is recommended to create a survey on cultural participation, which looks at going-out and identity-building activities. It may also be useful to improve the existing surveys in order to allow for the international comparability of results.
The module on cultural participation is very short and can be added and/or adapted to existing surveys with the following guidelines:
1 . Include or adapt the questions of existing official surveys in order to integrate the following questions:33343536
GOING-OUT ACTIVITIES
Cinema Did you attend a movie/cinema/film festival in the last 12 months?33
Theatre/Dance show34 Did you go to the theatre (including theatre, cabaret, opera, puppets shows, and tale telling) or to a dance show (including ballet, modern dance and traditional dance) in the last 12 months?33
Concerts Did you go to a concert35 or a live musical performance in the last 12 months?33
Heritage Did you visit a historical/cultural park or a heritage site (including monuments, historical or artistic places, archaeological sites) in the last 12 months?33
Museums Did you visit a museum, an art gallery or a crafts exposition in the last 12 months?33
Exhibitions Did you visit galleries, exhibitions36 or crafts exposition in the last 12 months?33
IDENTITY-BUILDING ACTIVITIES
Festivals Did you attend a national or local festival in the last 12 months?33
Community cultural and historic events
Did you participate in community celebrations of cultural/historic events (such as carnival) in the last 12 months?33
Community rites and ceremonies
Did you participate in community rites/events/ceremonies (such as weddings, funerals, births, and similar rites of passage) in the last 12 months?33
2 . Using the questions listed above, you would be able to calculate the following indicators:
GOING-OUT ACTIVITIES
NN Percentage of persons who attended a movie/cinema/film festival in the last 12 months.NN Percentage of persons who went to the theatre or to a dance show in the last 12 months.NN Percentage of persons who went to a live musical performance in the last 12 months.NN Percentage of persons who visited a historical/cultural park or a heritage site in the last 12 months.NN Percentage of persons who visited a museum, an art gallery or a crafts exposition in the last 12 months.
IDENTITY-BUILDING ACTIVITIES
NN Percentage of persons who attended a national or local festival in the last 12 months.NN Percentage of persons who participated in community celebrations of cultural/historic events in the last
12 months.NN Percentage of persons who participated in community rites/events/ceremonies in the last 12 months.
33. Possibly the following frequency categories should be used: More than 12 times, 7-12 times, 4-6 times, 1-3 times. 34. These two categories (theatre and dance) can be detailed using different questions if needed for national purposes. 35. This question can be detailed using different sub-questions as for example, concert of: classical music, rock concert, jazz or blues concert,
folk music concert, world music concert, concert or a party of urban (rap, hip-hop), dance feast or a house party, concert of popular national or local music, concert of a singer/songwriter, concert of other music. Nevertheless each country should provide only an aggregate indicator.
36. For national purposes, countries can keep craft expositions separately from the other two items.
98 • UNESCO CULTURE FOR DEVELOPMENT INDICATORS
SOC
IAL
PA
RT
ICIP
AT
ION
All indicators will be the percentage calculated using the formula:
Indicatori =Activityi
N [1]
Where N is the total population of reference.
Keep the basic indicators listed above separate in order to have a specific indicator for each activity (e.g. percentage of people going to the cinema, percentage of people going to the theatre, etc.).
3 . For the calculation of the synthetic indicators proposed by the UNESCO CDIS build the following two new variables at the micro-data level:
NN if the individual participates in at least one of the going-out cultural activities.NN if the individual participates in at least one of the identity-building cultural activities.
These two new variables will be used to build the two synthetic indicators using the formula [1].
4 . Guidelines for the method of data collection:
NN Face-to-face interviews should be used as this would produce better data on participation in cultural activities (and related issues) than other data collection methods. Visual support, such as show cards, in face-to-face interviews would help with answers to complex questions.
NN Computer-Assisted Telephone Interview (CATI) and Computer-Assisted Personal Interviews (CAPI) should be used whenever possible. However, CATI is increasingly affected by systematic distortions of the sample due to the increasing share of households without a fixed telephone line, while CAPI is a very expensive data collection method. A CATI-CAPI mixed data collection method could be the best way to reduce the distortion of the sample and reduce the costs of data collection.
NN Computer-assisted interviews make it possible to collect information with multiple response pathways, complex flows and built-in edits and checking rules. The use of computer assistance may require more time to plan and execute than traditional paper and pencil methods. However the data check and validation would be significantly shortened.
NN Proxy interviews should be avoided as much as possible in cultural participation surveys since proxy answers on participation in cultural activities underestimate the phenomenon because the respondent does not know all the cultural activities carried out by all of the other members of the household.
5 . Definition of population
A survey on cultural participation should give information on this subject in a very broad sense. This means that the survey should cover the population as a whole and not concentrate on specific social groups such as the labour force, the unemployed and so on. To have a complete picture of the situation in a country, a survey should cover the widest population possible.
The ideal situation is to focus on the population who are 6 years old and over in order to make it possible to compare the cultural participation level of very different age groups as well as the cultural participation patterns of young and elderly people that are involved in very different cultural activities.
However, considering that this is an ambitious target, the recommendation is to focus at least on the population who are 16 years old and over, or alternatively the population of 16-64 year olds. This would be the core sample, which all participating countries should use but countries are free to widen the age bands if this is feasible.
6 . Reference period
Generally, estimations on cultural participation are produced using a reference period of 12 months. Such a period is adopted in different surveys and, therefore, it is recommended for reporting participation on cultural activities.
METHODOLOGY MANUAL • 99
SOC
IAL
PA
RT
ICIP
AT
ION
A shorter reference period could lead to a better recall of cultural activities but there are serious disadvantages to such a solution as most respondents would probably not have participated in any activity over this period, limiting the analytical potential of the data, while the results would be strongly influenced by seasonal effects.
A harmonised reference period is a key element to enable comparable data between countries. It is easier to compare data collected in different years but with the same reference period than data collected in the same year but with very different reference periods. For example, it is possible to compare data on cultural participation collected in different years but with the same 12 months reference period. However, it is practically impossible to compare estimates based on a 12 months reference period with estimates based on a weekly reference period.
APPENDIX II
Details on disaggregation of the indicators
It is very difficult to give suggestions on this topic since the possible disaggregation depends on many factors such as the source of data, the sample, the variables collected and so on. However, it is possible to give some general indications based on previous experiences of harmonized international data collections (e.g. Eurostat ICT data collection).
The most important socio-demographic background characteristics which should be taken into account in the analysis of the indicators are:
Gender:NN MaleNN Female
Age:NN Age should be collected in completed years and should be reported in age classes.NN The number of age classes depended on the sample. Each country should cover at least the population of 15
years and over and should be able to report at least three age classes (as in the WVS): 15-29, 30-49, 50 and over.
Education level37:NN Primary or lower secondary education, no formal education [ISCED 0, 1, 2]NN Upper post-secondary education but not tertiary [ISCED 3, 4]NN Tertiary education [ISCED 5, 6]
Employment situation:NN Employee or self-employedNN UnemployedNN StudentNN Other
Degree of urbanization:NN Urban areaNN Rural area
Household income:NN Income quintiles
37. ISCED is the International Standard Classification of Education. For more information see: http://www.uis.unesco.org/Education/Pages/international-standard-classification-of-education.aspx

Core Indicators Description
GENDER EQUALITY OBJECTIVE OUTPUTS
Index of the gaps between women and men in political, education and labour domains and in gender-equity legislative frameworks (objective outputs)
PERCEPTION OF GENDER EQUALITY
Degree of positive assessment of gender equality (subjective output)
GENDER EQUALITY
102 • UNESCO CULTURE FOR DEVELOPMENT INDICATORS
GE
ND
ER
EQ
UA
LIT
Y
I. RELEVANCE OF THE DIMENSION FOR CULTURE AND DEVELOPMENT
Relations between women and men play an important role in shaping as well as challenging and transforming the cultural values, norms and practices of a society, which in turn determine these relations. Indeed, relations between women and men evolve over time and are influenced by a matrix of socio-economic, political and cultural factors. Changes in the combination of such factors can positively or negatively affect these relations. This can be seen over the past century, when important changes, such as large numbers of women entering the workforce and politics, or greater possibilities available for women to control their reproduction, greatly altered the status quo between women and men. How such socio-economic and political factors change, evolve and combine to impact on the relations between women and men, and in turn shape cultural values, norms and practices, are at the core of this dimension.1
“Gender” refers to the socio-cultural constructions that distinguish and shape the roles, perceptions and status of women and men in a given society. “Gender equality” refers to the existence of equal opportunities and rights between women and men across both private and public spheres, which allow and ensure that they can pursue the life they wish to lead. It is now internationally recognized that gender equality is a critical building block of sustainable development.2
Over the past half century, concerted efforts have been made by governments as well as civil society organizations to identify and implement policies that can create a more even “playing ground” for women and men, taking into consideration sex-specific issues (e.g. reproduction) and addressing key obstacles to the achievement of gender equality. The Convention on the Elimination of Discrimination against Women (CEDAW), the Beijing Platform for Action and other international agreements, and initiatives have established an international consensus and framework for action, resulting in impressive inroads in tackling gender gaps in education performance and salaries, among others.
However, in no country is gender equality the “norm” and there remain significant gaps to tackle. Benchmarking progress on gender equality is typically performed by analysing key output measures, such as the percentage of equal access to and distribution of resources and opportunities. These objective measures provide insights on the degree to which women and men are equally able to enjoy the same fundamental rights and possibilities for personal and professional development and contribute to their country’s development. This empirical snapshot of the status quo of gender equality is important for understanding the relationship between gender equality and development since the equal ability for women and men to participate in social, cultural, political and economic life ensures that public policies as well as cultural values, norms and practices reflect and take into consideration the experiences and interests of both sexes. Policies, actions and practices that take into consideration only half of the population’s interests create imbalances that are detrimental for the sustainable development of a country.3
Cultural attitudes towards, and perceptions of, gender equality have evolved considerably as a result of these targeted interventions and progress made in these output measures. This evolution is critical for the sustainability and sense of community understanding, ownership and support for gender equality: gender equality only becomes a reality if “top-down” measures are fully complimented by “bottom-up” support. In many countries, however, attitudes and perceptions remain negative to gender equality and women’s empowerment, often citing respect for cultural traditions, values and practices as a justification for maintaining the status quo. However, as United Nations Population Fund (UNFPA) argues, “cultural values should harmonize with human rights expectations”, that is, practices or traditions that impeach on the universal rights of individuals should adapt to the norms and frameworks universally set and agreed upon by the international community (e.g. the Universal Declaration of Human Rights, CEDAW, Declaration on the Elimination of Violence, etc).4
In other words, respecting cultural diversity and cultural rights can go hand in hand with gender equality when placed within a human rights framework that favours inclusion and equal access to rights and opportunities. As
1. D. Cliche et al, “Women and cultural policies”, in Intergovernmental Conference on Cultural Policies for Development, Stockholm (UNESCO, 1997).2. “Any serious shift towards sustainable development requires gender equality. Half of humankind’s collective intelligence and capacity is
a resource we must nurture and develop, for the sake of multiple generations to come.” Resilient People, Resilient Planet, the Report on the United Nations’ Secretary-General’s High-Level Panel on Global Sustainability, (2012), p. 14 http://www.un.org/gsp/sites/default/files/attachments/GSP_Report_web_final.pdf
3. “Equality between women and men is a matter of human rights and a condition for social justice and is also a necessary and fundamental prerequisite for equality, development and peace.” Convention for the Elimination of Discrimination against Women, 1979.
4. UNFPA, State of the World’s Population. Reaching Common Ground: Culture, Gender and Human Rights (2008), p. 9.

METHODOLOGY MANUAL • 103
GE
ND
ER
EQ
UA
LIT
Y
interventions targeting violence against women have shown, culture can be a powerful tool to counter negative, misogynist practices through a process of community-based dialogue, consensus and action. Indeed, culture and cultural values and attitudes are not static and have a strong capacity to foster social transformation, which is favourable for both women and men.5 As the Convention for the Protection and Promotion of the Diversity of Cultural Expressions states, culture has important “potential for the enhancement of the status and role of women in society”.
The CDIS and the Millennium Development Goals: This dimension is related to MDG 3 “Promote Gender Equality and Empower Women.”6 Recognized by the international community for its cross-cutting positive impact on development areas, gender equality is also a development goal in its own right, as its prominence in the MDGs highlights.
Objective of the Dimension
The premise that underpins this dimension is that the promotion and valorization of gender equality “is a matter of respecting human dignity, of enjoying the talents available in all strata of a society, and of making use of the full spectrum of views, works and challenges to achieve a truly “cultured” life.”7
This dimension seeks to assess the degree to which gender equality is viewed as important for national development, the respect for human rights (including cultural rights), and building open and inclusive societies. This can be measured by the extent to which women and men enjoy equal opportunities, resources and outcomes in key domains such as political participation, education and labour force participation, and the degree to which individuals’ attitudes are favourable towards gender equality.
Valorization of gender equality through targeted policies, interventions and investments can strongly influence attitudes and perceptions of gender roles and improve the levels of gender equality in practice. It is important to acknowledge the role of cultural attitudes and perceptions on the orientation and design of policies, actions and other measures in favour of gender equality as well as a range of other policy areas. Policies require people however: negative attitudes can hinder or undermine public policies, actions and measures in favour of gender equality since in order to be successful and sustainable such actions need to be endorsed and fully supported by members of the community. In order to provide insights into processes of and criteria for social change, this dimension is thus interested in understanding the correlations or gaps existing at the national level between, on the one hand, the promotion and valorization of gender equality through targeted policies and actions which aim to achieve the equitable performance outcomes of women and men across the four selected domains, and on the other hand, perceptions of gender equality.
II. DEFINITIONS
Gender equality: is defined as “the equal rights, responsibilities and opportunities of women and men and girls and boys”. Equality does not mean that women and men will become the same but that women’s and men’s rights, responsibilities and opportunities will not depend on whether they are born male or female. Gender equality implies that the interests, needs and priorities of both women and men are taken into consideration, recognizing the diversity of different groups of women and men.8
Gender equity: is defined as “fairness of treatment for women and men, according to their respective needs. This may include equal treatment or treatment that is different but which is considered equivalent in terms of rights, benefits, obligations and opportunities. In the development context, a gender equity goal often requires built-in measures to compensate for the historical and social disadvantages of women.”9
5. UNFPA, State of the World’s Population. Reaching Common Ground: Culture, Gender and Human Rights (2008), p. 30 6. For more information: http://www.un.org/millenniumgoals/gender.shtml 7. D. Cliché et al, “Women and cultural policies”, p. 4 8. Office of the Special Advisor on Gender Issues and the Advancement of Women (OSAGI) http://www.un.org/womenwatch/osagi/
conceptsandefinitions.htm 9. International Fund for Agricultural Development (IFAD): http://www.ifad.org/gender/glossary.htm
104 • UNESCO CULTURE FOR DEVELOPMENT INDICATORS
GE
ND
ER
EQ
UA
LIT
Y
Violence against women: “any act of gender-based violence that results in, or is likely to result in, physical, sexual or mental harm or suffering to women, including threats of such acts, coercion or arbitrary deprivation of liberty, whether occurring in public or in private life.“10 The CDIS has selected as ‘proxies’ sexual harassment, domestic violence and rape to reflect levels of violence against women at the national level.
Empowerment: “processes by which women and men take control and ownership of their lives through an expansion of their choices.”11
Note: Standard statistical measures define women and men as those aged 15 and over, and girls and boys as those under the age of 15. If your country uses a different age range, please note it in the CDIS
Dimension Data Table and the Technical Report.
III. CORE INDICATORS
1. GENDER EQUALITY OBJECTIVE OUTPUTS
Introduction
Over the past half century, significant improvements and investments have been made in reducing gaps between women and men, boys and girls across key social domains, such as health and education. These efforts have largely focused on empowering women and girls in recognition of the existing status quo and the positive externalities that result from eliminating sex-based inequalities and discrimination. Gender inequalities and gaps in education, political, economic and social domains negatively affect both individuals and their communities. Indeed, as the UNDP Human Development Report states, gender inequality is a detrimental factor blocking human development; countries with high levels of inequality between women and men are, for example, also characterized by low levels of human development.12 The opposite is also true: greater gender equality correlates positively with higher GNP per capita.13
The four domains covered by this core indicator (political participation, education, labour force participation, and the existence of targeted legislative frameworks in gender equity issues) reflect some of the key areas where reaching gender equality in outcomes and opportunities have had a proven positive impact on a range of development processes and which are critical for the respect of human rights, including cultural rights, and for building open and inclusive societies.14
>> Participation of women in political life, either through voting, taking part in decision-making processes or holding public office, has proven to have significant outcomes on good governance that affect the entire community. For instance, case studies and research indicate that the greater involvement of women in decision-making processes has led to increases in public expenditure on environmental (e.g. clean water) and health (teen health, nutrition) issues, and improved governance.15 International legal instruments or recommendations (e.g. CEDAW, Beijing Platform for Action,16 UN General Assembly resolution (A/66/455)), for this reason, strongly encourage transitional policy measures to encourage greater female participation in political life17.
10. Declaration on the Elimination of Violence Against Women (1993), art. 1. (UN General Assembly resolution A/RES/48/104). 11. “Equal participation of women and men in decision-making processes, with particular emphasis on political participation and leadership”,
Background Paper (UN DESA, 2005), p.6 http://iknowpolitics.org/sites/default/files/women20and20men_decision_making_daw.pdf 12. See http://hdr.undp.org/en/statistics/gii 13. World Economic Forum’s, Global Gender Gap Report 2011, cited in Michelle Bachelet, “Beyond Equal Rights”, Americas Quarterly, July 2012. 14. Other domains, notably health, are also important to consider in an assessment of levels of gender equality in a given society. However, for the
purpose of the CDIS, and on account of limitations of data availability, this dimension has chosen to focus on the four dimensions below.15. World Development Report 2012 (World Bank), pp.68-69 16. “Achieving the goal of equal participation of women and men in decision-making will provide a balance that more accurately reflects the
composition of society and is needed in order to strengthen democracy and promote its proper functioning”. Beijing Platform for Action G.181.17. Advancement of women, Report of the Third Committee (A/66/455, United Nations General Assembly), http://www.un.org/ga/search/view_
doc.asp?symbol=A/66/455&referer=http://www.un.org/News/fr-press/docs//2011/AG11198.doc.htm&Lang=E
METHODOLOGY MANUAL • 105
GE
ND
ER
EQ
UA
LIT
Y
>> Education is a form of empowering individuals with knowledge and skills, which help women and men to make informed choices about their professional and personal lives. Indeed, it is proved that the length of time girls spend in education has a direct impact on their health prospects (e.g. lower incidences of early marriage and maternal mortality) and on the education and health prospects of their children.18 It is also closely interlinked with social and economic empowerment of women and their communities: “Educating girls yields a higher rate of return than any other investment in the developing world.” 19
>> Labour force participation is central to social and economic empowerment of individuals and their communities, providing them with more choices, autonomy and resources to lead the life they choose. Yet, despite the greater participation of women over the last three decades, there remain significant gender gaps. It is estimated that women represent over 40% of the active working population, however, they continue to face glass ceilings in terms of income remuneration and promotion to leadership positions, and are more likely to be over-represented in low-productivity economic sectors and/or the informal economy.20
>> Targeted gender equity legislation and other legal measures on gender-related topics reflects whether the State has recognized that certain inequalities require sex-specific measures to ensure gender equality and the respect of human rights. Such measures are typically classified as “gender equity”. In this case, rape, sexual harassment and domestic violence are, statistically, problems more likely to be faced by women, and which, therefore, requires special legislation (and programmes) to protect their human rights, dignity and physical integrity. Quota systems are also temporary legislative measures intended to even the playing field in the political domain and countering negative stereotypes and other social taboos that restrict women’s ability to fully participate in public political life of their countries. The right to take part in the political life of a country is protected under the Universal Declaration of Human Rights (art. 21) and quota systems and other similar temporary measures for women are recommended in the Convention for the Elimination of All Forms of Discrimination against Women (CEDAW) and the Beijing Platform for Action (G.1. 190).
Performance outcomes of women and men in these four selected domains tend to reflect the level of public commitment to gender equality, with better outcomes (i.e. equality) linked to the development and implementation of targeted actions, including policies, measures and other forms of investments, to reduce gaps and inequalities.
>> Description: Index of the gaps between women and men in political, education and labour domains and in gender-equity legislative frameworks (objective outputs)
Purpose
Building on the premise that gender inequality reduces the potential of human development, this indicator measures the gaps between women and men in respect to their opportunities and rights to take part in the cultural, social, economic and political life of their country. This is a reflection of the levels of public investment and intervention in favour of gender equality as a factor contributing to building open, equitable and inclusive societies.
Data Sources
This composite core indicator is composed of several individual indicators, which cover four domains: political participation, mean years of education, labour force participation, and the existence of gender-equity legislation in the national legislative framework.
Below are the recommended data sources for each domain. The most recent data available for your country should be used for the construction of the CDIS composite indicator.
>> Political participation:
NN “Women in Parliaments Database”, Inter- Parliamentary Union: http://www.ipu.org/wmn-e/classif.htm
18. For this reason, the Millennium Development Goals has included a number of targets that recognizes the link between maternal health, infant mortality and education.
19. Laurence Summers, former Chief Economist of the World Bank in 1992. Cited in http://web.worldbank.org/WBSITE/EXTERNAL/TOPICS/EXTEDUCATION/0,,contentMDK:21054645~menuPK:617572~pagePK:148956~piPK:216618~theSitePK:282386,00.html
20. Egalité des genres et développement, p. 10
106 • UNESCO CULTURE FOR DEVELOPMENT INDICATORS
GE
ND
ER
EQ
UA
LIT
Y
>> Education:
NN Barro and Lee data: http://www.barrolee.com NN National sources, obtainable from the Ministry of Education.NN UNESCO Institute for Statistics (forthcoming)
>> Labour force participation:
NN Statistical Annex 4, ”Gender Inequality Index and related indicators” in the UNDP Human Development Report: http://hdr.undp.org/en/reports
>> Gender-equity legislation:
NN Gender, Institutions, and Development database (GID-DB): http://stats.oecd.org/Index.aspx?datasetcode=GIDDB2012.
Note: This core indicator has adopted the approach of measuring gaps between women and men in each of the four areas studied. This approach highlights differences in levels of performance,
achievement and status between women and men as a reflection of public investment and intervention in favour of gender equality. When collecting data and constructing the indicator in the Data Table, it is therefore important to always note results for both women and men.
Calculation Method
Results for all individual indicators are easily obtainable from the data sources listed above and no calculations will be required. The Data Table will automatically generate the final result for the composite core indicator once all relevant data is inputted into the appropriate cells.
1 . Political participation: using the Inter-Parliamentary Union’s Women in National Parliaments database, note the results for the percentage of women in the lower house of parliament in the relevant cell of the Data Table.
2 . Education: using the recommended data sources provided above, note the results for the mean years of education for women and the total population above 25 years old in the appropriate cells.
If you use the recommended Barro and Lee data source (for the most recent year available), you will obtain data on:
NN the average years of education of women (25 and over), NN the population (female, 25 and over), NN the average years of education of the total population (25 and over), andNN the total population (25 and over).
Please introduce this data in the relevant cells of the Data Table. The data for the education attainment of men (25 and over) will automatically be constructed from the above data in the Data Table, using the following formula:
Edum =
Edum X Pop
t
(Popt X Edu
f )Pop
m
Where: NN Edut is the education attainment of the total population above 25 years (including men and women); NN Popf is the total female population above 25 years; NN Eduf is the education attainment of women above 25 years; NN Popm is the total male population above 25 years; NN Popt is the total population above 25 years; NN Edum is the education attainment of men above 25 years.
METHODOLOGY MANUAL • 107
GE
ND
ER
EQ
UA
LIT
Y
The calculation and normalization of results will be conducted automatically when the data are inputted into the appropriate cells. The range of the final normalized result will be from 0 to 10, with the final result representing the mean years of education, with 10 as the best result and 0 as the lowest result.
Note: If using national data sources to construct this indicator, please follow the instructions provided in the technical note prepared by UNDP.21
21
3 . Labour force participation: Using the most recent version of the UNDP Human Development Report, please introduce the labour force participation rates for females and males in the appropriate cells of the Data Table. This data can be found in the statistical annexes of the Human Development Report.
Note: If using other data sources, please be careful to note the male and female participation rates.
4 . Targeted gender-equity legislation As proxies for measuring the degree to which gender equality is promoted within national legislation, two
key gender issues have been selected: i) the existence of legislation on violence against women, which covers sexual harassment, rape and domestic violence; and ii) the existence of legislation or measures that introduce quota systems for political participation.
a . Violence against women: using the OECD’s Social Institutions and Gender Inequality (SIGI) Index, please note in the appropriate cells of the Data Table the data of the three sub-categories of “Rape”, “Domestic Violence,” and “Sexual Harassment” situated under the category of “Violence against Women (Laws)”.
Note: The OECD’s SIGI indicators measure the existence of women’s legal protection from rape, domestic violence and sexual harassment. The results range from 0 to 1.
NN a result of 0 means that there is specific legislation in place;NN a result of 0.25 means that there is specific legislation in place, but there are widespread reported
problems with implementation; NN a result of 0.5 means that there is general legislation in place, or that specific legislation is inadequate
(e.g. rape laws do not criminalize marital rape); NN a result of 0.75 means that legislation is being planned, drafted or reviewed or existing legislation is
highly inadequate; and NN a result of 1 means that there is no legislation.
In the Data Table, the values of the three indicators will be automatically reversed and normalized in order to facilitate the calculation and interpretation of the final composite CDIS indicator.
b . Quota systems for women: using the OECD’s Social Institutions and Gender Inequality (SIGI) Index, please note in the appropriate cell of the Data Table the data listed in the sub-category “Quotas” situated under the category of “Civil Liberties”. 22
Note: The OECD’s SIGI indicator measures the existence of legal measures to promote women’s political participation. The results range from 0 to 1. Scores are assigned based on the existence of
legal quotas to promote women’s political participation at national and/or sub-national levels. NN a result of 0 means that there are legal quotas to promote women’s political participation at national and
sub-national levels; NN a result of 0.5 means that there are legal quotas to promote women’s political participation at national or
sub-national levels andNN a result of 1 means that there are no legal quotas to promote women’s political participation.
In the Data Table, the result of the indicator will be automatically reversed and normalized in order to facilitate the calculation and interpretation of the final composite CDIS indicator.
21. The following link gives advice on how to construct this indicator based on national data sources: http://hdr.undp.org/en/media/Note_on_updating_MYS.pdf
22. Social Institutions and Gender Index, http://stats.oecd.org/Index.aspx?datasetcode=GIDDB2012
108 • UNESCO CULTURE FOR DEVELOPMENT INDICATORS
GE
ND
ER
EQ
UA
LIT
Y
In the CDIS Data Table, the existence of legislation or other measures enacted by the State with the intention to promote gender equity is valued at 1. The indicators assume that this legislation to protect and promote women’s rights is required to ensure that they can fully enjoy the same rights as men. The value of 0 is given when no legislation or other gender equity measures have been put in place to address the “gap” in the ability for women and men to have their human rights equally respected, protected and promoted.
5 . Once all the relevant data is included in the appropriate cells of the Data Table, a final result for the composite core indicator will be automatically produced by converting the inputted data into an average of the gaps across the four selected domains: political participation, education attainment, labour force participation and targeted gender-equity legislation.
6 . The final score will appear in the “final” cell . Please note that the final score will be rescaled automatically in order to allow for a greater appreciation and comparative analysis of nuances and gaps between results obtained across all countries. Thus, the “raw” score will be redistributed to fit a scale where 0.6 (instead of 0) will be deemed the lowest result possible.
Note: While the result obtained is classified as the “core” result within the CDIS matrix, it is also necessary to explain and analyse the results of each of the four domains covered in order to identify
areas of strength or weakness.
Guidelines for the interpretation of results
NN This is a benchmark indicator. It assesses gaps between women and men in relation to their opportunities and rights to take part in and benefit from the cultural, social, economic and political life of their country. This indicator thus provides a snapshot of the status quo of performance outcomes of women and men across the four selected domains, (i.e. political participation, education, labour force participation, and the adoption and implementation of gender equity legislation), which have been chosen as examples of areas where gender equality is known to strengthen national development processes and ensure the respect of human rights.
NN At the same time, this indicator also allows for an evaluation of the level of public investment and interventions (policies and other measures) in favour of gender equality and the degree to which such actions have resulted in equitable performance outcomes for women and men. The “gap analysis” approach was adopted to illustrate whether 1) there are differences in opportunities and outcomes between women and men to take part in and benefit from the cultural, social, economic and political life; and 2) such gaps reflect areas to improve in public investments and interventions.
NN The headline result for this indicator consists of the average of the gaps between women and men across the four domains. It will range from 0 to 1, where 0 represents “no gender equality” and 1 represents a “high degree of gender equality”. As noted in the introduction, no country enjoys “full gender equality”. Therefore, a result of 1 should be considered a goal against which a country’s progress should be measured. A low result, and particularly a result close to 0, will highlight the existence of large gaps between women and men in relation to their opportunities and rights to take part in the cultural, social, economic and political life and thus insufficient levels of public investment and intervention in favour of gender equality as a vehicle for development. Appropriate and targeted public investments, including the elaboration and implementation of targeted normative frameworks, policies and measures supported by civil society will thus be needed in order to promote gender equality and take advantage of its direct and indirect effects on development.
NN When interpreting and contextualizing the results of the indicator, it is important to consider that there is often a time lag between the enactment of a law or strategy and the manifestation of concrete outputs that can be captured through statistics. Thus, when analysing the results, it is important to take into account any recent significant initiatives undertaken at the national level to address the gaps between women and men in political, education and labour domains as well as to elaborate, adapt or implement gender-equity
METHODOLOGY MANUAL • 109
GE
ND
ER
EQ
UA
LIT
Y
legislation (e.g. development strategies with a strong gender equality focus; introduction of new laws on violence against women; mechanisms to promote women’s labour force participation, investments in the education systems to reduce gender inequalities etc.).
NN In addition to the headline result, that is, the average of gaps between women and men across the four domains, it is also important to take into account and analyse the result for each domain in order to shed light on particular policy needs or strengths.
NN Finally, it is worth comparing the result of this indicator with data obtained from other CDIS dimensions such as Economy, Education or Social Participation, particularly when these results have been disaggregated by sex.
2. PERCEPTION OF GENDER EQUALITY
Introduction
While gender equality is primarily assessed by the levels of equal opportunities, rights and achievements of women and men across key output measures related to areas such as education, health, or labour force participation, such indicators of progress reveal only part of the “bigger picture” of gender relations. Cultural practices, values, attitudes and traditions shape and underlie the nature and quality of gender relations at the individual and community levels and are key determinants of the extent to which women and men are able to choose the lives they wish to lead, and to contribute to and benefit from their country’s cultural, political, economic and social development.
For the most part, culture is often posited as posing limits on gender equality and is used to justify resistance to public strategies and investments on promoting gender equality on the grounds that they conflict with cultural and traditional practices. In this way, culture is used as “an effective tool… to prevent change by justifying the existing order of things”.23 This understanding and use of culture as a justification for maintaining the gender status quo undermines its dynamism and capacity to adapt to the changing contexts and values of societies, and to be an effective force of positive social transformation. Respect for cultural diversity, cultural traditions and cultural rights is perfectly compatible with gender equality since equality signifies that all individuals, both women and men, have equal access and opportunities to take part in and help shape their culture. It serves to enrich and add value to cultural processes of change, giving more choices and voices and ensuring that the interests and creativity of all individuals can be expressed.
In order to ensure that gender equality is valorized and promoted not only through public interventions and investments (policies and other measures) but also by individuals and communities, gender equality needs to be recognized from the “bottom-up” as well as “top-down” as a human right and a motor for development. Indeed, common cultural practices, values and attitudes contribute in a significant manner to shape and determine the content and the direction of public strategies and commitments related to gender equality. Likewise, public strategies and commitments that are gender-sensitive and are designed to target gender equality can also nurture and foster the evolution and recreation of cultural practices, values, attitudes and perceptions related to the role of women and men in a society. Moreover, public actions towards building open and inclusive societies that fully respect the rights of both sexes are strengthened and the results are more sustainable when they’re understood and supported by the individuals and communities to which they are directed. This requires a process of dialogue, consensus and participatory governance to instil ownership and understanding of how gender equality is beneficial for all.
>> Description: Degree of positive assessment of gender equality (subjective output)
23. M. Afkhami, “A vision of gender in culture“, in Culture in Sustainable Development: Investing in Culture and Natural Endowments, eds. Ismail Serageldin and Joan Martin-Brown, (World Bank, 1999), p. 48
110 • UNESCO CULTURE FOR DEVELOPMENT INDICATORS
GE
ND
ER
EQ
UA
LIT
Y
Purpose
This core indicator measures the extent to which gender equality is positively perceived and supported amongst members of a society by focusing on attitudes towards gender equality in selected domains, notably labour force participation, political participation and education. These are domains where cultural practices and values can strongly influence the ability of women and men to enjoy equal opportunities and rights, and to reach equivalent performance outcomes.
This indicator aims to bring a complimentary subjective approach to the focus on objective outputs of the first core indicator of this dimension. It contributes to assess, along with the results of the first indicator, the degree to which there are gaps in the valorization of gender equality between public strategies and commitments and individuals’ perceptions.
Data Sources
NN World Values Survey (WVS): http://www.worldvaluessurvey.orgNN Official National Surveys: These are typically conducted by the national statistical agency or the Ministry of
Women’s Affairs (or its national equivalent)NN Regional Surveys
Calculation Method
The calculation method will differ depending on the data source available.
1 . World Values Survey
For constructing the indicator, please refer to the following questions:
a . (V44) When Jobs are scarce: Men should have more right to a job than womenb . (V61) Men make better political leaders than women doc . (V62) University is more important for a boy than for a girl
Look up results for V44, V61 and V62 using the online data analysis of the World Values Survey.
a . For V 44, there are three possible answers for this question: “Agree”, “Disagree”, and “Neither”.
Note in the relevant cells of the Data Table only the results for “Disagree”, obtainable by clicking on the tab, “Marginals”.
b . For V 61, there are numerous possible answers for this question: 1 Agree strongly; 2 Agree; 3 Disagree; 4 Strongly disagree; -1 Don´t know; -2 No answer; -3 Not applicable; -4 Not asked in survey; -5 Missing- Unknown.
Note in the relevant cells of the Data Table only the results for “Disagree” and “Strongly disagree”, obtainable by clicking on the tab, “Marginals”.
c . For V 62, there are numerous possible answers for this question: 1 Agree strongly; 2 Agree; 3 Disagree; 4 Strongly disagree; -1 Don´t know; -2 No answer; -3 Not applicable; -4 Not asked in survey; -5 Missing- Unknown.
Note in the relevant cells of the Data Table only the results for “Disagree” and “Strongly disagree”, obtainable by clicking on the tab, “Marginals.”
METHODOLOGY MANUAL • 111
GE
ND
ER
EQ
UA
LIT
Y
Note: It is recommended to disaggregate the results for V44, V61 and V62 by two key demographic variables: gender of respondent and age group. To this end, using the online analysis of the World
Values Survey, click on the tab “Cross-tabs” and select as crossing variables, “gender of respondent” and “age.” In the Data Table, input the disaggregated results for V44, V61 and V62 in the designated cells, indicating clearly and separately: the results for males only; and the results for females only.
The average of the three results will automatically be generated in the Data Table. The final score will appear in the “result” cell.
2 . National or regional surveys It is worthwhile to verify whether any national or regional surveys exist that include questions identical to those posed above. The exact phrasing of the question and all the possible responses should be noted in the Technical Report and the Data Table.
If the questions and their possible responses in the national or regional surveys are identical to the World Value Survey, the indicator will be constructed in the same manner as presented above. In the case that the questions and/or the possible responses are not identical to the World Values Survey questions, please consult the following section on alternative indicators.
Note: Whenever possible, all data should be disaggregated by gender and age groups as requested in the Data Table. Additional breakdowns according to variables such as education level, urbanization,
income levels, etc. are also recommended whenever the available data source allows it. For example, WVS proposes: age of the respondent, education level, employment status, gender, marital status, occupation, religious practice and subjective social class (head of household).
Guidelines for the interpretation of results
NN This is a descriptive indicator measuring the extent to which gender equality is positively perceived and supported amongst members of a society. The final score will range from 0% to 100%. 100% is an ideal result indicating that gender equality holds an important position within a society, and is strongly supported by individuals. Such an ideal result should be considered a goal or benchmark against which a country’s progress should be measured.
NN When analysing and contextualising the results, it may be useful to refer to the recommended disaggregation of the final score by gender and age group (as well as by any additional key variables available such as rural/urban or income quintiles groups) as they can furnish interesting insights into how gender equality is perceived across different social and demographic groups and help to pinpoint the factors that either undermine or encourage the valorization of gender equality. Moreover, as the subjective indicators complement the areas covered by the objective indicators of this dimension (labour force participation, political participation and education), it may be interesting to correlate the results obtained for each of these particular areas.
NN By reading the results of this qualitative, subjective indicator along with the results of the first objective indicator of the Gender Dimension, it may be possible to observe the correlations between the valorization of gender equality fostered through public commitment, policies and actions, and individuals’ perceptions on gender equality, which are strongly influenced by cultural practices and values. In other words, the relationship between the objective and the subjective indicators of this dimension can shed some light on:
a . the degree to which public investments and commitments to gender equality have become embedded
into individual perceptions and attitudes and influenced cultural values, perceptions and practices on gender equality, and;
112 • UNESCO CULTURE FOR DEVELOPMENT INDICATORS
GE
ND
ER
EQ
UA
LIT
Y
b . the degree to which cultural values and attitudes influence the orientation and design of such public actions.
NN Such an analysis will provide additional insights on the gaps that remain to be addressed, both from a “top-down” and a “bottom-up” approach, for the full potential of gender equality for development to be realised.
NN For instance, a high result both for the objective and subjective indicators will suggest that national
legislation, programmes and actions as well as perceptions of civil society are in line. In this case, cultural values and attitudes towards gender equality are not only positive, but help to reinforce the sustainability of actions taken to promote gender equality.
NN A low result both for the objective and subjective indicators will suggest that gender equality is not prioritized or invested in as a vehicle for development and that there exists resistance to gender equality, which is engrained and reflected in public policies and actions. It would be recommended in such a case to elaborate policies that target multiple levels in order to actually improve the promotion of gender equality across areas such as labour force and political participation as well as education (and other policy areas), and to encourage awareness amongst the community of the added value of gender equality for sustainable socio-economic development, social justice and human rights, and the achievement of other social externalities.
NN A “mixed” result, when there is a discrepancy between the objective and the subjective indicators may offer different readings and interpretations.
a . High levels of gender equality across the four selected domains (political and labour force participation, education and gender equity in national legislation) but low levels of valorization of gender equality in attitudes points to a gap or discord between forward-looking public actions in advancing gender equality and attitudes and values. Such resistance can undermine the sustainability of these performance outcomes since, as discussed above, policies and other measures that advance gender equality are strengthened, and rely on support from individuals and communities to ensure that the practices and principles of gender equality become successfully embedded into cultural values and attitudes, and recognized as valuable by all members of the community. This indicates a need for greater advocacy efforts targeting attitudes, for example through community discussions where policies for gender equality are explained or the added value of gender equality demonstrated with evidence and collectively debated. Since cultural values and attitudes strongly shape perceptions towards gender equality, it is critical to prove that gender equality can complement and be compatible with cultural values and attitudes, and indeed, an influential factor in the retransmission of cultural values to future generations, for building inclusive and egalitarian societies, and for the respect of human rights. Moreover, it would be interesting to observe changes over time to see to what extent forward-looking policies in favour of gender equality can lead to influence and penetrate cultural values and attitudes, given that these are in constant evolution.
b . Low levels of gender equality across the four selected domains but high levels of valorization of gender equality in attitudes points to an important deficiency in public commitment, policies and measures in responding to and reflecting the values and attitudes of the community. That is, gender equality is valorized by the community but appropriate measures, programmes and investments are not available to support translating them into tangible outcomes for women and men. Such a situation would require a significant revision of existing policies in order to ensure that gender equality and the values of the community are taken into account and reflected in the performance outcome and opportunities of women and men.
Alternative Indicator
If your country is not covered by the WVS and does not have an equivalent national or regional data source available, an alternative data source including relevant questions on gender equality could be considered for the construction of an alternative indicator. Please contact the UNESCO CDIS Team in order to determine if an alternative indicator is possible and to establish the method of calculation.
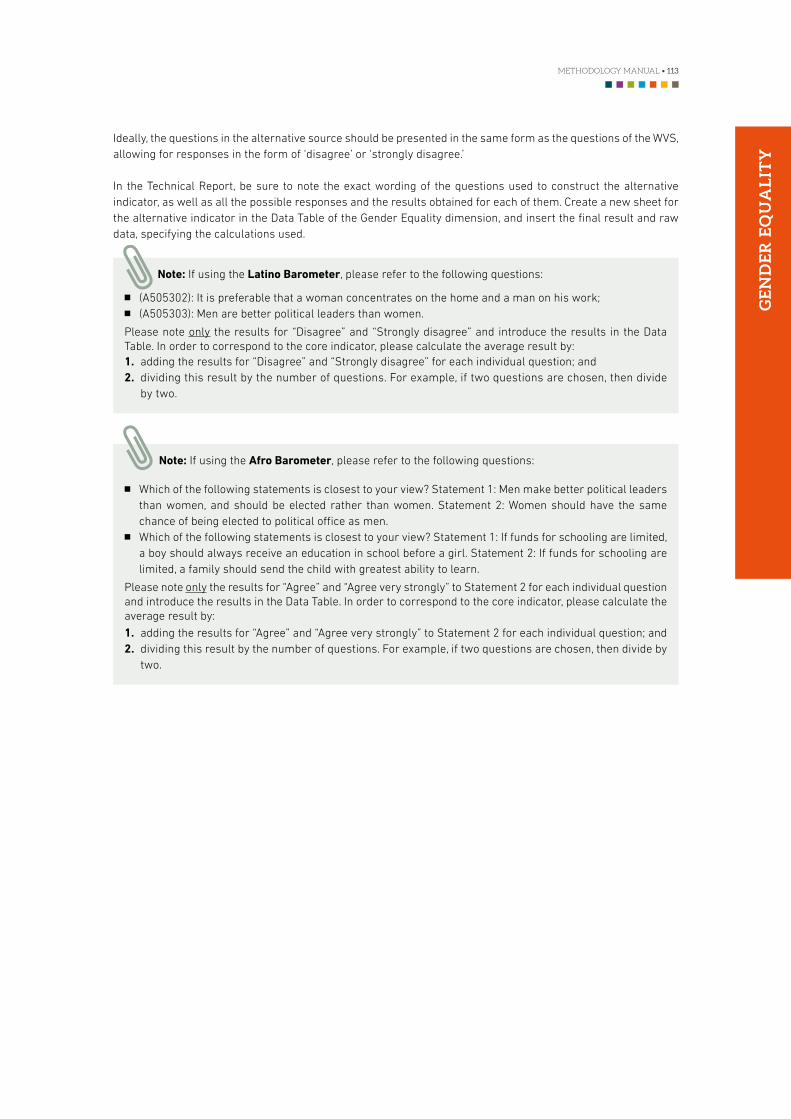
METHODOLOGY MANUAL • 113
GE
ND
ER
EQ
UA
LIT
Y
Ideally, the questions in the alternative source should be presented in the same form as the questions of the WVS, allowing for responses in the form of ‘disagree’ or ‘strongly disagree.’
In the Technical Report, be sure to note the exact wording of the questions used to construct the alternative indicator, as well as all the possible responses and the results obtained for each of them. Create a new sheet for the alternative indicator in the Data Table of the Gender Equality dimension, and insert the final result and raw data, specifying the calculations used.
Note: If using the Latino Barometer, please refer to the following questions:
NN (A505302): It is preferable that a woman concentrates on the home and a man on his work;NN (A505303): Men are better political leaders than women.
Please note only the results for “Disagree” and “Strongly disagree” and introduce the results in the Data Table. In order to correspond to the core indicator, please calculate the average result by: 1 . adding the results for “Disagree” and “Strongly disagree” for each individual question; and 2 . dividing this result by the number of questions. For example, if two questions are chosen, then divide
by two.
Note: If using the Afro Barometer, please refer to the following questions:
NN Which of the following statements is closest to your view? Statement 1: Men make better political leaders than women, and should be elected rather than women. Statement 2: Women should have the same chance of being elected to political office as men.
NN Which of the following statements is closest to your view? Statement 1: If funds for schooling are limited, a boy should always receive an education in school before a girl. Statement 2: If funds for schooling are limited, a family should send the child with greatest ability to learn.
Please note only the results for “Agree” and “Agree very strongly” to Statement 2 for each individual question and introduce the results in the Data Table. In order to correspond to the core indicator, please calculate the average result by:
1 . adding the results for “Agree” and “Agree very strongly” to Statement 2 for each individual question; and 2 . dividing this result by the number of questions. For example, if two questions are chosen, then divide by
two.

Core Indicators Description
FREEDOM OF EXPRESSION Index of print, broadcast, and internet-based media freedom
ACCESS AND INTERNET USE Percentage of individuals using the Internet
DIVERSITY OF FICTIONAL CONTENT ON PUBLIC TELEVISION
Ratio of annual broadcasting time of domestic television fiction programmes out of total annual broadcasting time of television fiction programmes on public free-to-air national TV channels
COMMUNICATION
116 • UNESCO CULTURE FOR DEVELOPMENT INDICATORS
CO
MM
UN
ICA
TIO
N
I. RELEVANCE OF THE DIMENSION FOR CULTURE AND DEVELOPMENT
Communication is the exchange of thoughts, messages, or information. It can take various forms and employs both traditional (e.g. radio or television) and new media, such as the Internet. Communication allows individuals to express their ideas, knowledge and creativity and share with others, whether they are individuals or an audience, local or foreign. Indeed, communication entails participation and dialogue and plays a vital role in ensuring pluralism by allowing a diversity of voices to express themselves and be accessible to others. In this sense, communication contributes to forming both individual and collective identities, by sustaining identity-building among groups and cultures, while at the same time allowing interaction with individuals from other groups and cultures. Communication builds social capital and fosters social inclusion by facilitating understanding between members of a society and also builds bridges between different societies and cultures by fostering intercultural dialogue.
Moreover, “freedom of thought, expression and information, as well as diversity of the media, enable cultural expressions to flourish within societies.“1 Indeed, diverse forms of communication are central in promoting the flow of information, knowledge, ideas, expressions and visions that provide the essential ingredients of creativity from which new forms of expression are generated. They have also a decisive influence in the promotion of cultural freedoms, since they disseminate content and information that can significantly expand individual choices for participation in cultural life. Finally, diverse forms of communication are central in the process of structuring the cultural sector as a sector of organized activity, since in many instances they help to link artists and creators with their audiences.
In short, culture and communication are strongly interlinked and interdependent. Culture requires diverse forms of communication in order to flourish, to create, to be re-created and to be shared. At the same time, culture shapes not only a large part of the content of communication but also the forms and patterns of communication themselves. Together, culture and communication have the potential to produce and disseminate a rich wealth of information, knowledge, ideas and contents contributing to the expansion of individuals’ options in order to choose the life they wish to lead, and thus creating enabling environments for inclusive people-centered development processes.2
Objective of the Dimension
This dimension assesses the extent to which a positive interaction between culture and communication is promoted with a view to:
NN respect and promote the right to freedom of expression, understood as the building block for the development of open and participatory societies as well as a key enabler for creativity and cultural diversity;
NN promote access to digital technologies, in particular the Internet, which is significantly changing the way people communicate as well as the forms of access, creation, production, and dissemination of ideas, information and cultural content;
NN offer a diversity of content in public broadcasting systems, which favours choice-based cultural participation3 as well as access to distributed products from different origins, and in particular local productions and content.
By looking at these aspects of how culture and communication interact, this dimension aims to obtain a greater understanding of the positive outcomes of these relationships and of the extent to which they effectively contribute to the implementation of cultural rights as well as to achieving human-centered, inclusive and sustainable development.
1. Preamble of the Convention on the Protection and Promotion of the Diversity of Cultural Expressions. 2. As stated in Our Creative Diversity (p. 107), “Communication in all its forms […] is a key to people-centered development.” 3. Within the CDIS framework, choice-based cultural participation refers to the possibility individuals have to participate in cultural life in all its
diversity as well as their capacity to choose and modify their own cultural practices and activities (including the choice of not participating). In this sense, choice-based cultural participation encompasses both access to and contribution to cultural life. It also entails the ability to establish diverse and evolving cultural allegiances and identities.
METHODOLOGY MANUAL • 117
CO
MM
UN
ICA
TIO
N
II. CORE INDICATORS
1. FREEDOM OF EXPRESSION
Introduction
The right to freedom of expression is enshrined in the Universal Declaration of Human Rights (article 19), which states that “Everyone has the right to freedom of opinion and expression; this right includes freedom to hold opinions without interference and to seek, receive and impart information and ideas through any media and regardless of frontiers.”4 Moreover, the International Covenant on Civil and Political Rights (article 19) states that “Everyone shall have the right to freedom of expression; this right shall include freedom to seek, receive and impart information and ideas of all kinds, regardless of frontiers, either orally, in writing or in print, in the form of art, or through any other media of his choice.”5
Freedom of expression refers to the ability for all individuals to enjoy the right and opportunity to speak, write, blog, perform, compose, create etc., in an open environment, free from persecution, discrimination and censure. This includes a pluralistic and independent media, which ensures that individuals have access to information that is not subject to bias or censure. In order for freedom of expression to exist in practice, it needs to be enshrined in law, defended by governments and supported by a regulatory system.6
Freedom of expression is critical for “the full development of the person” and “the realisation of the principles of transparency and accountability that are, in turn, essential for the promotion and protection of human rights.”7 It contributes to strengthening social bonds and levels of trust, to fostering an individual and collective sense of social inclusion and group identification, especially of minority groups, and to promoting exchange and dialogue with other groups and cultures. Thus, freedom of expression plays a key role in ensuring that development processes are equitable and take into account the opinions and voices of all members of a community.
Moreover, the justification for freedom of expression as a fundamental human right is closely linked to its role in providing the appropriate conditions for cultures to flourish, promoting equitable access to cultural content and strengthening the capacities of all individuals to participate in cultural life. The possibility to dissent can stimulate the advancement of science, the arts and forms of expression, and is a key element in building knowledge societies. Freedom of expression is also a necessary condition for the free circulation of ideas, knowledge and content and thus for diversity, which are two crucial elements in promoting creativity and the production and circulation of new forms of expression. Indeed, the Convention on the Protection and Promotion of the Diversity of Cultural Expressions states in Article 2.1 that “Cultural diversity can be protected and promoted only if human rights and fundamental freedoms, such as freedom of expression, information and communication, as well as the ability of individuals to choose cultural expressions, are guaranteed.”
>> Description: Index of print, broadcast, and internet-based media freedom
Purpose
This core indicator assesses the existence of an enabling environment at the legal, political and economic levels for free media to operate and thus the degree to which the right to freedom of expression is guaranteed at the national level.
Press and media freedom derives directly from freedom of expression. A free, independent and pluralistic media is essential in any society to ensure freedom of opinion and expression8 and the free flow of ideas, knowledge, information and cultural content.
4. Article 19, Universal Declaration of Human Rights (1948). 5. Article 19, International Covenant on Civil and Political Rights (1966). 6. Cf. http://www.ohchr.org/EN/Issues/FreedomOpinion/Pages/OpinionIndex.aspx 7. General Comment No. 34, Human Rights Committee (July 2011), http://www2.ohchr.org/english/bodies/hrc/docs/GC34.pdf 8. General Comment No. 34, Human Rights Committee (July 2011).
118 • UNESCO CULTURE FOR DEVELOPMENT INDICATORS
CO
MM
UN
ICA
TIO
N
Data Source
NN Freedom House, Freedom of the Press Index (www.freedomhouse.org).
Note: The Freedom of the Press Index evaluates the degree of print, broadcast, and Internet media freedom in 196 countries and territories. The survey comprises 23 methodology questions and 109
indicators, which are divided into legal, political and economic categories.
The Freedom of the Press Index provides numerical rankings and rates each country’s media as “Free,“ “Partly Free,“ or “Not Free.“ Country analytical reports examine in detail the legal environment for the media, political pressures that influence reporting, and economic factors that affect access to information.
Calculation Method
This indicator is built automatically, by inputting the data into the appropriate cells of the Data Table. Data is to be extracted from the Freedom of the Press Index of your country corresponding to the most recent year of reference. Please fill in the relevant Data Table by introducing the following elements:
1 . The overall “Press Freedom score” (a number between 0-100) in the yellow cell;2 . The three scores of your country for the categories of legal,9 political10 and economic environment11 in their
respective white cells.
Results concerning the legal, political and economic environments are automatically normalized so that they can be compared with each other.
In addition, to facilitate the reading of results, a graph is automatically generated at the bottom of the Data Table. It is important to recall that, according to the classification system proposed by Freedom House, the lower the values of the results obtained, the higher the levels of freedom of the press and expression in the country.
Guidelines for interpretation of results
NN This is a benchmark indicator. It provides a snapshot of the status of the print, broadcast, and internet-based media freedom at the national level and thus of the degree to which the right to freedom of expression is guaranteed. It also sets benchmarks or targets for improvement, depending on the country’s results.
NN The final result will range between 0 and 100, 0 being the “ideal” value. According to the Freedom of the Press Index classification system, the degree to which each country permits the free flow of news and information determines the classification of its media as “Free,” “Partly Free,” or “Not Free.” Countries scoring 0 to 30 are regarded as having “Free” media; 31 to 60, “Partly Free” media; and 61 to 100, “Not Free” media. Thus, a result between 0 and 30 is an optimum result and a score of 30 to 0 is the benchmark to achieve.
9. The legal environment category encompasses an examination of both the laws and regulations that could influence media content and the government’s inclination to use these laws and legal institutions to restrict the media’s ability to operate. It assesses the positive impact of legal and constitutional guarantees for freedom of expression; the potentially negative aspects of security legislation, the penal code, and other criminal statutes; penalties for libel and defamation; the existence of and ability to use freedom of information legislation; the independence of the judiciary and of official media regulatory bodies; registration requirements for both media outlets and journalists; and the ability of journalists’ groups to operate freely.
10. Under the political environment category, the degree of political control over the content of news media is evaluated. Issues examined include the editorial independence of both state-owned and privately owned media; access to information and sources; official censorship and self-censorship; the vibrancy of the media and the diversity of news available within each country; the ability of both foreign and local reporters to cover the news freely and without harassment; and the intimidation of journalists by the state or other actors, including arbitrary detention and imprisonment, violent assaults, and other threats.
11. The economic environment for the media includes the structure of media ownership; transparency and concentration of ownership; the costs of establishing media as well as of production and distribution; the selective withholding of advertising or subsidies by the state or other actors; the impact of corruption and bribery on content; and the extent to which the economic situation in a country impacts the development and sustainability of the media.
METHODOLOGY MANUAL • 119
CO
MM
UN
ICA
TIO
N
NN The score obtained reflects the extent to which there exists an enabling environment for free media to operate in which freedom of expression is respected and promoted. Such an enabling environment is a condition for fostering the free flow of ideas, knowledge, information and content, for building knowledge societies and enhancing creativity, innovation and cultural diversity. Finally, as freedom of expression is intrinsically linked to cultural rights and freedoms, the result of this indicator will also offer insight into the extent to which these are enshrined and implemented at the national level.
NN When analyzing the results, particularly if the overall result is greater than 30 or 60, it is recommended to analyse the standardized results on the legal, political and economic environments (listed in the Data Table and the corresponding graph), so as to identify areas that pose greater challenges in promoting press freedom and expression. It is also recommended to consult the full country report elaborated by Freedom House under the Freedom of the Press Index project, which may contain valuable information to put the results into context and make recommendations.
NN Finally, when contextualizing and interpreting results, it is important to consider the interaction with the other two indicators of this dimension but also with other key indicators of the global matrix such as the levels of cultural participation, interpersonal trust, the perception of freedom of self-determination and the degree of promotion of participatory schemes in cultural governance, among others. This indicator would also offer insights into the analysis of transversal themes, such as the implementation of cultural rights.
Note: It may be of interest to develop an additional indicator at the national level on “Perception of freedom of expression,“ if data sources are available. It will thus be possible to compare the results
of the core indicator of media freedom with this additional indicator measuring subjective perception. The indicator on perception of freedom of expression can also be used as an alternative indicator for countries where the Freedom House indicator is not available or cannot be applied. Guidelines to build such an additional indicator are in Annex I to this roadmap.
2. ACCESS AND INTERNET USE
Introduction
Across the world, the Internet is becoming increasingly accessible. Today, there are more than 2 billion Internet users worldwide12 and New Information and Communication Technologies (NICTs), mainly Internet and mobile cellular telephones, are allowing individuals to vote, bank, buy, sell, read the news, create and recreate cultural content and knowledge, exchange ideas, interact through social networking etc. Even if access to the Internet remains lower in developing countries, thanks to the use of mobile broadband among others, the digital divide is decreasing and in the period 2000-2010 developing countries boasted the highest growth rates in the share of Internet users.
The digital revolution has a profound impact on the cultural, social and economic outlook and development of countries, creating unprecedented opportunities for the creation, preservation, dissemination, access to and use of information and knowledge. Across the world, the effect of NICTs is visible in, for example, the increased opportunities for accessing local as well as foreign information and content, enlarging individuals’ possibilities of choice and opening new learning opportunities, as well as in the facility and numerous ways people can connect with each other regardless of distance and borders, and in the emergence of the “global marketplace.” Indeed, NICTs can transform production processes, commerce, government and education, create new forms of economic growth and improve productivity and competitiveness in NICT and non-NICT sectors. Furthermore, greater use of NICTs by larger sections of the population can contribute to the realization of social and development goals through the enhanced availability of information, more equitable access to education and training facilities, and by expanding the scope for citizen participation.
12. See: http://www.itu.int/ITU-D/ict/publications/idi/2011/index.html
120 • UNESCO CULTURE FOR DEVELOPMENT INDICATORS
CO
MM
UN
ICA
TIO
N
Also, new technologies and in particular the Internet are significantly transforming the way people access, create, produce and disseminate cultural content and ideas. The spread and effective use of these technologies has a significant influence on people’s opportunities to access and participate in cultural life, as well as for enabling new forms of creation and participation. This is true particularly for the youth, who should have the opportunities to not only appropriate these new forms and opportunities for participation and creation, but also to actively contribute to their future development. Creators and cultural entrepreneurs are also seizing this opportunity to disseminate and distribute their works, products, services and activities through such technologies. Thus, an environment that promotes access to and use of new technologies, including the Internet, can play a significant role in promoting creativity and diversity, fostering access to new and diverse cultural content and sources of inspiration, as well as developing spaces for collaboration and exchange.
In short, effective use of and equal access to ICTs, and the Internet in particular, offer real potential for human and sustainable development and the building of knowledge-based societies.
The CDIS and the Millennium Development Goals (MDGs): The objectives of this core indicator are closely related to MDG 8 “Develop a Global Partnership for Development”, which targets “mak(ing) available benefits of new technologies, especially ICTs.”
>> Description: Percentage of individuals using the Internet
Purpose
Based on the assumption that a greater use of NICTs, including the Internet, by a larger segment of the population can contribute to the achievement of social, cultural and economic development goals, this indicator uses the percentage of Internet users as a proxy in order to assess the degree of promotion and democratization of the use of digital technologies at the national level, and therefore the capacity of the population to have access to cultural and creative content and develop new forms of creativity and participation.
Indirectly, this indicator intends to reflect the degree of national investments (both public and private) in creating a favourable environment for the development of a knowledge-based society, through the improvement of infrastructure, regulatory frameworks, and policies and measures directed towards ensuring affordable, reliable and free access to ICTs.
Definition
This indicator employs the following working definition:
Internet users out of the total population: The International Telecommunication Union (ITU)13 defines Internet users as those who have accessed the Internet from a computer or any other device, including mobile phones, in the last 12 months.
Data Sources
NN National household surveys on Internet use and access including data on the “Percentage of Individuals using the Internet”
NN The Measuring the Information Society Report and the ICT Data and Statistics of the International Telecommunications Union (ITU) (http://www.itu.int/ITU-D/ict/statistics/)
13. Definitions of World Telecommunication/ICT Indicators, ITU, March 2010; http://www.itu.int/ITU-D/ict/handbook.html
METHODOLOGY MANUAL • 121
CO
MM
UN
ICA
TIO
NNote: A growing number of countries are measuring Internet use through household surveys. In countries where household surveys are available, this estimate should correspond to the estimated
number derived from the percentage of Internet users collected. If the survey covers percentage of the population for a certain age group (e.g., 15-74 years old), the estimated number of Internet users should be derived using this percentage, and the scope and coverage of the survey should be provided. In situations where surveys are not available, an estimate can be derived based on the number of Internet subscriptions.
Calculation Method
Using the most recent year of the recommended data sources, input the number of Internet users out of the total population for your country in the relevant Data Table.
When possible, the percentage of Internet users should be calculated against the total population. Thus, whenever relevant, please indicate the age group considered according to the data source available.
Guidelines for interpretation of results
NN This is a benchmark indicator constructed to evaluate existing opportunities for access to NICTs at the national level and thus to the cultural content, ideas, knowledge and expressions as well as to the forms of creation, production and diffusion of the contents that they convey. The final score range from 0% to 100%. A high result is considered a good result; the higher the score, the better the result.
NN When contextualizing and interpreting the results, it is recommended to compare national results with regional and global averages as well as to analyse earlier national-level time series in order to evaluate the level and patterns of increase in the numbers of Internet users. In addition, whenever possible, it is important to consider disaggregation by key variables: (sex, education, income, age, rural/urban). Indeed, such disaggregation may highlight whether, for example, there are certain segments of the population who have a marginalized position and/or troubles accessing the Internet thus helping to assess divides in Internet use. Similarly, it can be interesting to analyse opportunities for youth access, since generally members of this group are promoters and drivers of Internet usage. ITU’s Measuring the Information Society report (see above, data sources) may provide valuable information for completing the analysis and the contextualisation of results on the basis of the guidelines and orientations proposed.
NN Low results are also significant and require special attention. They may reflect the need to increase investments in the development of infrastructures, policies and measures, which facilitate and encourage access to and use of new technologies. This can be achieved by addressing issues such as pricing, bandwidth, speed, quality of services, skills, public facilities, content and applications targeting low-end users in order to bring more people online (countering the marginalization of particular groups) and to create an enabling environment for the sector to grow. For these reasons, when interpreting the results of this indicator, please take into account that individuals and groups who do not have access to the Internet, and thus to new communication technologies may be as much if not more significant than those who do enjoy this access.
NN Finally, in order to evaluate the levels of promotion of an inclusive knowledge and information society, results from this indicator should be cross-analysed with other indicators of the CDIS matrix, such as those of the Governance, Education and Social Participation dimensions.

122 • UNESCO CULTURE FOR DEVELOPMENT INDICATORS
CO
MM
UN
ICA
TIO
N
3. DIVERSITY OF FICTIONAL CONTENT ON PUBLIC TELEVISION
Introduction
Culturally diverse films, music, or television programmes bring numerous advantages: they help ensure rich cultural content and diversity of expressions, and thereby to facilitate dialogue, widen access to information and knowledge, pluralism and creativity.
Today, broadcasting, and in particular public service broadcasting, is a pillar for information and cultural exchange. The supply of foreign content opens new opportunities for accessing different views, ideas and realities, thus fostering the availability of different choices and facilitating a better understanding of the values and ways of life of other groups and cultures around the world. However, a large presence of foreign content can present challenges, not only because audiences mainly watch contents produced elsewhere but also because it can jeopardize the development of domestic contents and media, which may struggle to compete for audience share, to attract investors and/or to develop and programme domestic contents on account of higher production costs.
Indeed, public broadcasting has major implications for the development of the domestic audio-visual industry as well as for the flourishing of local cultural expressions and creative products. As they largely determine demand, they play a key role in promoting the supply of the local market with audiovisual products rooted in local cultures, values and common perceptions. Programming domestic production, and particularly TV fictions with a high share of cultural content, may increase the population’s level of information on national events and issues while also promoting a greater use of local languages, favouring processes of identity-building with other members of the community, helping to build or strengthen identities and promoting cultural diversity.14 Furthermore, diversity of choice on the supply side enables individuals to make choices on the kind of content they want to watch and enjoy. Finally, as capital requirements are smaller for television production and programming than for film, the diffusion of domestic TV programmes may contribute to fostering the development and consolidation of local cultural and audiovisual industries and the ability of local talents to express themselves. Promoting the production and diffusion of domestic TV content, and particularly fiction programmes, may thus generate positive social and economic externalities.
A policy challenge is, therefore, maintaining a balance in the supply of domestic and foreign content of public broadcasting, which simultaneously promotes the development of local cultural expressions and enterprises while encouraging a culturally rich and pluralistic media.
>> Description: Ratio of annual broadcasting time of domestic television fiction programmes out of total annual broadcasting time of television fiction programmes on public free-to-air national television channels
Note: If your national data sources do not allow for calculations based on an annual ratio as recommended in the methodology, it is recommended to use monthly or weekly ratios as the
calculation method. This can be done by selecting a month or a week which is “as normal as possible”: that is, choosing a month or week that is as widely representative as possible in order to come closest to illustrating the distribution of domestic and foreign fiction during a normal week. This will give a generally representative picture of the programming policies when the television season is going “full blast.”
Purpose
To provide insights on the level of promotion of supplying domestic fiction productions (including co-productions) within the framework of national public broadcasting television services. These will reflect the public support offered for the development of the domestic audio-visual industries, local content and expressions, as well as the diversity of choice available to audiences at the national level.
14. Pierre Sauvé, “Introduction”, Trends in Audiovisual Markets, Regional Perspectives from the South, UNESCO (2006).
METHODOLOGY MANUAL • 123
CO
MM
UN
ICA
TIO
N
Definitions
The indicator should be constructed according to the following working definitions:
Free broadcast: Refers to television channels and services accessed by the viewers for free, i.e. without paying any subscription fee15.
Public television channel: A public television channel is owned by a public organization which refers to a broadcasting entity operated by a State authority -(e.g. central or federal, provincial, local government etc.) or through a separate institution created or licensed by a legislative act or regulation as an autonomous body (e.g. public service broadcasting entity).16
For the purpose of the construction of the present indicator, only national public television channels should be considered, thus excluding regional or local public television channels.
Annual broadcasting time of fiction programmes: refers to fiction programmes (reported by number of hours) broadcasted on public free-to-air TV channels during a year-long period.
Domestic production: refers to programmes that are produced by companies (broadcasters or commissioned producers) located in the country and specifically targeted to the domestic population.17
For the purpose of the construction of the present indicator, co-productions, understood as audiovisual works jointly invested in and produced by one or more domestic co-producers and one or more foreign co-producers, are considered as domestic productions.
Foreign production: refers to programmes that are produced and funded outside of the respondent country and that are not specifically edited (i.e. dubbed or subtitled) for the domestic population of the respondent country.18
Note: There is no fixed definition of domestic and foreign production and definitions vary from one country to another. Typically, domestic production requires a certain percentage of the creative design
and production to be carried out in the country by nationals. This percentage differs from country to country, so national regulations and guidelines should be considered in line with the proposed working definitions in order to identify the ratio of annual broadcasting.
Fiction feature: refers to a fiction film that uses a narrative construction that is based in part or entirely on events that are not necessarily real.19 For the purpose of the construction of the present indicator, fiction features include different formats such as TV movies (one-off), miniseries (up to six episodes, narrative closure), series (anthology plot, almost self-sufficient episodes), open serial (e.g. soap operas) and closed serial (e.g. telenovela, in any case running plot over more than six episodes, narrative closure).20
Data Sources
NN Ministry of Communications or Telecommunications;NN National Statistical Organization;NN Public broadcasting services;NN Audiovisual Regulatory Authority or Press Council.
15. UIS, Instruction Manual for Completing the Questionnaires on Media Statistics (2012). 16. UIS, Questionnaire on Broadcasting Statistics (2011). 17. UIS, Instruction Manual for Completing the Questionnaires on Media Statistics (2012). 18. UIS, Instruction Manual for Completing the Questionnaires on Media Statistics (2012). 19. UIS, Questionnaire on Feature Films Statistics (2010). 20. See Milly Buonanno, ed., Television Fiction in Europe, Sixth edition (2002).
124 • UNESCO CULTURE FOR DEVELOPMENT INDICATORS
CO
MM
UN
ICA
TIO
N
Calculation Method
This indicator calculates the percentage of domestic and co-produced fiction programmes broadcasted out of total annual broadcasting time of television fiction programmes within a 12 month period on public free-to-air TVs channels available at the national level.
Using the relevant national data sources for the most recent year available, please fill in the relevant Data Table by introducing the following elements:
1 . Reference time period considered: year/month/week;2 . Total number of broadcasting hours dedicated to domestic fiction programmes on national public TV
channels (TDF);3 . Total number of broadcasting hours dedicated to co-produced fiction programmes on national public TV
channels (TCF);4 . Total number of broadcasting hours dedicated to foreign fiction programmes on national public TV channels (TFF).
The indicator is automatically constructed in the Data Table. The final result will be the percentage of annual broadcasting time of domestic and co-produced television fiction programmes on public national television channels out of total annual broadcasting time of television fiction programmes.
Formula:(TDF +TCF) / (TDF+TCF+TFF) x 100
Guidelines for interpretation of results
NN This is a descriptive indicator. It provides insights on the level of promotion, within the framework of public broadcasting television services, of the supply of domestic fiction production (including co-productions). This serves to indirectly reflect the public support offered to the development of domestic content as well as to local creators and cultural industries, which provide social and economic benefits for the development of a given country.
NN This indicator offers a general picture of the position of domestic fictions in relation to imported or foreign fictions within national public broadcasting. There is not a one-size-fits-all, ideal share of domestic versus foreign content that guarantees cultural diversity, pluralism and an optimum range of choices for audiences. However, a low proportion of domestic fiction content may reflect the extent to which local producers are struggling to get public exposure, financial and political support, and/or low levels of vitality of the sector. In such cases, it would be interesting to conduct a further analysis in order to guide the design of fiscally sustainable and efficient domestic regulatory frameworks and support measures as well as education and training programmes for the audio-visual sector. On the contrary, an important ratio of domestic fictions will show that the productive capacities of the domestic television industry, of which fiction generally represents the most important output, are strong and have enabled public television channels to fill large time slots with domestic programmes suggesting that there is an accompanying level of public support in terms of regulatory policies, financial schemes and other incentives for the local television industry. However, if results show a marked dominance of domestic fiction with little or no presence of foreign fiction, this may indicate limited levels of openness to other cultural contents and forms of expression.
NN When interpreting and contextualizing the results, it may also be useful to consider in particular the share of co-produced fictions in relation to domestic and foreign fictions as a first step in analyzing if favourable conditions are in place (or are beginning to emerge) for intensifying the creative and productive cooperation with other countries. Going a step further whenever available data sources allow, it is also recommended to analyse the distribution of domestic and foreign fiction programmes in prime-time schedules thus offering insights into the level of priority accorded to each type of fiction programming and their success in attracting the public.
NN Finally, it is important to cross analyse the results from this indicator with the results from the other indicators of the Communication dimension as well as with other key indicators from the CDIS matrix, such as those from the Economy, Governance and Education dimensions.
METHODOLOGY MANUAL • 125
CO
MM
UN
ICA
TIO
N
APPENDIX I
Constructing an additional indicator on the perception of freedom of expression
For countries with the relevant available national data sources, an additional indicator on the perception of freedom of expression is proposed in this Annex. Such an indicator offers an interesting cross-analysis with the core output indicator on print, broadcast and internet-based media freedom, as well as with other relevant indicators from the CDIS matrix, such as the perception of freedom of self-determination. This indicator can also be used as an alternative indicator for countries where the core output indicator cannot be applied.
In all cases, this indicator should be presented in an additional tab in the Data Table of the Communication dimension as it does not replace the core indicator on the freedom of the media.
>> Description: Percentage of the population who perceive that freedom of expression is fully guaranteed in their country
Purpose
To provide additional and complementary information to the assessment of the print, broadcast, and internet-based media freedom by including a subjective dimension focusing on perceived freedom of expression. Such an indicator aims, therefore, to measure to what degree individuals feel that they have the right to exercise their right to freedom of expression.
Data Sources
NN Latino barometer; http://www.latinobarometro.org;NN Afro barometer; http://www.afrobarometer.org;NN Asia barometer; http://www.asianbarometer.org;NN Arab barometer; http://www.arabbarometer.org; NN National sources that include a question on the freedom of the press.
The wording of the question and the items vary according to the source. Below is a selection of recommended questions that should be used. National sources are preferred when they implement comparable questions with similar wording.
Latino barometer asks: “To what extent do the following freedoms, rights, life-chances and guarantees apply in (country)? – Freedom of speech always and everywhere” with the following scale: Fully, Fairly generally, Not generally, Not at all.
Afro barometer asks: “In this country, how free are you to say what you think” with the following scale: Not at all free, Not very free, Somewhat free, Completely free.
Asia barometer: “People are free to speak what they think without fear?” with the following scale: Strongly agree, Somewhat agree, Somewhat disagree, Strongly disagree.
Arab barometer: The Arab barometer has a full set of items on the subject of freedom of speech. The most useful is “To what extent do you think that freedom of the press is guaranteed in the country?” with the following scale: Guaranteed to a large degree, Guaranteed to an average degree, Guaranteed to a small degree, Not guaranteed.
Calculation Method
Using one of the above data sources, please note the percentage of people who agree that freedom of expression is fully guaranteed within their country in a new sheet added to the Data Table of the CDIS Communication Dimension.
126 • UNESCO CULTURE FOR DEVELOPMENT INDICATORS
CO
MM
UN
ICA
TIO
N
Guidelines for interpretation of results
NN This is a benchmark indicator that provides an assessment of the degree to which individuals feel that the freedom of expression and indirectly cultural freedoms are guaranteed and can be exercised by them. This indicator offers a subjective assessment and gives insights on the attitudes of individuals towards the freedoms, opportunities and spaces for expression allocated to them. The higher the percentage, the higher are the levels of perceived freedom of expression in the country. Thus a result closer to 100% is the ideal.
NN However, it should be highlighted that low levels of perception of freedom of expression are also significant for the analysis of results, particularly when correlated with other indicators of the CDIS, and should be taken into account. For example, when positive results are obtained for the core output indicator on the degree of media freedom but low results are obtained for the subjective indicator on perception of freedom of expression, an additional analysis should be undertaken to explain and better understand this apparent contradiction.
NN Moreover, perceived restricted freedom of expression can have a direct influence on the ability of the cultural sector to flourish since freedom of expression is an enabler for exchanging and diffusing cultural expressions and activities as well as for fostering creativity. It can also be of detriment to the transmission and renewal of certain cultural values, aptitudes and practices, especially for minority groups, thus threatening cultural diversity. Finally, low levels of perceived freedom of expression may also reflect low levels of social trust.

METHODOLOGY MANUAL • 127
CO
MM
UN
ICA
TIO
N

Core Indicators Description
HERITAGE SUSTAINABILITY Index of development of a multidimensional framework for heritage sustainability
HERITAGE
130 • UNESCO CULTURE FOR DEVELOPMENT INDICATORS
HE
RIT
AG
E
I. RELEVANCE OF THIS DIMENSION FOR CULTURE AND DEVELOPMENT
Cultural heritage is, in its broadest sense, both a product and a process, which provides societies with a wealth of resources that are inherited from the past, created in the present and bestowed for the benefit of future generations. Most importantly, it includes not only tangible, but also natural and intangible heritage. As Our Creative Diversity notes, however, these resources are a “fragile wealth”, and as such they require policies and development models that preserve and respect its diversity and uniqueness since, once lost, they are non-renewable.
Today, cultural heritage is inherently linked to the most pressing challenges that humanity faces as a whole; these range from climate change and natural disasters (such as loss of biodiversity or access to safe water and food), to conflicts between communities, education, health, migration, urbanization, marginalization or economic inequalities. For this reason, cultural heritage is considered “essential for promoting peace and sustainable societal, environmental and economic development”.
The notion of heritage is important for culture and development insofar as it constitutes the ‘cultural capital’ of contemporary societies. It contributes to the continual revalorization of cultures and identities and it is an important vehicle for the transmission of expertise, skills and knowledge between generations. It also provides inspiration for creativity and innovation, which result in contemporary and future cultural products. Cultural heritage holds the potential of promoting access to and enjoyment of cultural diversity. It can also enrich social capital by shaping an individual and collective sense of belonging, which helps supporting social and territorial cohesion. Moreover, cultural heritage has acquired great economic significance for the tourism sector in many countries, while at the same time engendering new challenges for its conservation.
Proper management of cultural heritage’s development potential requires an approach that focuses on sustainability. In this regard, sustainability requires finding the right balance between benefiting from cultural heritage today and preserving its ‘fragile wealth’ for future generations.
The ‘right mix’ between cultural heritage and sustainable development requires not only protection from adverse environmental conditions and criminal damage, but also continued nurturing and renewed re-stocking. Any approaches that only look at the past will incur the risk of turning heritage into a fixed and frozen entity loosing relevance both for the present and for the future. Indeed, the understanding of heritage must be such that the collective memories of the past, and the traditional practices with their social and cultural functions, are constantly revised and updated in the present, thus allowing each society to relate to current issues and to maintain their sense, meaning and functioning in the future.
When looking at the importance of heritage for culture and development, the CDIS focuses on sustainability. It takes the view that heritage sustainability largely depends on policies and actions that ensure the protection of cultural heritage´s ´fragile wealth´ by addressing today’s challenges and impacts brought by globalization, neglect and over-exploitation, and by investing in processes of valorization and revitalization that create the conditions for cultural heritage to prosper and bear new fruits in the future. These pillars of public action provide the basis for the sustainability of today´s heritage as well as its capacity to contribute to more sustainable forms of human development in the future.
Objective of the Dimension
This dimension addresses the degree of commitment and action of public authorities in formulating and implementing a multidimensional framework for the protection, safeguarding and promotion of heritage sustainability.
The aim is to evaluate the efforts undertaken by public authorities and their outcomes, in relation to the establishment and implementation of standards, policies, concrete mechanisms and measures for the conservation, safeguarding, management, transmission and valorization of heritage in a given country. A better understanding of the challenges, potentials and shortcomings of these efforts is thereby gained.
METHODOLOGY MANUAL • 131
HE
RIT
AG
E
II. CORE INDICATOR
1. HERITAGE SUSTAINABILITY
Introduction
There are many factors that come into play in fostering heritage sustainability. This core indicator focuses on some of these factors related to public action. It proposes a multidimensional framework that analyses different types of public commitments, efforts and results directed towards heritage protection, safeguarding and valorization. The framework is synthesized in a composite indicator that provides a first approximation of the sustainable management and use of heritage at the national level, and the extent to which an adequate balance is found between benefiting from the legacy of the past today and preserving and enhancing this ‘fragile wealth’ for future generations.
Three interrelated components are explored:
First, the component of ‘Registrations and Inscriptions’ approximates the extent to which a country’s heritage resources are recognized as valuable and deserving official protection for their safeguarding. Based on the premise that lists and inventories of cultural heritage are established ‘with a view to conserving and safeguarding,’ registering and inventorying are not abstract exercises but instrumental ones that offer a strong indication of the level of political will. Thus, the level of commitment to registrations and inscriptions, including regular updating, provides a good structural indication of the degree of priority given to heritage.
Second, the component of ‘Protection, Safeguarding and Management’ highlights the extent to which public authorities ensure heritage’s conservation, valorization and sustainable management; the necessary training and capacity-building of key stakeholders; and the active involvement of the communities concerned. Indeed, for public will and intention to take care of heritage - reflected through registrations and inscriptions- to be translated into genuine protection, safeguarding and valorization; concrete policies and measures must be adopted and implemented.
Third, the component of ‘Transmission and Mobilization of Support’ looks at the efforts deployed to raise awareness and understanding among communities and citizens of the value and sense of heritage. It also looks at the continual investments to promote heritage by involving the private sector and civil society, in order for the message of its value and significance to be passed on to future generations.
>> Description: Index of development of a multidimensional framework for heritage sustainability
Purpose
This indicator offers a global picture of the strengths and shortcomings of public efforts deployed for the protection and promotion of heritage sustainability intended to ensure and foster its potential contribution for development.
It also offers insights into the following areas:
NN the extent to which a country catalogues their heritage in national and international registers and lists of inscriptions, and the range of heritage covered by these lists;
NN the extent to which public authorities adopt and implement key policies and measures to: protect and safeguard heritage from damage (e.g. natural disasters) or illegal activity (e.g. theft of cultural objects), promote the active conservation of heritage elements, provide the necessary financial resources for heritage activities, conduct capacity-building and training programmes to increase expertise, and involve the local community as custodians of the heritage elements concerned;
132 • UNESCO CULTURE FOR DEVELOPMENT INDICATORS
HE
RIT
AG
E
NN the extent to which transmission, interpretation, communication and awareness-raising strategies are established to mobilize understanding, valuation and support of the general public, the private sector and the civil society in favor of safe-guarding and revitalization of heritage.
Definitions
The CDIS follows the broad approach to heritage agreed upon by the international community, which encompasses historical and cultural sites, natural sites and landscapes, cultural property, as well as intangible heritage. The adapted working definitions proposed are drawn from the following legal instruments: the Convention Concerning the Protection of World Cultural and Natural Heritage (1972); the Convention for the Safeguarding of Intangible Cultural Heritage (2003); the Convention on the Protection of the Underwater Cultural Heritage (2000); and the Convention on the Means of Prohibiting and Preventing the Illicit Import, Export and Transfer of Ownership of Cultural Property (1970).
Heritage terminology has not been streamlined or standardised at the country level. For this reason, the working definitions below should be taken as a guide to identify cultural heritage and mechanisms to promote its sustainability. Ultimately, it remains the prerogative of each country to formulate its own terminology and interpretation of heritage.
Cultural Heritage: Refers to: a) monuments: architectural works, works of monumental sculpture and painting, elements or structures of an archaeological nature, inscriptions, cave dwellings and combinations of features which are of outstanding value from the point of view of history, art or science; b) groups of buildings: groups of separate or connected buildings, which because of their architecture, their homogeneity or their place in the landscape, are of outstanding value from the point of view of history, art or science; c) sites: works of man or the combined works of nature and man, and areas including archaeological sites, which are of outstanding value from the historical, aesthetic, ethnological or anthropological point of view.
For the purpose of constructing the CDIS indicator, cultural heritage items considered should have been recognised as having outstanding universal and/or national value and be registered in international and/or national cultural heritage lists or registers.
Natural Heritage:1 Refers to: a) natural features consisting of physical and biological formations or groups of such formations, which are of outstanding value from the aesthetic or scientific point of view; b) geological and physiographical formations and precisely delineated areas, which constitute the habitat of threatened species of animals and plants of outstanding value from the point of view of science or conservation; c) natural sites or precisely delineated natural areas of outstanding value from the point of view of science, conservation or natural beauty.
For the purpose of constructing the CDIS indicator, natural heritage items considered should have been recognised as having an outstanding universal and/or national value and be registered in international and/or national cultural or natural heritage lists or registers.
Underwater cultural and natural heritage: Refers to “all traces of human existence having a cultural, historical or archaeological character which have been partially or totally under water, periodically or continuously, for at least 100 years such as: a) sites, structures, buildings, artefacts and human remains, together with their archaeological and natural context; b) vessels, aircraft, other vehicles or any part thereof, their cargo or other contents, together with their archaeological and natural context; and c) objects of prehistoric character.”
For the purpose of constructing the CDIS indicator, underwater cultural items considered should have been registered in national and/or international underwater cultural and natural heritage lists and/or maritime registers of shipwrecks and natural features. Underwater heritage is generally assumed to be included with similar land-based sites.
Intangible cultural heritage: Refers to those practices, representations, expressions, knowledge, skills – as well
1. Natural sites may belong to cultural heritage as cultural identity is strongly related to the natural environment in which it develops. Natural environments bear the imprint of thousands of years of human activity and their appreciation is primarily a cultural construct.
METHODOLOGY MANUAL • 133
HE
RIT
AG
E
as the instruments, objects, artefacts and cultural spaces associated therewith – that communities, groups and, in some cases, individuals recognize as part of their cultural heritage. These are manifested in the following domains:
a . oral traditions and expressions, including language as a vehicle of the intangible cultural heritage;b . performing arts;c . social practices, rituals and festive events;d . knowledge and practices concerning nature and the universe;e . traditional craftsmanship2.
For the purpose of constructing the CDIS indicator, intangible cultural heritage items considered should have been inscribed on intangible heritage inventories held at the local, national or international levels.
Cultural property: Refers to property, irrespective of its origin or ownership, which, on religious or secular grounds, is specifically designated by national authorities as being of importance for archaeology, prehistory, history, literature, art or science, and belongs to the following categories:
a . rare collections and specimens of fauna, flora, minerals and anatomy, and objects of paleontological interest;
b . property relating to history (including the history of science and technology and military and social history), to the life of national leaders, thinkers, scientists and artists, and to events of national importance;
c . products of archaeological excavations (including regular and clandestine) or of archaeological discoveries ; d . elements of artistic or historical monuments or archaeological sites, which have been dismembered; e . antiquities more than one hundred years old, such as inscriptions, coins and engraved seals; f . objects of ethnological interest; g . property of artistic interest, such as: (i) pictures, paintings and drawings produced entirely by hand on
any support and in any material (excluding industrial designs and manufactured articles decorated by hand); (ii) original works of statuary art and sculpture in any material; (iii) original engravings, prints and lithographs ; (iv) original artistic assemblages and montages in any material;
h . rare manuscripts and incunabula, old books, documents and publications of special interest (historical, artistic, scientific, literary, etc.) singly or in collections ;
i . postage, revenue and similar stamps, singularly or in collections; j . archives, including sound, photographic and cinematographic archives; k . articles of furniture more than one hundred years old and old musical instruments.
For the purpose of constructing the CDIS indicator, cultural property items considered should be the subject of State measures to protect them against illicit import, export and transfer of owner-ship in line with the definition contained the 1970 Convention on the Means of Prohibiting and Preventing the Illicit Import, Export and Transfer of Ownership of Cultural Property.
National cultural heritage registry, list or inventory: Refers to official data banks or lists of historically or culturally significant man-made immovable properties, landmark buildings, industrial facilities, memorial homes of notable people of the past, monuments, cemeteries and tombs, archaeological sites and cultural landscapes – man-made environments and natural habitats significantly altered by humans - present in the national territory, which have been recognised as having heritage value through an official selection process and separately identified and recorded.
National or local intangible cultural heritage inventories: Refers to inventories that are the result of a process of identification and definition of elements of intangible cultural heritage present in a given territory involving communities, groups and relevant NGOs, and are acknowledged as necessary measures to ensure the safeguarding of the intangible cultural heritage. Such inventories describe one or more specific elements of intangible cultural heritage in their own context and distinguish them from others. States may take different approaches to inventorying the intangible heritage present in their territory: they may create a single, over-arching inventory or a set of smaller, more restricted ones.
2. Article 2.2 Convention for the Safeguarding of Intangible Cultural Heritage (2003).
134 • UNESCO CULTURE FOR DEVELOPMENT INDICATORS
HE
RIT
AG
E Note: Inventories are integral to the safeguarding of intangible cultural heritage because they can raise awareness about intangible cultural heritage and its importance for individual and collective
identities. The process of inventorying intangible cultural heritage and making those inventories accessible to the public can also encourage creativity and self-respect amongst individuals and communities where expressions and practices of intangible cultural heritage originate. Inventories can also provide a basis for formulating concrete plans to safeguard the intangible cultural heritage concerned.
Heritage management plan: Refers to a document that sets out the significant heritage aspects of a place or site, and details the appropriate policies to manage it, so that its values are retained for future use and appreciation. While management arrangements should be tailored to the place, generally, a management plan will: a) identify the property’s heritage values; b) identify the constraints and opportunities that its heritage values place on future use; c) identify what the owner is required or wishes to do regarding its use; and d) balance this information and make policies and strategies to achieve compatible outcomes. Ideally, all listed heritage listed places must have a management plan that details how the heritage values of the place will be conserved. In some cases, there may have to be more than one plan to address a place’s full range of values.
Heritage documentation center: Refers to those public or private institutions that collect, process, code, store and disseminate recorded knowledge, information and findings related to heritage, utilizing various techniques for giving documentary information maximum accessibility and usability. Such centers could cover all forms of heritage or be specialized in particular types of heritage: natural, cultural, tangible, intangible, or movable heritage.
Data Sources
The indicator proposed requires data on the protection and promotion of cultural heritage at the national and international levels. Consequently, national level data is mainly available from national legislative sources, national culture and heritage authorities, and national and sub-national registers and inventories of cultural and natural heritage.
For data on the protection and promotion of heritage at the international level, below is a list of useful sources:
NN UNESCO World Heritage List: http://whc.unesco.org/en/listNN UNESCO World Heritage Tentative Lists: http://whc.unesco.org/en/tentativelists/NN UNESCO’s Representative List of the Intangible Cultural Heritage of Humanity:
www.unesco.org/culture/ich/index.php?lg=en&pg=00173NN UNESCO’s List World Heritage in Danger: http://whc.unesco.org/en/dangerNN UNESCO’s List of Intangible Heritage in Need of Urgent Safeguarding:
www.unesco.org/culture/ich/index.php?lg=en&pg=00174NN List of national and international registers of underwater heritage:
www.unesco.org/new/en/culture/themes/underwater-cultural-heritage/the-underwater-heritage/databases/
Calculation Method
This is a qualitative indicator presented as a checklist. To assess the degree of development of a multidimensional public framework for heritage sustainability, a number of elements have been selected and organized into three major components.
1 . “Registrations and inscriptions”, which encompass registers and inventories of national and international status covering tangible, intangible, and movable heritage. Special attention is paid to the regular updating of such registers and inventories in order to monitor the continuity of the public commitment regarding heritage’s protection. The national level is given twice the weighting of the international in recognition of the primacy of national policy and interests. The weighting of this component in the final indicator is 30% of the total value and comprises two sub-components:

METHODOLOGY MANUAL • 135
HE
RIT
AG
E
a . International level registrations and inscriptions (weighting: 33% of the total for the level);b . National level registrations and inscriptions (weighting: 67% of the total for the level).
2 . “Protection, safeguarding and management”, which covers concrete policies, measures, facilities, capacity building and community activity associated with the protection, conservation and management of heritage at the national level. Its weighting in the final indicator is 40% of the total value. It is divided into three sub-components:
a . ‘Conservation and valorization’ (weighting: 33% of the total for the level), which covers the adoption of specific legislation and concrete measures, the establishment of infrastructures and the availability of budgets intended to safeguard, protect and enhance heritage assets and to ensure the management framework required for ensuring and enabling sustainable development;
b . ‘Knowledge and capacity-building’ (weighting: 33% of the total for the level), which covers the existence of training facilities and capacity-building programmes intended to reinforce national capacities to better conserve, safeguard, manage and promote heritage at the professional and institutional levels for heritage managers, government representatives, etc.;
c . ‘Community involvement’ (weighting: 33% of the total for the level), which assesses the efforts made to engage local communities and indigenous people in decision-making and management related to heritage.
3 . “Transmission and mobilization of support”, encompasses raising awareness of heritage value and sense as well as of potential threats among the general public through signage, interpretation services, communication campaigns and education activities. It also covers engagement of the private sector and the civil society on heritage issues. The weighting of this component in the final indicator is 30% of the total value. It comprises two sub-components:
a . ‘Raising awareness and education’ (weighting: 60% of the total for the level), which covers measures and programmes intended to promote the educational potential of heritage and its transmission as well as informational and media programmes and facilities addressed to the general public and to key social agents in order to foster understanding, recognition, respect and enhancement of heritage in society;
b . ‘Stimulating support’ (weighting: 40% of the total for the level), which covers agreements with civil society and the private sector concerning the protection and conservation of heritage.
A specific value has been assigned to each of the main components of the indicator. Thus, ‘Protection, safeguarding and management’ has a weighting of 40% of the total, giving it more weight than the two other components, which have a weighting of 30% of the total each, since the existence of key policies and concrete measures is considered decisive for heritage sustainability. The individual items listed for each of the seven sub-components are given the same value when determining the totals for each component.
To construct the indicator, the Data Table for the dimension must be completed by answering yes (inserting “Y”) or no (inserting “N”) in the relevant cell, in light of the situation and context of the country. The benchmark indicator is thus automatically constructed. In addition to yes and no responses, certain questions ask for supplementary qualitative information. The data should be input into the relevant white cells of the Data column in the Data Table. This qualitative information is additional and purely descriptive. It is meant to be used in the analysis of the indicator at the national level, but it is not calculated into the final result of the indicator. Finally, when responding yes to a particular item, it is recommended to detail the policies, measures, programmes or actions considered in the Sources column of the Data Table.
Items that form the Data Table for constructing the indicator are listed below:
REGISTRATIONS AND INSCRIPTIONS
International Level
Creation and submission of tentative lists or inventories of cultural and natural heritage to the UNESCO World Heritage Center in the last 5 years
Inscription of cultural, natural or mixed heritage sites on the UNESCO World Heritage List
Inscription of an element on the UNESCO's Representative List of the Intangible Cultural Heritage of Humanity
Inscription of an element on the UNESCO List of Intangible Cultural Heritage in Need of Urgent Safeguarding
Programmes or projects selected as best safeguarding practices by the Intergovernmental Committee of the 2003 Convention for the Safeguarding of Intangible Cultural Heritage
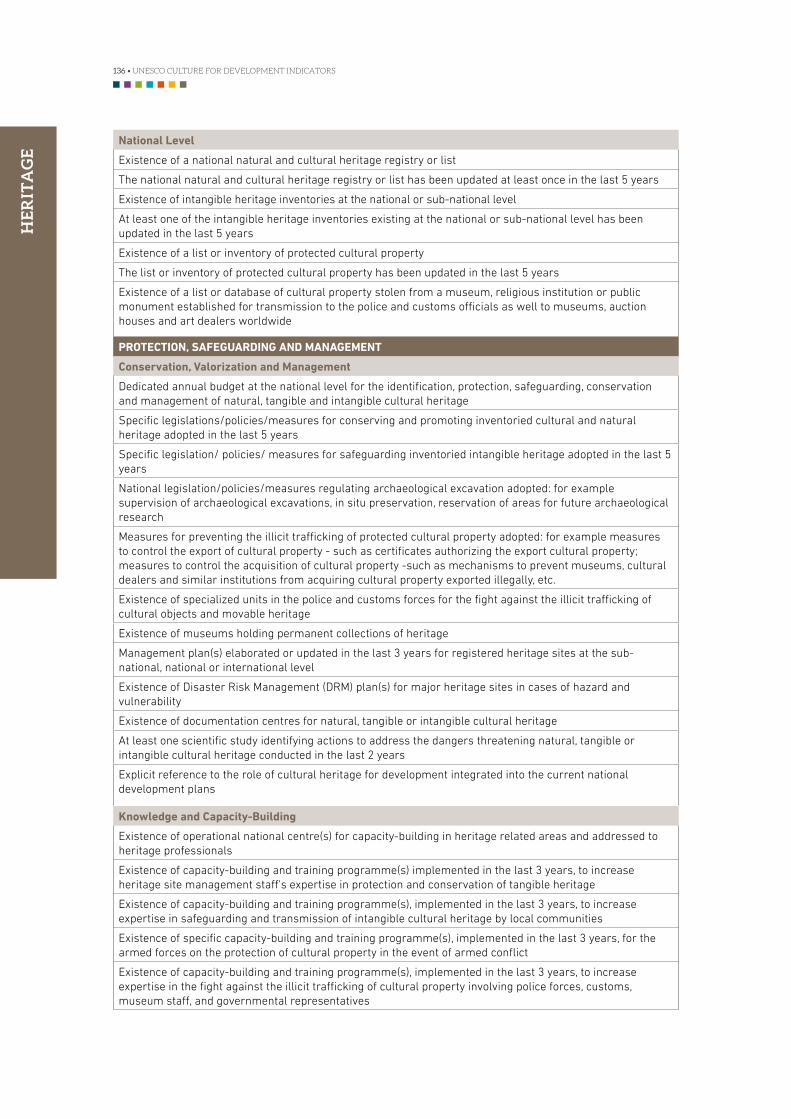
136 • UNESCO CULTURE FOR DEVELOPMENT INDICATORS
HE
RIT
AG
E
National Level
Existence of a national natural and cultural heritage registry or list
The national natural and cultural heritage registry or list has been updated at least once in the last 5 years
Existence of intangible heritage inventories at the national or sub-national level
At least one of the intangible heritage inventories existing at the national or sub-national level has been updated in the last 5 years
Existence of a list or inventory of protected cultural property
The list or inventory of protected cultural property has been updated in the last 5 years
Existence of a list or database of cultural property stolen from a museum, religious institution or public monument established for transmission to the police and customs officials as well to museums, auction houses and art dealers worldwide
PROTECTION, SAFEGUARDING AND MANAGEMENT
Conservation, Valorization and Management
Dedicated annual budget at the national level for the identification, protection, safeguarding, conservation and management of natural, tangible and intangible cultural heritage
Specific legislations/policies/measures for conserving and promoting inventoried cultural and natural heritage adopted in the last 5 years
Specific legislation/ policies/ measures for safeguarding inventoried intangible heritage adopted in the last 5 years
National legislation/policies/measures regulating archaeological excavation adopted: for example supervision of archaeological excavations, in situ preservation, reservation of areas for future archaeological research
Measures for preventing the illicit trafficking of protected cultural property adopted: for example measures to control the export of cultural property - such as certificates authorizing the export cultural property; measures to control the acquisition of cultural property -such as mechanisms to prevent museums, cultural dealers and similar institutions from acquiring cultural property exported illegally, etc.
Existence of specialized units in the police and customs forces for the fight against the illicit trafficking of cultural objects and movable heritage
Existence of museums holding permanent collections of heritage
Management plan(s) elaborated or updated in the last 3 years for registered heritage sites at the sub-national, national or international level
Existence of Disaster Risk Management (DRM) plan(s) for major heritage sites in cases of hazard and vulnerability
Existence of documentation centres for natural, tangible or intangible cultural heritage
At least one scientific study identifying actions to address the dangers threatening natural, tangible or intangible cultural heritage conducted in the last 2 years
Explicit reference to the role of cultural heritage for development integrated into the current national development plans
Knowledge and Capacity-Building
Existence of operational national centre(s) for capacity-building in heritage related areas and addressed to heritage professionals
Existence of capacity-building and training programme(s) implemented in the last 3 years, to increase heritage site management staff's expertise in protection and conservation of tangible heritage
Existence of capacity-building and training programme(s), implemented in the last 3 years, to increase expertise in safeguarding and transmission of intangible cultural heritage by local communities
Existence of specific capacity-building and training programme(s), implemented in the last 3 years, for the armed forces on the protection of cultural property in the event of armed conflict
Existence of capacity-building and training programme(s), implemented in the last 3 years, to increase expertise in the fight against the illicit trafficking of cultural property involving police forces, customs, museum staff, and governmental representatives
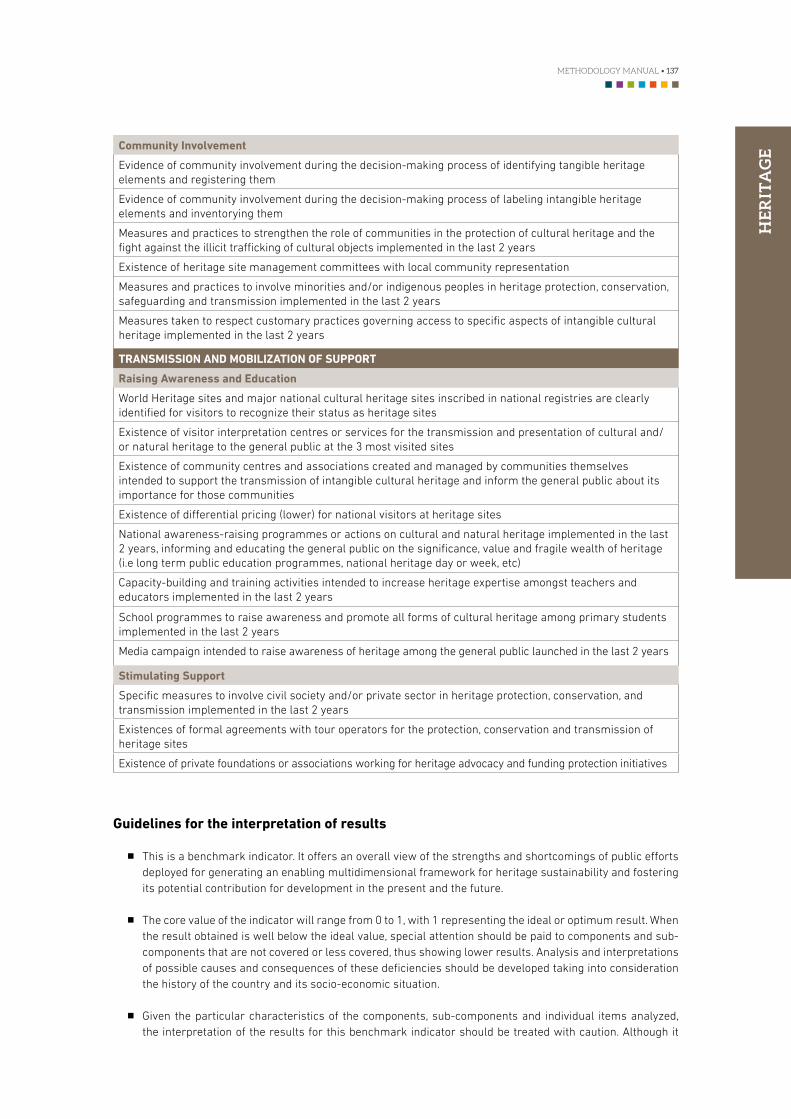
METHODOLOGY MANUAL • 137
HE
RIT
AG
ECommunity Involvement
Evidence of community involvement during the decision-making process of identifying tangible heritage elements and registering them
Evidence of community involvement during the decision-making process of labeling intangible heritage elements and inventorying them
Measures and practices to strengthen the role of communities in the protection of cultural heritage and the fight against the illicit trafficking of cultural objects implemented in the last 2 years
Existence of heritage site management committees with local community representation
Measures and practices to involve minorities and/or indigenous peoples in heritage protection, conservation, safeguarding and transmission implemented in the last 2 years
Measures taken to respect customary practices governing access to specific aspects of intangible cultural heritage implemented in the last 2 years
TRANSMISSION AND MOBILIZATION OF SUPPORT
Raising Awareness and Education
World Heritage sites and major national cultural heritage sites inscribed in national registries are clearly identified for visitors to recognize their status as heritage sites
Existence of visitor interpretation centres or services for the transmission and presentation of cultural and/or natural heritage to the general public at the 3 most visited sites
Existence of community centres and associations created and managed by communities themselves intended to support the transmission of intangible cultural heritage and inform the general public about its importance for those communities
Existence of differential pricing (lower) for national visitors at heritage sites
National awareness-raising programmes or actions on cultural and natural heritage implemented in the last 2 years, informing and educating the general public on the significance, value and fragile wealth of heritage (i.e long term public education programmes, national heritage day or week, etc)
Capacity-building and training activities intended to increase heritage expertise amongst teachers and educators implemented in the last 2 years
School programmes to raise awareness and promote all forms of cultural heritage among primary students implemented in the last 2 years
Media campaign intended to raise awareness of heritage among the general public launched in the last 2 years
Stimulating Support
Specific measures to involve civil society and/or private sector in heritage protection, conservation, and transmission implemented in the last 2 years
Existences of formal agreements with tour operators for the protection, conservation and transmission of heritage sites
Existence of private foundations or associations working for heritage advocacy and funding protection initiatives
Guidelines for the interpretation of results
NN This is a benchmark indicator. It offers an overall view of the strengths and shortcomings of public efforts deployed for generating an enabling multidimensional framework for heritage sustainability and fostering its potential contribution for development in the present and the future.
NN The core value of the indicator will range from 0 to 1, with 1 representing the ideal or optimum result. When the result obtained is well below the ideal value, special attention should be paid to components and sub-components that are not covered or less covered, thus showing lower results. Analysis and interpretations of possible causes and consequences of these deficiencies should be developed taking into consideration the history of the country and its socio-economic situation.
NN Given the particular characteristics of the components, sub-components and individual items analyzed, the interpretation of the results for this benchmark indicator should be treated with caution. Although it
138 • UNESCO CULTURE FOR DEVELOPMENT INDICATORS
HE
RIT
AG
E
provides a rapid overview of the overall development of a multidimensional public framework for heritage sustainability, its added value comes from the detailed analysis of the individual results of each item in light of the country’s situation and the existence of positive synergies or deficiencies. Some elements that may be worth analyzing are:
a . The overall priority given by the State to heritage;b . The completeness of inventories and the inclusion of all kinds of heritage (tangible, intangible, natural,
movable, underwater) in national and international registers and inventories;c . The range of policies, measures, communication and education programmes and strategies adopted
and implemented to support heritage sustainability;d . The importance granted to the reinforcement of capacities of heritage professionals and related actors
from the public sector;e . The active engagement of the local community, including indigenous groups associated with heritage
sites or elements;
NN Correlating the results of the indicator for this dimension with other CDIS indicators is also crucial. A transversal reading of the Heritage dimension with other indicators from other dimensions, such as Education and Governance, yields valuable additional information about the valorization and promotion of heritage. The Education dimension includes, for example, an indicator providing information on the existence of tertiary training programmes in the areas of heritage and cultural management. The Governance dimension includes indicators that provide further information about the ratification of key international instruments regarding heritage as well as about the adoption of laws, policies and strategies incorporating heritage and cultural diversity, the existence and distribution of non for profit museums, and the degree to which minorities and cultural professionals are included in cultural policy decision-making.
NN Likewise, a detailed analysis of the Heritage dimension can be useful for completing or analyzing the results of indicators of other dimensions. Heritage is important for establishing underlying factors of tradition, it can form the basis for creative inspiration in arts and design, and it can contribute to the national economy through tourism and crafts as well as by attracting investments, factors that may contribute to the analysis of such dimensions as Social Participation and Economy.
METHODOLOGY MANUAL • 139
TECHNICAL NOTE
The UNESCO CDIS methodology has been designed to offer a pragmatic starting point for cultural statistics development and the generation of data for the better integration of culture in development strategies and the formulation of better-informed cultural policies. Taking into account the particular characteristics and challenges of low and middle-income countries, where resources and data are limited, the CDIS methodology is designed to be both cost-effective and efficient. To this end, CDIS indicators rely on the collection and the construction of various forms of data, which may come directly from secondary national or international sources.
The CDIS methodology marks a preference for national sources, which tend to be more reliable, up-to-date, and offer more opportunities for disaggregation by demographic variables. International sources, which offer greater possibilities of comparability, are also proposed when no national data is available in many of the targeted countries.
The UNESCO CDIS proposes a hierarchical categorization of indicators to address the different levels of data availability. The priority category is the core indicators, which are the recommended indicators in the Methodology Manual and will be the basis for the national Culture for Development DNA. Nevertheless, if a country has additional data on a particular topic that could add value to the overall understanding of that dimension, additional indicators may be proposed. Moreover, if a country does not have data sources for the core indicator, but other relevant data sources exist with similar objectives, alternative indicators may be proposed.
The CDIS aims to offer an inclusive overview of the multidimensional contribution of culture to national development processes. However, the CDIS is not all-inclusive as it does not cover all possible dimensions where culture has a powerful impact on development. Indeed, additional dimensions on health or environment could be explored for its future inclusion into the matrix. Instead of an index or composite indicator model, a suite or matrix approach has been adopted to best fit this broad scope.
Finally, in order to obtain a global picture of culture’s role in development in a given country, different types of indicators are proposed to gather relevant information at different levels of analysis and to foster cross-readings. Thus, among its 22 core indicators, the CDIS includes:
NN Benchmark and descriptive indicators. A benchmark indicator suggests that there is an ideal to be achieved, allowing for comparability. In turn, comparability permits benchmark indicators to be set on an ascending scale. The scale for CDIS ranks from 0 to 1, 0 being the minimum and 1 the optimum result. A descriptive, or contextual, indicator assesses a variable without a clear target or ideal to be achieved. The contextualization of the results of descriptive indicators is even more important for the analysis and interpretation of the results.
NN Individual-level and national-level indicators. While individual-level indicators assess variables at the level of the individual or singular unit, national-level indicators offer data assessment at the national level.
NN Objective and subjective indicators. While objective indicators provide information on the visible state of a situation and output results, subjective indicators provide information on personal or perceived assessments of a situation, thus offering insight into intangible aspects of the contribution of culture to development.
NN Cultural indicators and non-cultural indicators. While cultural indicators that specifically target the collection of cultural data provide pertinent information about culture’s role in development processes; non-cultural indicators, that use data and statistics non-strictly cultural (e.g. Internet access), can also serve as proxys and offer a valuable approximation for understanding the conditions in which culture evolves and how it contributes to development.
All details on the sources, technical characteristics and calculation methods of each of the 22 core CDIS indicators, as well as guidelines for their analysis, can be found in this Methodology Manual, organized by dimension.

140 • UNESCO CULTURE FOR DEVELOPMENT INDICATORS

The UNESCO Culture for Development Indicators (CDIS) is an advocacy and policy tool which combines the knowledge from leading experts with a refined, field-proven and practical methodology resulting in a set of 22 indicators. Far from an attempt to measure culture in itself, the CDIS makes the case for culture in national development processes by providing tangible facts and figures on the different ways in which culture acts both as a driver and enabler of development.
The CDIS Methodology Manual constitutes the foundation reference document, which establishes the complete framework in terms of concepts, definitions, calculation methodology and interpretation guidelines to be applied in the implementation of the indicators. It also provides practical guidance to by-pass shortcomings in specific national environments and thus come up with other appropriate alternative and/or additional indicators.
The CDIS Methodology Manual has a companion Implementation Toolkit which supports its operational rollout at the country level, describing the step-by step processes and actors. The combined CDIS toolset facilitates further implementation of the CDIS indicators elsewhere and delivers:
NN Factual data which demonstrates the strong interaction between culture and development;NN A basis to assess the ability to sustain and enhance cultural assets and processes for development in any
given local environment; NN A global overview of national challenges and opportunities which allows cultural policies and development
strategies to take full advantage of culture’s potential.
The CDIS Methodology Manual, the full toolset and country field data can be accessed with your QR code reader app or alternatively through our official website at: www .unesco .org/creativity/cdis
Contact us: cdis@unesco .org
United NationsEducational, Scientific and
Cultural Organization
Diversity ofCultural Expressions
Letting the facts and figures do the talking