cultural & geographic differences in personality and...
TRANSCRIPT

CulturalCultural & & GeographicGeographicDifferencesDifferences inin PersonalityPersonalityand and NationalNational StereotypesStereotypes
August 3, 2007
Leie
Jüri Allik
The Estonian Center of Behavioral and Health Sciences

PersonalityPersonality PsychologyPsychology
Personality psychology Personality psychology isis stillstill dominateddominated byby twotwo““schoolsschools”” thinkingthinking: :
(1)(1) ““Grand Grand theoriestheories”” of of personalitypersonality bornborn fromfrom armchairarmchairspeculationsspeculations;;
(2)(2) UntiringUntiring collectioncollection of of empiricalempirical datadata toto supportsupport ““mini mini theoriestheories”” thatthat havehave littlelittle ifif anyany consequencesconsequences..
HoweverHowever, , therethere are are firstfirst signssigns thatthat thethe periodperiod of of armchairarmchairspeculationsspeculations and and mindlessmindless empiricismempiricism isis almostalmost overoverbeingbeing graduallygradually replacedreplaced byby empiricallyempirically groundedgroundedtheoriestheories providingproviding answersanswers toto thethe greatgreat questionsquestions

Personality Questionnaires (1)Personality Questionnaires (1)
1.1. I I amam alwaysalways inin a a goodgood moodmood..
VeryVery truetrue
SomewhatSomewhat truetrue
NeitherNeither truetrue nornor untrueuntrue
SomewhatSomewhat untrueuntrue
VeryVery untrueuntrue

Personality Questionnaires (2)Personality Questionnaires (2)
2.2. I I amam easilyeasily embarrassedembarrassed..
VeryVery truetrue
SomewhatSomewhat truetrue
NeitherNeither truetrue nornor untrueuntrue
SomewhatSomewhat untrueuntrue
VeryVery untrueuntrue
ReliabilityReliability of of QuestionnairesQuestionnaires
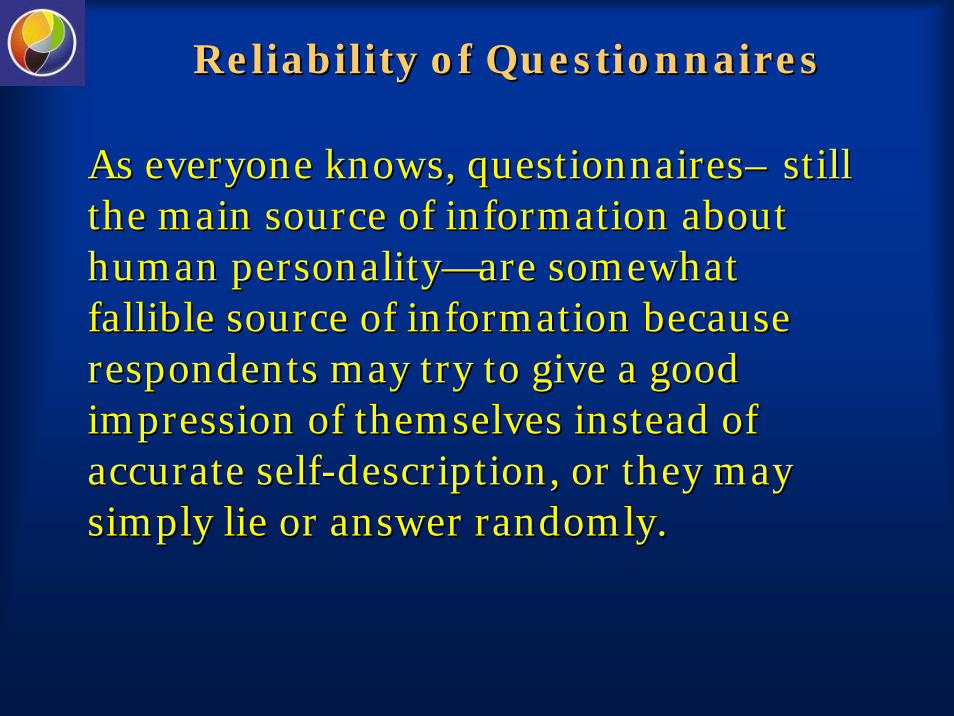
AsAs everyoneeveryone knowsknows, , questionnairesquestionnaires–– stillstillthethe mainmain sourcesource of of informationinformation aboutabouthumanhuman personalitypersonality——areare somewhatsomewhatfalliblefallible sourcesource of of informationinformation becausebecauserespondentsrespondents maymay trytry toto givegive a a goodgoodimpressionimpression of of themselvesthemselves insteadinstead of of accurateaccurate selfself--descriptiondescription, , oror theythey maymaysimplysimply lielie oror answeranswer randomlyrandomly..

ReliabilityReliability of of MeasuresMeasures
Nevertheless, it turned out that because the Nevertheless, it turned out that because the most participants are:most participants are:
(1)(1) honest;honest;
(2)(2) cooperative;cooperative;
(3)(3) consistent;consistent;
(4)(4) reliablereliable
thethe averageaverage resultsresults provideprovide reasonablyreasonably correctcorrectand and authenticauthentic informationinformation aboutabout humanhumandispositionsdispositions toto thinkthink, feel, and , feel, and behavebehave inin a a characteristiccharacteristic wayway..

ACCURACY OF PERSONALITY JUDGEMENTS
Personality judgments made by closeacquaintances like near relatives, spouses, orfriends tend to be reasonably accurate.
The agreement between two judges whoknow the target well, or judges and thetarget, often yields consensus correlation of about .50 or even higher (Funder, 1999).

David Funder
Two forms of agreement (1)
(1)(1) TRAIT AGREEMENTTRAIT AGREEMENT
(2)(2) PROFILE AGREEMENTPROFILE AGREEMENT
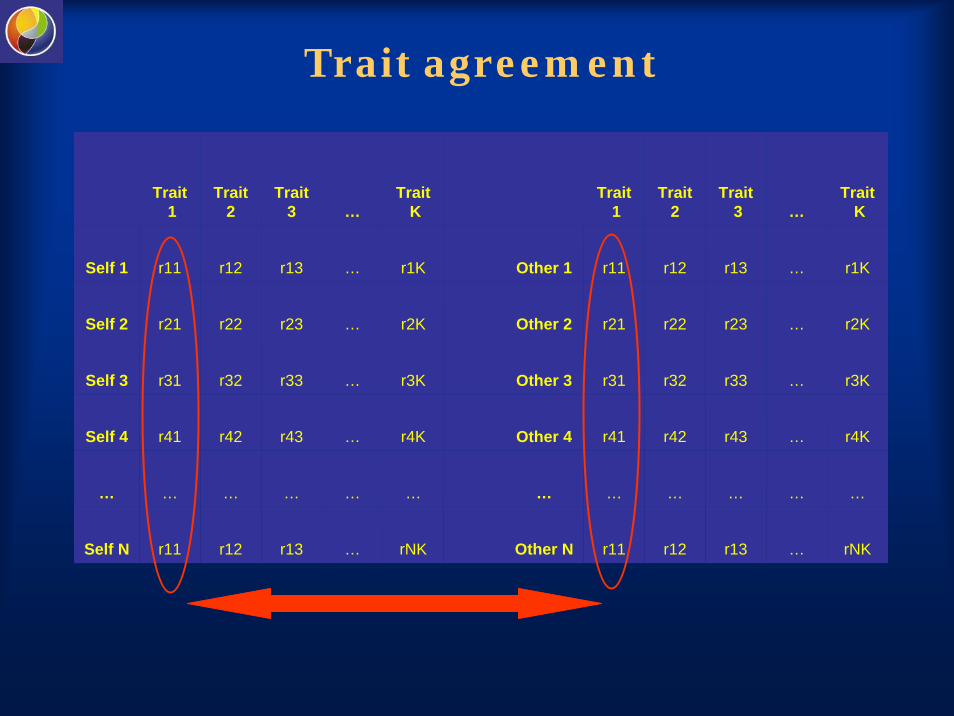
Trait1
Trait 2
Trait 3 …
TraitK
Trait1
Trait 2
Trait3 …
TraitK
Self 1 r11 r12 r13 … r1K Other 1 r11 r12 r13 … r1K
Self 2 r21 r22 r23 … r2K Other 2 r21 r22 r23 … r2K
Self 3 r31 r32 r33 … r3K Other 3 r31 r32 r33 … r3K
Self 4 r41 r42 r43 … r4K Other 4 r41 r42 r43 … r4K
… … … … … … … … … … … …
Self N r11 r12 r13 … rNK Other N r11 r12 r13 … rNK
Trait agreement

EXTRAVERSIONCorrelation: r = .71 (N=154)
20 40 60 80 100 120 140 160 180 200SELF
20
40
60
80
100
120
140
160
180
200
OTH
ER
TRAIT AGREEMENT
EPIPEPIP--NEO NEO datadata
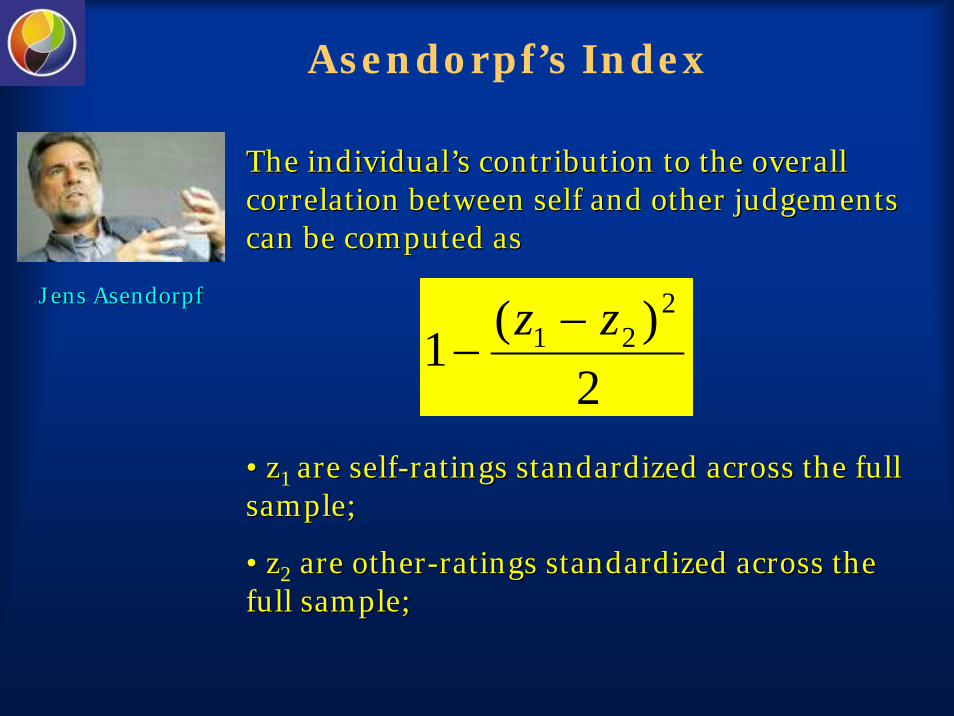
Asendorpf’s Index
Jens Jens AsendorpfAsendorpf
The individualThe individual’’s contribution to the overall s contribution to the overall correlation between self and other judgements correlation between self and other judgements can be computed as can be computed as
•• zz1 are are selfself--ratingsratings standardized across the full standardized across the full samplesample; ;
•• zz2 are are otherother--ratingsratings standardized across the standardized across the full samplefull sample; ;
2)(1
221 zz −
−

Trait1
Trait 2
Trait 3 …
TraitK
Trait1
Trait 2
Trait3 …
TraitK
Self 1 r11 r12 r13 … r1K Other 1 r11 r12 r13 … r1K
Self 2 r21 r22 r23 … r2K Other 2 r21 r22 r23 … r2K
Self 3 r31 r32 r33 … r3K Other 3 r31 r32 r33 … r3K
Self 4 r41 r42 r43 … r4K Other 4 r41 r42 r43 … r4K
… … … … … … … … … … … …
Self N r11 r12 r13 … rNK Other N r11 r12 r13 … rNK
Profile agreement

R=.95 (before correction R=.97) S3031
SelfOtherN1
N2N3
N4N5
N6E1
E2E3
E4E5
E6O1
O2O3
O4O5
O6A1
A2A3
A4A5
A6C1
C2C3
C4C5
C6
-5
0
5
10
15
20
25
30
35Correlation: r = .97
N1 N2 N3N4
N5
N6
E1E2
E3
E4
E5
E6
O1
O2O3
O4
O5
O6
A1
A2
A3
A4
A5
A6
C1
C2
C3
C4 C5
C6
-5 0 5 10 15 20 25 30 35Self
-5
0
5
10
15
20
25
30
35
Oth
er
95% confidence
PROFILE AGREEMENT
Correlation between two profiles

Average
AverageN1
N2N3
N4N5
N6E1
E2E3
E4E5
E6O1
O2O3
O4O5
O6A1
A2A3
A4A5
A6C1
C2C3
C4C5
C6
0
5
10
15
20
25
30
35
Average Profile (N=154)

R=.95 (before correction R=.97) S3031
SelfOtherN1
N2N3
N4N5
N6E1
E2E3
E4E5
E6O1
O2O3
O4O5
O6A1
A2A3
A4A5
A6C1
C2C3
C4C5
C6
-5
0
5
10
15
20
25
30
35
A very good agreement

S3031 and Average
S3031AverageN1
N2N3
N4N5
N6E1
E2E3
E4E5
E6O1
O2O3
O4O5
O6A1
A2A3
A4A5
A6C1
C2C3
C4C5
C6
0
5
10
15
20
25
30
35
Compared to average profile
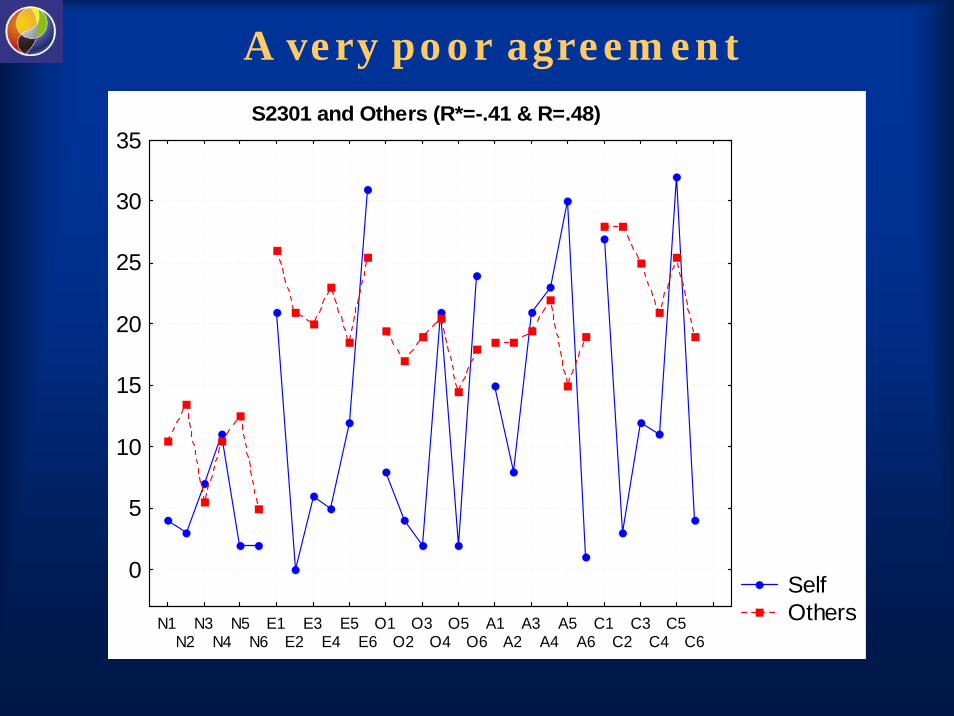
S2301 and Others (R*=-.41 & R=.48)
SelfOthersN1
N2N3
N4N5
N6E1
E2E3
E4E5
E6O1
O2O3
O4O5
O6A1
A2A3
A4A5
A6C1
C2C3
C4C5
C6
0
5
10
15
20
25
30
35
A very poor agreement

Trait vs Profile AgreementR=.65 (N=1223)
-1,2-1,0
-0,8-0,6
-0,4-0,2
0,00,2
0,40,6
0,81,0
1,2
Profile Agreement
-2,5
-2,0
-1,5
-1,0
-0,5
0,0
0,5
1,0
1,5
Trai
t Agr
eem
ent

** ** **

ORIGIN OF PERSONALITY TRAITSORIGIN OF PERSONALITY TRAITS

NatureNature vs. vs. CultureCulture

NatureNature vs. vs. CultureCulture

Cora Cora DuDu Bois (1903Bois (1903--1991)1991)
The first woman tenured in the Anthropology Department and the second woman ever be tenured in the Faculty of
Arts and Sciences at Harvard University
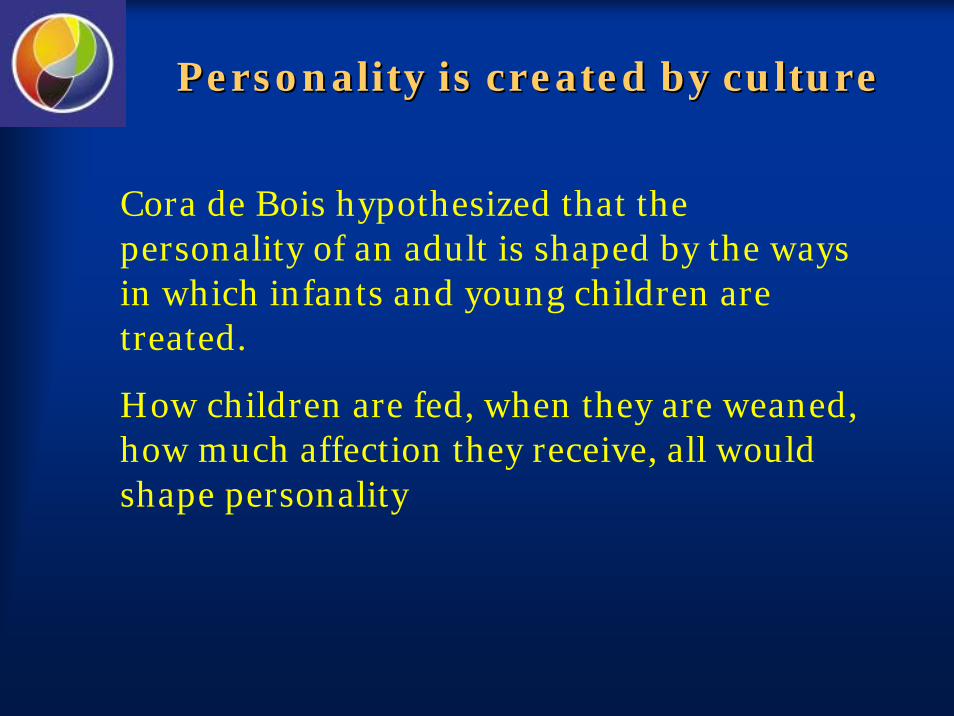
PersonalityPersonality isis createdcreated byby cultureculture
Cora de Bois hypothesized that the personality of an adult is shaped by the ways in which infants and young children are treated.
How children are fed, when they are weaned, how much affection they receive, all would shape personality

ModalModal PersonalityPersonality (1)(1)
Cora DuBois conducted her research on Alor Islandin Indonesia. She defined the Alorese modal personality
The Alorese were defined as hostile, suspicious, jealous and prone to temper tantrums. Thereappeared to be little warmth among couples.
ModalModal PersonalityPersonality (2)(2)
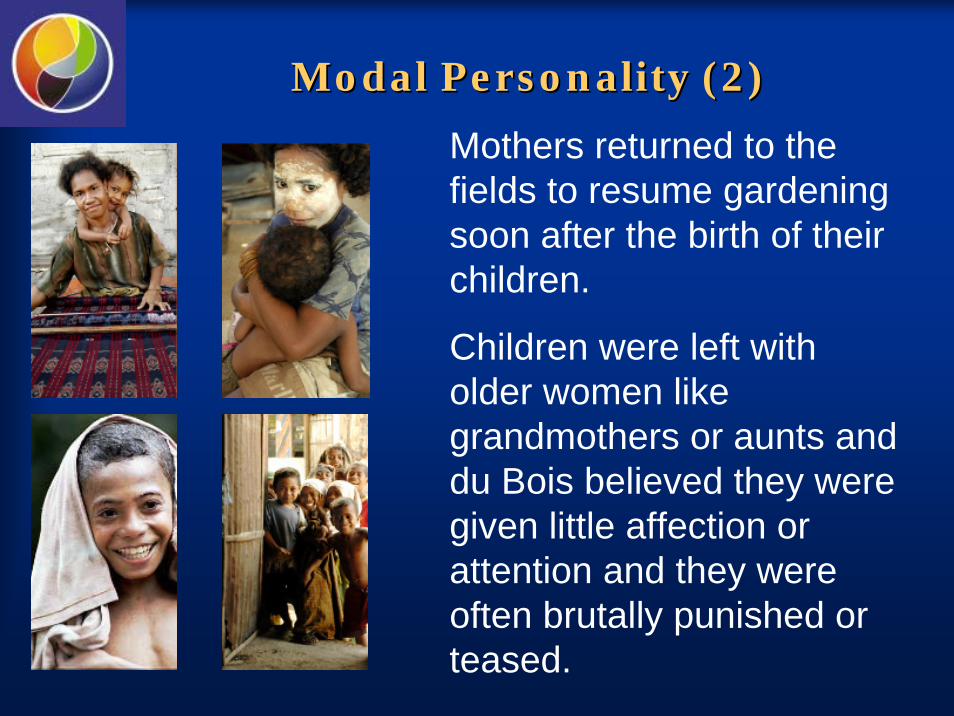
Mothers returned to thefields to resume gardeningsoon after the birth of theirchildren.
Children were left witholder women likegrandmothers or aunts and du Bois believed they weregiven little affection orattention and they wereoften brutally punished orteased.

Ruth Benedict (1887-1948)

PatternsPatterns of of CultureCulture (1934)(1934)
Patterns of Culturebrought together anthropological, poetic, and personal insights of the past ten years, and became an American Classic.
She saw culture as Procrustean bed into which individuals are made to lie
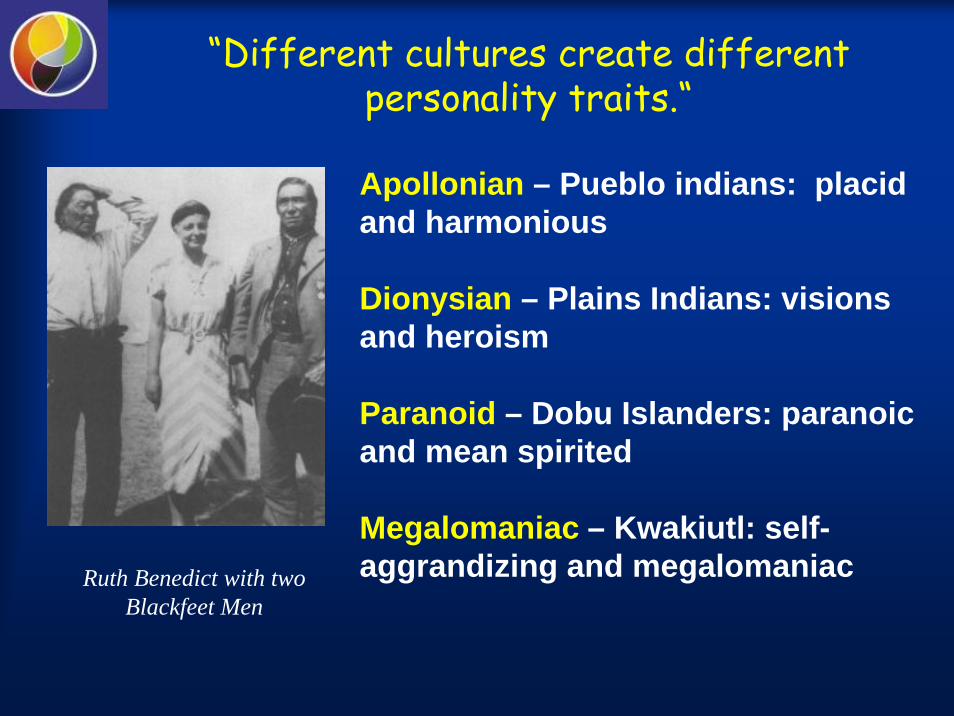
“Different cultures create different personality traits.“
Ruth Benedict with two Blackfeet Men
Apollonian – Pueblo indians: placid and harmonious
Dionysian – Plains Indians: visions and heroism
Paranoid – Dobu Islanders: paranoicand mean spirited
Megalomaniac – Kwakiutl: self-aggrandizing and megalomaniac

NatureNature vs. vs. CultureCulture

NatureNature vs. vs. CultureCulture

FiveFive FactorFactor TheoryTheory of of PersonalityPersonality
Paul T. Costa Jr.Robert R. McCrae

FiveFive--Factor Theory of PersonalityFactor Theory of Personality
Basic Basic TendenciesTendencies
Phenotypically, traits can be described as enduring tendencies to think, feel, and behave in consistent ways: Extraverts talk a lot, in many situations; conscientious people are methodical and persistent over long periods of time.
Basic Tendencies, rooted in biology, are not directly accessible either to observation or to introspection.

CharacteristicCharacteristic AdapatationsAdapatations
Basic Tendencies interact with the environment in shaping those psychological structures that directly guide behavior: Habits, values, plans, skills, scripts, schemas, relationships.
These are called Characteristic Adaptations; they are characteristic because they reflect the individual’s underlying dispositions, and they are adaptations because they are designed to respond to the requirements of the environment. .

The Big FiveThe Big Five
“A relatively strong consensus has been reached that the pattern of covariation among personality traits can be best summarized by five nearly orthogonal dimensions that are consistent across instruments, observers and cultures”
(McCrae & John, 1992)

The Big FiveThe Big Five
• Neuroticism N
• Extraversion E
• Openness to Experience O
• Agreeableness A
• Conscientiousness C

OCEAN of PersonalityOCEAN of Personality
• Openness to Experience
• Conscientiousness
• Extraversion
• Agreeableness
• Neuroticism

FiveFive--Factor Theory of Factor Theory of PersonalitPersonalit

MAIN EVIDENCESMAIN EVIDENCES
(1)(1) HeritabilityHeritability: : personalitypersonality traitstraits are are substantiallysubstantially heritableheritable;;
(2)(2) StabilityStability: : personalitypersonality traitstraits are are veryvery stablestableacrossacross thethe lifelife--spanspan; ; slowslow changeschanges inin thethe meanmeanlevellevel are are systematicsystematic and and identicalidentical acrossacross thetheworldworld;;
(3)(3) UniversalityUniversality: : thethe fivefive--factorfactor structurestructure isisgeneralizablegeneralizable acrossacross languageslanguages and and culturescultures;;
(4)(4) ImmutabilityImmutability: : environmentenvironment and and lifelife--eventseventshavehave a a veryvery limitedlimited effecteffect on on personalitypersonality traitstraits

(1)(1) HERITABILITYHERITABILITY
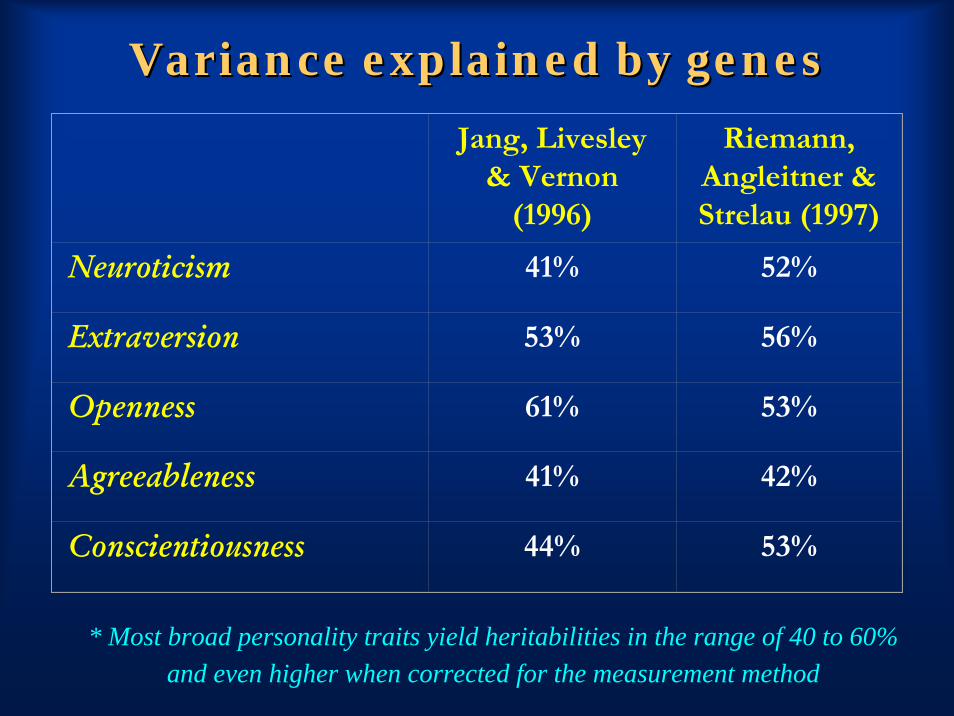
Variance explained by genesVariance explained by genes
Jang, Livesley & Vernon
(1996)
Riemann, Angleitner & Strelau (1997)
Neuroticism 41% 52%
Extraversion 53% 56%
Openness 61% 53%
Agreeableness 41% 42%
Conscientiousness 44% 53%
* Most broad personality traits yield heritabilities in the range of 40 to 60% and even higher when corrected for the measurement method

PersonalityPersonality SimilaritySimilarity inin TwinsTwins RearedRearedApartApart and and TogetherTogether
PersonalityPersonality similaritysimilarity of of identicalidentical twinstwins
rearedreared apartapart oror togethertogether
isis almostalmost identicalidentical
apartapart togethertogether

PersonalityPersonality SimilaritySimilarity inin TwinsTwins RearedRearedApartApart and and TogetherTogether
“Consistent with previous reports, butcontrary to widely held beliefs, theoverall contribution of a common
family environment component wassmall and negligible for all but 2 of the
14 personality measures”
Auke Auke TellegenTellegen, David T , David T LykkenLykken, Thomas J. , Thomas J. BouchardBouchard, , JrJr., ., KimerlyKimerly J. J. WilcoxWilcox, , NancyNancy L. L. SegalSegal, , StephenStephen RichRich
PersonalityPersonality SimilaritySimilarity inin TwinsTwins RearedReared ApartApart and and TogetherTogether
JournalJournal of of PersonalityPersonality and and SocialSocial PsychologyPsychology 1988. 1988. VolVol. 54, no. 6. 1031. 54, no. 6. 1031--10391039

TheyThey werewere identicalidentical twinstwinsuntiluntil Jim Jim joinedjoined armyarmy and and
John John joinedjoined thethe PeacePeace CorpsCorps
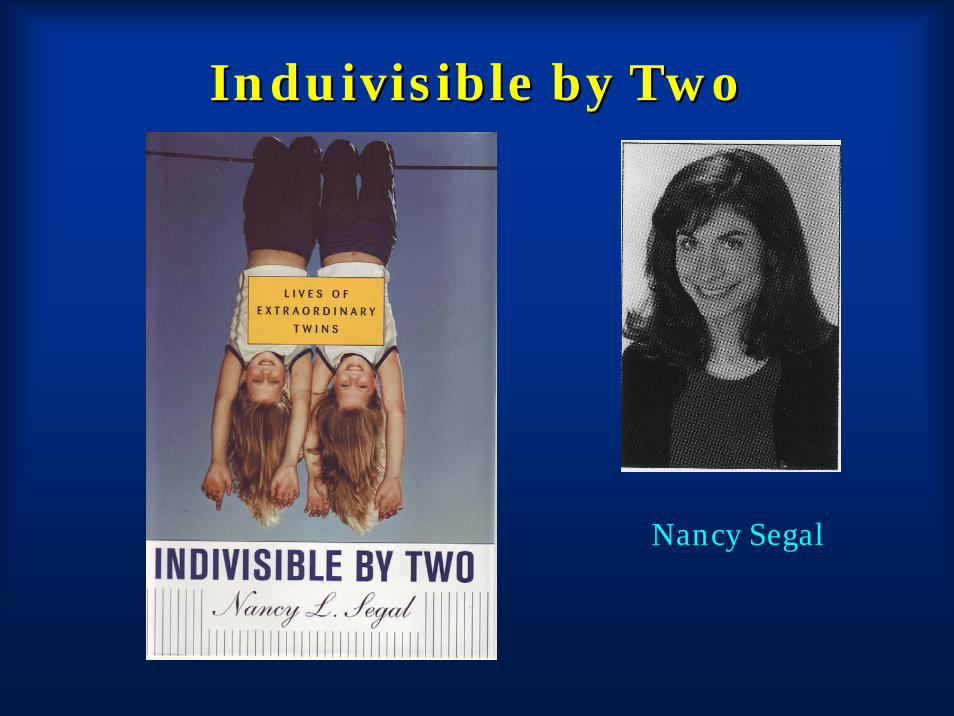
InduivisibleInduivisible by Twoby Two
Nancy Segal

GerryGerry & Mark 1967& Mark 1967

GerryGerry & Mark 1985& Mark 1985

GerryGerry & Mark& Mark
They like Italian food
Their IQ scores were just 2 points apart
They smoke and wear a knife
Hold their pinky finger under a beer can of their favourite Budweiser
Unlike their other family members , they made loud, staccato-like laughing sounds
…
Both became firemen!

Factor Factor Structure of Structure of
Genetic Genetic CorrelationsCorrelations

Sardinia Project Sardinia Project ((ProgeNIAProgeNIA))
Giuseppe PiliaL'Instituto sulle Talassemieed Anemie MediterraneeCagliari, Sardinia
David Schlessinger
National Institute on Aging

Universality of Genetic StructureUniversality of Genetic Structure
Journal of Personality and Social PsychologyJournal of Personality and Social Psychology (2006)(2006)

(2) TEMPORAL STABILITY(2) TEMPORAL STABILITY

Mean level Mean level satabilitysatability
Costa, P. T., Jr., McCrae, R. R., Zonderman, A. B., Barbano, H. E., Lebowitz, B., & Larson, D. M. (1986). Cross-sectional studies of personality in a national sample: 2. Stability in neuroticism, extraversion, and openness. Psychology and Aging, 1, 144-149.

StabilityStability inin AdulthoodAdulthood

StabilityStability inin ChildhoodChildhood

Stability in AdolescenceStability in Adolescence
Pullmann, H., Raudsepp, L., Allik J. (2006). Pullmann, H., Raudsepp, L., Allik J. (2006). StabilityStability and and changechange inin adolescentsadolescents' ' personalitypersonality: a : a longitudinallongitudinal studystudy. . EuropeanEuropean JournalJournal of of PersonalityPersonality, 20, 447, 20, 447--459. 459.

PerceivedPerceived vs Real vs Real ChangeChange

(3) UNIVERSALITY(3) UNIVERSALITY

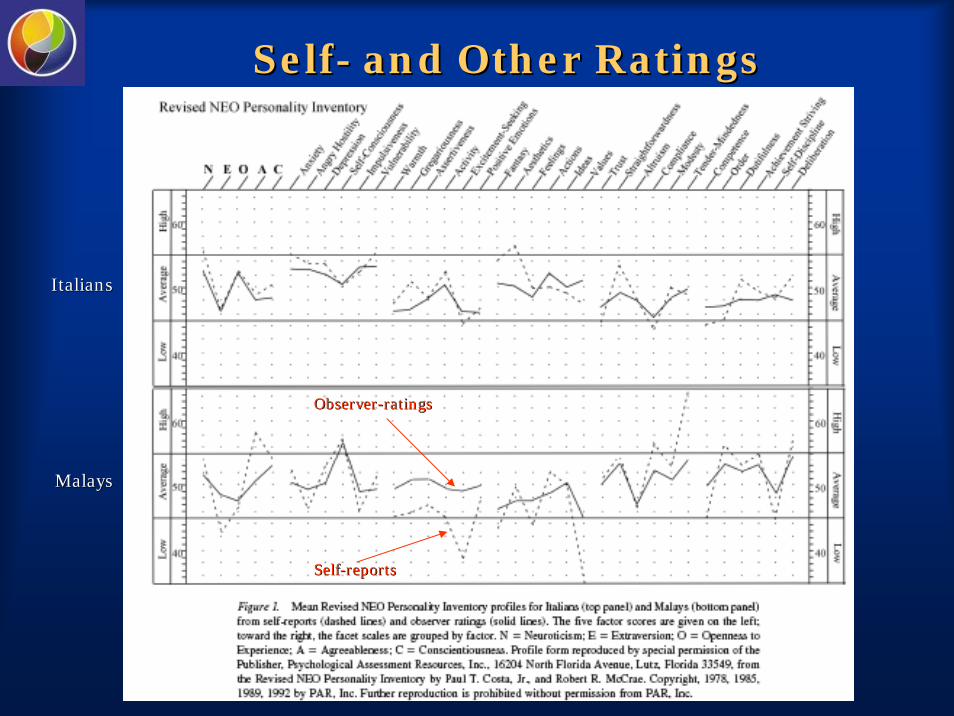
SelfSelf-- vsvs Other RatingsOther Ratings
ItaliansItalians
MalaysMalays
SelfSelf--reportsreports
ObserverObserver--ratingsratings

Factor Structure of NEOFactor Structure of NEO--PIPI--R (51 Cultures ja other ratings)R (51 Cultures ja other ratings)

CultureCulture--LevelLevel FactorFactor StructureStructureFactor Structure of NEOFactor Structure of NEO--PIPI--R (51 Cultures R (51 Cultures && other ratings)other ratings)

(4) IMMUTABILITY(4) IMMUTABILITY

MarriageMarriage & & DivorceDivorce

LittleLittle influenceinfluence on on personalitypersonality
LifeLife eventsevents inin generalgeneral showedshowedveryvery littlelittle influenceinfluence on on thethelevellevel of of personalitypersonality traitstraits

Political SystemPolitical System
Angleitner and Ostendorf (2000) compared personality traits in residents of the former East and West Germanys.
Between 1945 and 1989 these two groups had lived under radically different social and political systems, and they retain to this day significant differences in attitudes and values.
Yet personality profiles for the two samples were virtually identical.

Political SystemPolitical System
N = 7,974N = 7,974

Political SystemPolitical System
Alois Angleitner Fritz Ostendorf
University of University of BielefeldBielefeld

** ** ** **

PERSONALITY ACROSS CULTURESPERSONALITY ACROSS CULTURES

GeneralizabilityGeneralizability
For generalizability of the dimensional structure of personality—relatively independent groups of covarying traits—across languages and cultures a large numbers of cultures must be studied.
Until recently only few worldwide personality datasets have been available.

The Mean Scores ComparisonThe Mean Scores Comparison
When comparing the mean scores of different cultures on a personality trait scale, any observed differences may be due not only to a real cultural disparity on some personality trait, but also to
(1) inappropriate translations
(2) biased sampling
(3) the non-identical response styles of people from different cultures

LLARGEARGE--SSCALECALE SSTUDIESTUDIES
Although much of this skepticism is certainly warranted, a recent, large-scale intercultural comparisons provided evidence that personality scales may be more robust than methodologists had initially presumed (McCrae, 2001; McCrae, 2002; McCrae et al. 2005).
Perhaps because the many sources of error cancel out, it is possible to obtain meaningful results when scores are compared across cultures (Allik & McCrae, 2002).
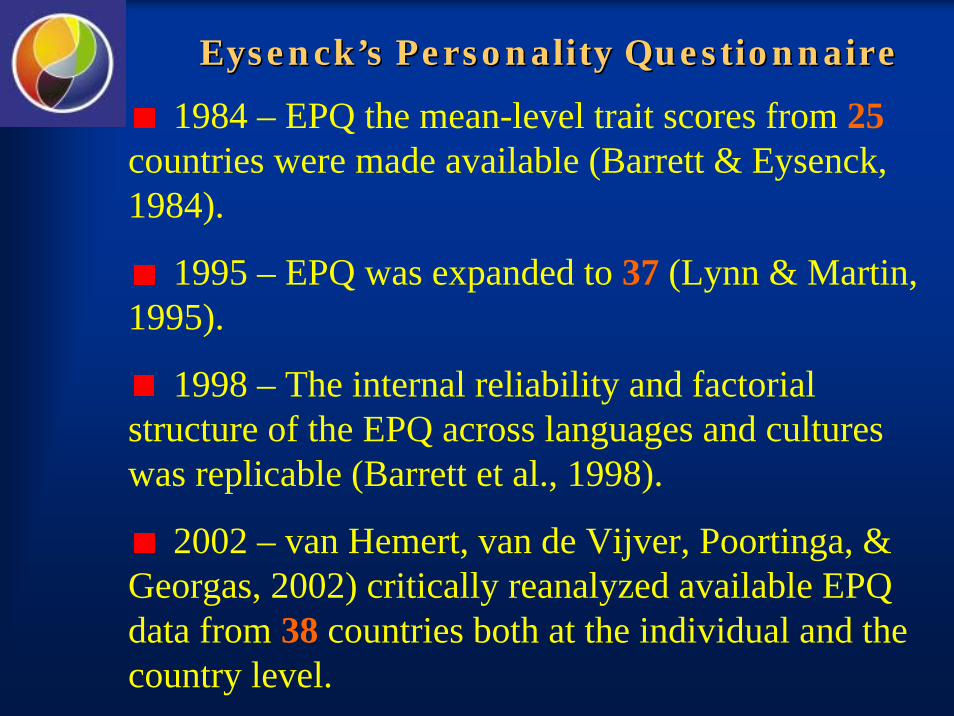
EysenckEysenck’’s Personality Questionnaires Personality Questionnaire
1984 – EPQ the mean-level trait scores from 25countries were made available (Barrett & Eysenck, 1984).
1995 – EPQ was expanded to 37 (Lynn & Martin, 1995).
1998 – The internal reliability and factorial structure of the EPQ across languages and cultures was replicable (Barrett et al., 1998).
2002 – van Hemert, van de Vijver, Poortinga, & Georgas, 2002) critically reanalyzed available EPQ data from 38 countries both at the individual and the country level.

NEONEO--PIPI--RR2001 – NEO-PI-R data from 26 countries or
cultural regions became available for the research community (McCrae, 2001)
2002 – The database was soon expanded to 36cultures covering five major language families: Indo-European, Uralic, Altaic, Dravidian, and Sino-Tibetian (McCrae, 2002).
2005 – College students from 50 culturesidentified an adult or college-age man or woman whom they knew well and rated the 11,985 targetswith the third-person version of NEO-PI-R (McCrae, Terracciano et al., 2005).
SelfSelf-- and and OtherOther RatingsRatings
ItaliansItalians
MalaysMalays
SelfSelf--reportsreports
ObserverObserver--ratingsratings

David P. SchmittDavid P. Schmitt
Department of Psychology
Bradley University
Peoria, Illinois

International Sexuality International Sexuality Description Project (ISDP)Description Project (ISDP)
Big Five Inventory (BFI) (Benet-Martínez & John, 1998) & Rosenberg Self-Esteem Scale
17,837 participants
More than 100 researchers
56 countries
29 languages
6 continents
13 islands
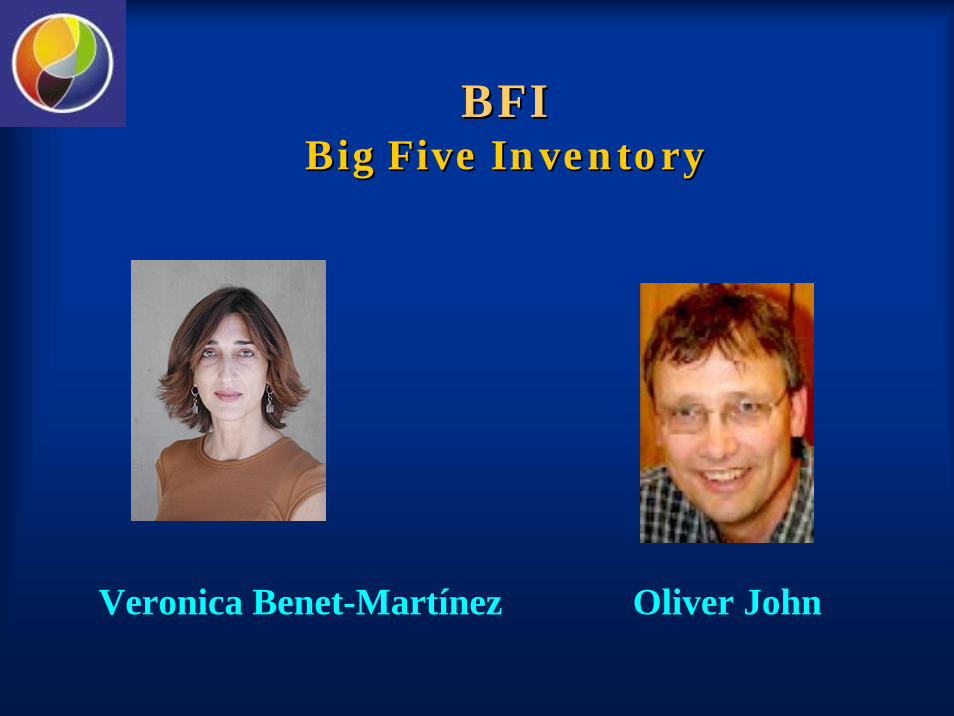
BFIBFIBigBig FiveFive InventoryInventory
Veronica Benet-Martínez Oliver John

Factor StructureFactor Structure
Results indicated that the five-dimensional structure of the BFI was highly robust across major regions of the world, including North America, South America, Western Europe, Eastern Europe, Southern Europe, the Middle East, Africa, Oceania, South/Southeast Asia, and East Asia
(Schmitt, Allik, McCrae, Benet-Martínez, & et al., 2006).

OneOne--ThirdThird RuleRule
The mean level differences in personality traits across cultures are very small in their magnitude.
Typically, the means of cultures had standard deviation equal to about one-third of the magnitude of individual differences within culture (McCrae et al. , 2005).

OneOne--ThirdThird RuleRule (2)(2)
NEO-FFI N = 1905
-5 0 5 10 15 20 25 30 35 40 45 50
NEUROTICISM
0
50
100
150
200
250
300
350
400
450
No.
of o
bs.

OneOne--ThirdThird RuleRule (3)(3)
NEO-FFI N = 1905
-5 0 5 10 15 20 25 30 35 40 45 50
NEUROTICISM
0
50
100
150
200
250
300
350
400
450N
o. o
f obs
.

Common MetricCommon Metric
A relatively modest size of cross-cultural differences in the mean values may imply that a reasonable scalar equivalence can be achieved and all individuals, irrespective of their language and culture, can be represented in a common metric.

* * ** * *

GGEOGRAPHYEOGRAPHY

Multidimensional scaling plot of 36 culturesMultidimensional scaling plot of 36 cultures
Americans
Austrians
Belgians
Canadians
Croatians
Czechs
DanesDutch
EstoniansFilipinos
French
Swiss
Germans
Hispanic Americans
HK Chinese
Indonesians
Italians
Japanese
Norwegians
Peruvians
Portuguese
PRC Chinese
White S. Africans
S. Koreans
Spaniards
Swedes
Zimbabweans
Taiwan
TurksSerbians
-1.2 -0.8 -0.4 0.0 0.4 0.8 1.2
X
-1.2
-0.8
-0.4
0.0
0.4
0.8
1.2
Y
Marathi
Telugu
Malaysians
Hungarians
Russians
Black S. Africans
Allik, J., & McCrae, R.R. (2004). Towards a geography of personality traits: patterns of profiles across 36 cultures. Journal of Cross-Cultural Psychology, 35, 13-28
N
E

Multidimensional scaling plot of 36 culturesMultidimensional scaling plot of 36 cultures
Americans
Austrians
Belgians
Canadians
Croatians
Czechs
DanesDutch
EstoniansFilipinos
French
Swiss
Germans
Hispanic Americans
HK Chinese
Indonesians
Italians
Japanese
Norwegians
Peruvians
Portuguese
PRC Chinese
White S. Africans
S. Koreans
Spaniards
Swedes
Zimbabweans
Taiwan
TurksSerbians
-1.2 -0.8 -0.4 0.0 0.4 0.8 1.2
X
-1.2
-0.8
-0.4
0.0
0.4
0.8
1.2
Y
Marathi
Telugu
Malaysians
Hungarians
Russians
Black S. Africans
Allik, J., & McCrae, R.R. (2004). Towards a geography of personality traits: patterns of profiles across 36 cultures. Journal of Cross-Cultural Psychology, 35, 13-28
Neoroticism
Extraversion

Correlation with Personality Factors and Correlation with Personality Factors and Cultural DimensionsCultural Dimensions
Correlate Horizontal VerticalPersonality Factor Neuroticism 0.02 0.83 Extraversion 0.84 -0.13 Openness 0.64 -0.17 Agreeableness -0.55 -0.29 Conscientiousness -0.34 -0.57Hofstede Dimension Power Distance -0.52 -0.18 Uncertainty Avoidance 0.36 0.63 Individualism 0.72 -0.01 Masculinity 0.03 0.30
MDS Axis

Geography of ExtraversionGeography of Extraversion
Who is Extravert?Who is Extravert?
According to the NEO-PI-R manual, extravertis sociable, assertive, talkative, and likes large groups and gatherings (Costa & McCrae, 1992).
Which nation fits best to this psychological portrait?
It is not very likely that among candidates for the most extraverted nations are any of Scandinavian countries; according to widespread stereotypes, Scandinavians are typically quiet and reserved.

Who is Extravert?Who is Extravert?
In fact, according to self-reports the most extraverted individuals live in Denmark, Norway, and Sweden (McCrae, 2002).
Thus, stereotypes do not agree with the ranking of the mean scores on personality traits.
Typical extraverts

Replication: 51 cultures (McCrae et al., 2005)Replication: 51 cultures (McCrae et al., 2005)
Extraversion
Neoroticism
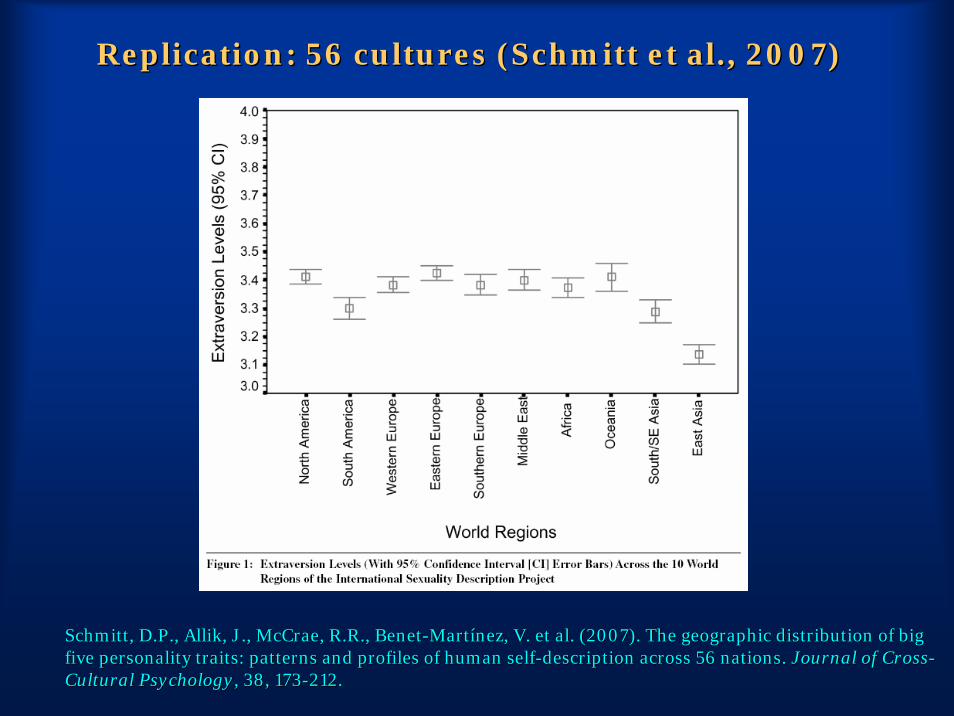
ReplicationReplication: 56 : 56 culturescultures ((SchmittSchmitt et et alal., 2007)., 2007)
Schmitt, D.P., Schmitt, D.P., AllikAllik, J., , J., McCraeMcCrae, R.R., , R.R., BenetBenet--MartMartííneznez, V. et al. , V. et al. (2007). (2007). The geographic distribution of big The geographic distribution of big five personality traits: patterns and profiles of human selffive personality traits: patterns and profiles of human self--description across 56 nationsdescription across 56 nations. . Journal of CrossJournal of Cross--Cultural PsychologyCultural Psychology, 38, 173, 38, 173--212.212.

* * ** * *

Mechanisms of geographical Mechanisms of geographical differencesdifferences
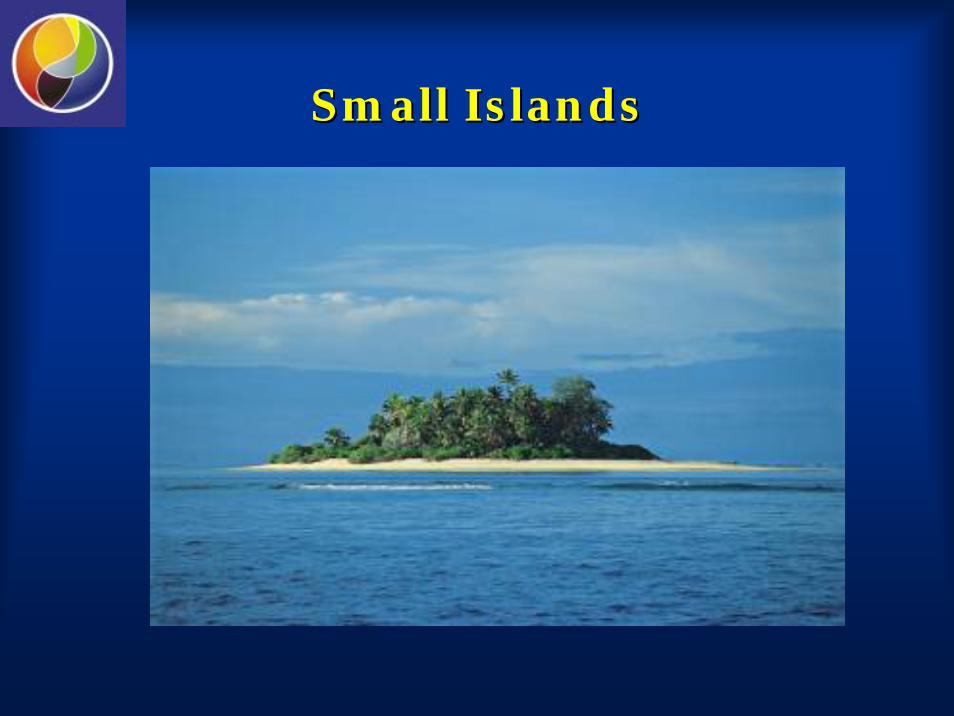
Small IslandsSmall Islands

Andrea Camperio Ciani Andrea Camperio Ciani
Universita di Padova

Andrea Camperio Ciani Andrea Camperio Ciani

Italian ArchipelagoItalian Archipelago
Giglio
Pontine
Eolie
Gaeta
Castiglione
Milazzo

Islanders Compared to MainlandersIslanders Compared to Mainlanders

Mainlanders, Immigrants ja Mainlanders, Immigrants ja Original IslandersOriginal Islanders

Emigrants vs nonemigrantsEmigrants vs nonemigrants
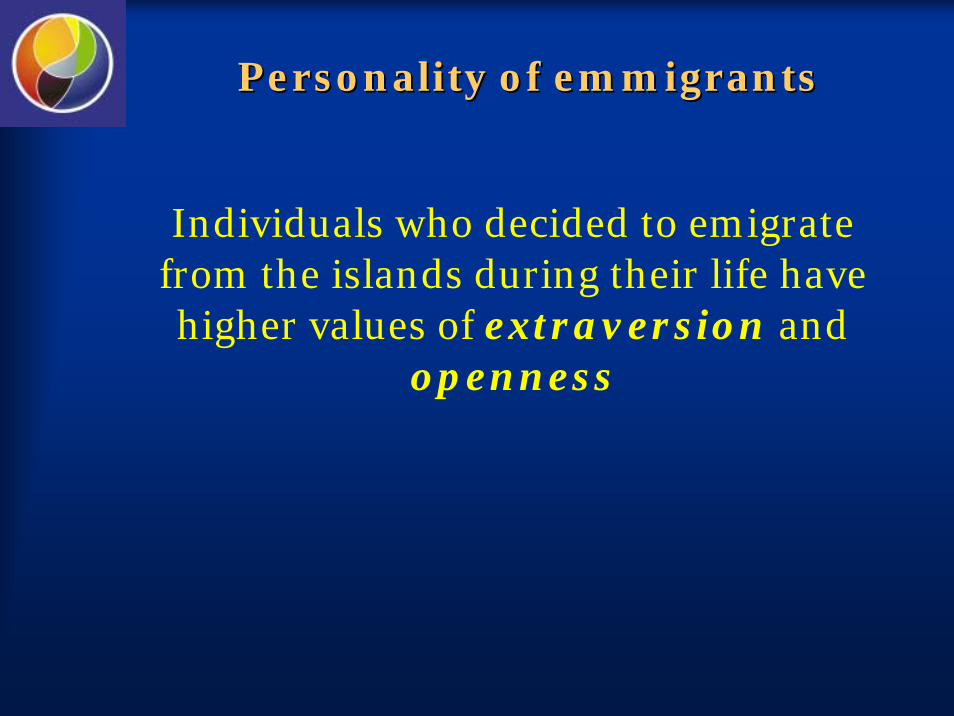
Personality of emmigrantsPersonality of emmigrants
Individuals who decided to emigrate from the islands during their life havehigher values of extraversion and
openness
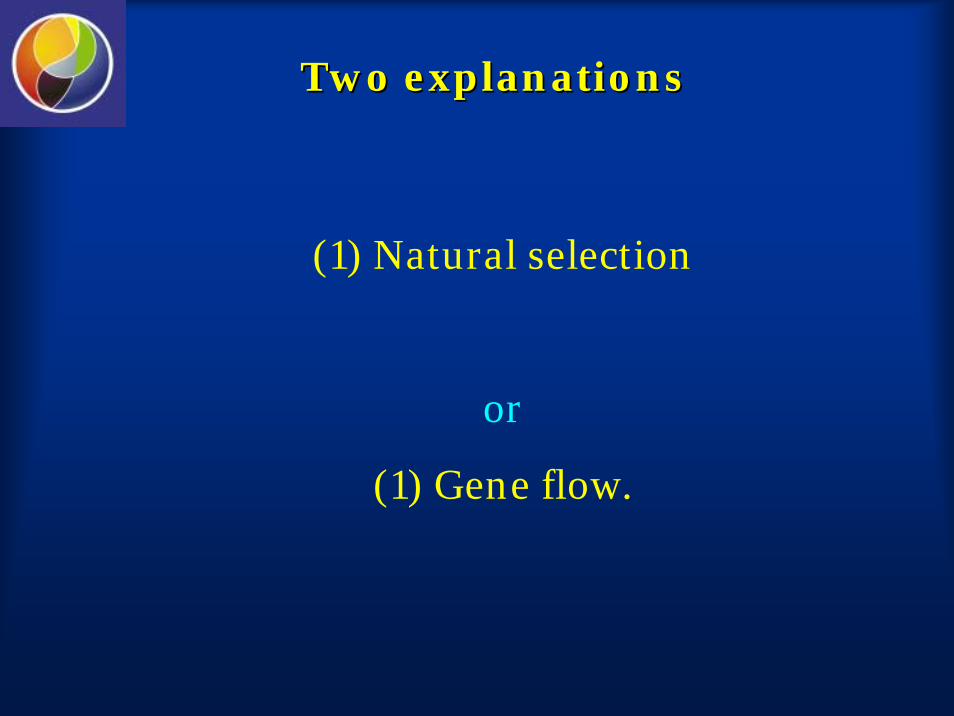
Two explanationsTwo explanations
(1) Natural selection
or
(1) Gene flow.

Gene FlowGene Flow
If emigration is strong, gene flow will rapidly drain the set of alleles influencing high extraversion and openness from the island’s gene pool.
Consequently the remaining islander population will become, on average, progressively more closed and introvert.

Gene FlowGene Flow
IslandersIslanders EmmigrantsEmmigrants
IntroveretedIntrovereted
ClosedClosed toto newnewexperiencesexperiences
ConscientiousConscientious
ExtravertedExtraverted
OpenedOpened toto newnewexperiencesexperiences

Accessibility/Accessibility/RemotnessRemotness

Greg MurrayGreg Murray
Swinburne University of Technology
Hawthorn, Australia

Accessibility/Accessibility/RemotnessRemotness

* * ** * *

NATIONAL CHARACTERNATIONAL CHARACTER
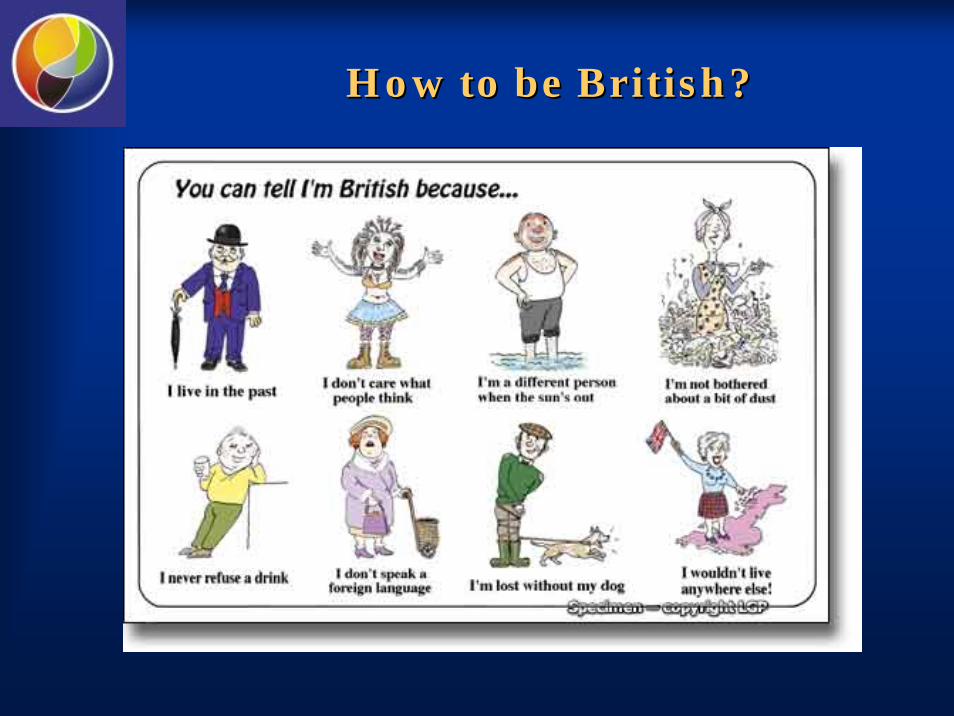
HowHow toto bebe BritishBritish??

TheThe PerfectPerfect EuropeanEuropean

DimensionsDimensions of of stereotypesstereotypes

SelfSelf--ControlControl vs vs ModernityModernity
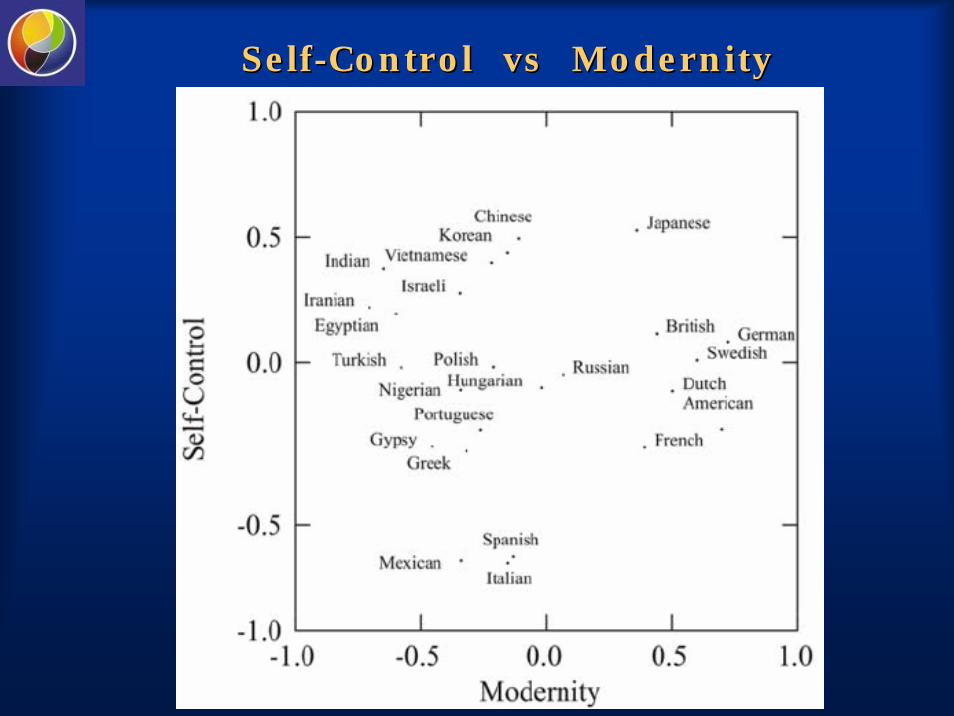
SelfSelf--ControlControl vs vs ModernityModernity

Can experts predict national Can experts predict national character?character?

Expert Opinions (1)Expert Opinions (1)
McCrae (2001) asked eight prominent cross-cultural psychologists to identify the personality factor that had been used to rank 26 cultures based on their mean NEO-PI-R scores. He asked, for example, which personality factor is lowest among Hong Kong Chinese and South Koreans, but highest among Norwegians and Americans?
Rather surprisingly, these experts all considered this a difficult task and were unable to identify factors at a better-than-chance level.

Expert Opinions (2)Expert Opinions (2)
Church and Katigbak asked 43 judges who had lived in both the Philippines and the United States for a considerable time, to compare standing of Filipinos or Americans on particular traits.
These bicultural judges were in high agreement with each another, but were not consistent with the mean NEO-PI-R profiles (Church & Katigbak, 2002).
Tim Church
Marcia KatigbakChurch, A. T., & Church, A. T., & KatigbakKatigbak, M. S. (2002). , M. S. (2002). The FiveThe Five--Factor Model in the Philippines: Factor Model in the Philippines: Investigating trait structure and levels across cultures. In R. Investigating trait structure and levels across cultures. In R. R. McCrae & J. R. McCrae & J. AllikAllik(Eds.), (Eds.), The FiveThe Five--Factor Model Factor Model of of personalitypersonality across culturesacross cultures (pp. 129(pp. 129--154). New York: 154). New York: KluwerKluwer Academic/Plenum Publishers.Academic/Plenum Publishers.

National Character and personality traitsNational Character and personality traits

Kernel of truthKernel of truth

Stereotypes vs personality traitsStereotypes vs personality traits

StereotypesStereotypesSouthern and Northern ItaliansSouthern and Northern Italians
McCrae, R.R., McCrae, R.R., TerraccianoTerracciano, A., , A., RealoRealo, A., & , A., & AllikAllik, J. (2007). Climatic warmth and national wealth: , J. (2007). Climatic warmth and national wealth: some culturesome culture--level determinants of national character stereotypes. level determinants of national character stereotypes. EuropeanEuropean JournalJournal of of PersonalityPersonality ((inin press). press).
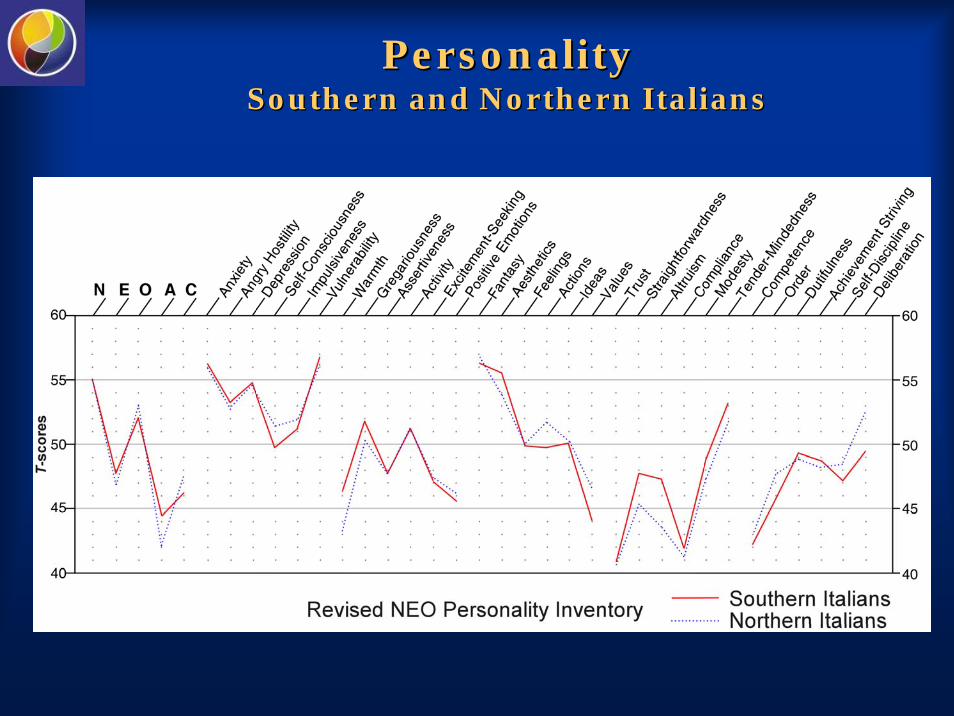
PersonalityPersonalitySouthern and Northern ItaliansSouthern and Northern Italians

Stereotypes vs PersonalityStereotypes vs PersonalitySouthern and Northern ItaliansSouthern and Northern Italians
StereotypesStereotypes PersonalityPersonality traitstraits

Are all Are all stereotypesstereotypes unfoundedunfounded??
StereotypesStereotypes aboutabout personalitypersonality of of menmenand and womenwomen are are accurateaccurate: :
•• menmen are are emotionallyemotionally moremore stablestable thanthanwomenwomen;;
•• menmen are are moremore aggressiveaggressive and dominant and dominant thanthan womenwomen;;
•• womenwomen are are moremore agreeableagreeable thanthan menmen
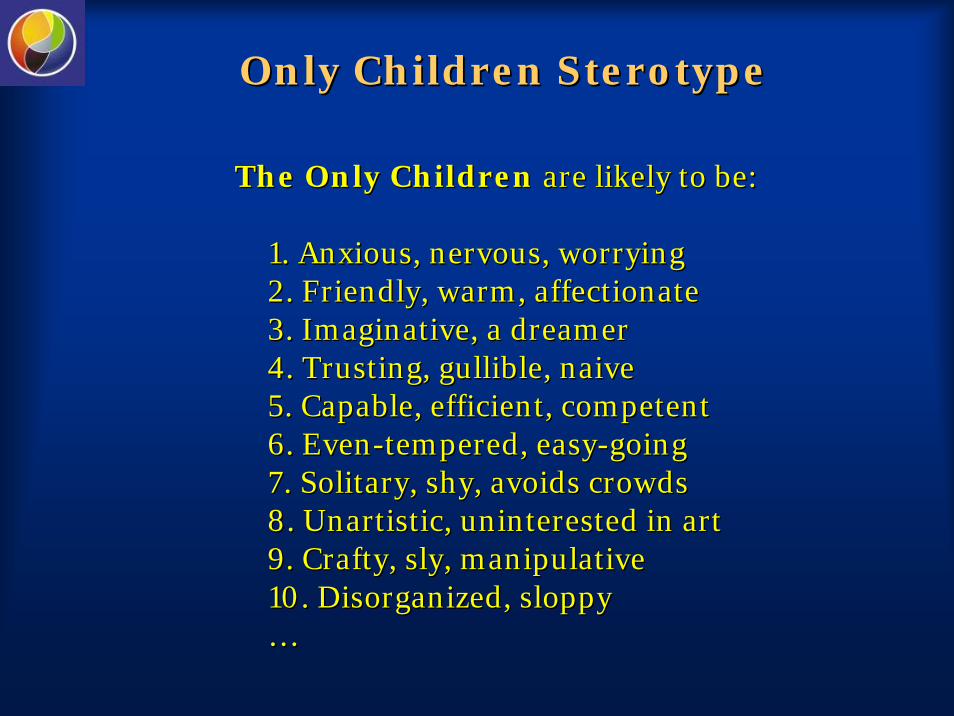
OnlyOnly ChildrenChildren SterotypeSterotype
The Only Children The Only Children are likely to be:are likely to be:
1. Anxious, nervous, worrying1. Anxious, nervous, worrying2. Friendly, warm, affectionate2. Friendly, warm, affectionate3. Imaginative, a dreamer3. Imaginative, a dreamer4. Trusting, gullible, naive4. Trusting, gullible, naive5. Capable, efficient, competent5. Capable, efficient, competent6. Even6. Even--tempered, easytempered, easy--goinggoing7. Solitary, shy, avoids crowds7. Solitary, shy, avoids crowds8. 8. UnartisticUnartistic, uninterested in art, uninterested in art9. Crafty, sly, manipulative9. Crafty, sly, manipulative10. Disorganized, sloppy10. Disorganized, sloppy……

OnlyOnly ChildChild vs vs NonNon--OnlyOnly ChildChildStereotypesStereotypes

OnlyOnly ChildChild vs vs NonNon--OnlyOnly ChildChildSelfSelf--RatedRated PersonalityPersonality

StereotypesStereotypes vs vs RealityReality
StereotypesStereotypes RealityReality
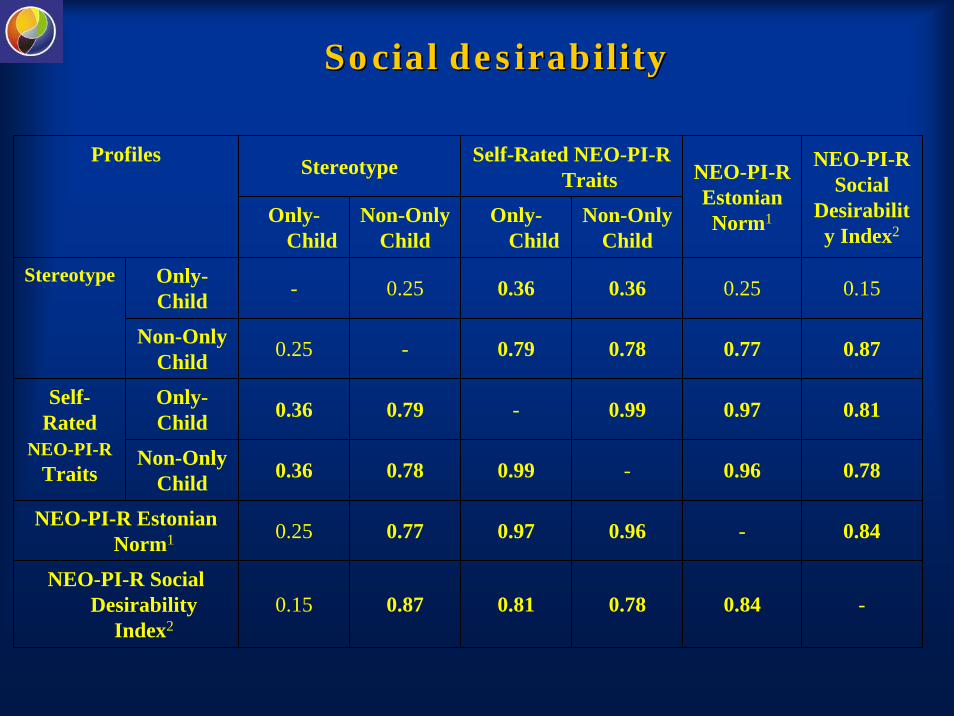
Stereotype Self-Rated NEO-PI-R Traits
Only-Child
Non-OnlyChild
Only-Child
Non-OnlyChild
Only-Child - 0.25 0.36 0.36 0.25 0.15
Non-OnlyChild 0.25 - 0.79 0.78 0.77 0.87
Only-Child 0.36 0.79 - 0.99 0.97 0.81
Non-OnlyChild 0.36 0.78 0.99 - 0.96 0.78
NEO-PI-R Estonian Norm1 0.25 0.77 0.97 0.96 - 0.84
NEO-PI-R SocialDesirability
Index20.15 0.87 0.81 0.78 0.84 -
Self-Rated
NEO-PI-RTraits
Stereotype
NEO-PI-R Estonian Norm1
NEO-PI-R Social
Desirability Index2
Profiles
SocialSocial desirabilitydesirability

Stereotype Self-Rated NEO-PI-R Traits
Only-Child
Non-OnlyChild
Only-Child
Non-OnlyChild
Only-Child - 0.25 0.36 0.36 0.25 0.15
Non-OnlyChild 0.25 - 0.79 0.78 0.77 0.87
Only-Child 0.36 0.79 - 0.99 0.97 0.81
Non-OnlyChild 0.36 0.78 0.99 - 0.96 0.78
NEO-PI-R Estonian Norm1 0.25 0.77 0.97 0.96 - 0.84
NEO-PI-R SocialDesirability Index2 0.15 0.87 0.81 0.78 0.84 -
Self-Rated
NEO-PI-RTraits
Stereotype
NEO-PI-R Estonian Norm1
NEO-PI-R Social
Desirability Index2
Profiles
SocialSocial desirabilitydesirability

StereotypeStereotype encouragesencourages toto havehave moremorechildrenchildren
ApproximatelyApproximately 40% of 40% of EstonianEstonian womenwomen inin thethe ageagefromfrom 18 18 toto 45 45 mentionedmentioned thatthat theythey wishwish toto havehave a a secondsecond childchild inin order order toto provideprovide companycompany forfor thethefirstfirst oneone. .
AmongAmong thethe singlesingle childchild parentsparents whowho plannedplanned totohavehave a a secondsecond childchild inin thethe nextnext twotwo yearsyears, , thethe samesamemotivemotive waswas mentionedmentioned byby 70.2% of 70.2% of womenwomen..
Marksoo, Marksoo, ÜÜ., Oja, U., & Kutsar, D. (., Oja, U., & Kutsar, D. (EdsEds.). (2001). .). (2001). LivingLiving conditionsconditions studystudy inin Estonia 1999: Estonia 1999:
AdditionalAdditional tablestables. Tartu: . Tartu: TartuTartu ÜÜlikooli Kirjastus.likooli Kirjastus.

* * ** * *
SEX DIFFERENCESSEX DIFFERENCES

Sex differences in personalitySex differences in personality
Sex differences in personality traits are largest in prosperous, healthy and egalitarian cultures where women have more equal opportunities with men

International Sexuality International Sexuality Description Project (ISDP)Description Project (ISDP)
Big Five Inventory (BFI) (Benet-Martínez & John, 1998)
17,837 participants
More than 100 researchers
55 countries
29 languages
6 continents
13 islandsDavid David SchmittSchmitt

Agreement between two studiesAgreement between two studies
France
Serbia
Netherlands
Estonia
Czech Italy Austria
Belgium
Sw itzerland
Spain
GermanyPeru
Canada
Turkey
CroatiaHong Kong
PhilippinesSouth Africa
Taiw an Portugal
Zimbabw e
Korea
Malaysia
India
Indonesia
0.0 0.1 0.2 0.3 0.4 0.5 0.6
Mean Level Sex Differences (Costa et al., 2005)
-0.2
-0.1
0.0
0.1
0.2
0.3
0.4
0.5
Mea
n Le
vel S
ex D
iffer
ence
s (S
chm
itt e
t al.
2006
)
Japan
United States
NEONEO--PIPI--RR
Big
Big
Fiv
eF
ive
Inv
en
tory
Inv
en
tory

France (m) France (w)
N E O A C2.6
2.8
3.0
3.2
3.4
3.6
3.8
4.0
FranceFrance BotswanaBotswana
Botswana (m) Botswana (w)
N E O A C2.6
2.8
3.0
3.2
3.4
3.6
3.8
4.0
Personality profilesPersonality profiles
Schmitt, D.P., Schmitt, D.P., RealoRealo, A., , A., VoracekVoracek, M., & , M., & AllikAllik, J. (200, J. (20077). Why Can). Why Can’’t t a Man Be More Like a a Man Be More Like a Woman? Sex Differences in Big Five Personality Traits across 55 Woman? Sex Differences in Big Five Personality Traits across 55 Cultures. Cultures. Journal of Journal of Personality and Social Psychology Personality and Social Psychology ((inin presspress).).

Correlation: r = -.50
Argentina
Austria
Bangladesh
Bolivia
Botsw ana
Brazil
CanadaChile
Congo
CroatiaCyprus
Czech
Estonia
Ethiopia
Fiji
Finland
France
Germany
Greece
India
Indonesia
Israel
Italy
Japan
Jordan
Korea
Latvia Lebanon
Lithuania
Malaysia
Malta
Mexico Morocco
Netherlands
New Zealand
Peru
PhilippinesPortugal
Romania
Slovakia
South Africa
Sw itzerland
Tanzania
Turkey
UK
Zimbabw e
-20 0 20 40 60 80 100 120 140 160 180
Human Development Index 2003 (Rank)
-0.2
-0.1
0.0
0.1
0.2
0.3
0.4
0.5
Mea
n Le
vel S
ex D
iffer
ence
s
Hong Kong
Belgium
Poland
Spain
Slovenia
AustraliaUSA
Widening gapWidening gap
More developed countries Less developed countries

When When 55 predictors explained 54% of variance in the crosspredictors explained 54% of variance in the cross--cultural sex differences in cultural sex differences in personality (personality (RR = .735; = .735; FF(4,36) = 10.57; (4,36) = 10.57; pp < .00001). < .00001).
β SE of β t(35) p Valid N
Intercept 9.46 .000
Human Development Index (Rank) -.667 .171 -3.91 .000 53
Interpersonal Trust -.428 .131 -3.26 .002 46
Sex Ratio in Smoking -.343 .124 -2.76 .009 47
Traditional/Secular-Rational -.121 .189 -0.64 .528 45
Acquiescence Bias .097 .142 0.68 .498 55
Predictors of the widening gapPredictors of the widening gap

How to explain the widening gap How to explain the widening gap between men and women in between men and women in
personality?personality?

Social role explanationSocial role explanation
IIn societies where men and women occupy n societies where men and women occupy more similar social roles disparities in their more similar social roles disparities in their personality traits increasepersonality traits increase
femalefemale rolesroles male male rolesroles

Evolutionary explanationEvolutionary explanation
The ecological or sexual selections have The ecological or sexual selections have favoredfavored one set of personality traits for men one set of personality traits for men and another slightly different set of traits for and another slightly different set of traits for women. women.
TThe existence of innate sex differences alone he existence of innate sex differences alone cannot explain the widening gap between cannot explain the widening gap between personalities of men and women with the personalities of men and women with the development of societydevelopment of society

Sexual dimorphism 1Sexual dimorphism 1
SSexualexual dimorphism is higher in rich than in dimorphism is higher in rich than in poor countries (Eveleth, 1975; Eveleth and poor countries (Eveleth, 1975; Eveleth and Tanner, 1990; Tanner, 1990; GuGuéégangan, , TeriokhinTeriokhin & Thomas, & Thomas, 2000).2000).

Sexual dimorphism 2Sexual dimorphism 2
DifferenceDifference of of systolicsystolic and and diastolicdiastolic bloodbloodpressurepressure betweenbetween meanmean and and womenwomen is higher is higher in rich than in poor countriesin rich than in poor countries

Sexual dimorphism 3Sexual dimorphism 3
There is a greater sex There is a greater sex dimorphism in resourcedimorphism in resource--rich rich environments and reduced environments and reduced dimorphism in constrained or dimorphism in constrained or high stress environmental high stress environmental conditions. conditions.
The larger of two sexes (among The larger of two sexes (among insects females are typically insects females are typically larger than males) is more larger than males) is more vulnerable to environmental vulnerable to environmental pressures (pressures (TederTeder & & TammaruTammaru, , 2005)2005)
TederTeder, T., & , T., & TammaruTammaru, T. (2005). Sexual size dimorphism within species increases wit, T. (2005). Sexual size dimorphism within species increases with body size in h body size in insects. insects. OikosOikos, , 108108, 321, 321--334.334.
TiitTiit TederTeder
ToomasToomas TammaruTammaru

Interaction explanationInteraction explanation
“Ironically, the more egalitarian a society is, the more innate factors will matter. In a world where everybody gets the same food, the heritability of height and weight will be high; in a world where some live in luxury and others starve, the heritability of weight will be low” (p. 23)
Ridley, M. (2003). The agile gene. How nature turns on nature. New York: Perennial.
Matt Matt RidleyRidley

Interaction explanationInteraction explanation
LLikeike morphological and physiological features, morphological and physiological features, personality of men is more vulnerable to personality of men is more vulnerable to restraining environmental pressure than restraining environmental pressure than women and their personality profile remains women and their personality profile remains more similar to that of women. more similar to that of women.
As society becomes more prosperous and As society becomes more prosperous and more egalitarian the natural differences have more egalitarian the natural differences have more space to develop and the gap what exists more space to develop and the gap what exists between men and women in their personality between men and women in their personality traits becomes wider.traits becomes wider.

* * ** * *

Thank you!Thank you!


