cultural diversity in the french book publishing … · françois moreau*et stéphanie peltier**...
TRANSCRIPT

French publishers’ output increased considerablythroughout the 2000s, such that questions about overpro-duction now dog the start of each new publishing season.That said, does this supposedly prolific supply actuallyresult in higher diversity of consumption, or does it, assome claim, lead to demand simply becoming morefocused on a few bestsellers and famous authors? Main-taining the diversity of creation and broadcasting was atthe heart of the French law on fixed book pricing (only adiscount of 5% on the retail price is permitted, as set bythe publisher); voted through in France in 1981, it aimedto preserve its dense and diversified network of retailers(small bookshops as well as large independents with a wideselection), which were being threatened out of existenceby discount practices2.Has this aim been achieved? Is diversity of supply and
demand radically different in small and large bookstores incomparison with that at grocery superstores and specialistsuperstores? Finally, at the start of a revolution whose mag-nitude is unprecedented since the advent of printing itself,we are confronted with the question of the impact of digi-
* Laboratoire Information, Coordination, Incitations (ICI), Université de Bretagne Occidentale; ** Laboratoire de Recherche Management, Organi-sation et Sociétés (LR-MOS), Université de La Rochelle and Groupe de Recherche Angevin en Économie et Management (Granem), Universitéd'Angers. The authors wish to thank the members of the French Ministry of Culture and Communication/DEPS steering committee, with particularthanks to Yann Nicolas, Hervé Renard and François Rouet for their insightful comments on the report on which this article is based, and to SarahMachat (LR-MOS, Université de La Rochelle) for her statistical analysis work.1. See Tristan MATTELART, Enjeux intellectuels de la diversité culturelle. Éléments de déconstruction théorique, Paris, Ministère de la Culture et dela Communication, DEPS, coll. « Culture prospective”, 2009-2, July 2009. Moreover, this cultural diversity study also includes a section on promot-ing intercultural dialogue, see Hélène HATZFELD,Vincent BILLEREY, Repères pour un dialogue interculturel, Ministère de la Culture et de la Com-munication, Secrétariat général (SCPCI/DREST), 2010, available online at www.culture.gouv.fr/ under the “Politiques ministérielles” section2. For a summary of the aims of this law, see Hervé GAYMARD, Situation du livre. Évaluation de la loi relative au prix du livre et questions prospec-tives, report for the French Ministry of Culture and Communication, March 2009. See also H. GAYMARD, Pour le livre, Paris, La DocumentationFrançaise/Gallimard, 2009.
Cultural Diversity in the French BookPublishing Industry(2003-2007)François Moreau*et Stéphanie Peltier**
Directeur de publication : Jean-François Chaintreau, chef du service de la coordination des politiques culturelles 2011-4 – octobre 2011et de l’innovation en charge du département des études, de la prospective et des statistiques.Responsable des publications : Edwige Millery
2011-4182, rue Saint-Honoré, 75033 Paris cedex 01( 01 40 15 79 17 – 4 01 40 15 79 99 Available to download from the site http://www.culturecommunication.gouv.fr
Secrétariat général
Service de lacoordination despolitiques culturelleset de l’innovation
Départementdes études,de la prospectiveet des statistiques
culture
La diversité culturelle dans l’industriedu livre en France (2003-2007)
cultureÉCONOMIE DE LA CULTURE ET DE LA COMMUNICATION
ForewordCultural diversity is now a central aim of public cultural policies, par-ticularly since adoption of the 2005 UNESCO Convention on the Pro-tection and Promotion of the Diversity of Cultural Expressions, effectiveas of 18 March 2007 after its ratification by France and the EuropeanUnion. Numerous cultural policy measures refer back to it, particularlywithin the cultural industries sectors. A largely political concern, thereare nevertheless economic aspects of cultural diversity: it relates to impor-tant issues such as competition, industrial concentration, market powerand economic efficiency, which are once again being brought to the forein the present climate by economic globalisation and the effects of thedigital revolution. Aware of the public policy issues raised by the question of diversity, theGeneral Secretariat has for the last few years included the issue in itsresearch programme1. In 2008 it launched a call for research proposalson "the assessment and processes of modifying diversity within the cul-tural industry”. Aiming to build upon all the results of socioeconomicanalysis on the subject, the call for proposals invited researchers toaddress the issue of assessing the various aspects of cultural diversity(definitions and measures) and identifying the processes by which thediversity of cultural products supplied, distributed and consumed haschanged.In examining the book publishing industry, which in France is charac-terised by its concentrated nature, and about which the issue of overpro-duction is regularly raised, this study into the evolution of diversitythroughout the 2000s attempts to address the how effective France’s lawon fixed book pricing has been in its ability to preserve the diversity ofworks and their distribution. It also confirms the validity of the so-calledlong tail theory whilst giving an updated view of it, whilst bringing newevidence about it to light.
Jean-François CHAINTREAU
études

tisation on cultural diversity. Does it prompt higher salesof best-sellers, or does it extend the life of books with lowprint runs, in accordance with Chris Anderson’s3 long tailtheory?Three aspects of cultural diversity are analysed: the
breadth of the number of books published and consumed(variety), the degree of inequality of sales across the dif-ferent titles on the market (balance), and the degree of dis-parity between the various titles sold based on an analysisof their specific properties (author, publisher)(disparity).The scope of this analysis is focused on three market seg-ments: literature, graphic novels and books for young peo-ple4,and is based on completely new analysis of monthly“cash register” sales data for books, compiled by GfK forthe period 2003-2007 (see “The Data”, p. 14).
BACKGROUND5
Changing Characteristics of the BookMarket, 2003-2007
Between 2003 and 2007, the aggregated turnover for allthree segments studied underwent relatively sustainedgrowth (up 11.5% for the whole period, i.e. an averageannual growth rate of 2.8%) (see Figure 1). However, thistrend was disrupted in 2005, with the following 2 years see-ing only 2% growth. This slowdown in turnover growththen fell into a decline before sales volumes then droppedslightly. From 193 million units in 2004, book sales withinthe three segments analysed fell to 189 million for 2007,i.e. a drop of 2%. For the period in question, the literaturecategory accounted for around half of all copies sold, booksfor young people 30% and graphic novels 20%. Sales pat-terns were fairly similar for all three segments: the earlypart of the period saw slight growth, followed by a slow-down then a slight drop toward the end of the period.Since 2007, grocery superstores (GSS) and specialist
superstores (SSS) such as Fnac or the Virgin stores eachrepresented around 27% of the volume books sold acrossthe three segments in question.The large bookshops’ market share amounted to around
24%, as compared to 17% for small bookshops, and 4%for online sales (Figure 2). Contrary to the per-segmentchanges, per-distribution channel changes over the periodwere fairly pronounced. Thus, the drop in book sales seen
3. C. ANDERSON, “The Long Tail”, Wired, October, 2004; id., The Long Tail, London, Random House, 2006.4. For the recorded music and video film markets etc., all products can be considered more or less substitutable. That is to say, they all satisfy the sameconsumer requirement, i.e. to entertain. This hypothesis is slightly more problematic when applied to books. The book market can be divided intofour segments based on two opposing factors relating to purchasing decisions (distinguishing between formally-prescribed and non-prescribed books),and reading decisions (distinguishing between reference books and other books). Analysis focuses on non-prescribed books which essentially are des-tined for reading as a hobby, mainly literature, graphic novels and books for young people. The first is interesting because whilst it only represents20% of book sales, it nevertheless remains the top market segment. The graphic novel market is a rapidly-expanding one, which also has a strongonline presence through specialist websites providing advice and information. Finally, books for young people, also a growing sector over the last fewyears, appeal partly to a readership with a very strong online culture; again, comparative analysis of their changing diversity patterns is potentiallyhighly instructive.5. As for most cultural products, there are huge seasonal variations in book sales. Sales figures for December are always two to three times higher thanthe average sales figures for all other months of the year. Within the literature segment, modern fiction has an increased seasonal variation factor asthe end of the year sees both the new publishing season and the holiday period. As a general rule, data shown is seasonally adjusted in order to makecharts easier to read and the relevant trend patterns easier to determine. Seasonal adjustment is calculated on moving averages over 12 months.
2 culture études 2011-4
Figure 1 – Pattern of Annual Book Sales for Literature, Books for Young Peopleand Graphic Novels (by value),2003-2007.
Source: DEPS, Ministry of Culture and Communication, 2011.
2004 20072005 20062003
1,600
1,550
1,500
1,650
1,850
1,800
1,750
1,700
Turnover(in €m)
Figure 2 – Pattern of Monthly Sales Distributionsper Distribution Channel (by volume)
Source: DEPS, Ministry of Culture and Communication, 2011.
Jan.2004
Jan.2005
May2004
May2005
Sept.2004
Sept.2005
Jan.2006
May2006
Sept.2006
Jan.2007
May2007
Sept.2007
Sept.2003
10
5
0
15
35
30
25
20
%
Large bookshops
Specialist superstores Small bookshops
InternetGrocery superstores
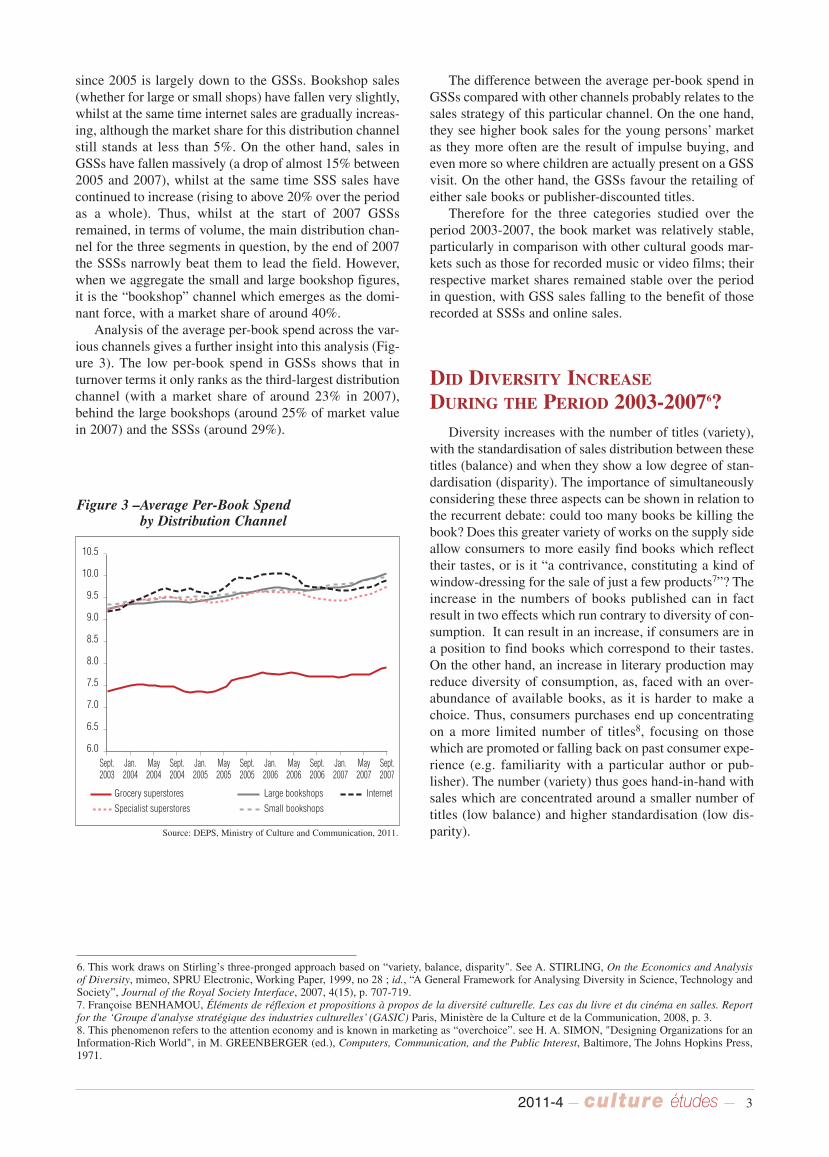
since 2005 is largely down to the GSSs. Bookshop sales(whether for large or small shops) have fallen very slightly,whilst at the same time internet sales are gradually increas-ing, although the market share for this distribution channelstill stands at less than 5%. On the other hand, sales inGSSs have fallen massively (a drop of almost 15% between2005 and 2007), whilst at the same time SSS sales havecontinued to increase (rising to above 20% over the periodas a whole). Thus, whilst at the start of 2007 GSSsremained, in terms of volume, the main distribution chan-nel for the three segments in question, by the end of 2007the SSSs narrowly beat them to lead the field. However,when we aggregate the small and large bookshop figures,it is the “bookshop” channel which emerges as the domi-nant force, with a market share of around 40%.Analysis of the average per-book spend across the var-
ious channels gives a further insight into this analysis (Fig-ure 3). The low per-book spend in GSSs shows that inturnover terms it only ranks as the third-largest distributionchannel (with a market share of around 23% in 2007),behind the large bookshops (around 25% of market valuein 2007) and the SSSs (around 29%).
The difference between the average per-book spend inGSSs compared with other channels probably relates to thesales strategy of this particular channel. On the one hand,they see higher book sales for the young persons’ marketas they more often are the result of impulse buying, andeven more so where children are actually present on a GSSvisit. On the other hand, the GSSs favour the retailing ofeither sale books or publisher-discounted titles.Therefore for the three categories studied over the
period 2003-2007, the book market was relatively stable,particularly in comparison with other cultural goods mar-kets such as those for recorded music or video films; theirrespective market shares remained stable over the periodin question, with GSS sales falling to the benefit of thoserecorded at SSSs and online sales.
DID DIVERSITY INCREASEDURING THE PERIOD 2003-20076?Diversity increases with the number of titles (variety),
with the standardisation of sales distribution between thesetitles (balance) and when they show a low degree of stan-dardisation (disparity). The importance of simultaneouslyconsidering these three aspects can be shown in relation tothe recurrent debate: could too many books be killing thebook? Does this greater variety of works on the supply sideallow consumers to more easily find books which reflecttheir tastes, or is it “a contrivance, constituting a kind ofwindow-dressing for the sale of just a few products7”? Theincrease in the numbers of books published can in factresult in two effects which run contrary to diversity of con-sumption. It can result in an increase, if consumers are ina position to find books which correspond to their tastes.On the other hand, an increase in literary production mayreduce diversity of consumption, as, faced with an over-abundance of available books, as it is harder to make achoice. Thus, consumers purchases end up concentratingon a more limited number of titles8, focusing on thosewhich are promoted or falling back on past consumer expe-rience (e.g. familiarity with a particular author or pub-lisher). The number (variety) thus goes hand-in-hand withsales which are concentrated around a smaller number oftitles (low balance) and higher standardisation (low dis-parity).
6. This work draws on Stirling’s three-pronged approach based on “variety, balance, disparity". See A. STIRLING, On the Economics and Analysisof Diversity, mimeo, SPRU Electronic, Working Paper, 1999, no 28 ; id., “A General Framework for Analysing Diversity in Science, Technology andSociety”, Journal of the Royal Society Interface, 2007, 4(15), p. 707-719.7. Françoise BENHAMOU, Éléments de réflexion et propositions à propos de la diversité culturelle. Les cas du livre et du cinéma en salles. Reportfor the ‘Groupe d'analyse stratégique des industries culturelles’ (GASIC) Paris, Ministère de la Culture et de la Communication, 2008, p. 3.8. This phenomenon refers to the attention economy and is known in marketing as “overchoice”. see H. A. SIMON, "Designing Organizations for anInformation-Rich World", in M. GREENBERGER (ed.), Computers, Communication, and the Public Interest, Baltimore, The Johns Hopkins Press,1971.
2011-4 3culture études
Figure 3 –Average Per-Book Spend by Distribution Channel
Source: DEPS, Ministry of Culture and Communication, 2011.
Jan.2004
Jan.2005
May2004
May2005
Sept.2004
Sept.2005
Jan.2006
May2006
Sept.2006
Jan.2007
May2007
Sept.2007
Sept.2003
7.5
7.0
6.5
6.0
8.0
10.5
10.0
9.5
9.0
8.5
Large bookshops
Specialist superstores Small bookshops
InternetGrocery superstores

Variety
Diversity is primarily defined by two indicators: vari-ety produced and variety consumed.
An Upward Trend in Variety of Production…
Using data supplied by GfK, the variety of productionwas estimated based on the total number of titles whosefirst week of sale occurred within a given year9. This meas-urement of variety of production is based on the implicithypothesis that, within the segments studied, a book willautomatically sell at least one copy in the week it isreleased. Excluding advance sales, which remain negligi-ble within book publishing, it is reasonable to assume thatthe date of a book’s release will correspond to the date ofits first sale.Looking at all segments combined, publisher produc-
tion showed a slight increase. The number of titles sold inthe week of first release went from 23,916 in 2003 to25,863 in 2007, i.e. an increase of roughly 8%10. Thisincrease was not stable throughout the period. After a slightfall-off between 2003 and 2004, the number of titles pro-duced continued to increase until 2006 then diminishedslightly in 2007 (falling by 1.2%11).Unsurprisingly, of the three publishing categories stud-
ied, literature accounts for the largest number of titles pub-lished. It represented 54% of books published in 2007, ascompared with 27% of books for young people and 19%for graphic novels. However it was graphic novels thatshowed the highest rise in number of titles publishedbetween 2003-2007 (up 43%). Books for young peopleshowed an increase of almost 8%, whilst literature onlygrew very slightly (up just 0.8%). Does an increase in variety produced lead to a greater
variety consumed? The GfK data certainly seems to backup this hypothesis.
…and in Variety of Consumption
Taking all categories as a whole, the number of differ-ent titles sold each month (variety consumed, or more accu-rately, purchased) shows a sustained upward trend (Table1). What is remarkable is that the increase in variety con-sumed is far higher than that for variety produced, whichonly went up by 8%. Thus, the increase in variety con-sumed is not focused on new releases but on older titles.This trend may be the result of new means of recommen-dation (e.g. blogs, forums, etc.) which encourage con-sumers to diversify their purchasing practices. It may alsobe the result of expanding online sales which allow the pur-chase of titles which are unavailable or hard to find in tra-ditional shops (books which were released some years ago,books with limited print runs, foreign literature, etc.). Theevolving variety of online consumption lends some credi-bility to this theory (see below).Looking at a breakdown by genre indicates stronger
growth in the number of different titles sold for the graphicnovel category, well ahead of that for books for young peo-ple and literature, increases for which have been slightlyslower than average. Moreover, examining the per-genre breakdown, there is
a clear correlation between patterns in variety produced andvariety consumed. This hierarchy continues in a similarvein across the different segments. The graphic novelshows the strongest growth in variety produced (up 43%)and also for variety consumed (up 67%). Books for youngpeople show the second-highest rate of growth both forvariety produced and variety consumed (up 8% and 32%respectively). Literature falls into last place for both crite-ria (0.8% growth for variety produced, and 21% for vari-ety consumed12).If we look at the first aspect, variety, diversity is indu-
bitably on the increase. There has been a rise of both newreleases and overall sales in all of the segments studied,most strikingly for graphic novels. The oft-decried over-supply of books would at least, one would have thought,
9. Unfortunately, the available GfK data does not allow us to calculate variety supplied, i.e. the number of titles available per distribution channel ata given moment.10. This increase is essentially down to the rise in books published in large format (up 18% between 2003-2007), although the number of titles releasedin paperback format fell (by 12%).11. The increase in the number of titles sold for the first time may be slightly overestimated by GfK’s method of estimating sales data.12. There is always a 20 percentage-point gap.
4 culture études 2011-4
Table 1 – Average Number of Different Titles Sold per Month, Calculated Annually (2003-2007)
Source: DEPS, Ministry of Culture and Communication, 2011.
2003 2004 2005 2006 2007 Variation 2003/2007 as a %
Literature 48,260 51,050 53,450 56,260 58,240 21Graphic Novels 11,540 13,480 15,330 17,210 19,300 67Books for young people 25,320 27,230 28,820 31,380 33,420 32
Total 85,120 91,760 97,600 104,850 110,960 30
NB: the monthly sales figures are calculated on a year’s worth of sales figures, divided by twelve to give an average monthly figure for each year in question.

encourage the purchase of a larger number of differenttitles. However, a closer look at the concept of diversityleads us to modify this assumption.
Balance
Does an increase in variety consumed (a growing num-ber of different titles sold) go hand-in-hand with a dilutionof sales over a larger number of books, or does it increasesales of already-successful titles?
An Increasingly Small Number of TitlesAccount for 50% of All Sales
What is emerging is a greater polarisation of sales overa small number of titles, across all categories. Less than5% of titles account for half of all sales (see Tables 2, 3and 4). Concentration seems to be intensifying slightly overtime13.Looking at the annual average, the proportion oftitles responsible for half of all sales fell between 2003 and2007 from 4.9% to 4.6% in the books for young people cat-egory, from 3.2% to 2.7% for graphic novels and from1.7% to 1.2% for literature. An analysis of the proportionof titles responsible for 90% of sales confirms the trend,falling for both literature and graphic novels and remain-ing relatively stable over the period in question for booksfor young people. Whichever threshold you look at (either50% of 90% of sales), concentration levels are higher forliterature and lower for books for young people, with thegraphic novel category falling somewhere in-between. And what about books with low print runs, (those
responsible for 1% of sales), which represent what istermed the tail of the distribution curve? Whichever cate-gory you look at, whilst the proportion of these titles maybe significant, it tended to fall between 2003 and 2007 (seeTables 2, 3 and 4). Conversely, an increasing proportion oftitles are responsible for 9% of sales: 37% for graphic nov-els, 36% for books for young people and 36% for litera-ture (up 3 percentage points on 2003 for all categories).Looking at the sales distribution curve, we can see a
slight increase in concentration at the top end (a smallernumber of best-sellers are responsible for half of all sales)a drop in the middle (a higher proportion of titles accountfor 9% of sales) and a broadening of the tail (a lower -butstill significant- proportion of erratically-selling titlesaccount for the remaining percentage of sales14).However, the slight decline in the proportion of titles
which account for a given percentage of sales does not nec-essarily represent increasing sales for all best-sellers. Infact, due to the increasing number of different titles soldover the period, this could conceal an increase in the num-ber of titles jointly responsible for this proportion of salesand therefore ultimately a reduction in per-title sales.
A Falling Market Share for Bestsellers (those selling over 1,000 copies per month)
We can divide books into three groups, based on theirmonthly sales: low-selling titles (selling fewer than 100copies per month); average-selling titles (selling between100 and 1,000 copies per month) and high-selling titles(selling over 1,000 copies per month) (see Figure 4). Atrend towards diluted sales emerges. The market share for
13. When interpreting these trends, it should be borne in mind that, particularly in the books for young people category, monthly moving average fig-ures are quite sensitive to the possible release during the year in question of a best-seller, e.g. the Harry Potter series.14. An increase in the sample size during the period contributes to an increase in the number of low-selling titles included (see “Data”, p.14). Althoughthis may lead to an overestimation of the increased concentration of titles at the top of the distribution curve, it on the other hand underestimates thebroadening effect on the tail.
2011-4 5culture études
Table 2 – Graphic Novels: Market Share of Titles and Sales
Source: DEPS, Ministry of Culture and Communication, 2011.
Combined market 2003 2004 2005 2006 2007share…
50% of sales 3 3 3 3 340% of sales 22 21 20 20 209% of sales 34 34 34 36 371% of sales 41 42 43 41 40
Total 100 100 100 100 100
Table 3 – Books for young people: Market Share of Titles and Sales
Source: DEPS, Ministry of Culture and Communication, 2011.
Combined market 2003 2004 2005 2006 2007share…
50% of sales 5 5 4 5 540% of sales 25 25 24 24 259% of sales 33 33 34 34 361% of sales 37 36 38 36 35
Total 100 100 100 100 100
Table 4 – Literature: Market Share of Titles and Sales
Source: DEPS, Ministry of Culture and Communication, 2011.
Combined market 2003 2004 2005 2006 2007share…
50% of sales 2 2 1 1 140% of sales 15 15 14 14 149% of sales 33 33 34 35 361% of sales 50 50 51 50 49
Total 100 100 100 100 100
as a %)
as a %)
as a %)

low-selling titles increased by around 4.5 percentagepoints, going from 75% of titles sold in 2003 to almost80% in 2007. This rise is at the expense of average-sellingtitles which account for only 18% of titles sold in 2007,compared with 21% in 2003. The proportion of high-sell-ers deteriorated very slightly, falling from 3.3% of titlessold monthly, to 2.5% between 2003 and 2007 (i.e. 0.8 ofa percentage point).
Increasing Preponderance of NarrowReadership Titles (selling between 5 and 50copies per month)
An increase in sales of low-selling titles seems tolargely benefit titles with a limited readership (sellingbetween 5 and 50 copies per month). On average, theirmarket share has gone from 34% to 39% of titles soldmonthly, i.e. a 5 percentage point increase over five years.On the other hand, neither the position of so-called “nar-row readership” titles (selling less than 5 copies per month)nor that of low-distribution titles (selling between 50 and100 copies per month) have changed significantly. The per-centage of titles selling less than 5 copies per month wentup between 2003 and 2005, before in 2007 falling back tothe level previously recorded at the start of the period (i.e.31%). On the other hand, the preponderance of titles sell-ing between 50 and 100 copies per month only fell veryslightly over the period (9.7% of titles in 2007, comparedwith 10.4% in 2003).
Titles Selling Over 10,000 copies per MonthRemain Stable
Only a very small number of books sell in very high numbersIn 2007, 2.5% of titles (2,767 titles) sold over 1,000
copies per month, 0.28% sold over 5,000 copies and only0.08% exceeded sales of 10,000 copies per month. Thisconcentration on a few star titles shows a diminishing trend(see Figure 5). The concentration of sales on a smallernumber of titles shrank between 2003 and 2007, in favourof better sellers (selling over 1,000 copies per month) andbestsellers (between 5,000 and 10,000 copies). However,when looking at the number of titles sold, those titles sell-ing over 5,000 copies per month are up slightly over theperiod in question (around 300), whilst those selling over10,000 copies per month remained stable overall (around90).Nevertheless, the previously-observed fact that a falling
number of titles account for half of all sales does not trans-late into an increase in the sales of a few best-sellers, butrather goes in tandem with a stable, if not slightly higher,number of high-selling titles. Is this result borne out for thesuper best-seller too?
The Increasing Preponderance of the Top 10
An analysis of the top 1,000 and top 100's share of totalsales, and the top 10’s share of the top 100 completes ouranalysis of variety consumed. Looking at the first two, theconcentration of demand around the better sellers is con-siderably higher for the graphic novel category, followedby books for young people and then literature. In 2007, thetop 1,000 accounted for almost two thirds of graphic novelsales (63%), over half of literature sales (55%) but only42% of books for young people. The 100 best-sellingbooks for young people accounted for 14% of sales, whichis almost half the figure for graphic novels or literature(26% and 22% of sales respectively). However, the top
6 culture études 2011-4
Figure 4 - Distribution of Titles by Sales Level(annual average calculated from monthly data)
Source: DEPS, Ministry of Culture and Communication, 2011.
2004
– 0.8– 3.5+ 4.4
20072005 200620030
20
100
80
60
40
%
Fewer than 100 copies sold each month
Between 100 and 1,000 copies sold per month
Over 1,000 copies sold per month
2003/2007Variation
(percentage points)
Figure 5 – Proportion of Monthly High-SellingTitles (annual average)
Source: DEPS, Ministry of Culture and Communication, 2011.
2004 2003/2007Variation
(percentage points)
– 0.04– 0.04– 0.77
20072005 200620030
1.5
1.0
0.5
3.5
3.0
2.5
2.0
%
Between 1,000 and 5,000 copies sold per month
Between 5,000 and 10,000 copies sold per month
Over 10,000 copies sold per month

10’s share of the top 100 is slightly higher in the books foryoung people category than it is in literature (34% com-pared with 31%). The consumption of books for youngpeople seems more influenced by peer group preferenceswhen it comes to runaway best sellers. Young people wouldseem to be more likely to buy books which everyone istalking about, influenced by huge marketing and advertis-ing campaigns or following peer-group recommendations.For the literature category, whichever best-seller lists
you look at, there is a slight trend towards an increase inbest-sellers and more particularly, the super best-seller. Ina top 100 which accounted for an average of over 20% oftotal sales for the year 2003, rising to 22% in 2007, theshare of the ten best-sellers increased by 3 percentagepoints, and attracted 31% of sales in 2007, as comparedwith 28% in 2003. Conversely, there was a marked trendtoward dilution of sales within the graphic novels category.Nevertheless, this seemed to have less impact on the run-away successes of the genre than those classified as bettersellers. Although the Top 1,000 dropped by 7 percentagepoints over the period (from an annual average of 70% to63% of total sales between 2003 and 2007), and the top100 fell from 31% to 26%, the preponderance of the top10 within the top 100 remained relatively stable at around38%. The decline of the best-sellers therefore seems tohave had little impact on the superstars of the graphic novelworld such as Titeuf and Astérix etc. For the books foryoung people category, the preponderance of the top 1,000also fell between 2003 and 2007, although this drop is lessmarked than that in the graphic novel category (from anannual average of 46% to 42%). This decline is far less pro-nounced for the top 100 best-sellers, and in no way threat-ens the position of the super best-sellers. Between 2003and 2007, the top 10’s share of the top 100 gained 4 per-centage points (from 30% to 34%).Looking at the market as a whole, the distribution curve
drops in the middle (as the share of titles selling between100 and 1,000 copies per month fell), to the benefit of abroadening of the tail (the relative number of titles sellingbetween 5 and 50 copies per month increased by 5 per-centage points). On the other hand, the market share of nar-row readership titles (selling fewer than 5 per month)remains stable, if not falling slightly, except in the graphicnovel category15. However, (taking into account theincreasing numbers of titles sold) this lengthening andbroadening of the tail go hand-in-hand with an increase atthe top of the distribution curve. The proportion of titlesaccounting for half of all sales shows a diminishing trend
across all segments and the preponderance of the top 10titles within the top 100 shows an increasing trend, exceptin the graphic novel category.
Disparity
With variety and balance at a constant, diversity canincrease where works consumed show an increasing dis-parity. Conversely, an increase in variety and a more bal-anced distribution of sales can go hand-in-hand withgreater standardisation of works. Working on semi-exhaus-tive sales data, it has been an impossible task to make ameaningful analysis and comparison of book content.However, three types of criteria were used to –partially-chart changes in disparity:– the turnover rate for the top-selling chart titles, whichshows whether the same books monopolise the charts forlong periods, or whether on the contrary, the content ofthe best-seller lists sees rapid turnover;
– an analysis of author diversity, based on the literature cat-egory;
– a study of the publishers offering an insight into thechanging situation of independent publishers during theperiod in question and their position on online sales inrelation to other channels. A stronger sales position onthe part of independent publishers during the periodcould be an indicator of greater diversity.
Turnover Shows a Downward Trend at the Top of the Charts
Do the titles in the bestseller charts stay the same fromone month to the next or are consumers less and less faith-ful to the same bestselling works? The possible decline ofbestsellers could be related to high turnover within the top100, and not just to a reduction of their preponderancewithin overall sales or a reduction in the number sold. Forbestsellers, the indicators used suggest a smaller disparitybetween titles. When faced with what is often seen as anover-abundant choice, consumers limit their risk by stick-ing with better known works which generally stay in thetop of the charts for longer, or at least, for a less short periodof time. Improving disparity should also translate into anincrease in the top 100 chart turnover rate and a higher per-centage of new chart entries each month. We can see asteady fall in the turnover rate for graphic novels (down 4.5percentage points between 2003 and 2007), a slight decline
15. It is also the case that this category shows the greatest increase in which the number of different titles sold.
2011-4 7culture études
Table 5 – Average Share of the Top 100 and Top 1,000 and Top 10/Top 100 (by volume)
Source: DEPS, Ministry of Culture and Communication, 2011.
2003 2004 2005 2006 2007 Variation 2003/2007 (in percentage points)
Top 100 38.75 38.33 40.08 38.75 38.00 – 0.75Top 1,000 82.08 83.08 83.00 82.08 81.58 – 0.50Top10/top100 28.27 28.51 32.32 30.65 31.95 3.68
as a %)

for literature since 2004 (down 2.5 points) and a relativelysteady rate for books for young people since 2005, afterwhich date on average there have been 39 new entries intothe top 100 each month.None of this constitutes proof of an increase in diver-
sity within the top 100 bestsellers. On the contrary, a lowerturnover rate indicates that it is harder for new works tomake it into the top 100, but once there, a title is more likelyto stay there. The consumers who this affects are not there-fore more fickle but are rather increasingly loyal to asmaller number of works.
An Increasing Number of Authors Offset by the “Superstar” Effect
We assume that disparity also increases when the titlesconsumed are written by an growing number of authors andwhen demand is less concentrated on a few 'superstar’works, thereby leaving a larger proportion of sales to hith-erto-unknown authors. It is clear that literary works16 arenow the product of a larger number of authors: on average,18,200 authors sold one literary work per month in 2007,compared with 14,600 in 2003.Does the existence of a larger number of authors also
go hand-in-hand with a more balanced distribution of salesbetween them? The most striking aspect of this is thehighly unequal nature of literary sales, which is even moreobvious amongst authors than it is titles. In 2007, 15% oftitles and only 5% of authors were responsible for 90% ofsales. 50% of titles but 64% of authors accounted for 1%of sales. Moreover, this trend towards concentration inten-sified between 2003 and 2007, a sign of how powerful theself-perpetuating nature of fame is within the publishingsector,The market share of the top 1,000 and top 100 best-
selling authors increased between 2003 and 2005, thendiminished, settling at the level it started at at the begin-ning of the period. On the other hand, a reverse trend isseen within the top 100, where the top 10 authors areresponsible for an increasingly large share of sales: the ten‘superstars’ were responsible for around 32% of top 100sales in 2007, compared with 28% in 2003, i.e. a 4 per-centage point increase.
A Growing Role for Small Publishers
The French publishing industry is an oligopoly with acompetitive fringe. Several ruling houses divide up thelion’s share of the market, a few lesser companies trailbehind them taking care of most of the rest, with a stringof small publishers sharing the remaining crumbs. Look-ing at monthly averages, for 2007 Hachette and Editisalone represented 37% of the market for books for young
people and 52% of that for literature. For graphic novels,the Media Participation group and the publisher Glénataccounted for 51% of sales. A handful of lesser publishersfollow these market leaders, although the tenth-largest pub-lisher accounts for no more than 1% of sales, whether forliterature, graphic novels and books for young people.The typical view of the market is that, in the cultural
industries, the product supplied by those companies whichmonopolise the market is qualitatively different to that putout by the competitive fringe. The former tend to targetmainstream culture17, publishing for instance famousauthors originally discovered by the smaller publishers onthe competitive fringe, with the latter investing more oftenin niche markets such as poetry. This rather caricaturedview does however have some basis in reality. When FredVargas, the successful detective fiction author, said that shehad always remained loyal to her first publishing houseViviane Hamy, the implication was that this was an unusualstate of affairs. “If authors abandon those who first putthem on the road to success, they cannot complain aboutthe increasing concentration of the publishing market andthe disappearance of independent publishing houses18."Analysing the changing population of the publishing
industry and the concentration of sales per publisher com-pletes the analysis of the diversity within the publishingindustry. An increasing number of active publishers tendsto lead to an increased disparity, whilst a trend towards amarket concentrated on a smaller number of publishersworks the opposite way. Looking at monthly averages for2007, 1,800 publishers featured in the literature category(up 29% compared with 2003), 670 in books for youngpeople (up 52%) and 457 in graphic novels (up 41%). Agrowing number of publishers leads to a certain decon-centration in publishing activity. According to the criteria used by the European compe-
tition authorities, a sector with a Herfindhal-Hirschmanindex19 score of over 2,000 is considered highly concen-trated, those scoring between 1,000 and 2,000 averagelyconcentrated and those below 1,000 of low concentration.From this point of view, all three segments of the publish-ing industry should, for 2007, be considered to be of aver-age concentration (Figure 6). The most significant dropconcerns the graphic novel market, which averaged an HHIscore of above 2,000 until mid-2005 and which by mid-2007 was about level with that for literature at around1,700, the level of concentration for the latter having onlydropped very slightly over the period. The books for youngpeople category show the lowest concentration of publish-ers.This fall in the HHI score, which is entirely relative
within literature, could nevertheless be down to entirelydifference forces. Is it due to an increase in the very smallpublishers on the competitive fringe, a growth in the aver-
16. This analysis could only be conducted for the 'literature’ category (see “Aspects of Methodology", p.15).17. Frédéric MARTEL, Mainstream. Enquête sur cette culture qui plaît à tout le monde, Paris, Flammarion, 2010.18. Interview in Télérama, 9 Fenruary 2008, no 3030.19. The Herfindhal-Hirschmann Index (HHI) is calculated by squaring market shares, and then adding together the resulting numbers It is given avalue between 0 (situation in which no title has a significant market share) and 10,000 (situation in which a single title monopolises the entire mar-ket).
8 culture études 2011-4

age publishers to the detriment of the dominant publishers,or conversely to a straightforward change of roles betweenthe large and average publishers? By looking at the over-all market share for the top four and top ten companies foreach segment, we can attempt to address these issues.
The patterns for each vary somewhat from one categoryto another (see Table 6). For literature, the hierarchy haschanged little. The market share for the four largest groups(Hachette, Editis, Gallimard, Flammarion) and the tenlargest groups20 has fallen slightly, but not by any signifi-cant margin. In the ‘books for young people’ category adiminishing market share for the top four groups21 worksalmost exclusively in favour of the larger publishers on thecompetitive fringe22. On the other hand, with graphic nov-els we see a fall in the overall market share for the both thetop four publishers and the top ten, with this diminishingshare23 benefiting all fringe publishers.
This crumbling oligopoly benefits independent pub-lishers of graphic novels such as l'Association, Clair deLune, etc., whilst it essentially works in favour of the pub-lishers of books for young people, the largest on the com-petitive fringe. In the literature category on the other hand,small and medium-sized publishers do not appear to be ina position to challenge the market leaders. In this area,which is the most concentrated of those analysed, the mar-
ket share for the top four (Hachette, Editis, Gallimard andFlammarion) remains stable overall at around 76% for theperiod in question.
Summary
Although the number of different titled purchased grewslightly over the period, a sign of the increasing variety pro-duced (the number of new releases on the market), thisdoes not necessarily mean that there is an increase in diver-sity. In terms of balance, the status of the super best sell-ers does not seem to be diminishing at all, or does so verylittle, with the top 10’s share of the top 100 sales seemingto actually increase. This transfer of demand affects salesof less successful titles. Thus, the preponderance of the top100 and top 1,000 within sales as a whole shows a down-ward trend. The effect is twofold: we see an increase at thetop of the sales distribution curve alongside an increase(albeit limited) in the sales of narrow readership works.
The changing pattern of the third aspect, disparity,shows some sharp contrasts across genres. In the literaturecategory, although there is an increasing number of authors,sales tend to be focused on a decreasing number of them.Moreover there is a low turnover rate for successfulauthors, a sign of poor disparity. The bestsellers show thelowest turnover rate, emphasising that the same titles tendto linger ever longer in the monthly bestseller lists. Finally,for literature, the dominance of the big four (Hachette, Edi-tis, Gallimard and Flammarion) goes unchallenged. On theother hand, for books for young people and graphic nov-els, the main publishers’ share of overall sales is continu-ally falling to the benefit of smaller publishers. This couldbe taken as an indicator of diminishing standardisation,inasmuch as the nature of the publishers (whether the biggroups or small publishers) can have an impact on the con-tent put out (mainstream versus niche products).
KEY ISSUES
This study brings new and complementary responses tothe usual questions about the publishing industry, namelythe effect of fixed book pricing24, and how the internet isaffecting the distribution of book sales in France25.
20. In addition to the big four which dominated the period, the top 10 for 2007 also included La Martinière-Le Seuil, Albin Michel, Actes Sud, Rivages,Michel Lafon, Libella.21. For the youth category, the top four publishing groups for the period were Hachette, Editis, Gallimard and Bayard.22. In 2007, Média Participations took fifth place, followed by L'École des loisirs, Flammarion, Albin Michel, Lito and Piccolia.23. In 2007, these groups were Media Participation, Glénat, Delcourt/Tonkam et Flammarion. The fifth to tenth largest were Éditions du Soleil, Hachette,Editis, Panini, Bamboo and Albert René.24. See F ROUET, le Livre. Mutations d'une industrie culturelle, Paris, La Documentation Française, 2007 ; H. GAYMARD, Situation du livre..., op.cit.; J. PERONA and J. POUYET, Prix unique du livre à l'heure du numérique, Paris, Éditions Rue d'Ulm, “Opuscules du Cepremap” collection, 2010,no 19.25. P.-J. BENGHOZI and F. BENHAMOU, Longue traîne : levier numérique de la diversité culturelle?, Paris, Ministère de la Culture et de la Com-munication, DEPS, “Culture prospective” collection, 2008-1; D. BOUNIE, B. EANG and P. WAELBROECK, “Marché internet et réseaux physiques:comparaison des ventes de livres en France”, Revue d'économie politique, 2010, no 120, p. 141-162; S. PELTIER and F. MOREAU, "Internet and the'Long Tail' vs Superstar effect debate: Evidence from the French Book Market", Applied Economic Letters, 2012, 19(8) : 711-715.
2011-4 9culture études
Figure 6 – HHI Concentration Index for Per-Publisher Sales by Volume,with Breakdown by Category Type
Source: DEPS, Ministry of Culture and Communication, 2011.
Jan.2004
Jan.2005
May2004
May2005
Sept.2004
Sept.2005
Jan.2006
May2006
Sept.2006
Jan.2007
May2007
Sept.2007
Sept.2003
0
500
2,500
2,000
1,500
1,000
Graphic Novels Books for Young PeopleLiterature

Does Fixed Book Pricing Favour Cultural Diversity?
Unlike the music industry, in which the absence of anyfixed pricing regulations certainly contributed, along withthe early 80s sales crisis, to the decline of the independentrecord store even before the emergence of new technolo-gies, it is clear that the French Law of 10 August 1981helped maintain a dense and diversified network of book-shops. Indeed, at the end of 2007, the grocery superstores(GSS) and specialist superstores (SSS) only accounted for55% of books sold, compared with 85% of all recordedmusic sales. Small and large bookstores continue to be thelargest sales channel for literary works, books for youngpeople and graphic novels: accounting for 41% of sales byvolume compared with 27% for the grocery superstoresand the specialist superstores. The extent of this distribu-tion network means that the diversity produced, and morebroadly supplied, “is done so in all areas of the country andat the same price, eliminating the costs of searching for thebest prices, and reducing the unavoidable distribution costswhich one encounters in those countries more sparselypopulated by retail outlets26”. In bookshops, the variety oftitles consumed has continued to grow even though theyposition themselves behind the specialist superstores andthe internet in terms of the number of different titles con-sumed.
Bookshops: Fewer Titles than the SpecialistSuperstores or the Internet...
The specialist superstores sell a higher number of dif-ferent titles (Table 7), as they are supposedly better stockedthan the other sales channels. In 2007 for instance, they soldalmost 84,000 different titles each month, with their vari-ety consumed 2.5 times higher than that of the grocerysuperstores, 2.3 times higher than small bookshops and only1.4 and 1.2 times higher than large bookshops and the inter-net respectively. The GSS emerges as a retailer of limitedvariety, focusing more on books with higher print runs. Withthe exception of the internet, large bookshops are the chan-nel with the strongest recorded growth (up 45% between2003 and 200727).
...but with a Higher Proportion of Narrow Readership Titles
An analysis of the relative balance of sales distributionacross small and large bookshops on the one hand, and allother channels on the other, is potentially biased by thenumber of titles available from each and their sales vol-ume. It seems more appropriate to examine the marketshare through a fixed proportion of titles.The market share of the 1% of the bestselling titles
tends to be lower in small bookshops than in the GSSs, but
26. F. BENHAMOU, S. PELTIER, "La diversité culturelle et le livre”, in H. GAYMARD, Situation du livre..., op. cit., Annexe7, p. 344-348. www.cul-ture.gouv.fr/culture/actualites/rapports/rapport_gaymard.pdf27. As far as the larger bookshops are concerned, as well as the smaller ones, some of this increase could be explained by GfK's data calculation meth-ods, and more specifically by the ongoing inclusion in the panel of an increasingly large number of bookshops offering specific titles compared withthose more recently surveyed
10 culture études 2011-4
Table 7 – Average Number of Different Titles Sold per Month, Breakdown by Year and by Channel (2003-2007)
Source: DEPS, Ministry of Culture and Communication, 2011.
2003 2004 2005 2006 2007 2003-2007 change(as a %)
Large bookshops 43,130 49,090 52,670 58,310 62,530 45Small bookshops 29,300 31,710 32,310 32,470 36,110 23Specialist superstore 73,110 76,380 78,590 82,630 83,670 14Grocery superstore 26,980 29,860 30,600 33,020 33,540 24Internet 28,640 40,660 52,720 60,290 69,760 143
Table 6 – Publishers’ Market Share, per Segment (average based on monthly market share figures)
Source: DEPS, Ministry of Culture and Communication, 2011.
2003 2004 2005 2006 2007
Literature Overall market share for the top four publishers (CR4) 77 77 78 76 76Overall market share for the following six publishers (CR10 - CR4) 12 12 12 13 12Overall market share for all other publishers (100 - CR10) 11 11 10 11 12
Graphic Novels Overall market share for the top four publishers (CR4) 76 76 73 70 69Overall market share for the following six publishers (CR10 - CR4) 18 18 20 23 22Overall market share for all other publishers (100 - CR10) 6 6 7 7 9
Books for Young Overall market share for the top four publishers (CR4) 66 65 65 64 62People Overall market share for the following six publishers (CR10 - CR4) 22 22 23 24 25
Overall market share for all other publishers (100 - CR10) 12 13 12 12 13
as a %)
higher than in the larger bookshops and particularly highertha in the SSSs. The concentration of sales on a smallernumber of titles is also seen in the small and large book-shops. However, this trend for the bestsellers to dominatewhich exceeds that of the SSSs is counterpointed in book-shops by a better performance for low-distribution titles.In fact, the market share for the median title (i.e. the titlewhich separates a sample group into two equal sub-groups)is higher in small bookshops, and to a lesser extent in largebookshops, than it is in the SSSs and the GSSs.Small and large bookshops have one particular distin-
guishing feature: they combine sales of bestsellers (thosetitles which bookshops say “sell themselves”) with sales offar more limited readership titles which manage to achievea higher market share in bookshops than they do in SSSs.These titles stand out more easily here as they are less sub-merged by the increasingly huge choice.Similarly, substituting competitive pricing with com-
petitive quality seems to have played a role in upholdingdiversity. Whatever the category, of all the traditional saleschannels, it is the small and large bookshops which alwaysdedicate more space for small publishing houses.Furthermore, in the literature category, the preponder-
ance of the ten best-selling authors is smaller in the largeand small bookshops than it is in the other channels In2007, the top ten authors accounted for 33% of top 100sales in the SSSs, compared with 31% and 27% for smalland large bookshops respectively. The advisory role ofbookshops therefore seems vital in encouraging the pur-chase of first works and lesser-known authors.This comparative exercise is limited by the impossibil-
ity of conducting a counterfactual analysis, i.e. one whichwould compare these changes with those which might havetaken place within a different legislative context. As such,this analysis allows us to suggest that the law may havehelped to preserve diversity somewhat, in the sense ofmaintaining pluralism within publishing and distributionsources and protecting more challenging books.
Do Online Sales Represent a LeverageEffect for Cultural Diversity ?
Internet sales of literature, graphic novels and books foryoung people (excluding digital books), while growing rap-idly, still represented less than 4% in 2007 (precisely 3.6% in volume and 3.7 % in value). Although the place ofthe Internet is still modest, might we anticipate that thegrowth of online sales will have a significant impact on cul-tural diversity?
The Internet: A Positive Impact on Variety Consumed
First and foremost, the Internet plays a significant rolein the increasing variety consumed over the period (anaverage of 69,760 different titles sold monthly in 2007, rep-resenting 41,000 more titles than in 2003). The Internetnow represents the second distribution channel in terms ofthis criterion, behind SSS (83,670 different titles soldmonthly in 2007 but only 10,500 titles more than in 2003).Variety consumed on the Internet therefore represents morethan 80% of variety consumed in GSS28. Of course thescale of the increase in variety consumed on the Internetcan be explained in part by rising online sales29 and by theinclusion in the panel of new online trading sites during theperiod (Fnac.com, Alapage). However, since the end of2004, when Fnac.com entered the panel, the rise has beensustained.How far has the Internet contributed to the growth in
variety consumed overall? Though it is difficult to answerthis question with any accuracy, some avenues of approachdeserve consideration. In aggregate terms, the number oftitles sold increased by 25,800 between 2003 and 2007.Over the same period, there has been an increase of only10,600 titles in the SSS, the distribution channel whichreceives most traffic. It is therefore probable that the 15,000or so new titles sold which do not pass through the SSS areat least partly a consequence of the rise in Internet sales.Titles sold on the Internet have in fact seen a rise of morethan 40,100. No doubt a significant proportion of theseconstitute a sub-set of the titles sold in SSS, but certainlynot all 30, particularly since, if the growth in the number ofonline sellers in these years has obviously resulted in a risein the number of different titles sold on the Internet, con-versely the SSS are often criticised for having contractedtheir range over the same period. Further, if in 2003 only14 % of the different titles sold had not been bought at leastonce in SSS31, this had climbed to 26% by 2007.
28. All the more so since while consumers can access the entire online offer no matter where they live, the same is not true for the physical supply intraditional channels, which is limited to the shops in their near vicinity.29. On the Internet, the increase in variety consumed has also been encouraged by the rising popularity of this sales channel over the period. Accord-ing to the TNS/Sofres consumer panel, only 5.7% of the population aged 15+ had bought a book on the Internet in 2003, but this rate had climbed to16% by 2007.30. We might imagine that the steep rise in different titles sold on the Internet is simply due to a sharp increase in the sales of literature titles in theoriginal language, but this appears not to be the case. While the average number of titles sold monthly on the Internet rose by an average of 18, 900between 2003 and 2007, the number of titles in the original language sold in this channel has grown by only 1,600, barely 9%.31. On average each month, 85,100 different titles were purchased at least once in 2003, but through the SSS channel alone this figure was only 73100, or just 86%. In other words, in each month of 2003, on average14% of the titles sold at least once registered no sales in SSS.
2011-4 11culture études

12 culture études 2011-4
demonstrate a strengthening of the position of best-sellersin parallel with the development of a long tail. The analy-sis of best-seller charts, and thus of super-best-sellers, con-firms these results. The proportion of the top 10 in the top100 is higher on the Internet than in the other circuits forthe literature category and books for young people, and thesame or even lower for graphic novels. Additionally, overthe different segments, the weight of super-best-sellerstends to strengthen on the Internet as compared with otherchannels (figure 7). It appears that, with the democratisa-tion of online sales, purchases by occasional readers arenow occurring online, perhaps to the detriment of the GSS.
Online Sales Benefit Unknown Authors,but Also Superstars
For the third aspect, disparity, online sales of best-sell-ers appear to present no special features in comparison tophysical sales. The best-sellers sold on the Internet are notvery different from those sold in specialist superstores andbookshops. The turnover rate for the top-selling charts isno higher than in other channels. Internet sales are never-theless characterised by a less marked star effect (concen-tration of sales on a small number of successful authors);see tables 8 and 9: 2 % of authors account for 40% ofonline sales compared with 1.26 % of authors in SSS and1.14 % in all channels combined. Nearly 10% of authorsare needed in order to account for 90% of Internet sales,almost twice as many as for SSS (6%) and for all channelscombined (5%). On the other hand, the situation of less-sold authors is distinctly better for sales online. Thougharound two-thirds of authors share 1% of total sales, thisproportion falls to 40% in SSS and to less than 20% on theInternet.
An Ambiguous Impact on the Concentration of Sales
The growth in online sales has a contrasting impact onthe balance of sales. The study demonstrates a more egal-itarian distribution for Internet sales than for sales throughother channels (less pronounced in the case of books foryoung people). Thus, the proportion of titles which repre-sent 50% of sales is more than twice has high on the Inter-net as in SSS (7% against 3% for graphic novels and 4%against 1.5 % for literature at the end of 2007), except inthe case of books for young people where it is very close(around 5% in late 2007). Likewise, on average in 2007 theminimum market share of the best-selling 1% titles washigher in SSS than online (except for the youth category):best-sellers thus occupy a less dominant place on the Inter-net. In contrast, the median market share, (i.e. that sepa-rating the titles into two), was higher on the Internet thanin GSS, illustrating the fact that titles with lower sales dobetter there32. Following Anderson’s thesis33, it appears that on the
Internet the best sales are shared by more titles and that thesales in the tail of the distribution curve are more impor-tant. In parallel, this analysis suggests an increase in con-centration, with a diminishing proportion of titles takingup 50% of total sales. Here again, this result seems con-sistent with empirical analyses of the long tail, tending to
Table 8 - Market Share of Authors and Sales for the Literature Category in SSS
Source: DEPS, Ministry of Culture and Communication, 2011.
Combined 2003 2004 2005 2006 2007authors’ share…
50% of sales 1.4 1.3 1.3 1.2 1.340% of sales 4.7 4.6 4.6 4.6 4.69% of sales 36.5 36.1 36.2 36.2 36.11% of sales 57.3 58.0 58.0 58.0 58.0
Total 100 100 100 100 100
as a %)
Table 9 - Market Share of Authors and Sales for the Literature Categoryon the Internet
Source: DEPS, Ministry of Culture and Communication, 2011.
Combined 2003 2004 2005 2006 2007authors’ share…
50% of sales 3.3 2.8 2.2 2.2 2.040% of sales 12.7 11.1 8.8 8.5 7.79% of sales 63.8 61.2 72.0 71.2 71.41% of sales 20.2 24.9 17.0 18.1 18.9
Total 100 100 100 100 100
as a %)
32. This better position is entirely relative. The internet share of the book market is so small that for a given title, even the lowest market share achievedin SSS rather than online can still translate into higher sales volumes in the former than latter.33. C. ANDERSON, The Long Tail, op. cit.
Figure 7 - Market Share of Top 10 in the Top 100 by Distribution Channel (literature)
Source: DEPS, Ministry of Culture and Communication, 2011.
Jan.2004
Jan.2005
May2004
May2005
Sept.2004
Sept.2005
Jan.2006
May2006
Sept.2006
Jan.2007
May2007
Sept.2007
Sept.2003
0.25
0.2
0.15
0.1
0.3
0.5
0.45
0.4
0.35
Specialist superstore Internet Total

diverted from the “steep tail” (best-sellers) towards the longtail. The decentralised advertising methods made possibleby the Internet (forums, blogs, purchasing advice on onlinesellers’ sites, etc.) can play a part in this shift in demand.Thanks to the Internet, not only are titles unavailable inphysical bookshops accessible, but consumers can also findout about them and read the opinions of Internet users whohave already read them. The rise in the market share oftitles with a small print run, to the detriment of titles withhigher sales, which has been recorded in the online saleschannel seems consistent with this analysis. Nevertheless,super best-sellers are able to resist this phenomenon. Thisobservation is also consistent with previous studies of thelong tail which showed that the reduction in the number ofsuperstar works could lead, in part, to a stronger demandfor those which remained35. n
2011-4 13culture études
The results are radically different when we consider themarket share of superstars, the handful of writers who arevery well-known. Changes in the market share of the top10 in the top 100 authors, although very sensitive to therelease of one or several very well-known titles (such asthe paperback edition of the Da Vinci Code in May 2005),tend overall towards concentration on the short head (thestrong sales of superstars) in every channel. This strength-ening of the star-system appears more striking on the Inter-net. In this channel, while the ten first literary authorsaccounted on average for 27% of the monthly sales of thetop 100 in 2003, their market share had risen to nearly 32%in 2007.While the star effect is more evident for physical sales
than on the Internet for the top 100 and top 1,000, thesuperstars are more dominant on the Internet than in largeand small bookshops. This result demonstrates the impor-tant role of bookshops in promoting certain titles in orderto encourage the emergence of new talents or the successof little-known authors. If the Internet also promotes theseauthors, site strategies which consist of displaying the listsof the ten best authors and titles on the home page wouldlead to an even narrower concentration of sales on theseworks. The “home page” effect would offset the “long tail”.Finally, while the market share of the first four pub-
lishers is around 5 points weaker on the Internet than inSSS for literature and books for young people, at the endof the period the market share of Hachette and Editis is 7points lower for literature and 10 points lower for booksfor young people on the Internet than in cultural super-stores. An identical phenomenon can be seen for thegraphic novel category, although Hachette and Editis arenot dominant in this market. Their market shares on theInternet are weaker than in other channels, although thedifference is less marked. It appears that it is easier for pub-lishers who are outside the duopoly to exist in the channelwhich is least readily controlled by traditional marketingmeans. It is also easier for them to maintain a presence inthe channel where the control of powerful marketing anddistribution companies in not an essential competitiveadvantage, as may be the case in traditional channels.The particular structure of the distribution of sales
across titles on the Internet is consistent with Chris Ander-son’s long tail theory34, according to which the Internetpresents an opportunity for slow-moving books whose lim-ited readership put off bookshops which need space fornew titles. On the Internet, the absence of display con-straints should make it possible to sell these books in thelong-term, and thus to allow them the time to find theirreadership. The long tail thus includes all the titles forwhich the buying public is sufficiently large for the worksto be profitable, but too fragmented to allow retailers tooffer them over a prolonged period. A larger number oftitles is thus accessible, and the demand can potentially be
34. C. ANDERSON, The Long Tail, op. cit.35. E. BRYNJOLFSSON, Y. J. HU and D. SIMESTER, "Goodbye Pareto Principle, Hello Long Tail: The Effect of Search Costs on the Concentra-tion of Product Sales", Management Science, 2011, forthcoming; F. OBERHOLZER-GEE and A. ELBERSE, "Superstars and Underdogs: An Exam-ination of the Long Tail Phenomenon in Video Sales", Working Paper no 07.015, Harvard Business School.

14 culture études 2011-4
The Data
This study is based on sales data for physical books sales in France, as gathered by GfK on a monthly basis, over a period of fiveyears (from January 2003 to December 2007). This analysis is based on works within the three following segments: general litera-ture; books for young people (excluding colouring books and sticker books/albums); graphic novels.
GfK took raw weekly cash register sales data from around 2300 sales outlets in 2007. The number of stores audited increased sub-stantially year-on-year1, with the cash register sales data used as a basis to extrapolate sales at national level. Weighting was adjustedappropriately each time new sales outlets were added. According to GfK, these data estimations represent almost all of physical booksales in France (excluding book clubs, mail order, purchases from overseas sites and community sales). Data also excludes directsales by publishers, forward sales (communities and businesses), discount sales, second-hand book sales and books sold in museumstores and service stations. GfK was not able to give any information on the book club channel for reasons of confidentiality, as onlyFrance Loisirs, which acquired 50% of Grand Livre du Mois in 2004, with the remaining half in 2008, now operates in these saleschannels
Sales figures were gathered for five different distribution networks: large bookshops, including bookshops with an annual turnoverabove €750,000; small bookshops whose annual turnover is equal to or less than €750,000 (including small Relay stores), whichinclude small generalist bookshops and the majority of specialist bookshops etc. (books for young people, graphic novels, etc2); spe-cialist superstores (cultural SSS which include the likes of Fnac, Virgin, Cultura and Espace Culturel Leclerc3); grocery superstores(GSS) hypermarkets and supermarkets4; the internet, the channel for which, according to GfK, all online distributors are audited5 fortheir sales of new books6. Sales of digital books, known as e-books, are not available but currently remain negligible. E-books arecurrently estimated to account for just 0.1% of the French publishing market.
GfK data is collected on the basis of EAN-referenced products. For each EAN number, GfK supplied the following 23 variables forthe period: month extracted from database; week of first sale; author; title; publisher; publishing group; format: paperback, non-stan-dard paperback and large-format7; French or foreign work (for ‘literature’ category only); sales data (quantity and turnover figures) persales channel: large bookshop, small bookshop, cultural SSS, GSS, internet, total (all channels combined); three segmentation lev-els: 3 level-1 segments (general literature, books for young people, graphic novels); 15 level-2 segments and 69 level-3 segments8.
For the period covered, this analysis covered 253,449 different EANs, comprising 150,760 books in the general literature category(59.5% of all EANs) 68,625 books for young people (27.1%) and 33,672 graphic novels (13.3%). More than two thirds of items listedwere books which were not published in standard paperback format (172,607 items 68.1% to be precise), less than one third werestandard paperbacks (78,966 items, i.e. 31.2%) and less than 1% are listed as large-format books (1,493 items, i.e. 0.6%9).
As a single item can appear under various different EAN references, especially where for example it is released as a standard andnon-standard paperback, it is possible that the number of different titles may be overestimated. However, a product's launch in a stan-dard paperback format generally signals it was reaching the end of its life as a large format version. In fact, “numerous bookshopsare now in the habit of returning the large-format title when the paperback comes out, which tends to shorten its life cycle and increasetitle turnover10” On any given date, it is usually an author’s new work which is available as a large format version, and their previoustitles which are being sold As standard paperback editions. The same book can be sold under various EAN references in other situ-ations which remain marginal, e.g. when a book is available in its original and translated version or for public domain works whichcan be released under various different editions. It is in fact relatively rare within publishing for the same book to exist under severalEANs at the same time and consequently no special data processing was done to this end.
On the other hand, data from GfK was supplied in a raw format and therefore could not be processed directly. The main problem withthis unexpurgated data concerns the “author” field. In fact, diversity measurements based on the author are done so based on theassumption that one EAN refers to one single author. However, the “author” field in the “raw” GfK database is not always populatedin a consistent fashion. When an author is unique, his or her surname and first name are not always written in an identical fashion.Some re-processing of the data was therefore necessary11. Moreover, in the “books for young people” and “graphic novel” categories,works with multiple authors (e.g. scriptwriter and artist) are the rule rather than the exception. The “author” field sometimes containsjust one of the authors, and sometimes both. This problem is not insignificant in the graphic novel category, where co-authors canchange from one series, or indeed one episode to the next. We therefore decided against calculating diversity based on author forboth the ‘books for young people’ and the ‘graphic novel’ categories.
It should also be noted that the method used by GfK to compensate for the non-exhaustive nature of the “cash register” dales datain certain channels (e.g. small and large bookshops) allows total sales quantities to be extrapolated, but not the number of differenttitles sold. Therefore, the small and large bookshops which were added during the course of the data collection probably were sub-ject to regional if not local variations which influenced the titles offered there. An increase in the number of different titles sold throughthe channels where data collection was not initially exhaustive may partly therefore simply be the result of statistical bias. This limi-tation, which may reduce the extent of the phenomena described without calling into question their entire existence, should be bornein mind where relevant.
1. There were 1,800 sales outlets included in 2004 and 2005, 2,100 at the start of 2006, and more recently 2,800 in 2008 and 3,500 in 2009.2. On the economics of specialist bookshops see Situation économique de la librairie indépendante, rapport des enquêtes quantitatives, OEL/IPSOS, 2007, p. 63¬64.3. For reasons of confidentiality, we were unable to get hold of sales data specifically for department stores (essentially Bon Marché and Galeries Lafayette) and the largestation kiosks (Relay stores). These were added in with the cultural SSS figures.4. Sales from non-bookstore specialist superstores such as Darty and Leroy Merlin, and toy and games specialists such as Toys'R'Us, La Grande Récrée, etc. could notfor confidentiality reasons be added into the “other” category. Due to the relatively low percentage of book sales in the turnover of such stores, this store category wasincluded under the GSS figures.5. For the larger companies: Amazon since July 2003, Alapage since March 2004, fnac.com since September 2004, chapitre.com since December 2007.6. Sales related to the acquisition of works by third parties through an internet site (often termed the “marketplace”) are not considered.7. Books in trade-format paperback editions, given their relatively low numbers, are classified as non-standard paperback.8. However, the amount of detail in our analysis has had to be cut back. The differences between standard and non-standard paperback and the different categories ofwork within the 'literature’ segment are not sufficiently significant to justify maintaining the distinctions.9. NB: the category and format for some 383 EANs is not specified (i.e. 0.2%)10. E. MARTI, Les Enjeux du livre au format de poche, Paris, Ministère de la Culture et de la Communication, DEPS, “Culture etudes” coll., 2008-4.11. As the database contains 60 monthly files each containing over 80,000 EANs meant that correcting the “author” field was going to be tricky. Correcting the databaserequired a semi-automated process. The method was set up as follows: (i) compile 60 monthly files to identify potentially different authors (i.e.65,816 lines); (ii) set up aprogram to identify authors listed without a first name (e.g. “auster”) (3199 instances) and those where the first name is simply denoted with an initial (e.g. “AUSTER P.”)which have a name matching another line in the database (2074 instances); (iii) for each of these 5273 instances thus singled out, a manual correction was made, authorby author. The same problem arose for the “publisher” category and was dealt with in the same way.
2011-4 15culture études
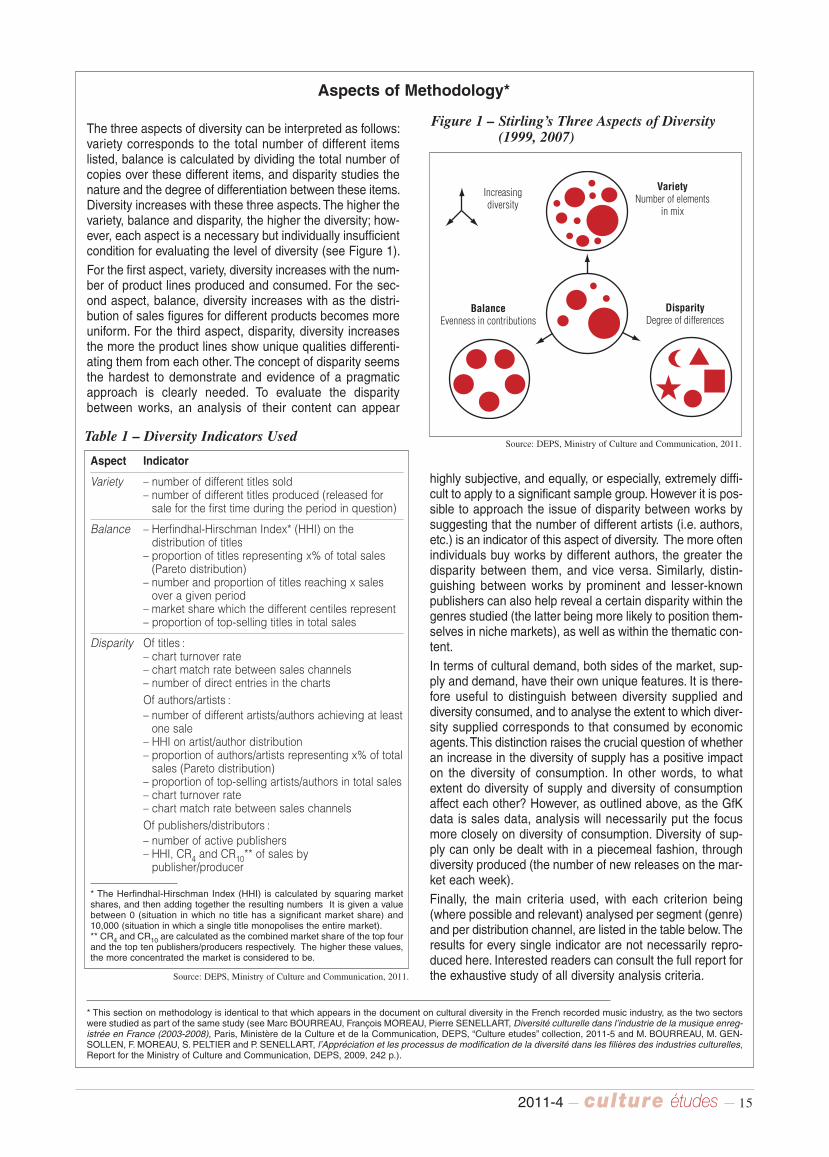
Aspects of Methodology*
The three aspects of diversity can be interpreted as follows:variety corresponds to the total number of different itemslisted, balance is calculated by dividing the total number ofcopies over these different items, and disparity studies thenature and the degree of differentiation between these items.Diversity increases with these three aspects. The higher thevariety, balance and disparity, the higher the diversity; how-ever, each aspect is a necessary but individually insufficientcondition for evaluating the level of diversity (see Figure 1). For the first aspect, variety, diversity increases with the num-ber of product lines produced and consumed. For the sec-ond aspect, balance, diversity increases with as the distri-bution of sales figures for different products becomes moreuniform. For the third aspect, disparity, diversity increasesthe more the product lines show unique qualities differenti-ating them from each other. The concept of disparity seemsthe hardest to demonstrate and evidence of a pragmaticapproach is clearly needed. To evaluate the disparitybetween works, an analysis of their content can appear
highly subjective, and equally, or especially, extremely diffi-cult to apply to a significant sample group. However it is pos-sible to approach the issue of disparity between works bysuggesting that the number of different artists (i.e. authors,etc.) is an indicator of this aspect of diversity. The more oftenindividuals buy works by different authors, the greater thedisparity between them, and vice versa. Similarly, distin-guishing between works by prominent and lesser-knownpublishers can also help reveal a certain disparity within thegenres studied (the latter being more likely to position them-selves in niche markets), as well as within the thematic con-tent.In terms of cultural demand, both sides of the market, sup-ply and demand, have their own unique features. It is there-fore useful to distinguish between diversity supplied anddiversity consumed, and to analyse the extent to which diver-sity supplied corresponds to that consumed by economicagents. This distinction raises the crucial question of whetheran increase in the diversity of supply has a positive impacton the diversity of consumption. In other words, to whatextent do diversity of supply and diversity of consumptionaffect each other? However, as outlined above, as the GfKdata is sales data, analysis will necessarily put the focusmore closely on diversity of consumption. Diversity of sup-ply can only be dealt with in a piecemeal fashion, throughdiversity produced (the number of new releases on the mar-ket each week). Finally, the main criteria used, with each criterion being(where possible and relevant) analysed per segment (genre)and per distribution channel, are listed in the table below. Theresults for every single indicator are not necessarily repro-duced here. Interested readers can consult the full report forthe exhaustive study of all diversity analysis criteria.
* This section on methodology is identical to that which appears in the document on cultural diversity in the French recorded music industry, as the two sectorswere studied as part of the same study (see Marc BOURREAU, François MOREAU, Pierre SENELLART, Diversité culturelle dans l’industrie de la musique enreg-istrée en France (2003-2008), Paris, Ministère de la Culture et de la Communication, DEPS, “Culture etudes” collection, 2011-5 and M. BOURREAU, M. GEN-SOLLEN, F. MOREAU, S. PELTIER and P. SENELLART, l’Appréciation et les processus de modification de la diversité dans les filières des industries culturelles,Report for the Ministry of Culture and Communication, DEPS, 2009, 242 p.).
Figure 1 – Stirling’s Three Aspects of Diversity(1999, 2007)
Source: DEPS, Ministry of Culture and Communication, 2011.
Increasingdiversity
VarietyNumber of elements
in mix
DisparityDegree of differences
BalanceEvenness in contributions
Table 1 – Diversity Indicators Used
Source: DEPS, Ministry of Culture and Communication, 2011.
Aspect Indicator
Variety – number of different titles sold– number of different titles produced (released forsale for the first time during the period in question)
Balance – Herfindhal-Hirschman Index* (HHI) on thedistribution of titles
– proportion of titles representing x% of total sales(Pareto distribution)
– number and proportion of titles reaching x salesover a given period
– market share which the different centiles represent– proportion of top-selling titles in total sales
Disparity Of titles :– chart turnover rate– chart match rate between sales channels– number of direct entries in the charts Of authors/artists :– number of different artists/authors achieving at leastone sale
– HHI on artist/author distribution– proportion of authors/artists representing x% of totalsales (Pareto distribution)
– proportion of top-selling artists/authors in total sales– chart turnover rate– chart match rate between sales channelsOf publishers/distributors :– number of active publishers– HHI, CR4 and CR10** of sales bypublisher/producer
* The Herfindhal-Hirschman Index (HHI) is calculated by squaring marketshares, and then adding together the resulting numbers It is given a valuebetween 0 (situation in which no title has a significant market share) and10,000 (situation in which a single title monopolises the entire market). ** CR4 and CR10 are calculated as the combined market share of the top fourand the top ten publishers/producers respectively. The higher these values,the more concentrated the market is considered to be.
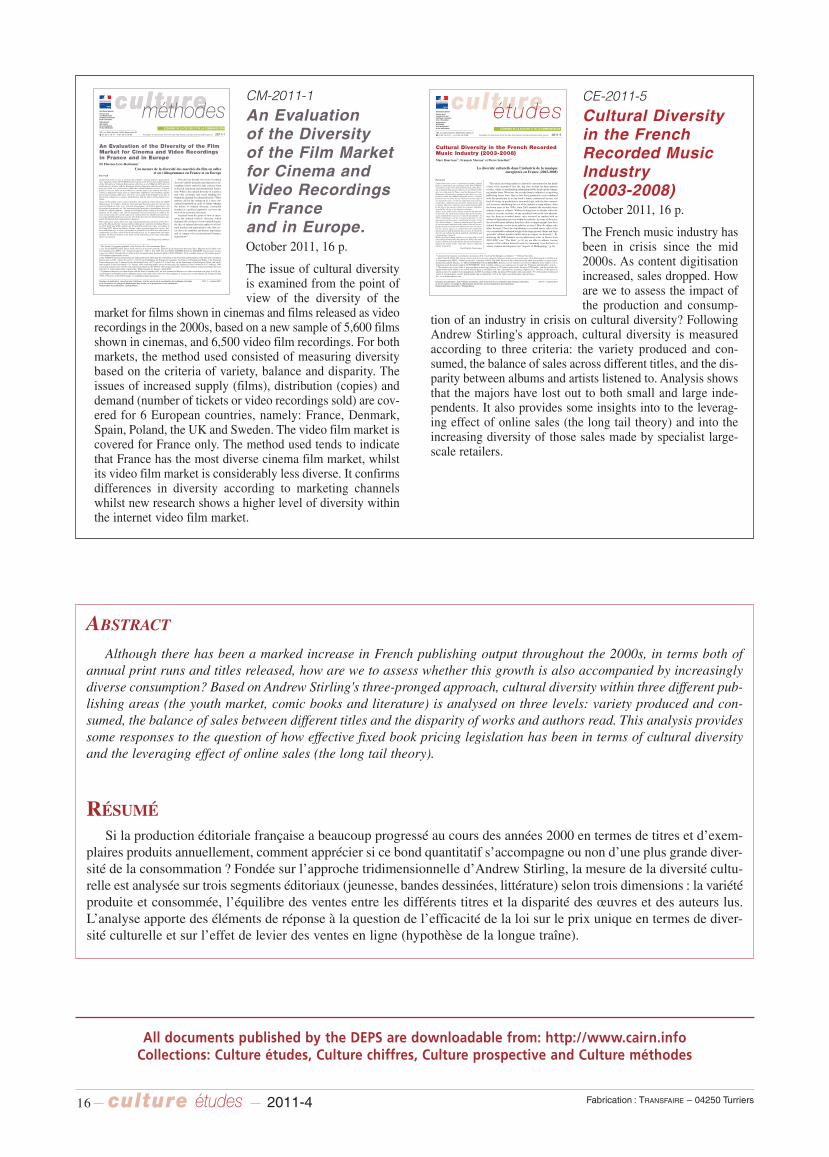
16 culture études 2011-4
ABSTRACTAlthough there has been a marked increase in French publishing output throughout the 2000s, in terms both of
annual print runs and titles released, how are we to assess whether this growth is also accompanied by increasinglydiverse consumption? Based on Andrew Stirling's three-pronged approach, cultural diversity within three different pub-lishing areas (the youth market, comic books and literature) is analysed on three levels: variety produced and con-sumed, the balance of sales between different titles and the disparity of works and authors read. This analysis providessome responses to the question of how effective fixed book pricing legislation has been in terms of cultural diversityand the leveraging effect of online sales (the long tail theory).
RÉSUMÉSi la production éditoriale française a beaucoup progressé au cours des années 2000 en termes de titres et d’exem-
plaires produits annuellement, comment apprécier si ce bond quantitatif s’accompagne ou non d’une plus grande diver-sité de la consommation ? Fondée sur l’approche tridimensionnelle d’Andrew Stirling, la mesure de la diversité cultu-relle est analysée sur trois segments éditoriaux (jeunesse, bandes dessinées, littérature) selon trois dimensions : la variétéproduite et consommée, l’équilibre des ventes entre les différents titres et la disparité des œuvres et des auteurs lus.L’analyse apporte des éléments de réponse à la question de l’efficacité de la loi sur le prix unique en termes de diver-sité culturelle et sur l’effet de levier des ventes en ligne (hypothèse de la longue traîne).
Fabrication : TRANSFAIRE – 04250 Turriers
All documents published by the DEPS are downloadable from: http://www.cairn.infoCollections: Culture études, Culture chiffres, Culture prospective and Culture méthodes
CM-2011-1
An Evaluation of the Diversity of the Film Marketfor Cinema andVideo Recordingsin France and in Europe. October 2011, 16 p.
The issue of cultural diversityis examined from the point ofview of the diversity of the
market for films shown in cinemas and films released as videorecordings in the 2000s, based on a new sample of 5,600 filmsshown in cinemas, and 6,500 video film recordings. For bothmarkets, the method used consisted of measuring diversitybased on the criteria of variety, balance and disparity. Theissues of increased supply (films), distribution (copies) anddemand (number of tickets or video recordings sold) are cov-ered for 6 European countries, namely: France, Denmark,Spain, Poland, the UK and Sweden. The video film market iscovered for France only. The method used tends to indicatethat France has the most diverse cinema film market, whilstits video film market is considerably less diverse. It confirmsdifferences in diversity according to marketing channelswhilst new research shows a higher level of diversity withinthe internet video film market.
Over the last decade, the issue of culturaldiversity2 and the demands and imperatives sur-rounding it have started to take concrete formin French, European and international legisla-tion. What is the cultural diversity of a market,and what economic and social thinking liesbehind the demand for cultural diversity? Thesematters call for the setting up of a strict con-ceptual framework in order to define whetherthe notion of cultural diversity, essentiallybranded as a political argument, can form thebasis of an economic discourse.
Analysed from the point of view of meas-uring the cultural markets’ diversity, whichdemands the creation of new methodologies,the idea of cultural diversity applies to all cul-tural markets and particularly to the film sec-tor, due to its symbolic and historic importanceand its unique role in international businessnegotiations3.
* The Groupe d’économie mondiale, at the Sciences Po. research institute, Paris.1. See Tristan MATTELART, Enjeux intellectuels de la diversité culturelle. Éléments de déconstruction théorique, Paris, Ministère de la Culture et dela Communication, DEPS, coll. “Culture prospective”, 2009-2, July 2009. See also Hélène HATZFELD,Vincent BILLEREY, Repères pour un dia-logue interculturel, Ministère de la Culture et de la Communication, Secrétariat général (SCPCI/DREST), 2010, available online at: www.culture.gouv.frsee Politiques ministérielles section.2. The UNESCO Universal Declaration on Cultural Diversity 2001 then the Convention on the Protection and Promotion of the Diversity of CulturalExpressions in 2005; articles 87 and 151 of the Treaty Establishing the European Community, the Charter of Fundamental Rights of the EuropeanUnion and protocol no. 9 annexed to the Amsterdam Treaty (1997), article 167 of the Treaty on the Functioning of the European Union; and finallythe European Council resolution of 25 January 1999 concerning public service broadcasting, the European Council resolution of 12 February 2001concerning national aid to the film and audiovisual industries, the MEDIA 2007 programme (2007-2013), the European Audiovisual Media ServicesDirective of 11 December 2007 or indeed the “Digital Agenda for Europe” (2010-2020).3. Commercial disputes over films began with the dawn of cinema itself: the first commercial disputes over film circulation took place in 1910, pit-ting European and American film companies against each other. One of the most fierce disputes of recent years occurred during the Uruguay Round(1986-1994), part of the GATT rounds, i.e. multilateral trade negotiations.
An Evaluation of the Diversity of the FilmMarket for Cinema and Video Recordingsin France and in EuropeDr Florence Lévy-Hartmann*
Foreword
Cultural diversity is now a central aim of public cultural policies, particularlysince adoption of the 2005 UNESCO Convention on the Protection and Promotionof the Diversity of Cultural Expressions, effective as of 18 March 2007 after itsratification by France and the European Union. Numerous cultural policy meas-ures refer back to it, particularly within the cultural industries sectors. A largelypolitical concern, there are nevertheless economic aspects of cultural diversity: itrelates to important issues such as competition, industrial concentration, marketpower and economic efficiency, which are once again being brought to the fore inthe present climate by economic globalisation and the effects of the digital revo-lution. Aware of the public policy issues raised by the question of diversity, the DEPS(Department for Studies, Strategic Foresight and Statistics) has for the last fewyears included the issue in its research programme1. In 2008 it launched a callfor research proposals on "the assessment and processes of modifying diversitywithin the cultural industry”. Aiming to build upon all the results of socioeconomicanalysis on the subject, the call for proposals invited researchers to address theissue of assessing the various aspects of cultural diversity (definitions and meas-ures) and identifying the processes by which the diversity of cultural products sup-plied, distributed and consumed has changed.This exploratory study offers new and original quantitative analysis of the diver-sity of the film market for cinema within six European countries (including France)in 1998, 2001 and 2004, and for the French film market for video recordings in2003 and 2005. Based on Andrew Stirling’s three-pronged approach (variety, bal-ance and disparity), it seeks to determine a global diversity indicator and tends toconfirm the excellence of the French diversity policy, as, in comparison with othermarkets, the French market is the most varied and balanced in terms of the filmsshown in cinemas.
Jean-François CHAINTREAU
2011-1182, rue Saint-Honoré, 75033 Paris cedex 01� 01 40 15 79 17 – � 01 40 15 79 99 Available to download from the site http://www.culturecommunication.gouv.fr
Secrétariat général
Service de lacoordination despolitiques culturelleset de l’innovation
Départementdes études,de la prospectiveet des statistiques
Une mesure de la diversité des marchés du film en salles et en vidéogrammes en France et en Europe
culturecultureÉCONOMIE DE LA CULTURE ET DE LA COMMUNICATION
Directeur de publication : Jean-François Chaintreau, chef du service de la coordination des politiques culturelles 2011-1 – octobre 2011et de l’innovation, en charge du département des études, de la prospective et des statistiques. Responsable des publications : Edwige Millery
méthodesCE-2011-5
Cultural Diversityin the FrenchRecorded MusicIndustry (2003-2008)October 2011, 16 p.
The French music industry hasbeen in crisis since the mid2000s. As content digitisationincreased, sales dropped. Howare we to assess the impact ofthe production and consump-
tion of an industry in crisis on cultural diversity? FollowingAndrew Stirling's approach, cultural diversity is measuredaccording to three criteria: the variety produced and con-sumed, the balance of sales across different titles, and the dis-parity between albums and artists listened to. Analysis showsthat the majors have lost out to both small and large inde-pendents. It also provides some insights into to the leverag-ing effect of online sales (the long tail theory) and into theincreasing diversity of those sales made by specialist large-scale retailers.
The music recording market is famously concentrated in the handsof just a few; in point of fact, the ‘big four’ account for three quartersof sales, whilst several hundred independent labels divide up the remain-ing market share. Moreover, the recorded music industry is set up alongpublishing house lines. Due to low fixed production costs combinedwith the uncertainty as to any work’s future commercial success, thelevel of variety in production is extremely high, with the few commer-cial successes subsidising the cost of the industry’s many failures. Afterthe boom years of the 1990s, from 2003 onwards the recorded musicindustry began to collapse. Without looking here to identify either theextent or even the existence of any causality between the two phenom-ena, the drop in recorded music sales occurred in tandem with anadvanced digitisation process within the industry. In terms of diversity,the recorded music industry therefore offers a unique insight: how doescultural diversity evolve in an industry in crisis? How do online salesaffect diversity? Does the contribution to recorded music sales of thevery considerable combined weight of the large grocery chains and largespecialist cultural product outlets have an impact on diversity? Byanalysing the GfK database on recorded music sales in France from2003-20082 (see “The Data”, p.14) we are able to address variousaspects of the cultural diversity issue by examining it on the basis ofvariety, balance and disparity (see "Aspects of Methodology", p.14).
* Laboratoire Information, Coordination, Incitations (ICI), Université de Bretagne occidentale ; ** Télécom ParisTech.1. See Tristan MATTELART, Enjeux intellectuels de la diversité culturelle. Éléments de déconstruction théorique, Paris, Ministère de la Culture et dela Communication, DEPS, “Culture prospective” collection, 2009-2, July 2009. Moreover, this cultural diversity study also includes a section on pro-moting intercultural dialogue, see Hélène HATZFELD,Vincent BILLEREY, Repères pour un dialogue interculturel, Ministère de la Culture et de laCommunication, Secrétariat général (SCPCI/DREST), 2010, available online at www.culture.gouv.fr/ under the “Politiques ministérielles” section.2. This analysis only covers sales of music products in hard copy (albums in CD format) and excludes the music DVD market, and also excludes thedigital market either online or via mobile technology (e.g. individual track sales, subscriptions, streaming, ringtones, etc.). However, for the period inquestion, these two markets were insignificant. In 2008, According to GfK, the music DVD market only represented 7.5% of the market for physicalcopies of recorded music, and the digital market only accounted for 5.9% of the value of recorded music sales in FranceSee: www.disqueenfrance.com
Cultural Diversity in the French RecordedMusic Industry (2003-2008)Marc Bourreau**, François Moreau* et Pierre Senellart**
2011-5182, rue Saint-Honoré, 75033 Paris cedex 01� 01 40 15 79 17 – � 01 40 15 79 99 Available to download from the site http://www.culturecommunication.gouv.fr
Secrétariat général
Service de lacoordination despolitiques culturelleset de l’innovation
Départementdes études,de la prospectiveet des statistiques
cultureétudes
La diversité culturelle dans l’industrie de la musiqueenregistrée en France (2003-2008)
Foreword
Cultural diversity is now a central aim of public culturalpolicies, particularly since adoption of the 2005 UNESCOConvention on the Protection and Promotion of the Diver-sity of Cultural Expressions, effective as of 18 March 2007after its ratification by France and the European Union.Numerous cultural policy measures refer back to it, par-ticularly within the cultural industries sectors. A largelypolitical concern, there are nevertheless economic aspectsof cultural diversity: it relates to important issues such ascompetition, industrial concentration, market power andeconomic efficiency, which are once again being broughtto the fore in the present climate by economic globalisa-tion and the effects of the digital revolution. Aware of the public policy issues raised by the questionof diversity, the General Secretariat has for the last fewyears included the issue in its research programme1. In2008 it launched a call for research proposals on "theassessment and processes of modifying diversity withinthe cultural industry”. Aiming to build upon all the resultsof socioeconomic analysis on the subject, the call for pro-posals invited researchers to address the issue of assess-ing the various aspects of cultural diversity (definitionsand measures) and identifying the processes by which thediversity of cultural products supplied, distributed andconsumed has changed.Whilst the French music industry is in crisis, with recordsales falling dramatically throughout the 2000s, this studyof the evolution of diversity during this period attempts toaddress the reality of the “long tail” theory within themarket in question.
Jean-François CHAINTREAU
Directeur de publication : Jean-François Chaintreau, chef du service de la coordination des politiques culturelles 2011-5 – octobre 2011et de l’innovation, en charge du département des études, de la prospective et des statistiques. Responsable des publications : Edwige Millery
ÉCONOMIE DE LA CULTURE ET DE LA COMMUNICATION