ctf/tfc.8/crp.5 november 4, 2011 meeting of the … crp... · emitters - at 5 % of global ghg...
TRANSCRIPT

CTF/TFC.8/CRP.5November 4, 2011
__________________________________________________________________________________________________________Meeting of the CTF Trust Fund CommitteeWashington, D.C.November 4, 2011
PRESENTATION BY GOVERNMENT OF INDIA ON THEINDIA CTF INVESTMENT PLAN

Clean Technology Fund Investment Plan
for India
CTF Trust Fund CommitteeWashington, DC
November 4, 2011
Largest GHG reduction potential Comprehensive Policy Framework in Place 11th Five Year Plan (2007-2012) and 12th Five Year
Plan (2012-2017) currently under preparation seek to accelerate deployment of all sources of renewable and clean energy
Integrated Energy Policy addresses energy security long term
Voluntary Commitment: to reduce carbon intensity by 20 to 25 % by 2020 against a 2005 baseline
Supports two National Missions of the National Action Plan on Climate Change: (i) the National Mission for Enhanced Energy Efficiency and (ii) the Jawaharlal Nehru National Solar Mission
Investment Plan Focuses on Energy Sector
India’s GHG Emissions Profile
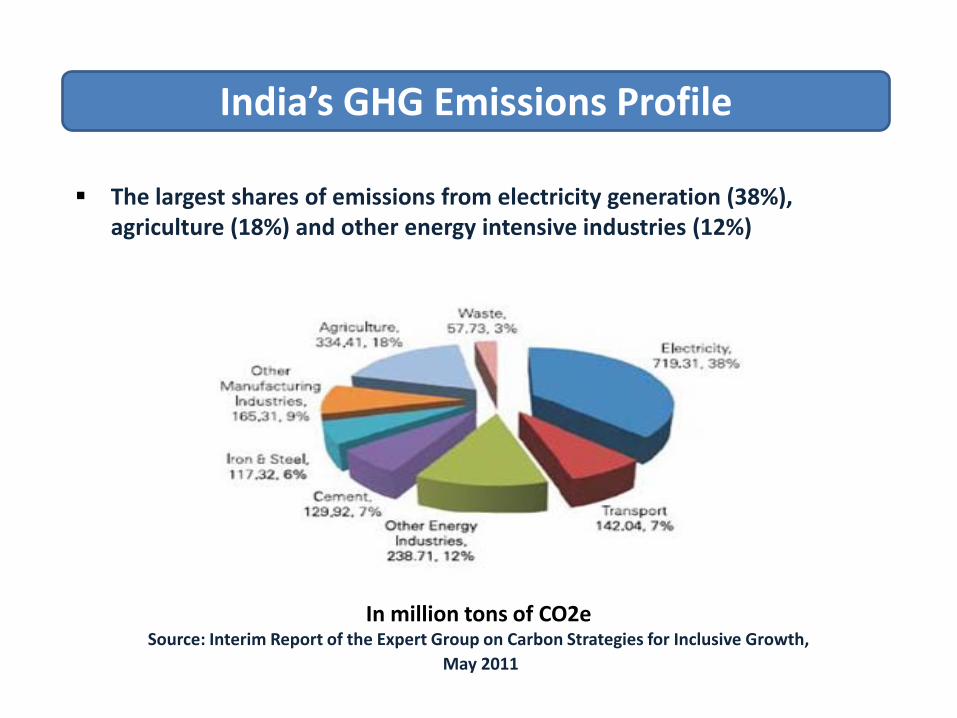
The largest shares of emissions from electricity generation (38%), agriculture (18%) and other energy intensive industries (12%)
In million tons of CO2eSource: Interim Report of the Expert Group on Carbon Strategies for Inclusive Growth,
May 2011
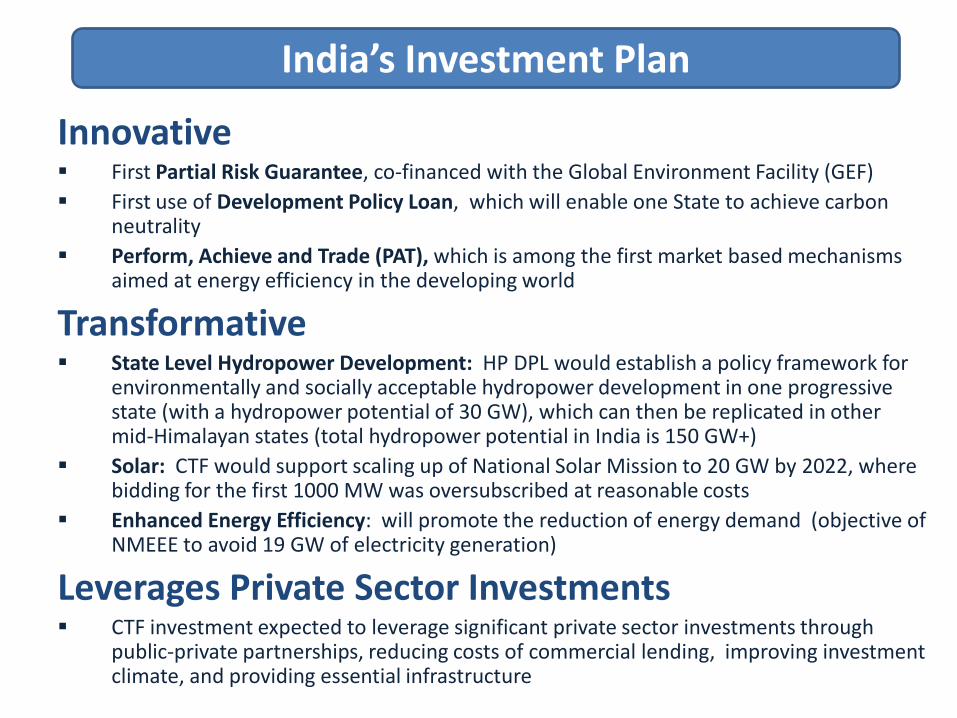
Innovative First Partial Risk Guarantee, co-financed with the Global Environment Facility (GEF) First use of Development Policy Loan, which will enable one State to achieve carbon
neutrality Perform, Achieve and Trade (PAT), which is among the first market based mechanisms
aimed at energy efficiency in the developing world
Transformative State Level Hydropower Development: HP DPL would establish a policy framework for
environmentally and socially acceptable hydropower development in one progressive state (with a hydropower potential of 30 GW), which can then be replicated in other mid-Himalayan states (total hydropower potential in India is 150 GW+)
Solar: CTF would support scaling up of National Solar Mission to 20 GW by 2022, where bidding for the first 1000 MW was oversubscribed at reasonable costs
Enhanced Energy Efficiency: will promote the reduction of energy demand (objective of NMEEE to avoid 19 GW of electricity generation)
Leverages Private Sector Investments CTF investment expected to leverage significant private sector investments through
public-private partnerships, reducing costs of commercial lending, improving investment climate, and providing essential infrastructure
India’s Investment Plan
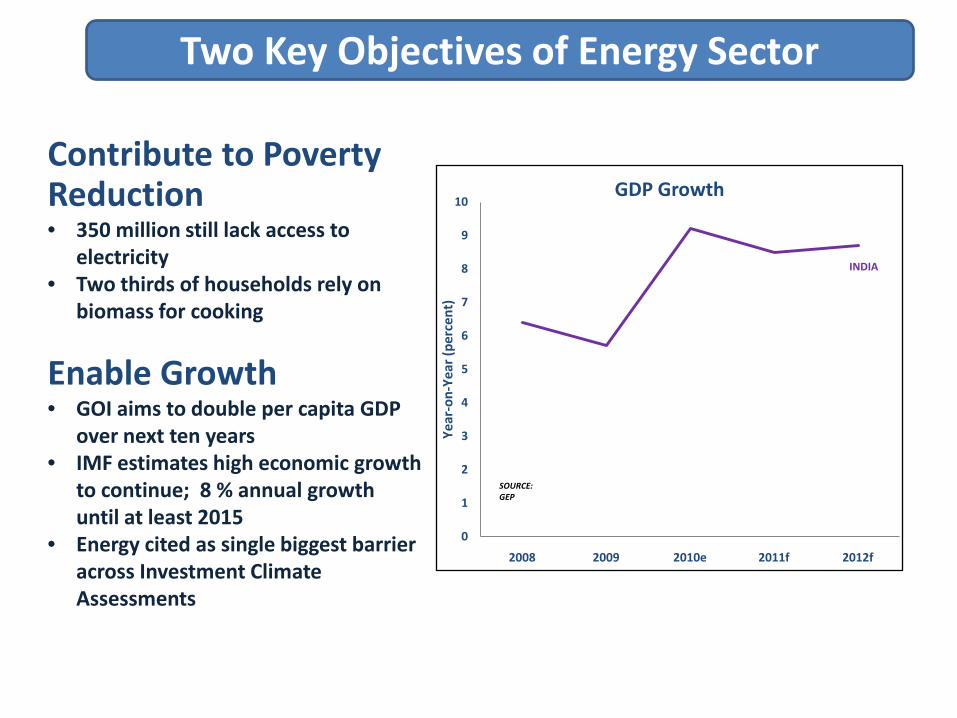
Contribute to Poverty Reduction• 350 million still lack access to
electricity • Two thirds of households rely on
biomass for cooking
Enable Growth • GOI aims to double per capita GDP
over next ten years • IMF estimates high economic growth
to continue; 8 % annual growth until at least 2015
• Energy cited as single biggest barrier across Investment Climate Assessments
Two Key Objectives of Energy Sector
0
1
2
3
4
5
6
7
8
9
10
2008 2009 2010e 2011f 2012f
Year
-on-
Year
(per
cent
)
GDP Growth
SOURCE: GEP
INDIA

• In an 9% growth scenario until 2020, India will need to increase its installed capacity from current 172 GW to 377 GW, and emissions from the power sector could more than double depending on scenario
• Altogether, India has more than 200 GW of untapped renewable energy potential
50000
700016000 15000
5000
45000
150000
2.12 58 683 2344 10339755
36878
0
20000
40000
60000
80000
100000
120000
140000
160000
Potential Current Installed
Alternate Sources of Energy
Generation from coal (%)

India’s GHG Footprint Is Relatively Modest
Carbon Intensity 1990 – 2007 (metric tonnes CO2/ thousand GDP PPP (US $ 2000)source: World Bank 2007)
• Due to the size of its economy and population, India is among the top ten emitters - at 5 % of global GHG emissions
• Per capita GHG emissions among the lowest at 1.8 tCO2e
• Carbon intensity (CO2e per unit of GDP, on PPP basis) on par with global average
• Forest cover has stabilized
• Carbon intensity has been decreasing over the past two decades
World
Brazil
China
India
Italy
Russian Federation
South Africa
0.000
0.200
0.400
0.600
0.800
1.000
1.200
1.400
1.600
1.800
2.000 Tonnes of CO2 per $1,000 of GDP
9
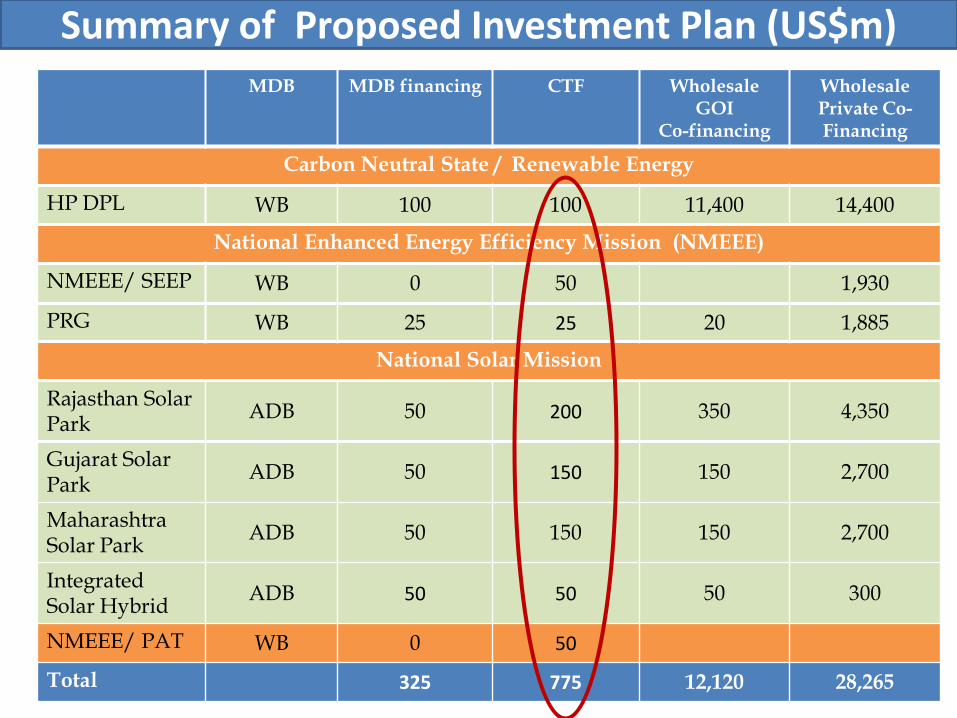
MDB MDB financing CTF WholesaleGOI
Co-financing
Wholesale Private Co-Financing
Carbon Neutral State / Renewable Energy
HP DPL WB 100 100 11,400 14,400
National Enhanced Energy Efficiency Mission (NMEEE)
NMEEE/ SEEP WB 0 50 1,930
PRG WB 25 25 20 1,885
National Solar Mission
Rajasthan Solar Park ADB 50 200 350 4,350
Gujarat Solar Park ADB 50 150 150 2,700
Maharashtra Solar Park ADB 50 150 150 2,700
Integrated Solar Hybrid ADB 50 50 50 300
NMEEE/ PAT WB 0 50
Total 325 775 12,120 28,265
Summary of Proposed Investment Plan (US$m)

• GoHP intends to become the first-carbon neutral state in India, with transformative actions across the key engines of economic growth, namely energy, tourism, rural development and industry
• Will require an expansive policy matrix which supports a quantum shift and concerted effort among all key economic sectors
• Policy framework will include innovative policies on environment (river basin management and cumulative assessments) and social development (participatory approach and community benefit sharing)
• Policy Framework will apply to scaling up of hydropower from 6.7 GW of installed capacity to an additional 10 – 14.5 GW in next 10 years
Himachal Pradesh Development Policy Loan

Objectives to implement market-based approaches to unlock energy
efficiency opportunities, estimated to be worth about Rs. 7,400 million (about US$ 165 billion)
Outcomes: NMEEE is expected to have made the following gains: Annual fuel savings in excess of 23 million ton of oil
equivalent (TOE) Cumulative avoided electricity capacity addition of 19 GW CO2 emission mitigation of 98 million tons per year
CTF Support:
(i) Super Efficient Equipment Program
Barrier: higher up front costs of efficient equipment and perceived risks in attaining energy savings and recovering costs
Solution: CTF would provide a subsidy to monetize the energy savings up front, using electric fans (10 million sold annually, or 25 percent of the market) as the pilot
Replication: air conditioning units, chillers, refrigerators, electric motors, etc.
National Enhanced Energy Efficiency Mission

CTF Support: (ii) Partial Risk Guarantee Barrier: Financial institutions and commercial banks
are averse to investing in projects whose technologies or processes have not been deployed widely
Solution: to provide commercial banks with partial coverage of their risk exposure for renewable energy projects, thereby helping investors get lower cost of commercial debt
Replication: Expected to bring advanced renewable energy investments closer to grid-parity faster and reducing payback periods of energy efficiency investments
(iii) Perform, Achieve and Trade (PATs) Barrier: high costs of industry to comply with PATs
Solution: CTF intervention would provide an interest financial support incentive to kick start the initiative and achieve a market transformation.
Replication: PATs could galvanize proposed investments of US$4 billion required for compliance with the scheme
National Enhanced Energy Efficiency Mission (II)

Objectives To create an enabling policy framework for the
deployment of 20,000 MW of solar power by 2022
To create favorable conditions for solar manufacturing capability, particularly solar thermal for indigenous production and market leadership. To promote programs for off grid applications
CTF Support: Barrier: first-of-a-kind “pioneer” projects with high costs,
first mover risks, and challenges of large scale development of intermittent renewable energy resources with new technology
Solution: to develop several solar parks and transmission systems, demonstrate feasibility of public-private partnership approach (PPP), and optimize generation output and delivery to consumers
Replication: high learning value for the deployment of 20,000 MW by 2022
Jawaharlal Nehru National Solar Mission

14
Indicative Results from Investment PlanIndicators Baseline CTF
Investment IP Results WholesaleLeveraging
Himachal Pradesh DPL 6.7 GW $100 m 10 - 14.5 GW in
10 years 1:30
Annual GHGemission reductions
1 Mt CO2 / yr
Replication potential 50 GW ++ 5 Mt CO2e/yr
NMEE $125 m 98 Mt CO2 /yr 1:30
Annual GHG emission reductions
2 mt CO2e/ yr
Replication potential 10 Mt CO2e/yr
JWNSM $550 m 1:20
Annual GHG emission reductions 6 Mt CO2e / yr
Replication potential 30 Mt CO2e/ yr

Cost Effectiveness Potential to leverages 20 to 30 times the investment mostly from private sector Need concessional finance for demonstration effect of innovative policies
Demonstration of Potential at Scale CTF would support initial phases of innovative policies
High Replication Potential for hydropower development, solar and energy efficiency Developmental Impact
• Energy efficiency investments directly benefit consumers• Development of indigenous solar manufacturing base and employment in clean
energy • Improving energy security • Support paradigm shift from conventional socio-economic development to true
low-carbon development in one State • Avoided coal generation and associated health benefits
Implementation Potential The carbon neutral and energy efficiency policies have been developed with
substantial stakeholder analyses and inputs, and experience in other countries. The proposed solar parks are first-of-a-kind in terms of scale and design, which
present first-mover risks. Significant private sector interest in generation. Proposed operations support national programs with strong country ownership
Rationale for CTF Co- Financing

Thank You