ct 2007 ar-eng-ppt-final(chinese script) by sylvia3 (7& 11 ... · 6 highlights strong free cash...
TRANSCRIPT

China Telecom Corporation Limited31 March 2008
www.chinatelecom-h.com

2
Certain statements contained in this document may be viewed as “forward-looking statements” within the meaning of Section 27A of the U.S. Securities Act of 1933 (as amended) and Section 21E of the U.S. Securities Exchange Act of 1934 (as amended). Such forward-looking statements are subject to known and unknown risks, uncertainties and other factors, which may cause the actual performance, financial condition or results of operations of China Telecom Corporation Limited (the “Company”) to be materially different from any future performance, financial condition or results of operations implied by such forward-looking statements. In addition, we do not intend to update these forward-looking statements. Further information regarding these risks, uncertainties and other factors is included in the Company’s most recent Annual Report on Form 20-F filed with the U.S. Securities and Exchange Commission (the “SEC”) and in the Company’s other filings with the SEC.
Forward-Looking Statements

3
Executive Director, EVP & CFOExecutive Director, EVP & CFOMadam Wu AndiMadam Wu Andi
Executive Director, President & COOExecutive Director, President & COOMr. Leng RongquanMr. Leng Rongquan
Chairman & CEOChairman & CEOMr. Wang XiaochuMr. Wang Xiaochu
Management Team

4
Agenda
OverviewOverview
Business ReviewBusiness Review
Financial PerformanceFinancial Performance

Overview

6
Highlights
Strong free cash flow greatly supports future development
Strategic transformation successfully consolidates revenue and profit
Rapidly growing non-voice business effectively alleviates operating risk
Optimized CAPEX structure significantly enhances competitive edges

7
2006
Solid Results (Excl. Connection Fees)
25.9%
-1.2%
35.6528.32Broadband Subs (Mil)
220.33223.04Access Lines in Services (Mil)
1.1%0.2780.275EPS* (RMB)
17.2%33,96428,991Free Cash Flow** (RMB Mil)
1.1%
-0.7pp
1.3%
2.8%
22,51722,270Net Profit* (RMB Mil)
49.0%49.7%EBITDA Margin
85,97484,866EBITDA (RMB Mil)
175,362170,645Operating Revenue (RMB Mil)
2007 Growth
Note: Unless otherwise stated, all financial data used hereinafter exclude upfront connection fees* Excluding the impact of revaluation in 2007 of property, plant & equipment every 3 years (see slide 25)** Free Cash Flow = EBITDA (Excl. connection fees) – CAPEX – Income Tax
8
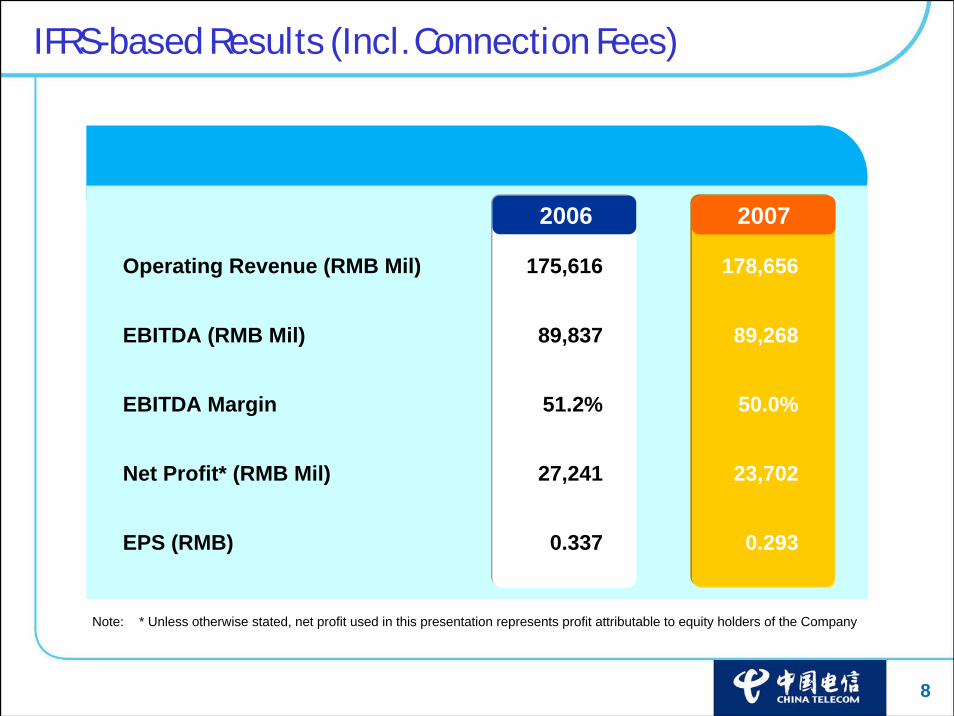
0.2930.337EPS (RMB)
23,70227,241Net Profit* (RMB Mil)
50.0%51.2%EBITDA Margin
89,26889,837EBITDA (RMB Mil)
178,656175,616Operating Revenue (RMB Mil)
IFRS-based Results (Incl. Connection Fees)
20072006
Note: * Unless otherwise stated, net profit used in this presentation represents profit attributable to equity holders of the Company

9
Voice Business*
2006 2007
RMB Mil
2.8% Contribution
Managed Data, Leased Line &
Others
Internet Access
VAS & Integrated
Information Services
Revenue Growth Drivers
+4.5pp-5.6pp +2.9pp +1.0pp
+2.8%1,6725,028-9,599 7,616
Note: * Voice Business Revenue includes Monthly Fees, Local Usage Fees, Upfront Installation Fees, DLD/ILD and Interconnection Revenue
170,645175,362

10
Proactively Managing Voice Challenges
Revenue Growth by Customer Segments in 2007
Steady Aggregate Revenue
Voice Revenue Non-Voice Revenue
RMB Mil
2006 2007
120,911 111,312
49,734 64,050
Major challenges in voice business
Rapidly declining mobile voice tariff (-17.7% yoy) & new means of communications
-Voice revenue 7.9%-Voice ARPU: RMB41.8 10.1%
Major initiatives
Strengthen integrated development of voice and non-voice businesses to improve voice services’ value to customers and mitigate voice revenue decline
Target at key customer segments like government & enterprise and household customers
Strictly control marketing expense on low-end customers to ensure return
11.2%
-13.9%
4.3%
Household IndividualGovernment & Enterprise
170,645 175,362
CT’s overall revenue growth (+2.8%)
-7.9%
+2.8%
+28.8%
Share of Revenue: 33.8% 48.0% 18.2%

11
Robust non-voice revenue growth supported steady aggregate revenue and healthy fundamental
Optimized revenue structure effectively alleviated operating risk
Non-voice revenue as a % of operating revenue:06: 4.7pp 07: 7.4pp
Enhanced core competitiveness & sustainable development
49,734
RMB Mil
29.1%
64,050
36.5%
+24.9%
Non-Voice Revenue as a % of Operating Revenue2005 2006 2007
24.4%
39,828
Strategic Transformation Gaining Momentum
Accomplishments+28.8%
21.1%( 14.2% yoy)
VAS & Integrated Information Services
Managed Data, Leased Line & Others
InternetAccess
30.0%( 35.4% yoy) 48.9%
( 32.1% yoy)
Non-Voice Revenue
Non-Voice Revenue Composition in 2007

12
27.3% yoy35.4% yoy
VAS & Integrated Information Services
32.9% yoyBroadband Access
InvestmentRevenue
CAPEX
CAPEX as a % of Operating Revenue
RMB Mil
28.8%
26.0%
49,116
45,55845,000
2006 2007 2008E
CAPEX
-7.2%-1.2%
Continuous CAPEX reduction leads to progressive decline of depreciation & amortization expenses as a % of operating revenue and enhances operating return
Tilting investments towards transformationbusiness to drive revenue
Vs. 07E saving of RMB1,442 mil
Reducing CAPEX to enhance return; Optimizing structure to
promote developmentInclude an extraRMB960 mil due
to snowstorm

13
Performance ofBeijing Telecom in 2007
Revenue: RMB2,455 mil
Net Profit: RMB470 mil
Acquisition of Beijing Telecom
RMB5,557 million
RMB5,557 million
China Telecommunications
Group
China Telecom Corporation LimitedLeveraging the business
opportunities in the capital city (political, economic and
cultural center)
Enhancing services to our key government & enterprise
customers with headquarters in Beijing
Note: The above financial data are unaudited and IFRS-based
Earnings Accretive Acquisition

14
Dividend Per Share
HKD
0.085 0.085
2006 2007
Dividend
The Board of Directors recommended a final dividend
of HKD0.085 for 2007
Proper balance between shareholders’ cash return demand and company’s future investment needs, especially the funding requirement for coming full services offerings

15
Driving Transformation to Enhance Value
Seize Leading Advantages in Information Services
Customer-focused
Market Segmentation
Capturing Opportunities
Seize Leading Advantages in Information Services
Customer-focused
Market Segmentation
Capturing Opportunities
Integrated and bundled services of
fixed and mobile businesses
Integrated development of fixed
and mobile broadband
Integrated and bundled services of
fixed and mobile businesses
Integrated development of fixed
and mobile broadband
Integrated Information Services
Provider
Integrated Information Services
Provider
FMCFMC
Quadruple Play
Quadruple Play
Enhancing Shareholders’ ValueEnhancing Shareholders’ Value
Enriching Customers’ LifeEnriching Customers’ Life
Talents Pool
Brand Management
Capital Accumulation
Network Enhancement
Information Services
Talents Pool
Brand Management
Capital Accumulation
Network Enhancement
Information Services
Fixed + Mobile+ +
Media + Data
Fixed + Mobile+ +
Media + Data
Customer-focused Innovative Informatization
Strategies
Customer-focused Innovative Informatization
StrategiesFull Services
OfferingFull Services
Offering
Proactive Preparation for Full Services Operations

BusinessR E V I E W

17
Share of Operating Revenue
2006(RMB Mil) Growth2007
(RMB Mil)
Revenue Breakdown
17.9%32.1%31,34023,724Internet Access
40.1%-9.8%70,42478,074Sub-total
100%
7.7%
11.0%
7.9%
15.4%
24.1%
14.4%
1.6%
2.8%175,362170,645Total
14.2%13,47911,807Managed Data, Leased Line & Others
35.4%19,23114,203VAS & Integrated Information Services
-1.5%13,87914,095Interconnections
-6.0%27,00928,742Long Distance
-8.3%42,34346,188Local Usage Fees
-12.5%25,34628,973Monthly Fees
-6.1%2,7352,913Upfront Installation Fees
Local Voice

18
Local Voice Business
Mil 220.3223.0
2006.12 2007.12
Household
Government & Enterprise
Individual62.7
15.522.5
122.3
24.8
121.8
58.0
15.7Public Telephone
PAS PAS
Local Voice Business
Usage Revenue
422,562406,268
-3.9%PulsesMil
RMB Mil -9.8%
78,07470,424
2006 2007
Public Telephone
Consolidating Traditional Businesses via effective bundling with Transformation Businesses
Government & Enterprise customers: Promoting “BizNavigator” to stabilize usage
-Revenue 11.2% yoy
Household customers: Leveraging “One Home” to consolidate household market
-Revenue 4.3% yoy
Individual customers: Severechallenge due to intensified mobile substitution especially on PAS
-Revenue 13.9% yoy
To strengthen bundled packages to consolidate high-end PAS subs while strictly controlling marketing expense on low-end customers to ensure return
2006 2007
Access Lines in Services

19
Market Share by Usage
Long Distance Business
Domestic Long Distance
International Long Distance
Consolidating Long Distance Business
Usage Revenue
95,567 98,251
+2.8%Minutes Mil
32.8%39.2%
RMB Mil -5.4%
25,517 24,127
13.8%15.0%
Usage Revenue
1,601 1,588
-0.8%Minutes Mil
42.5%45.8%
RMB Mil -10.6%
3,225 2,882
1.6%1.9%
Long Distance Revenue as a % of Operating Revenue
Intensified competition in long distance market led to continuous decline in average unit price; avoiding direct price competition and stimulating long distance usage by customized bundling packages
- DLD usage 2.8% yoy- ILD usage relatively stable
Leveraging flexible strategies to promote integrated development of voice and integrated information services
2006 2006
2006 2006
2007 2007
2007 2007

20
Broadband Business
2006.12 2007.12
28.3235.65
7.307.33
Net Adds
Mil +25.9%
Subs
77 80
+32.9%
2006 2007
23,147
30,768
Access Revenue
Broadband ARPU (RMB)
RMB Mil
Office Automation
SecurityControl
OnlineMusic
SearchEngine
ERPSystems
OnlineVideo
VirtualNetwork
e-administrationSystems VOIP e-Payment
…… e-Trading ……
Government &Government &EnterpriseEnterprise
Household &Household &IndividualIndividual
Profitable Scale Development with Differentiated Operations
Broadband subs 7.33 mil with ARPU slightly increased to RMB 80 in 2007
To realize wireless access roaming for broadband subs by enriching means and convenience of access
To fully implement broadband account number operation & promote co-operation and customization of terminal devices, Internet applications and content
To strengthen interactive promotion of Internet access & application businesses
InternetBankingSystems
Broadband

21
20072006
14,20319,231
RMB Mil
VAS & Integrated Information Services
Revenue
+35.4%
Strategies
Revenue Growth & Mix in 2007
11.0%
VAS & Integrated Information Services Revenue as a % of Operating Revenue
19.5% 56.0% 108.1% 90.1% 155.5%
415.8%
69.8%
12.6% 8.4% 2.2% 3.8% 3.2%
Revenue Growth
Revenue Mix
Note: * Fixed-line VAS mainly includes Caller-ID, Telephone Information Services, SMS & Color Ring Tone**Internet VAS mainly includes VNet, IDC, IP/VPDN
8.3%
Fixed-line VAS*
Internet VAS**
IT Services & Applications
Enterprise Informatization
Applications
Best Tone Video Applications
Fixed-line VAS: Focus on services like fixed-line color ring-tone, fixed-line payment, phone-radio…to increase VAS penetration and promote scale development
Internet VAS: Integrate VNet with content resources and enrich Internet applications like searching, digital music, One Home customer terminals... to enhance customer brand value and stimulate consumption
Integrated Information Services: Consolidate telephone number resource services and explore demand from government & enterprise customers to promote the scale development of Best Tone and IT Services & Applications

22
InformatizationInformatization DevelopmentDevelopment
Enhance value through integrated &
differentiated services
Enhance value through integrated &
differentiated services
IPIPCommunicationsCommunications
Information Information TechnologyTechnology
InformationInformationServicesServices
CustomerCustomer--focusedfocused
Focus on converged
areas of “3Is”
Focus on converged
areas of “3Is”
Leverage extensive
communications infrastructure
Leverage extensive
communications infrastructure
Scale Development of Transformation Businesses
Golden Golden OpportunityOpportunity
Excavate new informatization demand
from customers
Customer-focused operation & resource
allocation
Excavate new informatization demand
from customers
Customer-focused operation & resource
allocation

FinancialPerformance
24
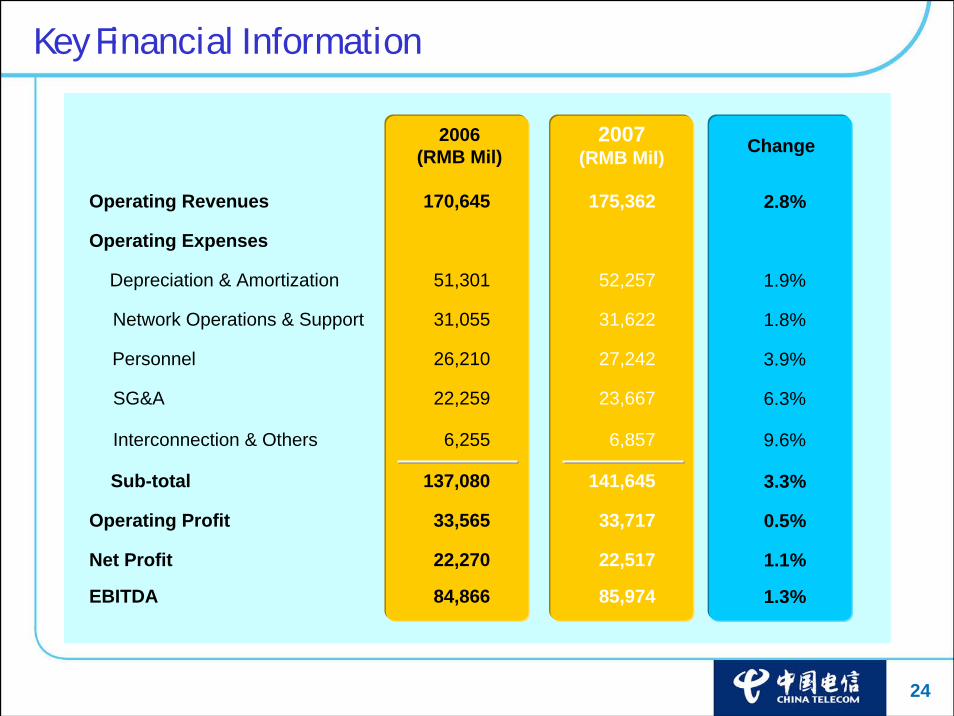
2006(RMB Mil)
2007(RMB Mil) Change
3.3%141,645137,080Sub-total
1.3%
1.1%
0.5%
9.6%
6.3%
3.9%
1.8%
1.9%
2.8%
85,974
22,517
33,717
6,857
23,667
27,242
31,622
52,257
175,362
84,866EBITDA
22,270Net Profit
33,565Operating Profit
6,255Interconnection & Others
22,259SG&A
26,210Personnel
31,055Network Operations & Support
51,301Depreciation & Amortization
Operating Expenses
170,645Operating Revenues
Key Financial Information

25
2007 Revaluation
Property, Plant & Equipment Revaluation
RMB Mil
Revaluation Surplus
Revaluation Deficit
4,809
(2,755)
Per IFRS:Revaluation Surplus EquityRevaluation Deficit Income Statement
Revalued PPE every 3 years per IFRS. Overall net revaluation surplus showed good asset quality
RMB22,517 milAdjusted net profit:
2,109 milEx-revaluation deficit & related tax impact:
(3,294) milEx-upfront connection fees:
RMB23,702 milIFRS-based net profit:

26
Operating Expenses
Depreciation & Amortization
Network Operations & Support
SG&A
Personnel
80.8%
Interconnection & Others
29.8%
18.1%
15.5%
13.5%
3.9%2006 2007
Cost Structure
Operating Expenses as a % of Operating Revenue
80.3%
30.1%
18.2%
15.4%
13.0%
3.6%

27
Optimized Cost Structure to Support Business Development
Cost Initiatives 2007 Results
Depreciation &AmortizationReduced depreciation as a % of operating revenue continuously via strict CAPEX control & enhanced resource utilization
Network Operations & SupportTilted and smoothed resource allocation towards transformation businesses to support development
PersonnelEnhanced employees’ incentive & strengthened recruitment of IP, IT and IS talents
SG&APromoted brand operation & transformation businesses, enhanced customer retention but strictly controlled PAS handset subsidy
Depreciation &AmortizationRMB52,257 mil (-0.3 pp as a % of operating revenue)
Network Operations & SupportRMB31,622 mil (-0.1 pp as a % of operating revenue)
PersonnelRMB27,242 mil (maintained relatively stable as a % of operating revenue)
SG&ARMB23,667 mil (+0.5 pp as a % of operating revenue)
Depreciation &AmortizationRMB52,257 mil (-0.3 pp as a % of operating revenue)
Network Operations & SupportRMB31,622 mil (-0.1 pp as a % of operating revenue)
PersonnelRMB27,242 mil (maintained relatively stable as a % of operating revenue)
SG&ARMB23,667 mil (+0.5 pp as a % of operating revenue)
Strengthened cost control
Optimized cost structure
Maintained relatively stableEBITDA margin
Strengthened cost control
Optimized cost structure
Maintained relatively stableEBITDA margin

28
CAPEX Structure
Enhanced CAPEX Structure
RMB Mil
2006 2007 Note: *Others include communication infrastructure and
other capital expenditure
49,116 45,558
10.5%
23.3%
29.5%
7.7%
18.9%
43.7%
24.0%
20.1%6.0%
2.4%
Enhanced CAPEX structure to support strategic transformation
Internet & Data 37.4% yoy
IT Support -
Fixed Line Switches 31.9% yoy
Local Transmission & Access 22.2% yoy
PAS 63.4% yoy
Others 24.8% yoy
Tilting investment to improve network capability for supporting transformation businesses while strictly controlling CAPEX on traditional business
6.7%
7.2%
Internet & Data
IT Support
Fixed Line SwitchesLocal Transmission& AccessPAS
Others*

29
Solid Financial Strength
RMB Mil
35.5%
2006 2007
28,99130.8%33,964
Total Debt / Total Capitalization Free Cash Flow
+17.2%-4.7pp
2006 2007
1.21
2006 2007
0.98
Net Debt / EBITDA
-0.23x
Solid financial fundamental and strong cash flow proactively equSolid financial fundamental and strong cash flow proactively equip the ip the Company to capture future growth opportunitiesCompany to capture future growth opportunities
30
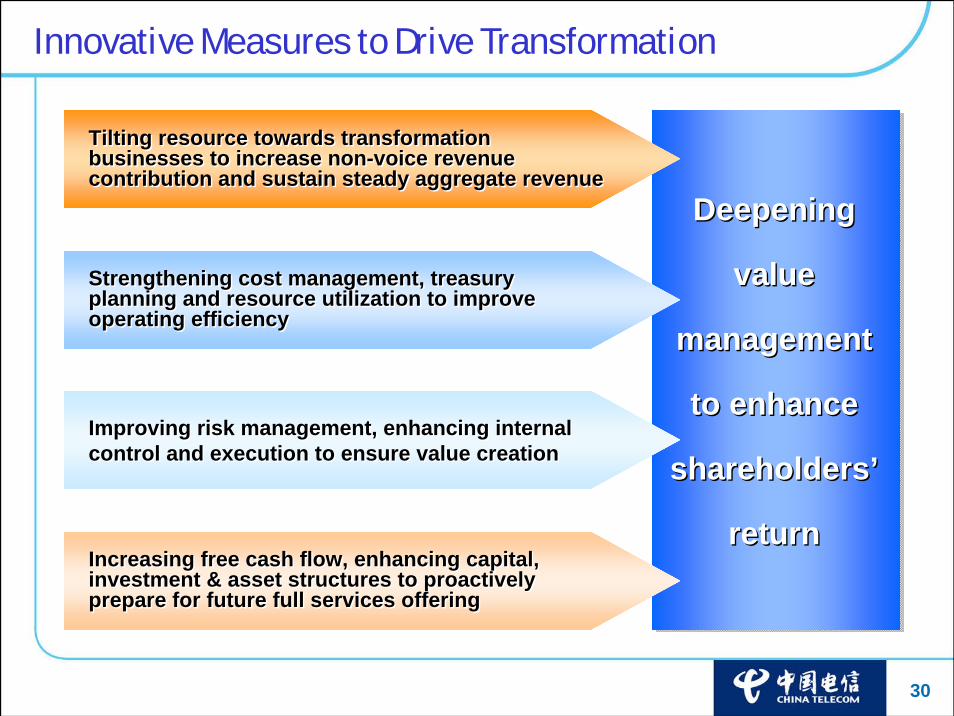
Tilting resource towards transformation businesses to increase non-voice revenue contribution and sustain steady aggregate revenue
Tilting resource towards transformation businesses to increase non-voice revenue contribution and sustain steady aggregate revenue
Deepening
value
management
to enhance
shareholders’
return
Deepening
value
management
to enhance
shareholders’
return
Improving risk management, enhancing internal control and execution to ensure value creationImproving risk management, enhancing internal control and execution to ensure value creation
Innovative Measures to Drive Transformation
Increasing free cash flow, enhancing capital, investment & asset structures to proactively prepare for future full services offering
Increasing free cash flow, enhancing capital, investment & asset structures to proactively prepare for future full services offering
Strengthening cost management, treasury planning and resource utilization to improve operating efficiency
Strengthening cost management, treasury planning and resource utilization to improve operating efficiency

31
ThankY O U
www.chinatelecom-h.com

32
2006(Restated)*
2007
(2,755)-Revaluation Deficit
23,70227,241Equity Holders of the Company
30,25134,083Profit Before Taxation
(141,645)(137,080)Operating Expenses
97
23,799(6,452)
295
(4,300)
3,294
178,656
83Minority Interests
27,324Profit for the Year(6,759)Income Tax
36Investment Loss, Share of Profit from Associates
(4,489)Net Finance Costs
4,971Upfront Connection Fees
175,616Operating Revenues
Extracted from audited consolidated income statementfor the year ended 31 Dec 2007 (incl. upfront connection fees)Appendix 1
Note: *Restated to include the financial impact of acquisition of China Telecom (HK), China Telecom (Americas) and China Telecom System Integration
RMB Mil

33
Extracted from audited consolidated balance sheet as at 31 Dec 2007(incl. upfront connection fees)
2006 (Restated)*
1,4511,448Minority Interests
185,632211,222Total Liabilities
408,004418,871Total Assets
220,921
222,372
47,095
138,537
365,324
42,680
206,201Equity Attributable to Equity Holders of the Company
207,649Total Equity
53,593Non-current Liabilities
157,629Current Liabilities
374,665Non-current Assets
44,206Current Assets
2007
Appendix 2
RMB Mil
Note: *Restated to include the financial impact of acquisition of China Telecom (HK), China Telecom (Americas) and China Telecom System Integration

34
Detailed operating revenues breakdownfor the year ended 31 Dec 2007 (incl. upfront connection fees)
2006 (Restated)*
2007
Appendix 3
Note: *Restated to include the financial impact of acquisition of China Telecom (HK), China Telecom (Americas) and China Telecom System Integration
3,0133,080Managed Data
13,87914,095Interconnections
19,23114,203VAS & Integrated Information Services
5,3214,548Leased Line5,1454,179Others
178,656175,616Total
42,34346,188Local Usage fees24,12725,517DLD
70,42478,074Local Voice Business
31,340
2,882
25,3462,735
3,294
23,724Internet Access
3,225ILD
28,973Monthly Fees2,913Upfront Installation Fees
4,971Upfront Connection Fees
RMB Mil