css long term control plan update - alexandriava.gov for... · css long term control plan update...
TRANSCRIPT
CSS Long Term Control Plan Update
Basis for Cost Opinions
City of Alexandria Department of Transportation and Environmental Quality
FINAL – October 2015
City of Alexandria Department of Transportation and Environmental Services
Long Term Control Plan Update
Basis for Cost Opinions
Table of Contents
i
Section 1 Introduction ............................................................................................... 1-1
1.1 Accuracy and Range ........................................................................................................ 1-1
Section 2 Stormwater Flow ....................................................................................... 2-1
2.1 Green Infrastructure ......................................................................................................... 2-1
2.1.1 Bioretention ...................................................................................................................... 2-1
2.1.2 Permeable Pavement ....................................................................................................... 2-1
2.1.3 Rain Barrels ..................................................................................................................... 2-2
2.2 On-Site Underground Retention/Detention ...................................................................... 2-2
2.3 Vegetated Swales ............................................................................................................ 2-3
Section 3 Combined Flow .......................................................................................... 3-1
3.1 Inflow Reduction ............................................................................................................... 3-1
3.2 Regulator Overflow Facilities............................................................................................ 3-1
3.3 Retention Basins and Storage Tanks ............................................................................... 3-3
3.4 Pump Stations .................................................................................................................. 3-6
3.5 Sewer Separation ........................................................................................................... 3-10
3.6 Tunneling ....................................................................................................................... 3-10
3.6.1 Tunnel ............................................................................................................................ 3-11
3.6.2 Drop Shafts .................................................................................................................... 3-13
Section 4 Land Costs ................................................................................................. 4-1
Section 5 Operation and Maintenance Costs .......................................................... 5-1
Section 6 Net Present Worth Analysis ..................................................................... 6-1
Section 7 References ................................................................................................. 7-1
City of Alexandria Department of Transportation and Environmental Services
Long Term Control Plan Update
Basis for Cost Opinions
Table of Contents
ii
List of Tables
Table 2-1 Unit Costs of Select Permeable Pavement Project .................................................................................... 2-2
Table 3-1 Costs of CSO Regulators for Selected Projects ......................................................................................... 3-2
Table 3-2 Costs of Retention Basins for Selected Municipalities ............................................................................... 3-4
Table 3-3 Costs of Pump Stations ............................................................................................................................. 3-7
Table 3-4 Capital Cost of CSO Separation Projects in Alexandria and Washington DC .......................................... 3-10
Table 3-5 Cost Data for Tunnels in Soil ................................................................................................................... 3-11
Table 3-6 Tunnel Unit Costs .................................................................................................................................... 3-13
Table 3-7 Drop Shaft Unit Costs .............................................................................................................................. 3-14
Table 4-1 Land Cost Basis ......................................................................................................................................... 4-1
Table 5-1 Maintenance Cost Basis ............................................................................................................................ 5-1
Table 6-1 Present Worth Assumptions ...................................................................................................................... 6-1
List of Figures
Figure 3-1 Design Diversion Flow vs. 2014 Construction Cost for CSO Regulators .................................................. 3-3
Figure 3-2 Storage Tank Volume vs. 2014 Construction Costs ................................................................................. 3-6
Figure 3-3 Pump Station Capacity vs. 2014 Construction Costs ............................................................................... 3-9
Figure 3-4 Unit Cost Curve for Tunnels in Soil ......................................................................................................... 3-12
City of Alexandria Department of Transportation and Environmental Services
Long Term Control Plan Update
Basis for Cost Opinions
Section 1
1-1
Section 1 Introduction
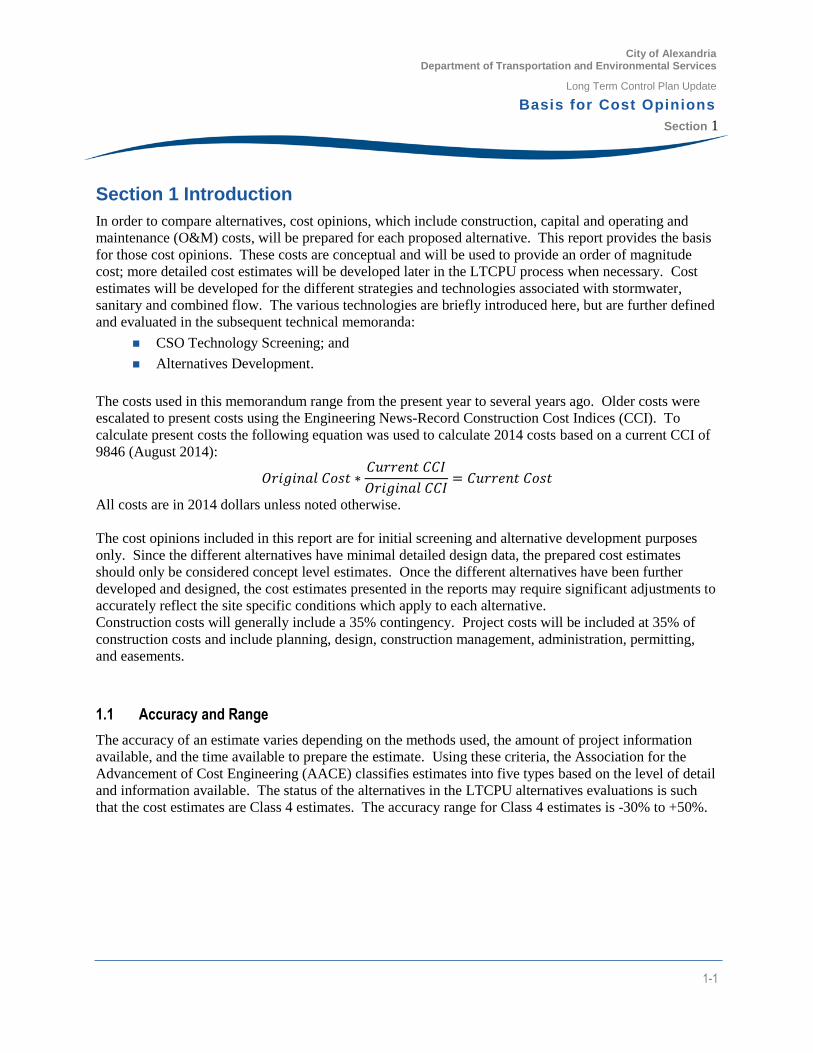
In order to compare alternatives, cost opinions, which include construction, capital and operating and
maintenance (O&M) costs, will be prepared for each proposed alternative. This report provides the basis
for those cost opinions. These costs are conceptual and will be used to provide an order of magnitude
cost; more detailed cost estimates will be developed later in the LTCPU process when necessary. Cost
estimates will be developed for the different strategies and technologies associated with stormwater,
sanitary and combined flow. The various technologies are briefly introduced here, but are further defined
and evaluated in the subsequent technical memoranda:
CSO Technology Screening; and
Alternatives Development.
The costs used in this memorandum range from the present year to several years ago. Older costs were
escalated to present costs using the Engineering News-Record Construction Cost Indices (CCI). To
calculate present costs the following equation was used to calculate 2014 costs based on a current CCI of
9846 (August 2014):
𝑂𝑟𝑖𝑔𝑖𝑛𝑎𝑙 𝐶𝑜𝑠𝑡 ∗𝐶𝑢𝑟𝑟𝑒𝑛𝑡 𝐶𝐶𝐼
𝑂𝑟𝑖𝑔𝑖𝑛𝑎𝑙 𝐶𝐶𝐼= 𝐶𝑢𝑟𝑟𝑒𝑛𝑡 𝐶𝑜𝑠𝑡
All costs are in 2014 dollars unless noted otherwise.
The cost opinions included in this report are for initial screening and alternative development purposes
only. Since the different alternatives have minimal detailed design data, the prepared cost estimates
should only be considered concept level estimates. Once the different alternatives have been further
developed and designed, the cost estimates presented in the reports may require significant adjustments to
accurately reflect the site specific conditions which apply to each alternative.
Construction costs will generally include a 35% contingency. Project costs will be included at 35% of
construction costs and include planning, design, construction management, administration, permitting,
and easements.
1.1 Accuracy and Range
The accuracy of an estimate varies depending on the methods used, the amount of project information
available, and the time available to prepare the estimate. Using these criteria, the Association for the
Advancement of Cost Engineering (AACE) classifies estimates into five types based on the level of detail
and information available. The status of the alternatives in the LTCPU alternatives evaluations is such
that the cost estimates are Class 4 estimates. The accuracy range for Class 4 estimates is -30% to +50%.
City of Alexandria Department of Transportation and Environmental Services
Long Term Control Plan Update
Basis for Cost Opinions
Section 2
2-1
Section 2 Stormwater Flow
2.1 Green Infrastructure
Unit costs for the implementation of each of the Green Infrastructure (GI) technologies are based on
reviews of local, regional, and national sources of data to determine reasonable cost ranges for
implementing the selected GI practices. Due to the urban nature of the combined sewer area and the
associated complications that are likely to occur (including issues such as existing infrastructure and
utilities, limited construction access, and smaller project footprints), it was generally assumed that
implementation costs would be at the higher end of documented construction costs. It was also
assumed that most, if not all, of the GI work would be in the form of retrofits (as opposed to new
construction) which also adds considerably to project costs as a result of the above-mentioned
constraints.
2.1.1 Bioretention
Bioretention facilities can be known by many names, including bioretention basins, bioretention filters, or
rain gardens, among others. These names are sometimes based on the size (with rain gardens typically
referring to smaller scale facilities) and/or functionality (without or without underdrains), but all act in the
same manner. Bioretention refers to the utilization of soils and plants to remove pollutants from
stormwater runoff. This runoff is eventually conveyed to a treatment area which can consist of a grass
buffer strip, sand bed, ponding area, mulch layer, an engineered soil media consisting of sand, soil and
organic matter and plants capable of resisting inundation periods followed by dry periods.
In a 2012 technical memorandum produced by DC Water titled Technical Memorandum No. 6: Green
Infrastructure Technologies, estimated that residential BMPs have a cost between $5 and $12 per square
foot. Larger scale installations and industrial installations are estimated to cost between $15 and $60 per
square foot (District of Columbia Water and Sewer Authority, 2012). In the Old Town area of
Alexandria, a value of $60 per square foot is recommended.
2.1.2 Permeable Pavement
Permeable pavement systems are infiltration systems in which stormwater runoff infiltrates through voids
in the pavement surface into an underlying gravel base reservoir and to the ground. Some examples of
permeable pavement systems include porous asphalt, porous concrete, modular perforated concrete
blocks, interlocking concrete pavers, and cobble pavers. These systems are designed to treat the rainfall
over the pavement surface area. Permeable pavements control runoff volume while also reducing
pollutants and nutrients in the stormwater runoff.
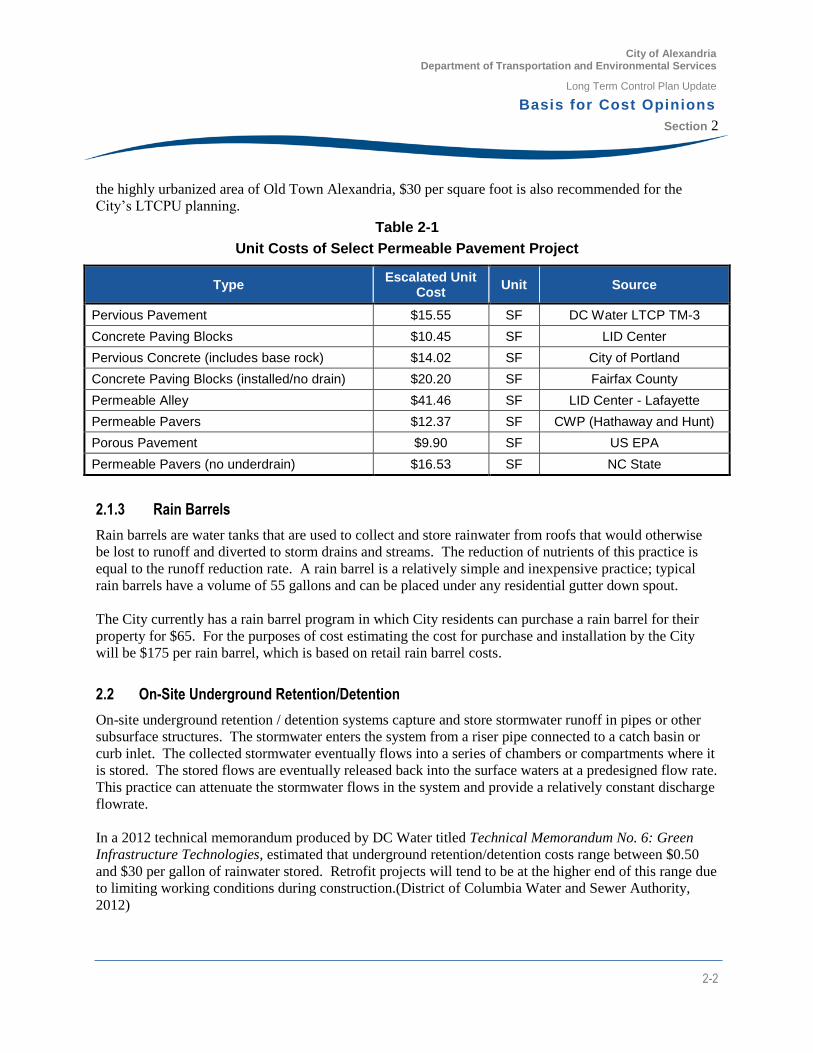
In a 2012 technical memorandum produced by DC Water titled Technical Memorandum No. 7: Green
Infrastructure Screening Analysis for the Potomac River and Rock Creek estimated permeable pavements
to have a cost of approximately $30 per square foot. Porous asphalt tends to have a lowest unit cost and
pervious pavers are typically the most expensive (District of Columbia Water and Sewer Authority,
2012). Select data from the 2012 report are summarized in Table 2-1. Due the challenges associated with
City of Alexandria Department of Transportation and Environmental Services
Long Term Control Plan Update
Basis for Cost Opinions
Section 2
2-2
the highly urbanized area of Old Town Alexandria, $30 per square foot is also recommended for the
City’s LTCPU planning.
Table 2-1
Unit Costs of Select Permeable Pavement Project
Type Escalated Unit
Cost Unit Source
Pervious Pavement $15.55 SF DC Water LTCP TM-3
Concrete Paving Blocks $10.45 SF LID Center
Pervious Concrete (includes base rock) $14.02 SF City of Portland
Concrete Paving Blocks (installed/no drain) $20.20 SF Fairfax County
Permeable Alley $41.46 SF LID Center - Lafayette
Permeable Pavers $12.37 SF CWP (Hathaway and Hunt)
Porous Pavement $9.90 SF US EPA
Permeable Pavers (no underdrain) $16.53 SF NC State
2.1.3 Rain Barrels
Rain barrels are water tanks that are used to collect and store rainwater from roofs that would otherwise
be lost to runoff and diverted to storm drains and streams. The reduction of nutrients of this practice is
equal to the runoff reduction rate. A rain barrel is a relatively simple and inexpensive practice; typical
rain barrels have a volume of 55 gallons and can be placed under any residential gutter down spout.
The City currently has a rain barrel program in which City residents can purchase a rain barrel for their
property for $65. For the purposes of cost estimating the cost for purchase and installation by the City
will be $175 per rain barrel, which is based on retail rain barrel costs.
2.2 On-Site Underground Retention/Detention
On-site underground retention / detention systems capture and store stormwater runoff in pipes or other
subsurface structures. The stormwater enters the system from a riser pipe connected to a catch basin or
curb inlet. The collected stormwater eventually flows into a series of chambers or compartments where it
is stored. The stored flows are eventually released back into the surface waters at a predesigned flow rate.
This practice can attenuate the stormwater flows in the system and provide a relatively constant discharge
flowrate.
In a 2012 technical memorandum produced by DC Water titled Technical Memorandum No. 6: Green
Infrastructure Technologies, estimated that underground retention/detention costs range between $0.50
and $30 per gallon of rainwater stored. Retrofit projects will tend to be at the higher end of this range due
to limiting working conditions during construction.(District of Columbia Water and Sewer Authority,
2012)
City of Alexandria Department of Transportation and Environmental Services
Long Term Control Plan Update
Basis for Cost Opinions
Section 2
2-3
2.3 Vegetated Swales
Vegetated swales, or bioswales, are broad and shallow channels composed of a dense stand of vegetation
covering the sides and the bottom of the channel. Swales are designed to trap particulate pollutants,
promote infiltration and reduce the velocity of stormwater runoff. In general, swales are most effective in
areas with low flow and smaller populations. They can be used in high density urban areas along
roadways where space is limited and being used as a landscape feature.
In a 2012 technical memorandum produced by DC Water titled Technical Memorandum No. 6: Green
Infrastructure Technologies, estimated that vegetated swales costs range between $20,000 and $30,000
per acre of impervious treated.(District of Columbia Water and Sewer Authority, 2012)
City of Alexandria Department of Transportation and Environmental Services
Long Term Control Plan Update
Basis for Cost Opinions
Section 3
3-1
Section 3 Combined Flow
3.1 Inflow Reduction
Inflow reduction can be described as the practice to reduce the amount of storm water runoff that enters
the combined sewer system (CSS). Technologies used to minimize inflow include: basement sump pump
redirection, flow restriction and flow slipping, roof drain redirection, stormwater infiltration sumps, and
stream diversion.
Some buildings tend to have sump pumps that deliver floodwater from basements into the CSS.
Basement sump pump redirection involves redirecting this flow away from the CSS and to lawns, dry
wells or drainfields, where the flow can permeate into the ground. Soil conditions such as porosity, slope
and type need to be taken into account when implementing this strategy. Rebates are normally used to
encourage homeowners to participate in basement sump pump redirection programs.
Flow restriction and flow slipping techniques employ roads and overland flow routes to temporarily store
storm water on the surface or to convey water away from the CSS. Flow restriction is accomplished by
limiting the rate at which surface runoff enters the CSS. Flow slipping is achieved by intentionally
routing or slipping the entry of surface runoff into the CSS and allowing the runoff to travel through
overland flow routes. Some examples of flow restriction and flow slipping devices include flow
restricting orifice devices for catch basins and catch basin covers. Flow restricting orifice devices range
from $800 to $1,900 per device (2014 dollars). Catch basin covers, which can be thought of as a steel
plate cost at least $150 (U.S. Environmental Protection Agency, September 1999).
Stormwater infiltration sumps are underground structures designed to collect storm runoff and convey it
into the surrounding soil. The system consists of a manhole chamber, which serves as a sedimentation
basin, and an attached infiltration sump chamber. Once the flow in the manhole chamber reaches an
overflow point, the infiltration sump chamber will begin to fill and eventually the perforations in this
second chamber should allow the water to permeate outward into the ground. Costs are estimated to
range from $3 to $12 per 1,000 gallons (2014 dollars) of inflow removed per year (U.S. Environmental
Protection Agency, September 1999).
3.2 Regulator Overflow Facilities
Regulator overflow facilities for CSS areas are designed to control the amount of flow that enters an
interceptor from the upstream system and provide an overflow point, the CSO, for flows that exceed the
capacity of the interceptor. Regulators are generally built to intercept any wet-weather flow and can be
configured to control CSO frequency and volume. These structures can be classified into two groups,
static regulators or dynamic regulators. Static regulators refer to structures that have no moving parts and
cannot be adjusted without manual changes or structural modifications. Examples of static regulators are
weirs, restricted outlets, swirl concentrators and vortex valves. Dynamic regulators refer to structures that
have a range of settings which allow varying volumes of flow to be intercepted and diverted in response
to flow conditions. Some examples of dynamic regulators are inflatable dams, hydraulic gates, and float-
controlled gates.
City of Alexandria Department of Transportation and Environmental Services
Long Term Control Plan Update
Basis for Cost Opinions
Section 3
3-2
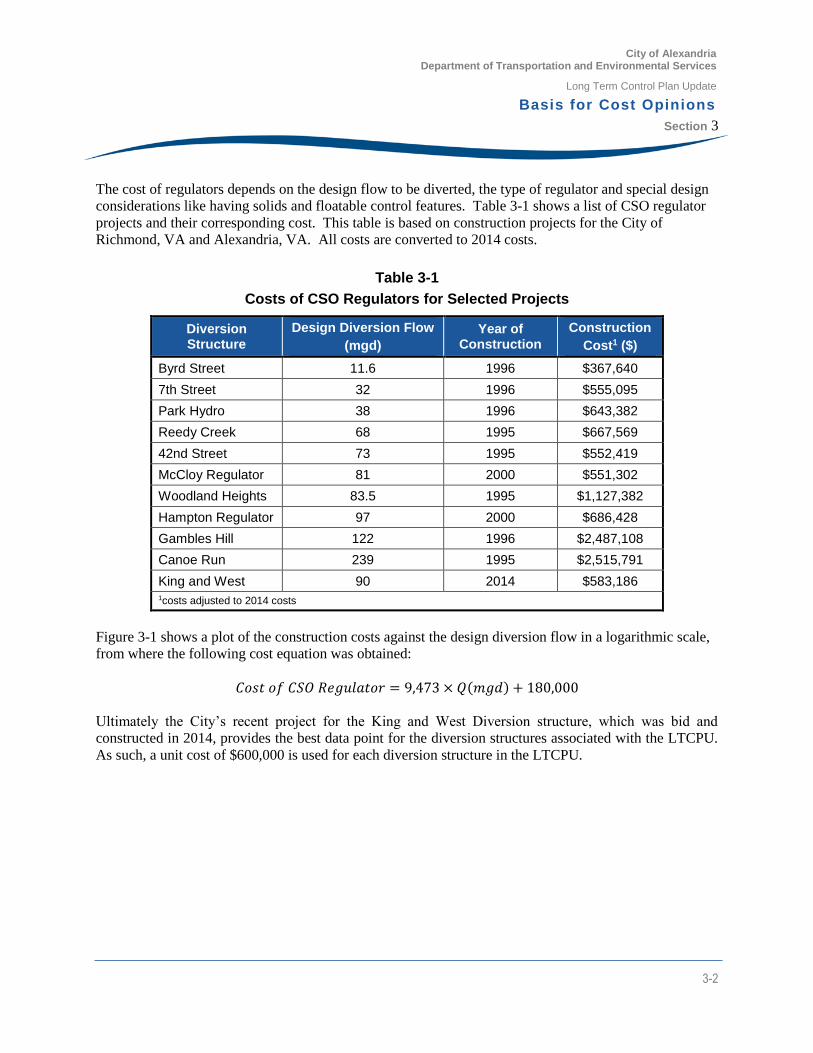
The cost of regulators depends on the design flow to be diverted, the type of regulator and special design
considerations like having solids and floatable control features. Table 3-1 shows a list of CSO regulator
projects and their corresponding cost. This table is based on construction projects for the City of
Richmond, VA and Alexandria, VA. All costs are converted to 2014 costs.
Table 3-1
Costs of CSO Regulators for Selected Projects
Diversion Structure
Design Diversion Flow
(mgd)
Year of Construction
Construction
Cost1 ($)
Byrd Street 11.6 1996 $367,640
7th Street 32 1996 $555,095
Park Hydro 38 1996 $643,382
Reedy Creek 68 1995 $667,569
42nd Street 73 1995 $552,419
McCloy Regulator 81 2000 $551,302
Woodland Heights 83.5 1995 $1,127,382
Hampton Regulator 97 2000 $686,428
Gambles Hill 122 1996 $2,487,108
Canoe Run 239 1995 $2,515,791
King and West 90 2014 $583,186 1costs adjusted to 2014 costs
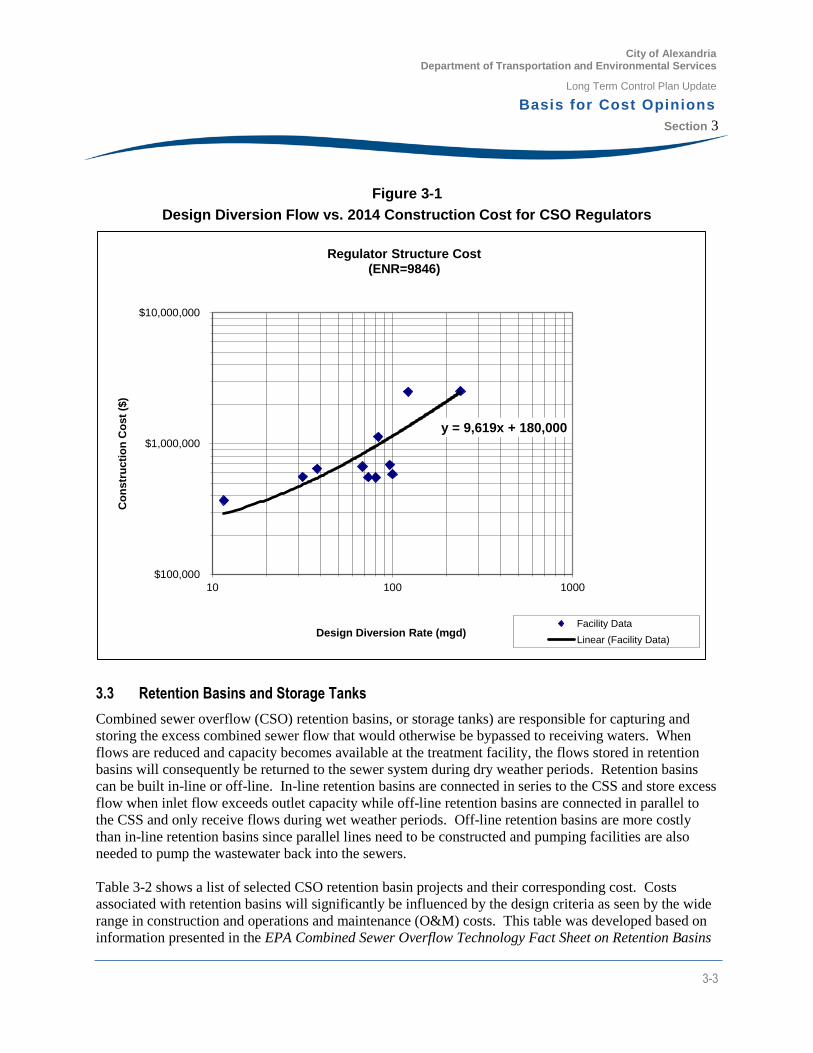
Figure 3-1 shows a plot of the construction costs against the design diversion flow in a logarithmic scale,
from where the following cost equation was obtained:
𝐶𝑜𝑠𝑡 𝑜𝑓 𝐶𝑆𝑂 𝑅𝑒𝑔𝑢𝑙𝑎𝑡𝑜𝑟 = 9,473 × 𝑄(𝑚𝑔𝑑) + 180,000
Ultimately the City’s recent project for the King and West Diversion structure, which was bid and
constructed in 2014, provides the best data point for the diversion structures associated with the LTCPU.
As such, a unit cost of $600,000 is used for each diversion structure in the LTCPU.
City of Alexandria Department of Transportation and Environmental Services
Long Term Control Plan Update
Basis for Cost Opinions
Section 3
3-3
Figure 3-1
Design Diversion Flow vs. 2014 Construction Cost for CSO Regulators
3.3 Retention Basins and Storage Tanks
Combined sewer overflow (CSO) retention basins, or storage tanks) are responsible for capturing and
storing the excess combined sewer flow that would otherwise be bypassed to receiving waters. When
flows are reduced and capacity becomes available at the treatment facility, the flows stored in retention
basins will consequently be returned to the sewer system during dry weather periods. Retention basins
can be built in-line or off-line. In-line retention basins are connected in series to the CSS and store excess
flow when inlet flow exceeds outlet capacity while off-line retention basins are connected in parallel to
the CSS and only receive flows during wet weather periods. Off-line retention basins are more costly
than in-line retention basins since parallel lines need to be constructed and pumping facilities are also
needed to pump the wastewater back into the sewers.
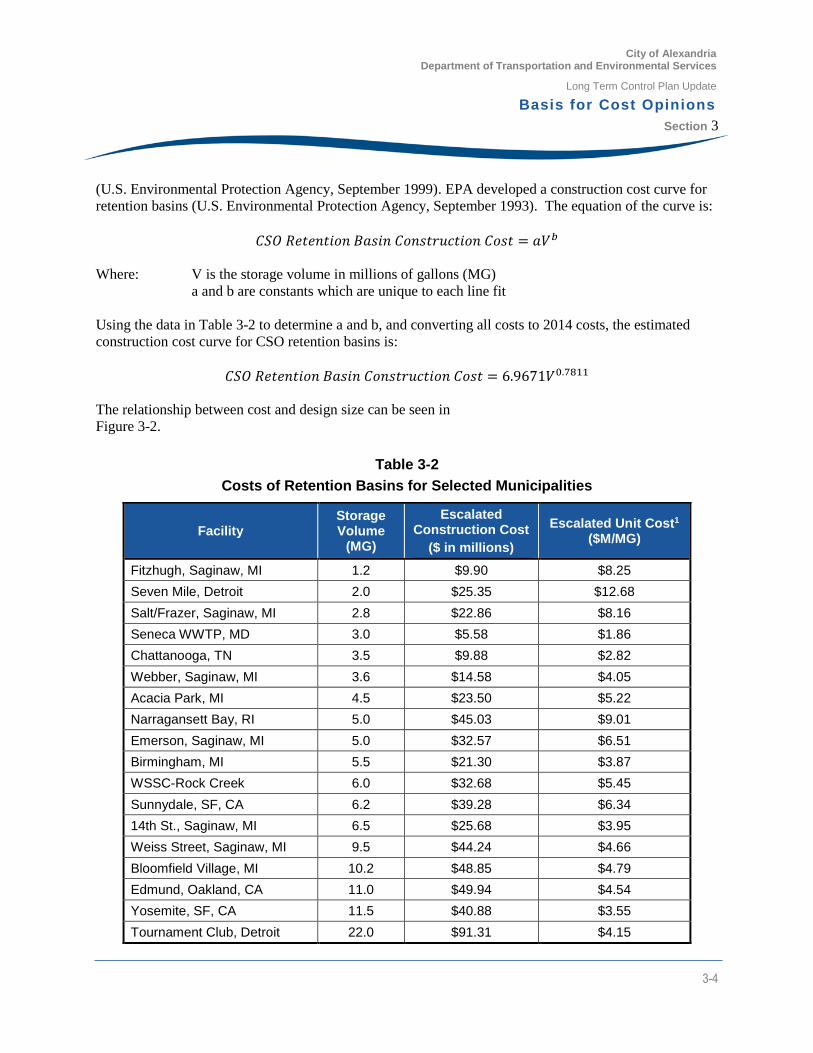
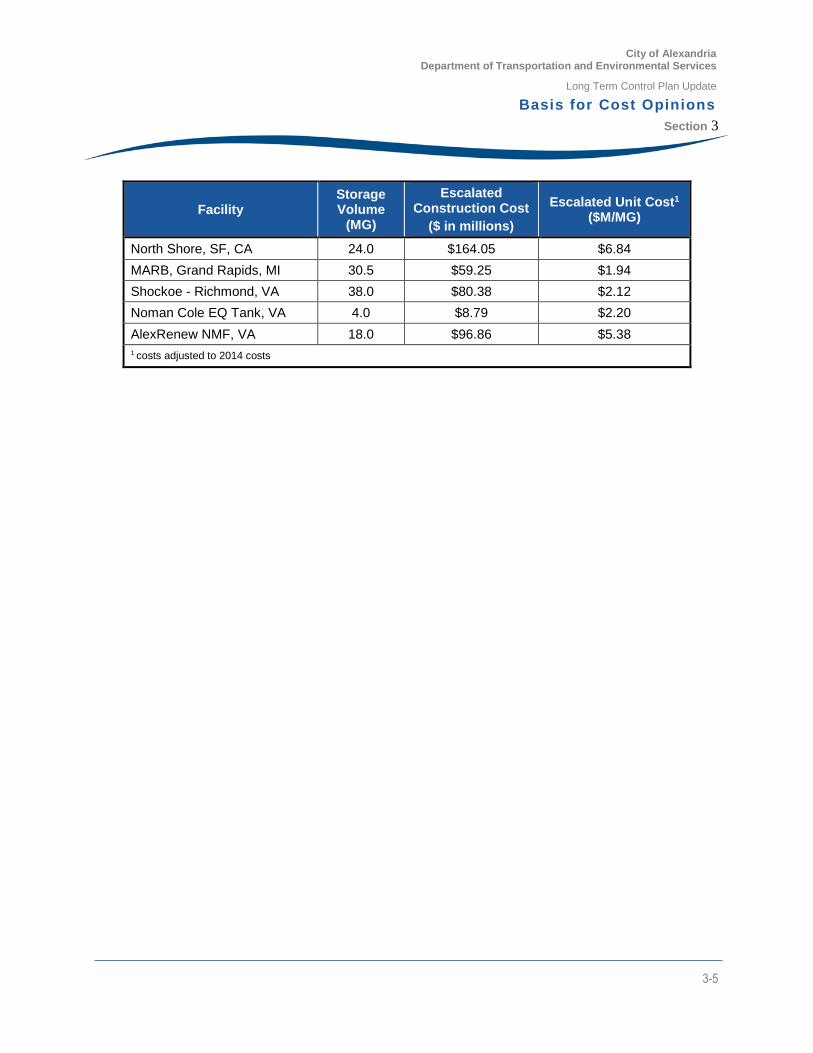
Table 3-2 shows a list of selected CSO retention basin projects and their corresponding cost. Costs
associated with retention basins will significantly be influenced by the design criteria as seen by the wide
range in construction and operations and maintenance (O&M) costs. This table was developed based on
information presented in the EPA Combined Sewer Overflow Technology Fact Sheet on Retention Basins
y = 9,619x + 180,000
$100,000
$1,000,000
$10,000,000
10 100 1000
Co
nstr
ucti
on
Co
st
($)
Design Diversion Rate (mgd)
Regulator Structure Cost(ENR=9846)
Facility Data
Linear (Facility Data)
City of Alexandria Department of Transportation and Environmental Services
Long Term Control Plan Update
Basis for Cost Opinions
Section 3
3-4
(U.S. Environmental Protection Agency, September 1999). EPA developed a construction cost curve for
retention basins (U.S. Environmental Protection Agency, September 1993). The equation of the curve is:
𝐶𝑆𝑂 𝑅𝑒𝑡𝑒𝑛𝑡𝑖𝑜𝑛 𝐵𝑎𝑠𝑖𝑛 𝐶𝑜𝑛𝑠𝑡𝑟𝑢𝑐𝑡𝑖𝑜𝑛 𝐶𝑜𝑠𝑡 = 𝑎𝑉𝑏
Where: V is the storage volume in millions of gallons (MG)
a and b are constants which are unique to each line fit
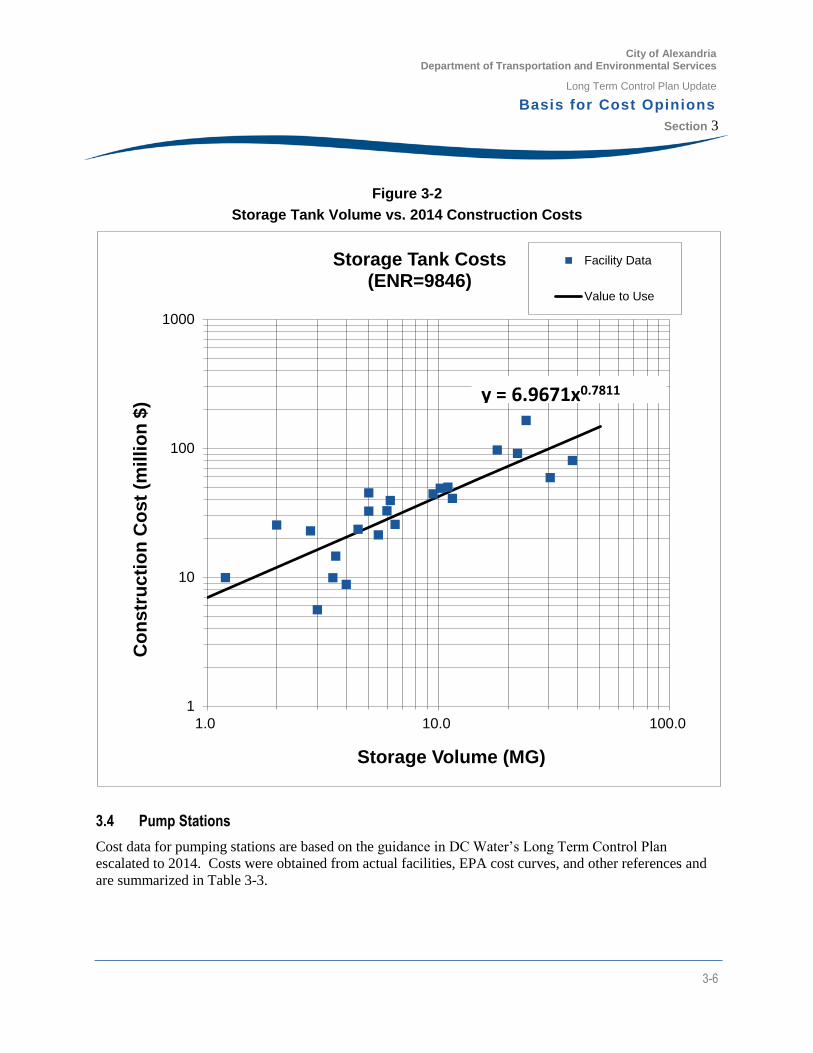
Using the data in Table 3-2 to determine a and b, and converting all costs to 2014 costs, the estimated
construction cost curve for CSO retention basins is:
𝐶𝑆𝑂 𝑅𝑒𝑡𝑒𝑛𝑡𝑖𝑜𝑛 𝐵𝑎𝑠𝑖𝑛 𝐶𝑜𝑛𝑠𝑡𝑟𝑢𝑐𝑡𝑖𝑜𝑛 𝐶𝑜𝑠𝑡 = 6.9671𝑉0.7811
The relationship between cost and design size can be seen in
Figure 3-2.
Table 3-2
Costs of Retention Basins for Selected Municipalities
Facility Storage Volume
(MG)
Escalated Construction Cost
($ in millions)
Escalated Unit Cost1 ($M/MG)
Fitzhugh, Saginaw, MI 1.2 $9.90 $8.25
Seven Mile, Detroit 2.0 $25.35 $12.68
Salt/Frazer, Saginaw, MI 2.8 $22.86 $8.16
Seneca WWTP, MD 3.0 $5.58 $1.86
Chattanooga, TN 3.5 $9.88 $2.82
Webber, Saginaw, MI 3.6 $14.58 $4.05
Acacia Park, MI 4.5 $23.50 $5.22
Narragansett Bay, RI 5.0 $45.03 $9.01
Emerson, Saginaw, MI 5.0 $32.57 $6.51
Birmingham, MI 5.5 $21.30 $3.87
WSSC-Rock Creek 6.0 $32.68 $5.45
Sunnydale, SF, CA 6.2 $39.28 $6.34
14th St., Saginaw, MI 6.5 $25.68 $3.95
Weiss Street, Saginaw, MI 9.5 $44.24 $4.66
Bloomfield Village, MI 10.2 $48.85 $4.79
Edmund, Oakland, CA 11.0 $49.94 $4.54
Yosemite, SF, CA 11.5 $40.88 $3.55
Tournament Club, Detroit 22.0 $91.31 $4.15
City of Alexandria Department of Transportation and Environmental Services
Long Term Control Plan Update
Basis for Cost Opinions
Section 3
3-5
Facility Storage Volume
(MG)
Escalated Construction Cost
($ in millions)
Escalated Unit Cost1 ($M/MG)
North Shore, SF, CA 24.0 $164.05 $6.84
MARB, Grand Rapids, MI 30.5 $59.25 $1.94
Shockoe - Richmond, VA 38.0 $80.38 $2.12
Noman Cole EQ Tank, VA 4.0 $8.79 $2.20
AlexRenew NMF, VA 18.0 $96.86 $5.38
1 costs adjusted to 2014 costs
City of Alexandria Department of Transportation and Environmental Services
Long Term Control Plan Update
Basis for Cost Opinions
Section 3
3-6
Figure 3-2
Storage Tank Volume vs. 2014 Construction Costs
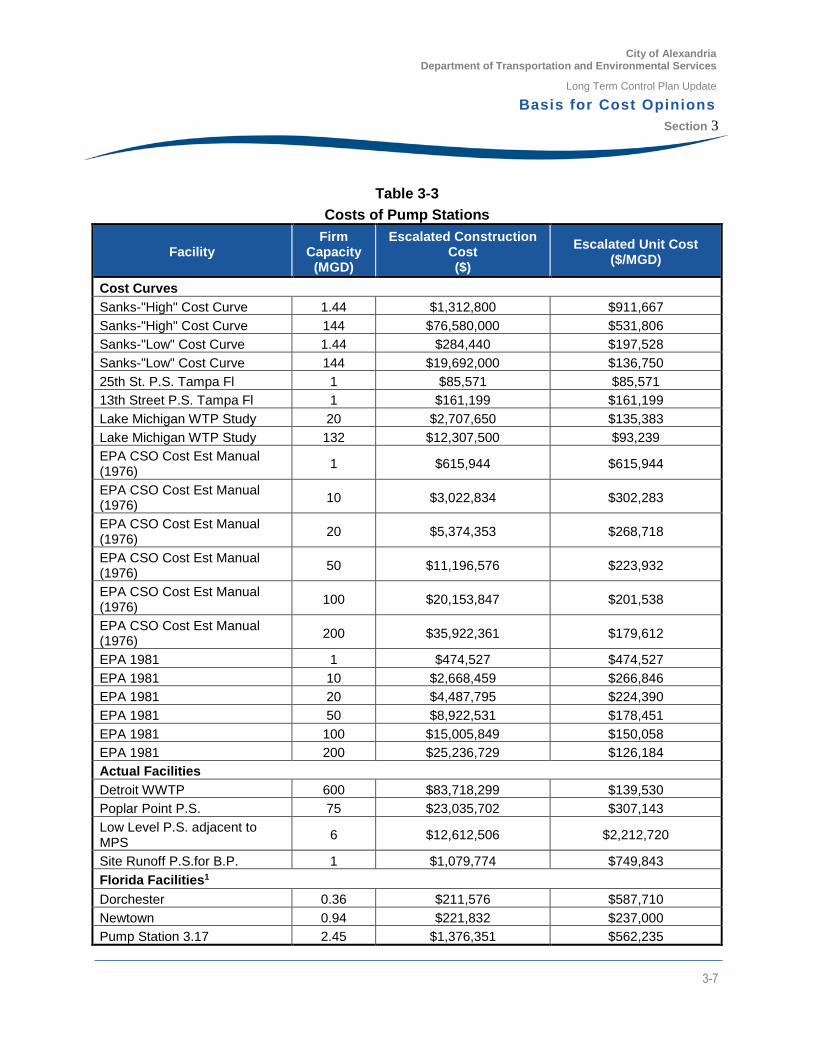
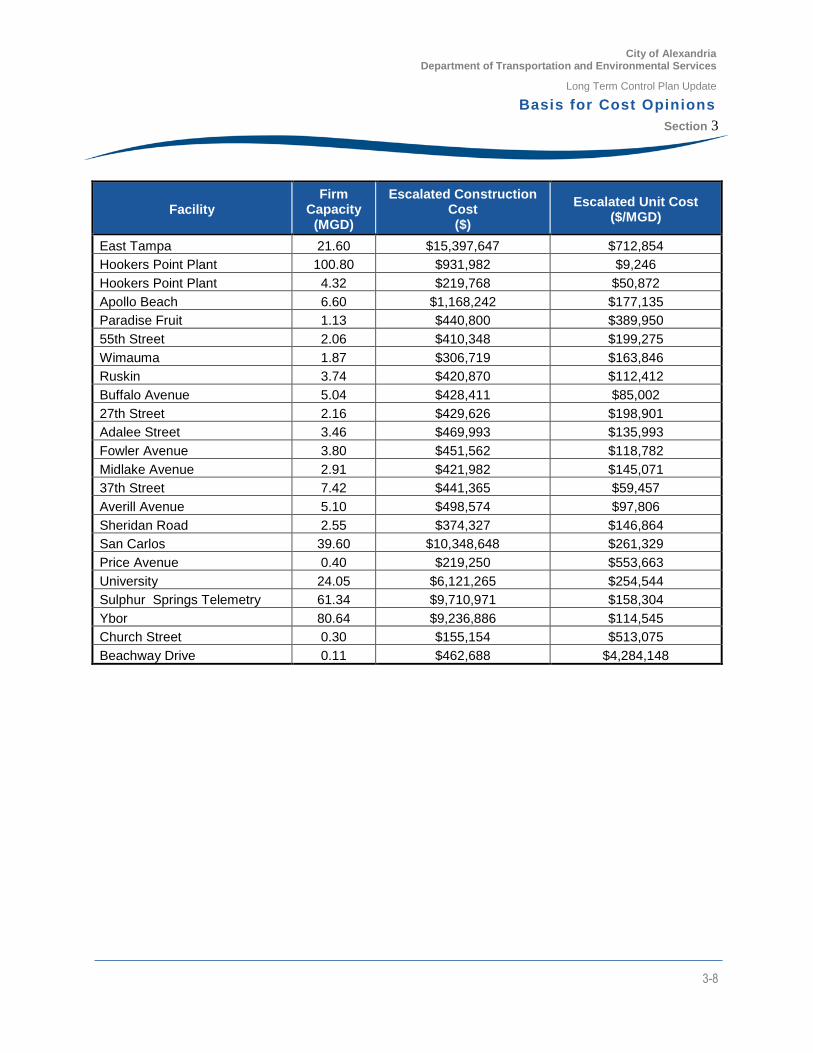
3.4 Pump Stations
Cost data for pumping stations are based on the guidance in DC Water’s Long Term Control Plan
escalated to 2014. Costs were obtained from actual facilities, EPA cost curves, and other references and
are summarized in Table 3-3.
1
10
100
1000
1.0 10.0 100.0
Co
ns
tru
cti
on
Co
st
(mil
lio
n $
)
Storage Volume (MG)
Storage Tank Costs(ENR=9846)
Facility Data
Value to Use
y = 6.9671x0.7811
City of Alexandria Department of Transportation and Environmental Services
Long Term Control Plan Update
Basis for Cost Opinions
Section 3
3-7
Table 3-3
Costs of Pump Stations
Facility Firm
Capacity (MGD)
Escalated Construction Cost ($)
Escalated Unit Cost ($/MGD)
Cost Curves
Sanks-"High" Cost Curve 1.44 $1,312,800 $911,667
Sanks-"High" Cost Curve 144 $76,580,000 $531,806
Sanks-"Low" Cost Curve 1.44 $284,440 $197,528
Sanks-"Low" Cost Curve 144 $19,692,000 $136,750
25th St. P.S. Tampa Fl 1 $85,571 $85,571
13th Street P.S. Tampa Fl 1 $161,199 $161,199
Lake Michigan WTP Study 20 $2,707,650 $135,383
Lake Michigan WTP Study 132 $12,307,500 $93,239
EPA CSO Cost Est Manual (1976)
1 $615,944 $615,944
EPA CSO Cost Est Manual (1976)
10 $3,022,834 $302,283
EPA CSO Cost Est Manual (1976)
20 $5,374,353 $268,718
EPA CSO Cost Est Manual (1976)
50 $11,196,576 $223,932
EPA CSO Cost Est Manual (1976)
100 $20,153,847 $201,538
EPA CSO Cost Est Manual (1976)
200 $35,922,361 $179,612
EPA 1981 1 $474,527 $474,527
EPA 1981 10 $2,668,459 $266,846
EPA 1981 20 $4,487,795 $224,390
EPA 1981 50 $8,922,531 $178,451
EPA 1981 100 $15,005,849 $150,058
EPA 1981 200 $25,236,729 $126,184
Actual Facilities
Detroit WWTP 600 $83,718,299 $139,530
Poplar Point P.S. 75 $23,035,702 $307,143
Low Level P.S. adjacent to MPS
6 $12,612,506 $2,212,720
Site Runoff P.S.for B.P. 1 $1,079,774 $749,843
Florida Facilities1
Dorchester 0.36 $211,576 $587,710
Newtown 0.94 $221,832 $237,000
Pump Station 3.17 2.45 $1,376,351 $562,235
City of Alexandria Department of Transportation and Environmental Services
Long Term Control Plan Update
Basis for Cost Opinions
Section 3
3-8
Facility Firm
Capacity (MGD)
Escalated Construction Cost ($)
Escalated Unit Cost ($/MGD)
East Tampa 21.60 $15,397,647 $712,854
Hookers Point Plant 100.80 $931,982 $9,246
Hookers Point Plant 4.32 $219,768 $50,872
Apollo Beach 6.60 $1,168,242 $177,135
Paradise Fruit 1.13 $440,800 $389,950
55th Street 2.06 $410,348 $199,275
Wimauma 1.87 $306,719 $163,846
Ruskin 3.74 $420,870 $112,412
Buffalo Avenue 5.04 $428,411 $85,002
27th Street 2.16 $429,626 $198,901
Adalee Street 3.46 $469,993 $135,993
Fowler Avenue 3.80 $451,562 $118,782
Midlake Avenue 2.91 $421,982 $145,071
37th Street 7.42 $441,365 $59,457
Averill Avenue 5.10 $498,574 $97,806
Sheridan Road 2.55 $374,327 $146,864
San Carlos 39.60 $10,348,648 $261,329
Price Avenue 0.40 $219,250 $553,663
University 24.05 $6,121,265 $254,544
Sulphur Springs Telemetry 61.34 $9,710,971 $158,304
Ybor 80.64 $9,236,886 $114,545
Church Street 0.30 $155,154 $513,075
Beachway Drive 0.11 $462,688 $4,284,148
City of Alexandria Department of Transportation and Environmental Services
Long Term Control Plan Update
Basis for Cost Opinions
Section 3
3-9
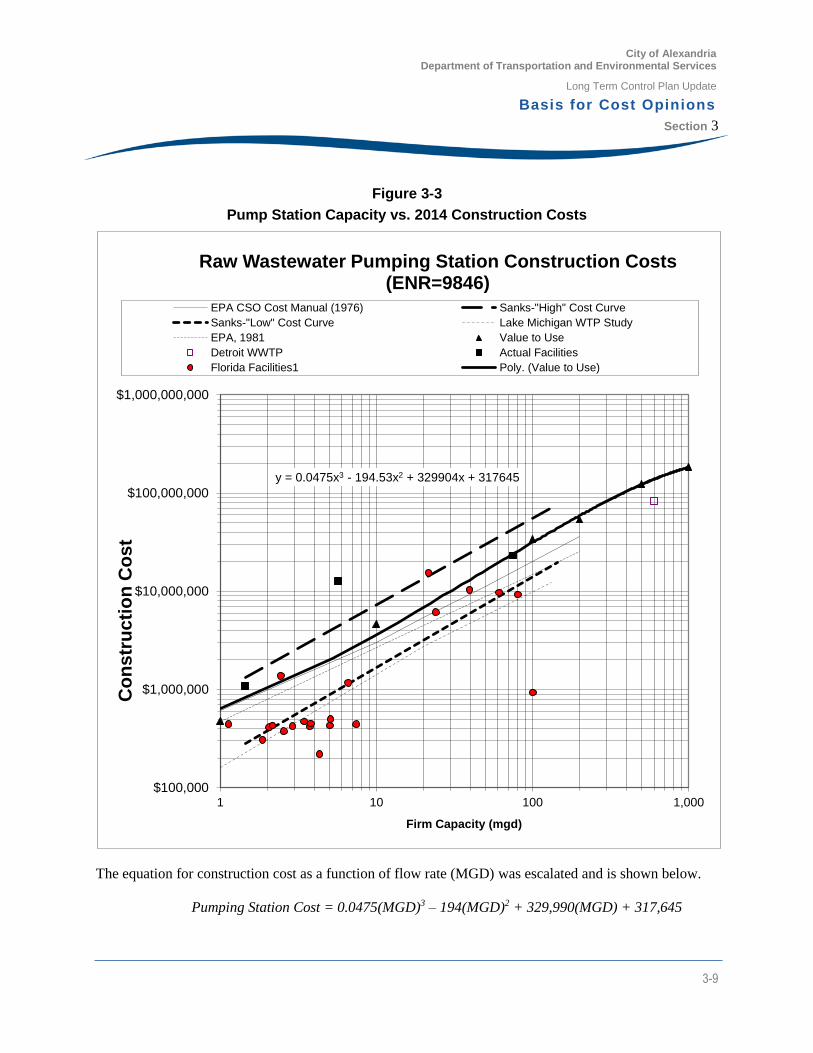
Figure 3-3
Pump Station Capacity vs. 2014 Construction Costs
The equation for construction cost as a function of flow rate (MGD) was escalated and is shown below.
Pumping Station Cost = 0.0475(MGD)3 – 194(MGD)2 + 329,990(MGD) + 317,645
y = 0.0475x3 - 194.53x2 + 329904x + 317645
$100,000
$1,000,000
$10,000,000
$100,000,000
$1,000,000,000
1 10 100 1,000
Co
ns
tru
cti
on
Co
st
Firm Capacity (mgd)
Raw Wastewater Pumping Station Construction Costs(ENR=9846)
EPA CSO Cost Manual (1976) Sanks-"High" Cost Curve
Sanks-"Low" Cost Curve Lake Michigan WTP Study
EPA, 1981 Value to Use
Detroit WWTP Actual Facilities
Florida Facilities1 Poly. (Value to Use)
City of Alexandria Department of Transportation and Environmental Services
Long Term Control Plan Update
Basis for Cost Opinions
Section 3
3-10
3.5 Sewer Separation
Sewer separation refers to the practice of separating the combined pipe system into separate sewers for
sanitary and stormwater flows. This practice can be accomplished by installing a new sanitary sewer and
using the existing combined sewer as a storm sewer or vice versa. The sanitary flows will eventually be
delivered to a treatment plant while the stormwater will be conveyed to a stormwater outfall that
discharges into a receiving water body. This practice prevents that pathogenic bacteria and floatables in
sanitary wastewater for being discharged to receiving waters.
Costs associated with sewer separation can vary considerably due to factors such as the current layout of
the existing sewer system, nearby utilities that will have to be avoided, other infrastructure work,
geotechnical conditions, maintenance of traffic, maintenance of service, and construction method used.
Cost opinions for sewer separation vary widely should be based on site specific information. These
generally represent the “low hanging fruit” and costs are expected to increase as the complexity of the
projects increase.
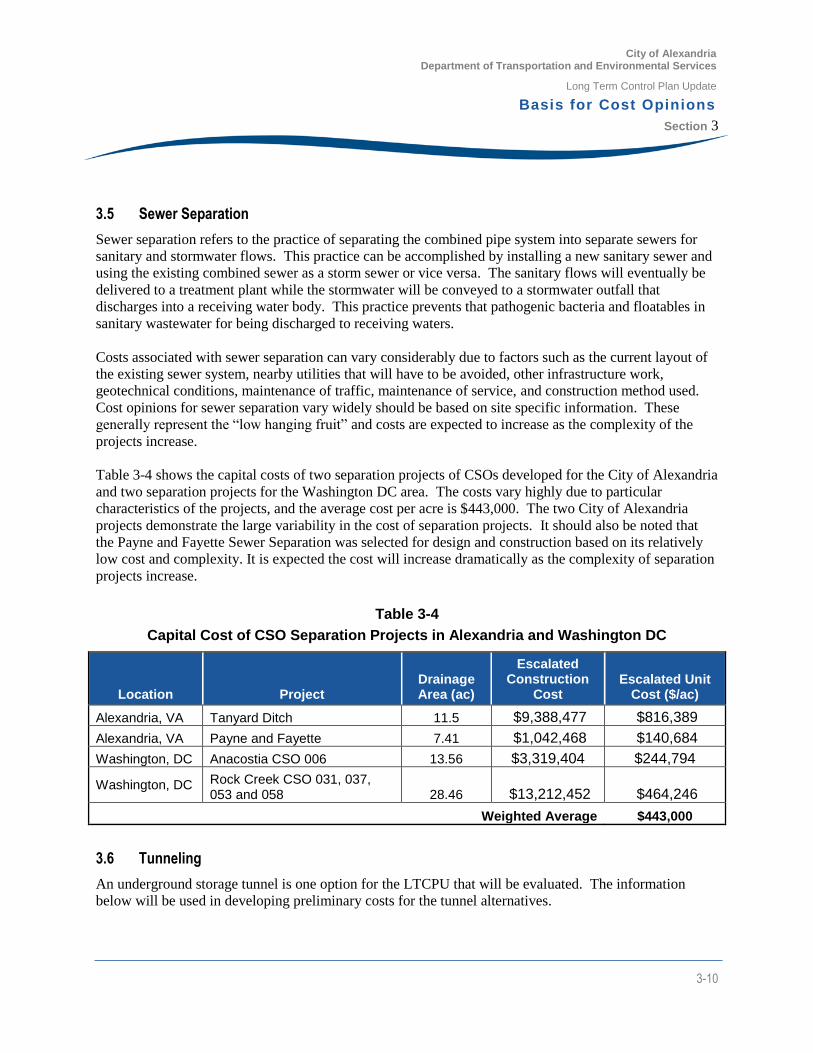
Table 3-4 shows the capital costs of two separation projects of CSOs developed for the City of Alexandria
and two separation projects for the Washington DC area. The costs vary highly due to particular
characteristics of the projects, and the average cost per acre is $443,000. The two City of Alexandria
projects demonstrate the large variability in the cost of separation projects. It should also be noted that
the Payne and Fayette Sewer Separation was selected for design and construction based on its relatively
low cost and complexity. It is expected the cost will increase dramatically as the complexity of separation
projects increase.
Table 3-4
Capital Cost of CSO Separation Projects in Alexandria and Washington DC
Location Project Drainage Area (ac)
Escalated Construction
Cost Escalated Unit
Cost ($/ac)
Alexandria, VA Tanyard Ditch 11.5 $9,388,477 $816,389
Alexandria, VA Payne and Fayette 7.41 $1,042,468 $140,684
Washington, DC Anacostia CSO 006 13.56 $3,319,404 $244,794
Washington, DC Rock Creek CSO 031, 037, 053 and 058 28.46 $13,212,452 $464,246
Weighted Average $443,000
3.6 Tunneling
An underground storage tunnel is one option for the LTCPU that will be evaluated. The information
below will be used in developing preliminary costs for the tunnel alternatives.
City of Alexandria Department of Transportation and Environmental Services
Long Term Control Plan Update
Basis for Cost Opinions
Section 3
3-11
3.6.1 Tunnel
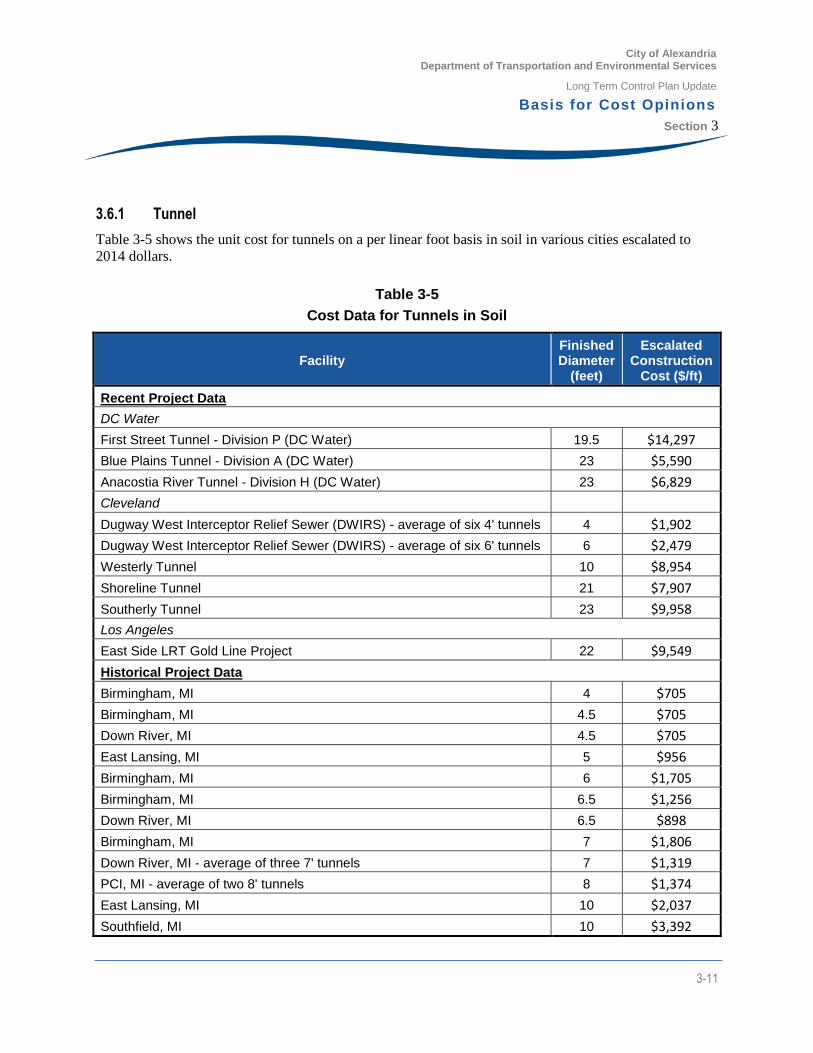
Table 3-5 shows the unit cost for tunnels on a per linear foot basis in soil in various cities escalated to
2014 dollars.
Table 3-5
Cost Data for Tunnels in Soil
Facility Finished Diameter
(feet)
Escalated Construction
Cost ($/ft)
Recent Project Data
DC Water
First Street Tunnel - Division P (DC Water) 19.5 $14,297
Blue Plains Tunnel - Division A (DC Water) 23 $5,590
Anacostia River Tunnel - Division H (DC Water) 23 $6,829
Cleveland
Dugway West Interceptor Relief Sewer (DWIRS) - average of six 4' tunnels 4 $1,902
Dugway West Interceptor Relief Sewer (DWIRS) - average of six 6' tunnels 6 $2,479
Westerly Tunnel 10 $8,954
Shoreline Tunnel 21 $7,907
Southerly Tunnel 23 $9,958
Los Angeles
East Side LRT Gold Line Project 22 $9,549
Historical Project Data
Birmingham, MI 4 $705
Birmingham, MI 4.5 $705
Down River, MI 4.5 $705
East Lansing, MI 5 $956
Birmingham, MI 6 $1,705
Birmingham, MI 6.5 $1,256
Down River, MI 6.5 $898
Birmingham, MI 7 $1,806
Down River, MI - average of three 7' tunnels 7 $1,319
PCI, MI - average of two 8' tunnels 8 $1,374
East Lansing, MI 10 $2,037
Southfield, MI 10 $3,392
City of Alexandria Department of Transportation and Environmental Services
Long Term Control Plan Update
Basis for Cost Opinions
Section 3
3-12
Facility Finished Diameter
(feet)
Escalated Construction
Cost ($/ft)
Birmingham, MI 11 $1,732
Chicago, IL 12 $2,495
PCI, MI 13.5 $5,561
Toledo, OH - average of two 13.5' tunnels 13.5 $3,615
Wyandotte, MI 13.5 $2,720
Cleveland 20 $5,624
Hartford, CT 24.3 $7,590
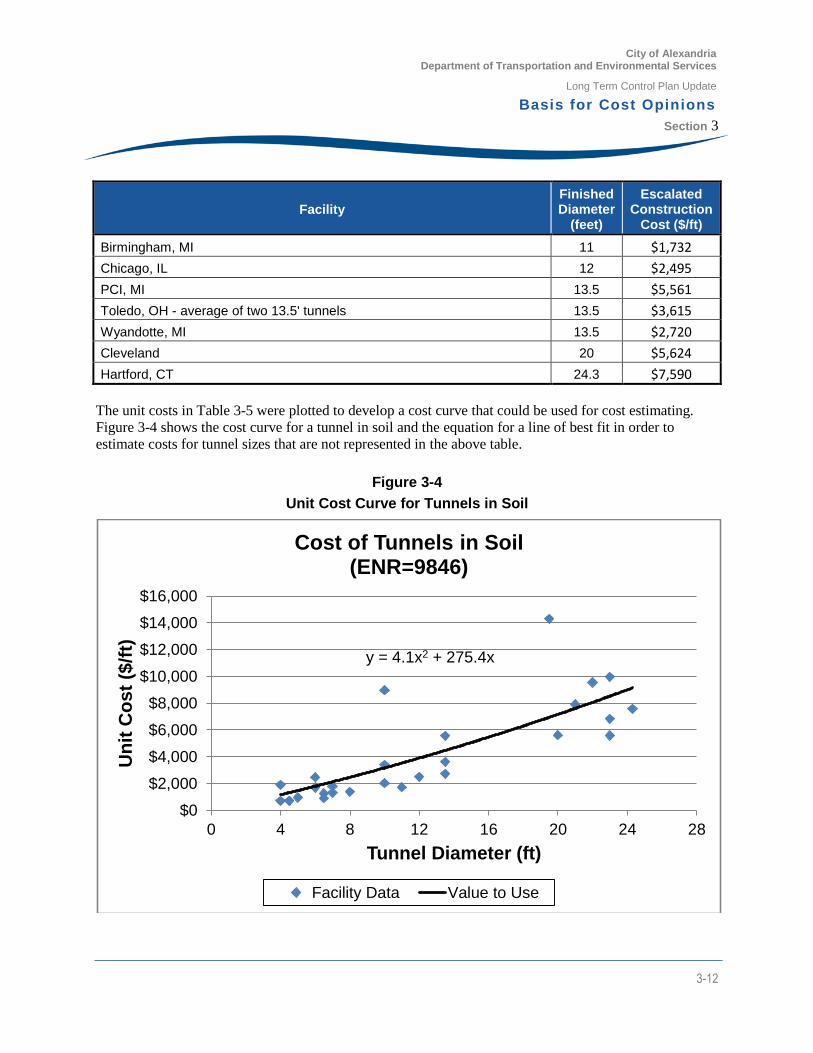
The unit costs in Table 3-5 were plotted to develop a cost curve that could be used for cost estimating.
Figure 3-4 shows the cost curve for a tunnel in soil and the equation for a line of best fit in order to
estimate costs for tunnel sizes that are not represented in the above table.
Figure 3-4
Unit Cost Curve for Tunnels in Soil
y = 4.1x2 + 275.4x
$0
$2,000
$4,000
$6,000
$8,000
$10,000
$12,000
$14,000
$16,000
0 4 8 12 16 20 24 28
Un
it C
os
t ($
/ft)
Tunnel Diameter (ft)
Cost of Tunnels in Soil(ENR=9846)
Facility Data Value to Use
City of Alexandria Department of Transportation and Environmental Services
Long Term Control Plan Update
Basis for Cost Opinions
Section 3
3-13
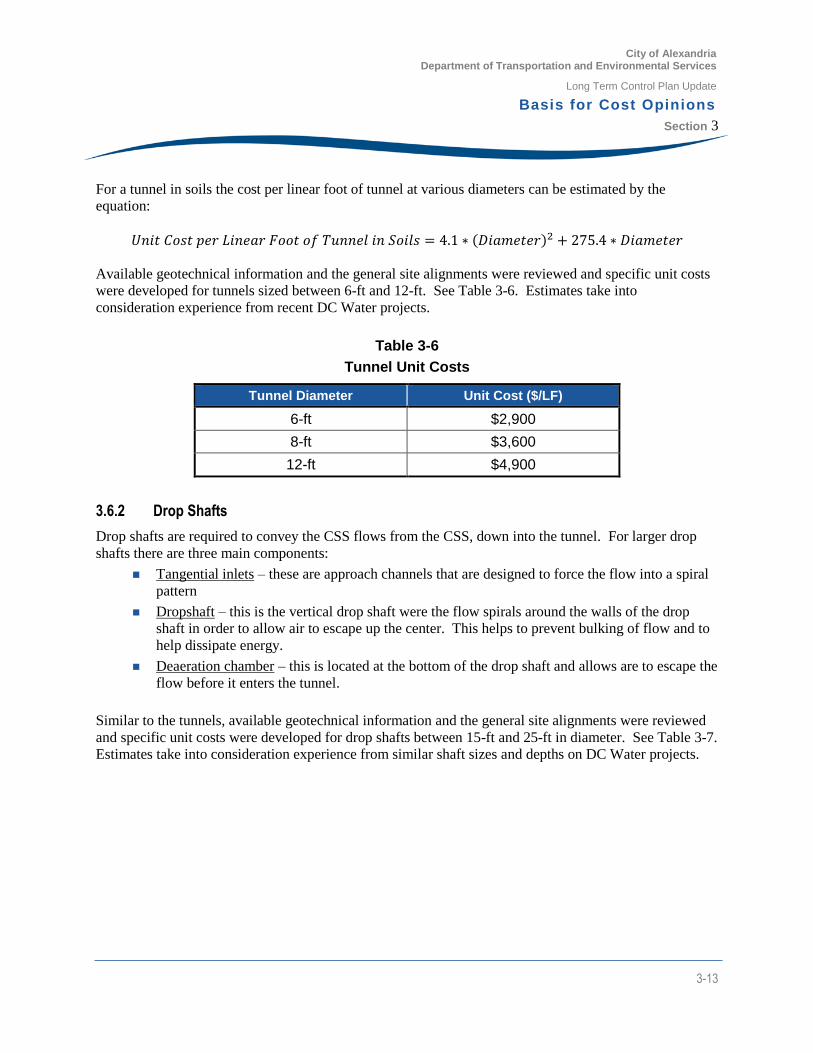
For a tunnel in soils the cost per linear foot of tunnel at various diameters can be estimated by the
equation:
𝑈𝑛𝑖𝑡 𝐶𝑜𝑠𝑡 𝑝𝑒𝑟 𝐿𝑖𝑛𝑒𝑎𝑟 𝐹𝑜𝑜𝑡 𝑜𝑓 𝑇𝑢𝑛𝑛𝑒𝑙 𝑖𝑛 𝑆𝑜𝑖𝑙𝑠 = 4.1 ∗ (𝐷𝑖𝑎𝑚𝑒𝑡𝑒𝑟)2 + 275.4 ∗ 𝐷𝑖𝑎𝑚𝑒𝑡𝑒𝑟
Available geotechnical information and the general site alignments were reviewed and specific unit costs
were developed for tunnels sized between 6-ft and 12-ft. See Table 3-6. Estimates take into
consideration experience from recent DC Water projects.
Table 3-6
Tunnel Unit Costs
Tunnel Diameter Unit Cost ($/LF)
6-ft $2,900
8-ft $3,600
12-ft $4,900
3.6.2 Drop Shafts
Drop shafts are required to convey the CSS flows from the CSS, down into the tunnel. For larger drop
shafts there are three main components:
Tangential inlets – these are approach channels that are designed to force the flow into a spiral
pattern
Dropshaft – this is the vertical drop shaft were the flow spirals around the walls of the drop
shaft in order to allow air to escape up the center. This helps to prevent bulking of flow and to
help dissipate energy.
Deaeration chamber – this is located at the bottom of the drop shaft and allows are to escape the
flow before it enters the tunnel.
Similar to the tunnels, available geotechnical information and the general site alignments were reviewed
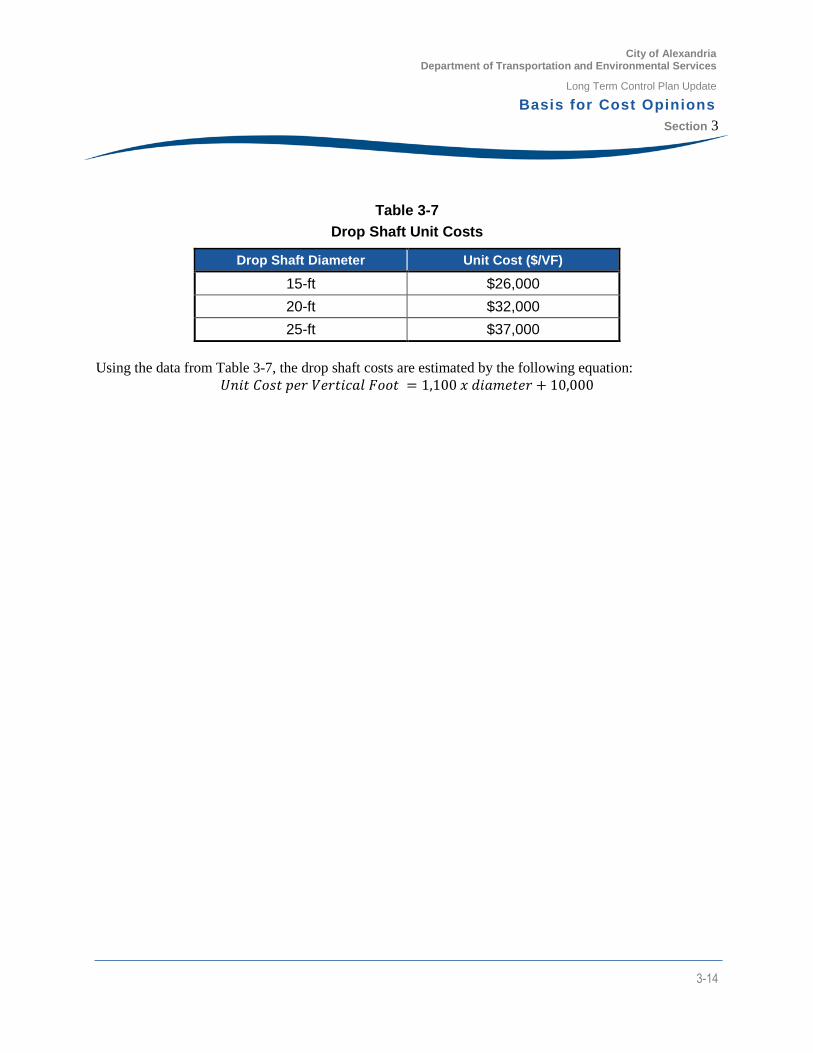
and specific unit costs were developed for drop shafts between 15-ft and 25-ft in diameter. See Table 3-7.
Estimates take into consideration experience from similar shaft sizes and depths on DC Water projects.
City of Alexandria Department of Transportation and Environmental Services
Long Term Control Plan Update
Basis for Cost Opinions
Section 3
3-14
Table 3-7
Drop Shaft Unit Costs
Drop Shaft Diameter Unit Cost ($/VF)
15-ft $26,000
20-ft $32,000
25-ft $37,000
Using the data from Table 3-7, the drop shaft costs are estimated by the following equation:
𝑈𝑛𝑖𝑡 𝐶𝑜𝑠𝑡 𝑝𝑒𝑟 𝑉𝑒𝑟𝑡𝑖𝑐𝑎𝑙 𝐹𝑜𝑜𝑡 = 1,100 𝑥 𝑑𝑖𝑎𝑚𝑒𝑡𝑒𝑟 + 10,000
City of Alexandria Department of Transportation and Environmental Services
Long Term Control Plan Update
Basis for Cost Opinions
Section 4
4-1
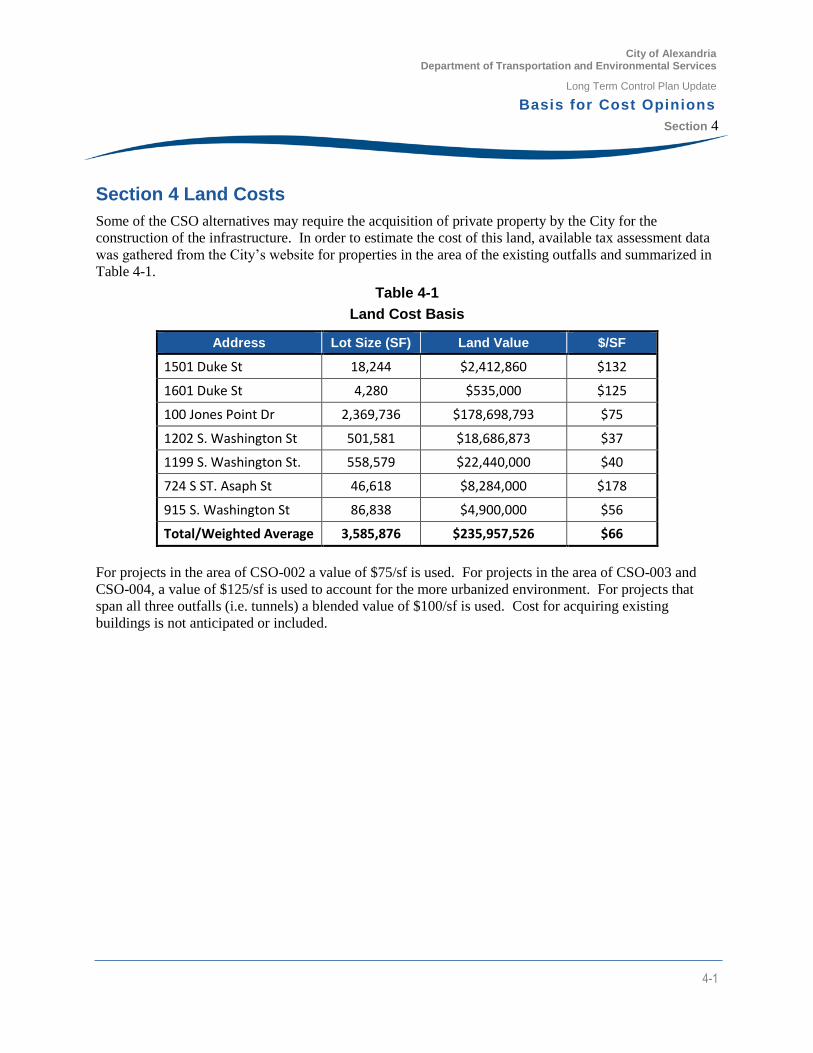
Section 4 Land Costs
Some of the CSO alternatives may require the acquisition of private property by the City for the
construction of the infrastructure. In order to estimate the cost of this land, available tax assessment data
was gathered from the City’s website for properties in the area of the existing outfalls and summarized in
Table 4-1.
Table 4-1
Land Cost Basis
Address Lot Size (SF) Land Value $/SF
1501 Duke St 18,244 $2,412,860 $132
1601 Duke St 4,280 $535,000 $125
100 Jones Point Dr 2,369,736 $178,698,793 $75
1202 S. Washington St 501,581 $18,686,873 $37
1199 S. Washington St. 558,579 $22,440,000 $40
724 S ST. Asaph St 46,618 $8,284,000 $178
915 S. Washington St 86,838 $4,900,000 $56
Total/Weighted Average 3,585,876 $235,957,526 $66
For projects in the area of CSO-002 a value of $75/sf is used. For projects in the area of CSO-003 and
CSO-004, a value of $125/sf is used to account for the more urbanized environment. For projects that
span all three outfalls (i.e. tunnels) a blended value of $100/sf is used. Cost for acquiring existing
buildings is not anticipated or included.
City of Alexandria Department of Transportation and Environmental Services
Long Term Control Plan Update
Basis for Cost Opinions
Section 5
5-1
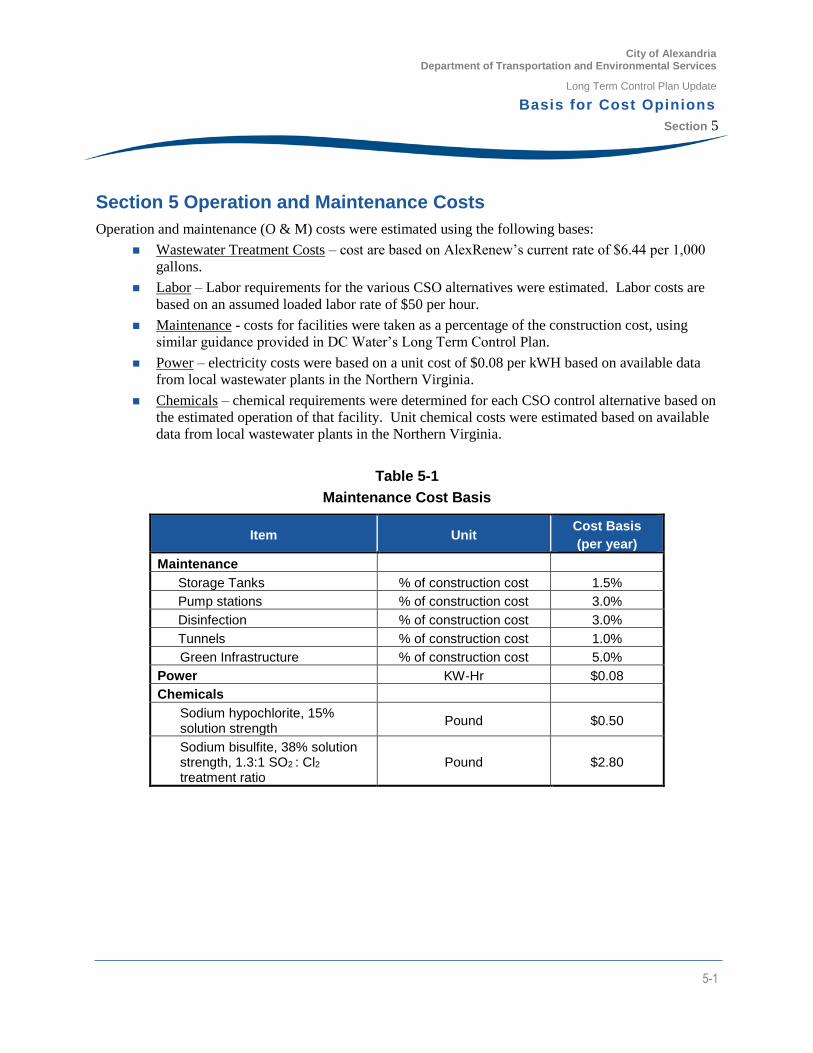
Section 5 Operation and Maintenance Costs
Operation and maintenance (O & M) costs were estimated using the following bases:
Wastewater Treatment Costs – cost are based on AlexRenew’s current rate of $6.44 per 1,000
gallons.
Labor – Labor requirements for the various CSO alternatives were estimated. Labor costs are
based on an assumed loaded labor rate of $50 per hour.
Maintenance - costs for facilities were taken as a percentage of the construction cost, using
similar guidance provided in DC Water’s Long Term Control Plan.
Power – electricity costs were based on a unit cost of $0.08 per kWH based on available data
from local wastewater plants in the Northern Virginia.
Chemicals – chemical requirements were determined for each CSO control alternative based on
the estimated operation of that facility. Unit chemical costs were estimated based on available
data from local wastewater plants in the Northern Virginia.
Table 5-1
Maintenance Cost Basis
Item Unit Cost Basis
(per year)
Maintenance
Storage Tanks % of construction cost 1.5%
Pump stations % of construction cost 3.0%
Disinfection % of construction cost 3.0%
Tunnels % of construction cost 1.0%
Green Infrastructure % of construction cost 5.0%
Power KW-Hr $0.08
Chemicals
Sodium hypochlorite, 15% solution strength
Pound $0.50
Sodium bisulfite, 38% solution strength, 1.3:1 SO2 : Cl2 treatment ratio
Pound $2.80
City of Alexandria Department of Transportation and Environmental Services
Long Term Control Plan Update
Basis for Cost Opinions
Section 6
6-1
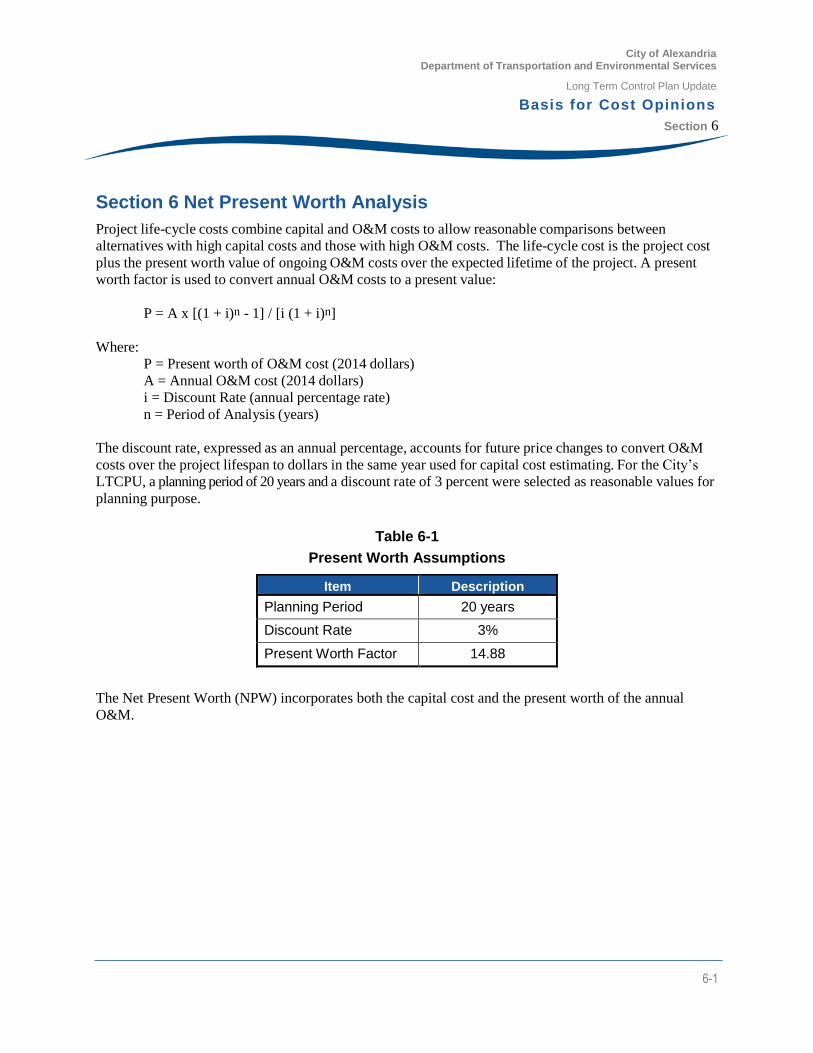
Section 6 Net Present Worth Analysis
Project life-cycle costs combine capital and O&M costs to allow reasonable comparisons between
alternatives with high capital costs and those with high O&M costs. The life-cycle cost is the project cost
plus the present worth value of ongoing O&M costs over the expected lifetime of the project. A present
worth factor is used to convert annual O&M costs to a present value:
P = A x [(1 + i)n - 1] / [i (1 + i)n]
Where:
P = Present worth of O&M cost (2014 dollars)
A = Annual O&M cost (2014 dollars)
i = Discount Rate (annual percentage rate)
n = Period of Analysis (years)
The discount rate, expressed as an annual percentage, accounts for future price changes to convert O&M
costs over the project lifespan to dollars in the same year used for capital cost estimating. For the City’s
LTCPU, a planning period of 20 years and a discount rate of 3 percent were selected as reasonable values for
planning purpose.
Table 6-1
Present Worth Assumptions
Item Description
Planning Period 20 years
Discount Rate 3%
Present Worth Factor 14.88
The Net Present Worth (NPW) incorporates both the capital cost and the present worth of the annual
O&M.
City of Alexandria Department of Transportation and Environmental Services
Long Term Control Plan Update
Basis for Cost Opinions
Section 7
7-1
Section 7 References
Disctrict of Columbia Water and Sewer Authority. (2012). Technical Memorandum No. 7: Green
Infrastructure Screening Analysis for the Potomac River and Rock Creek. Washington DC:
Greeley and Hansen.
District of Columbia Water and Sewer Authority. (2012). Technical Memorandum No. 6: Green
Infrastructure Technologies. Washington, D.C.: DC Water.
Greeley and Hansen LLC. (July 2002). District of Columbia Water and Sewer Authority Combined Sewer
System Long Term Control Plan. Washington, D.C.: Greeley and Hansen LLC. Retrieved from
https://www.dcwater.com/workzones/projects/pdfs/ltcp/Complete%20LTCP%20For%20CD.pdf
U.S. Environmental Protection Agency. (September 1993). Combined Sewer Overflow Control. United
States Environmental Protection Agency, Office of Research and Development. Washington,
D.C.: Office of Research and Development. Retrieved from
http://nepis.epa.gov/Adobe/PDF/30004MAO.pdf
U.S. Environmental Protection Agency. (September 1999). Inflow Reduction. United States
Environmental Protection Agency, Office of Water. Washington, D.C.: Office of Water.
Retrieved from http://water.epa.gov/scitech/wastetech/upload/2002_06_28_mtb_inflwred.pdf
U.S. Environmental Protection Agency. (September 1999). Retention Basins. United States
Environmental Protection Agency, Office of Water. Washington, D.C.: Office of Water.
Retrieved from http://water.epa.gov/scitech/wastetech/upload/2002_06_28_mtb_csoretba.pdf
U.S. Environmental Protection Agency. (September 1999). Storm Water Wetlands. United States
Environmental Protection Agency, Office of Water. Washington, D.C.: Office of Water.
Retrieved from http://water.epa.gov/scitech/wastetech/upload/2007_05_29_mtb_wetlands.pdf
U.S. Environmental Protection Agency. (September 1999). Wet Detention Ponds. United States
Environmental Protection Agency, Office of Water. Washington, D.C.: Office of Water.
Retrieved from http://water.epa.gov/scitech/wastetech/upload/2002_06_28_mtb_wetdtnpn.pdf
Greeley and Hansen LLC 5301 Shawnee Road, Suite 400
Alexandria, VA 22312 571-581-3000
www.greeley-hansen.com