csr activities in india - ekal vidyalaya activities in india ... – ratan tata ... bvss entrusted...
TRANSCRIPT

STUDYFOR
EKAL ABHIYANBY
BHARTIYA VITTA SALAHKAR SAMITI (BVSS)
CSR Activitiesin India
ANALYSIS AND TRENDS

DISCLAIMER
This publication has been compiled and summarized from information available in official documents, circulars, other publically available information and websites of the Government of India, Corporate Houses and NGOs. This Study is intended to serve as a guide to all users and does not purport to be a legal document. In case of any variation between what has been stated in this Study and the relevant Act, Rules etc., the latter shall prevail.
This publication is for information purposes only. Due care has been taken during the compilation of this publication to ensure that the information is current and accurate to the best of our knowledge and belief.
All rights reserved. No part of this publication may be reproduced, stored in a retrieval system, or transmitted, in any form or by any means, including electronic, mechanical, photocopying, recording, or otherwise, without first obtaining written prior permission of Ekal Abhiyan.
Please send the e-feedback on:[email protected]

i
FOREWORD
“Businesses need to go beyond the interest of their companies to the communities they serve” – Ratan Tata
From inactive philanthropy to the incorporation of the stakeholders’ interest in the business model, the Indian business sector practices various methods of discharging its social responsibility. While a lot of human and economic energy is available for utilization in this area, a suitable mechanism was required to channelize this energy. For which the Government, included Corporate Social Responsibility in the newly enacted Companies Act, 2013.
I am pleased to share that Ekal, in association with Bhartiya Vitta Salahkar Samiti (BVSS) has jointly conducted the present study on Corporate Social Responsibility (CSR). The theme of the study is to compare, analyse and understand the behavior of CSR spent during last two years, by top listed companies operating under Government, Family Owned Businesses (FOBs) and Multi-National Companies (MNCs) tag with varied interest in manufacturing and service sector. The study also covers the challenges faced by them and suggestions for better & transparent implementation and presentation.
I hope that this joint study would give rich insight to all the stakeholders and create greater awareness about different aspects relating to CSR together with suggestions to the challenges faced by companies in India.
Dr. Subhash Chandra Member, Rajya Sabha, Chairman, Ekal Global
New DelhiMarch 28, 2017uo lEor~ üú÷þ] pS=k] çfrink


iii
CHAIRMAN’S MESSAGE
Provisions of Companies Act, 2013, relating to Corporate Social Responsibility (CSR) have been used by the government not only to ensure sustainable development for companies, but also to help and support under-privileged section of society living primarily in tribal and rural Bharat.
It has been nearly three years since CSR was mandated and the behavior of spent under CSR is a reality now. Bhartiya Vitta Salahkar Samiti (BVSS) has been addressing issues relating to CSR by oraganising workshops, seminars and discussions. We at BVSS felt that a publication on some critical and comparative study of CSR spent during Financial Year 2014-15 and 2015-16 may be beneficial to various stakeholders including Companies, Government, NPOs, General Public and of course Professionals engaged with CSR.
BVSS entrusted this assignment to its senior professionals CA Anil Sharma and CA Sushil Gupta, who have done an excellent job by putting their time and experience in bringing out this publication and for that I on my behalf and on behalf of BVSS put on record deep gratitude and appreciation for them.
BVSS is also thankful to Ekal Abhiyan for their valuable inputs in carrying out the present endeavor.
The study is also suggesting few inputs for the regulators for improved implementation of CSR provisions.
BVSS is hopeful that the publication shall serve the purpose and shall be a good reference material as the professional update on the subject.
CA Subhash C. Aggarwal
Chairman, Advisory Board - BVSS
New DelhiMarch 28, 2017uo lEor~ üú÷þ] pS=k] çfrink


v
EKAL ABHIYAN
Bringing happiness to tribal and rural communities through education
The heart touching story began in 1983-84 when four young men, all in their prime stage of career decided to give up their lucrative jobs and render their lives in the service of Ma Bharti. The clarion call was given to promising youth by eminent social activist late Shri Bhaurao Deshmukh to serve in remote areas of the country. The nationalistic ideals and burning patriotism became the motivating force, and the firm decision was taken by Shri Ashok Rai (Bhagat), Dr. Mahesh Sharma both alumni from BHU Varanasi, Dr. Rajneesh Arora, IIT Delhi and Late Dr. Rakesh Popli, nuclear scientist from USA to work in remote tribal areas of Jharkhand. Their initial work in the field of Education and Development resulted into the establishment of the first 60 Ekal Schools in Ratanpur Tundi, near Dhanbad (1989-90) by late Shri Madan Lal Agrawala who owned coal mines there. In the meantime Shri Shyam Gupt (Gold-medallist in M.Sc. Physics) a life devotee pracharak and social activist was already involved in educational work in tribal areas of Odisha. He took the reins of Ekal
Vidyalaya and through his social genius and farsightedness, he converted Ekal Schools into an action oriented holistic Model of Social change and Development; a powerful Nation Building tool. Shri Shyamjee infused the spiritual energy in Ekal and made it a People’s Movement, a worldwide Abhiyan.
“Brilliance & Devotion of Ekal Pioneers”
At one hand late Shri Agarwala called upon his industrialist friend late Shri P.D Chitlangia to join him in Kolkata. And Kolkata became the center for urban involvement in Ekal. As a result Friends of Tribals Society (FTS) was established in Kolkata in 1989. Shri Shyamjee by sheer magic of his brilliance, divinity and devotion invoked thousands of Rural/Tribal/Urban youth to come forward and join Ekal as volunteers. There was no dearth of work force at ground. Many business magnets joined Ekal thereafter on his call. The jewel in the crown of Ekal, Dr. Subhash Chandra as chairperson of Ekal Global gave tremendous push to industrialists, thinkers and pioneers around the world to join this Nation Building Movement.

vi
“Ekal Abhiyan as a Model for Social Change”
A great vision for integrated and holistic development of Rural/Tribal Bharat emerged in the form of Ekal Vidyalaya Movement which gradually got transformed into “Ekal Abhiyan”, which is involved in spreading the light of Education with an aim to reach over one lakh remote villages of India. This has been proved by the statistics of more than 54,000 Ekal schools running in inaccessible areas of Bharat with the support of more than 50,000 donors both national and international with more than 54,000 Acharyas (Teachers), 6,200 full time volunteers and local supporters from Gram Samiti to Urban Samities running into more than 5 lakh, all dedicating themselves for Ekal’s cause; created a history of 28 years of unique journey of Human endeavour.
The Mission and the Model of Ekal
The Mission of Ekal Movement is empowering India through development of Rural and Tribal Villages of Country by imparting functional Education consisting of literacy, Healthcare, Economic Development, Ethics and Values, to the communities.
Panchmukhi Shiksha model of Ekal to achieve 8 goals for complete social change is:
1. f'kf{kr xk¡o – Educated village
2. LoLFk xk¡o – Healthy village
3. LokoyEch xk¡o – Self-reliant village
4. tkx:d xk¡o – Aware village
5. O;lu eqDr xk¡o – Liquor free village
6. laxfBr xk¡o – Organized village
7. lqjf{kr xk¡o – Safe & secure village
8. lejl xk¡o – Socially harmonious village
From Laddakh to Kerela and Arunachal to Gujarat, Ekal stands for education, health, wealth, security and social harmony of villages of Bharat.
The partner organizations of Ekal Abhiyan
Friends of Tribal Society (FTS), Bharat Lok Shiksha Parishad (BLSP), Ekal Vidyalaya Foundation of India (EVFI), Vanvasi Raksha Parivar Foundation (VRPF), Ekal Sansthan (EKS), Arogya Foundation of India (AFI), Ekal Gramothan Foundation (EGF), Ekal Gram Sanghathan (EGS), all together made a magnanimous human chain of volunteers & supporters in and around Bharat and the world to empower rural & tribal Bharat that is India.

vii
BHARTIYA VITTA SALAHKAR SAMITI
BVSS is a voluntary body of Chartered Accountants, Cost Accountants, Company Secretaries and allied professionals from industry and in practice with an endeavour to work towards nation building by following the ideology of Antyodaya since 1999. BVSS currently has more than 1000 professionals in Delhi and NCR.
VISION AND MISSION STATEMENT
1. To unite financial consultants
• By organising programmes, seminars and workshops relating to professionals and socio economic topics.
• By providing a platform and voice to financial consultants in making efforts for nation building.
2. To evolve economic models for India
• To develop economic model for India based on ‘Antyodaya’ and ‘Integral humanism’ concepts.
• To discuss and critically analyse various economic bills introduced in public domain.
• To take up cause for professional fraternity.
• To interact with regulatory and policy agencies and bodies.
3. Promoting Indian culture
PAST ACTIVITIES1. Towards uniting financial consultants
(i) Regular Monthly meetings are held to discuss topics of professional interest and providing platform for active interactions amongst members.
(ii) Organised seminars and workshops on various professional topics namely:
o International Trade Laws
o GST, Service Tax, VAT, Income Tax and Audits
o Accounting Standards
o FEMA for small and medium practitioners
o Impact of exchange fluctuation in Indian Economy
o Organise Seminars through Video Teleconferencing at Reliance Web

viii
Centres connecting 15 cities in various states of the country
2. Towards evolving economic models for India(i) Organised a talk on ‘Economic
Growth - The Way Forward’ – addressed by then Chief Minister of Gujrat, Shri Narendra Modi Ji, Hon’ble Prime Minster of India
(ii) Organised a program ‘Relevance of Transparency in Democracy’ – addressed by Transparency International Convenor, Admiral Tahiliani and Shri Jag Mohan, Former Governor, J&K
(iii) Organised Budget programmes with Delhi University, PHD Chamber of Commerce, Delhi Stock Exchange etc.
(iv) The Economic model of China addressed by Shri Yashwant Sinha ji, Former Union Minister
(v) Seminar on the Economics of Terrorism organised in NOIDA and addressed by Shri Indresh Kumar and Maulana Abass Ali
(vi) Organised seminar on Relevance of Corporate Governance and Satyam Fiasco
(vii) Organised seminar on Encountering the Menace of Money Laundering and Tax Havens presided by Hon’ble Justice Mool Chand Garg
(viii)Organised unique seminar on Corporate Sustainability addressed by ICAI President, ICSI Vice President and ICWAI Vice President and was presided by Accountant General of Delhi Shri Rajvir Singh
(ix) Posted comments on Real Estate (Regulation and Development) Bill, 2011
(x) Interactive seminar on Insolvency and Bankruptcy Code, 2016 addressed by Dr. M.S. Sahoo, Chairman, Insolvency and Bankruptcy Board of India
3. Promoting Indian Culture• Program in the series of Pujya Sri
Guruji’s ‘Janam Shatabdi Samaroh’ addressed by Sri Sri Ravi Shankar Ji
• Program in collaboration with IIT, Delhi ‘Yog Dwara Jeevan mein Sampoornata’ – Lecture by Baba Ramdev
• Program on ‘Importance of Gita in Daily Life’ – Lecture delivered by Swami Nikhilanand of the Chinmaya Mission
• Program on the topic ‘Marriage-Bond or Bondage’
• Program on the topic ‘Pranic Urja’ delivered by Dr. Surakshi Goswami of the Speaking Tree (Time of India)

ix
PREFACE
Introduction of corporate social responsibility as a part of corporate legislation was a praiseworthy action. It was expected that large portion of rural population especially located in tribal and remote areas, which hitherto could not taste the fruits of economic development, would be benefitted with these provisions.
Bhartiya Vitta Salahkar Samiti (BVSS), a not- for-profit organization, run by finance professionals, regularly conducts various programs related to professional and social issues. Based on specific studies and workshops conducted, it provides inputs to the governments and other respective regulators.
Ekal Abhiyan is an integrated program for rural development and its activities include running Ekal Schools in more than 54,000 remote villages in various parts of the country and to propagate health consciousness and sense of self- reliance in the rural folks.
Nearly 30 years of uninterrupted journey of Ekal gave BVSS a prefect reason and inspiration to take up the present Study to understand the interface between the corporate sector and various development initiatives for marginalized people.
The Study highlights the pattern of spending by various corporate models under CSR initiatives over the last two years of its
implementation. The Study also aims to suggest suitable amendments in relevant laws and rules to make CSR more meaningful, transparent and objective.
We place on record our sincere thanks to Hon’ble Shri Shyam Ji (Founder Ekal), CA Bajrang Lal Bagra Ji (Ex-CMD, NALCO and President, Central Executive Committee, Ekal Abhiyan), Dr. Subhash Chandra Ji (Hon'ble Member of Parliament, Chairman Essel Gourp and Ekal Global), CA Subhash Aggarwal Ji (Chairman SMC Group and Chairman, Advisory Board-BVSS) and CA Raj Kumar Agarwal ji (President BVSS) for their inspiration and guidance.
We also wish to thank Adv. Imran Ahmed Siddiqui for his hard work in bringing out this Study.
In any publication there is always a scope for further improvement. We would be grateful to users to offer their suggestions / comments for further refinement.
For Team BVSS CA Sushil Gupta CA Anil Sharma
New Delhi March 28, 2017uo lEor~ üú÷þ] pS=k] çfrink

x
ACRONYMS
Acronyms Full form
ASSOCHAM Associated Chambers of Commerce of India
BSE Bombay Stock Exchange
BRR Business Responsibility Report
CII Confederation of Indian Industry
CPSEs Central Public Sector Enterprises
CSR Corporate Social Responsibility
DPE Department of Public Enterprises
EAG Empowered Action Group
FOB Family Owned Business
FCRA Foreign Contribution (Regulation) Act
IICA Indian Institute of Corporate Affairs
INR Indian National Rupee
LODR Securities and Exchange Board of India (Listing Obligations and
Disclosure Requirements) Regulations, 2015
MCA Ministry of Corporate Affairs
MNC Multi-National Company
NGOs Non-Government Organizations
NSE National Stock Exchange
PAT Profit After Tax
PMNRF Prime Minister National Relief Fund
PSUs Public Sector Undertakings
SEBI Securities and Exchange Board of India

xi
CONTENTS
Foreword i
Chairman's Message iii
About Ekal Abhiyan v
About Bhartiya Vitta Salahkar Samiti (BVSS) vii
Preface ix
Acronyms x
Executive Summary 1
Introduction 4
Objectives of the Study 7
Methodology of the Study 8
Findings/Observations 10
Suggestions/Recommendations 31


1
CSR Activities in India-Analysis and Trends
EXECUTIVE SUMMARY
1. Introduction:Social activities carried out by business houses are not new in India. However, corporate social responsibility, as a business agenda, gained recognition in 2001 when an industry association developed CSR guidelines to be followed voluntarily by the industry. Later it became part of statute in the shape of Section 135 of the Companies Act, 2013. The statutory provisions were introduced to encourage companies to fulfil their responsibilities towards society by not only imbibing sustainability and other social objectives in their corporate culture but also by spending a specified percentage of their profit on defined social activities on year to year basis. Schedule VII to the Act contains a list of activities for which expenditure incurred by the companies is considered as compliance of their corporate social responsibilities mandated under section 135 of the Act. These provisions became effective from 01.04.2014.
2. ObjectivesoftheStudy:One of the objectives of the Study is to find out whether the purpose for which section 135 was introduced, has been achieved, and if so to what extent. The Study has also made an attempt to know the nature and pattern of expenditure preferred by companies for their CSR expenditure during the two years’ period ended March 31, 2016.
The Study shall provide an overview of current trends and practices of expenditure incurred under CSR mandate by major listed companies in India.
It is expected that the Study would help in evaluating various approaches adopted by corporates to achieve CSR objectives and would encourage and motivate others to adopt best CSR practices keeping in view their specific nature of operations, location ad philosophy. It is also expected that the Study shall provide guidance to companies to execute and monitor their CSR activities, to set up parameters for evaluating the impact of expenditure incurred and to elucidate criteria for partnering implementation agencies.
Other objectives of the Study are to examine whether proper and adequate disclosures have been made by the companies in their reports to the stakeholders with respect to their CSR spending and to suggest other steps, if any, to be taken by the companies to ensure disclosure of full and transparent information on their CSR initiatives including spending.
The Study was to explore any changes to be made in law and rules for effective implementation of provisions governing CSR.

2
3. Methodology:The Study presents the analysis and trends of CSR activities in India by three formats of business organizations namely Central Public Sector Enterprises (CPSEs), Family Owned Business (FOBs) and Multi-National Companies (MNCs) operating in India both in manufacturing and service sectors and
The Study has been prepared after reviewing, analyzing and comparing the annual reports and CSR policies of the selected companies for the years ended on 31.3.2015 and 31.3.2016 and related miscellaneous data available in public domain. Few other reports available in public domain have also been referred for providing a comparative analysis of the subject.
Data of 125 major companies were collected and out of which top five companies were selected in specified groups. Two broad groups were conceived on the basis of ownership namely Public Sector and Private Sector. Private sector was further divided into two groups namely Family Owned Businesses (FOBs) and Multi-National Corporations (MNCs). Both the broad groups were further sub-divided into Manufacturing Sector and Service & Trading Sector. This resulted in formation of six groups.
The Study has also made an attempt to capture information on different modes used by the selected Group companies for CSR spending and unspent expenditure on year to year basis.
4. Findings/ObservationsoftheStudy:The study found that 30 selected companies have spent R 8,211 crores in two years with increase in spending of 21% in the year 2015-16 as compared to 2014-15. The
higher increase in expenditure was noticed in the case of public sector companies. The selected companies spent upto 93% of the amount prescribed to be spent.
Over all percentage of expenditure incurred by the selected corporates through Implementation Agencies of their total spent was 76.58 % in 2015-16 which was not very different from that in 2014-15. However, CPSEs spent more amount directly during 2015-16 as compared to 2014-15 whereas FOBs and MNCs spent higher amount through Implementation Agencies during 2015-16 as compared to 2014-15.
The selected companies across the Groups have spent maximum on Healthcare and Water & Sanitation related activities. Promotion of education has also featured prominently in their expenditure. Environmental sustainability was the most favourable expenditure stream during 2014-15 whereas Healthcare was preferred by the selected corporates during 2015-16.
CPSEs spent higher amount on Education in 2015-16 as compared to 2014-15 whereas FOBs and MNCs spent lesser amount on Education in 2015-16 as compared to 2014-15. All the Groups spent higher amount on Social Empowerment and Skill Development in 2015-16 as compared to 2014-15. All the Groups also spent higher expenditure on Infrastructure Development and Rural and Slum Area Development during 2015-16 as compared to 2014-15.
Measures for the benefits of armed forces veterans, War Widows and their Dependents, Contribution to Technology Incubators located within academic institutions and Promotion of Sports are some of the areas which have not yet received due attention

3
of the corporates as part of their CSR expenditure.
FOBs and MNCs spent higher amount on capacity building in 2015-16 as compared to 2014-15 whereas CPSEs expenditure on capacity building has come down substantially in 2015-16 as compared to 2014-15.
It was also observed that there was no clarity on accounting of capital expenditure resulting in asset creation out of amount spent by corporates themselves and income generated from CSR activities during the period, if any.
The Study also observed that formal processes for selection of activities, implementing agency and for impact assessment of CSR expenditure made were not in place as no disclosure was made in this regard. Reporting format also have number of shortcomings resulting in non- availability of some important information on CSR expenditure.
5. Recommendations/Suggestions:Based on various findings/observations, the
Study has made some recommendations/suggestions of certain steps to be taken to implement the provisions of the Act more objectively and effectively and also to improve disclosure of various aspects of CSR spending. These recommendations also include few changes in respective laws and implementation rules.
The most important recommendation is to amend section 135 of the Companies Act to make the CSR spending mandatory on the same manner as prescribed by Department of Public Enterprises for public sector enterprises.
The Study is also recommending to set up some formal mechanism to carry out an impact assessment study and publish the results for stakeholders.
Creating a database of implementing agencies containing their profiles and resources, past achievements and area of specialization, accounting aspects of capital expenditure incurred, recognizing the best performers in the field, are other important recommendations of the Study.

4
INTRODUCTION
Social Responsibility is not a new concept in India. Our thousands of years old civilization carries a resonance legacy delivering duties and responsibilities at every sphere of our life, be it family, friends or society as a whole. Roots of social responsibility lie in philanthropic activities such as giving money, goods, services or time to the unfortunates, either directly or by means of an organized structure of a charitable trust, without any expectation of some benefit in return. Various practices prevalent in India, such as Daan in Hinduism, Zakat and Fitra in Muslims, Dasvand in Sikhism and Tethe in Christians are explicit evidences. The basic aim of all has been to help under-privileged. Hence, roots of social responsibility are found in religious belief and practices. Those who were unable to serve society directly, but were able to provide money and other material resources, either established charitable institutions and built Dharamshalas, Schools, Orphanages, Homes for destitute and the like; and, donated funds to run them. Some benevolent individuals established endowments to provide monetary help in perpetuity for some charitable cause. Traditionally, most forms of social obligations are concerned with providing basic necessities such as food, water, clothing, education, healthcare and shelter.
An old belief is: Adatt Danachha Bhavet Daridra
A vnÙk nkukPp Hkosr~ nfjnz A
Daridra Bhavachha Karuti Papam
A nfjnz HkoPp djksfr ikie A
Papam Prabhavat Narakam Prayanti A ikie izHkkor ujde iz;kfUr A
Punaha Daridra Punarepa Papi A iqu% nfjnz iqujsik ikih A
Which means if one does not donate, the person is penniless and being in misery, he performs evil deeds. By performing evil deeds he ends up in here and after taking rebirth, he once again ends up in the vicious cycle of misery and evil deeds.
in Geeta, Chapter 17, shloka 20 defines the saatvika daan (pure charity):
nkrO;fefr ;íkua nh;rs ^uqidkfj.ks A ns'ks dkys p ik=ks p ríkua lkfÙoda Le`re AA
that giving is called saattvika (pure) which is given with the intent that ‘I must give’, to someone who can’t return the favor; and given in the right place, time and to the worthy/needy recipient.
ç[;kr lektlsoh LoxhZ; Jh ukukth ns'keq• us dgk Fkk&
¶eSa vius fy, ugha] viuksa ds fy, gw¡A vkSj vius vFkkZr~] oks lc tks misf{kr gSa] oafpr gSaA¸
This message equally applies to corporate citizens. Indian companies have had a long tradition of being engaged in social initiatives that have gone beyond meeting a company’s immediate financial objectives. Business organisation, have been making decisions based not only on financial factors, but also on the social and environmental consequences, while meeting the interests

5
of its stakeholders including shareholders, customers, employees, suppliers, business partners, local communities, exchequer and other organizations. It is well recognized that integrating social, environmental and ethical responsibilities into the governance of businesses ensures their long term success, competitiveness and sustainability. Companies with ethical practices, good governance and effective corporate social responsibility (CSR), have the image of socially responsible entities and their products and services are also preferred by the customers.
Since late nineties, CSR activities have increasingly come under the lens both of policy makers as well as of companies’ stakeholders as a governance issue. It is evident from the Companies Act 2013 that brought CSR to the forefront and Schedule VII, which lists out the CSR activities, suggesting communities to be the focal point. And CSR rules which suggest that CSR needs to go beyond communities and concept of philanthropy.
CSR journey in India, so far, can be summarised as under:
2001-2008 The first visible step came from the industry itself when the CII National Committee on Corporate Social Responsibility & Community Development was constituted to make CSR an actionable business agenda in 2001. The Committee developed CSR guidelines and promoted the sharing of CSR experiences and best practices. To bridge the gap between companies and NGOs, it also created an online platform named ‘SAMMAAN’ in association with Bombay Stock Exchange (BSE) and Indian Institute of Corporate Affairs (IICA).
December 2009
Ministry of Corporate Affairs (MCA) issued Corporate Social Responsibility Voluntary Guidelines 2009, wherein it was proposed that each business entity should formulate a CSR policy to guide its strategic planning and provide a roadmap for its CSR initiatives, which should be an integral part of overall business policy and aligned with its business goals with the participation of various level executives and should be approved by the Board.
July2011
MCA came out with more comprehensive set of guidelines based on feedback from stakeholders and considering international practices. The ‘National Voluntary Guidelines on Social, Environmental and Economic Responsibilities of Business’ contained comprehensive principles to be adopted by companies as part of their business practices and a structured business responsibility reporting format requiring certain specified disclosures, demonstrating the steps taken by companies to implement the principles of social responsibility was introduced.
August2012
In line with above referred Guidelines issued by MCA in July, 2011, the Securities and Exchange Board of India (SEBI) issued a circular which mandated top 100 listed entities based on market capitalisation at BSE and NSE as on March 31, 2012 to include Business Responsibility Report as a part of their annual report. Hence in order to enhance the quality of disclosures made by listed entities, certain listing conditions were specified by way of inserting Clause 55 in the equity Listing Agreement. These Guidelines

6
were made applicable from the financial year ending on or after December 31, 2012.
December 20 12Department of Public Enterprises (DPE), Ministry of Heavy Industries and Public Enterprises also issued guidelines on Corporate Social Responsibility and Sustainability for Central Public Sector Enterprises (CPSEs) which came into effect w.e.f. April 1, 2013.
September 20 13The Companies Act, 2013 was enacted replacing the Companies Act, 1956. The new Act contained a specific provision as Section-135 read with Schedule-VII, which made CSR as a statutory provision applicable to specified companies on the principle of ‘Spend or Explain’. Detailed rules have been framed for implementation of the section 135 w.e.f. April 1, 2014.
(Refer Annexure 1.1 for text of the Section, Schedule, Rules and subsequent amendments and clarifications issued in this regard).
October 2014DPE issued fresh guidelines on Corporate Social Responsibility and Sustainability for CPSEs which came into effect from
April 1, 2014. These Guidelines superseded earlier guidelines issued in December 2012 and were in supplement to the CSR Rules framed under the Companies Act, 2013. The Guidelines make CPSEs to mandatorily spend the amount which meet the criteria as laid down in section 135 (1) of the Companies Act, 2013.
(Refer Annexure 1.2 for the text of the Guidelines issued by DPE on 21.10.2014).
September 2015
SEBI issued Securities and Exchange Board of India (Listing Obligations and Disclosure Requirements) Regulations, 2015 (LODR) which replaced earlier directions. LODR required top five hundred listed entities based on market capitalization (calculated as on March 31 of every financial year) to prepare a Business Responsibility Report (BRR), as part of their Annual Report, describing the initiatives taken by them from an environmental, social and governance perspective w.e.f. December 31, 2015. SEBI amended the Regulations to make preparation of BRR mandatory for top five hundred companies w.e.f. April 1, 2016.
(Refer Annexure 1.3 for relevant extract of LODR and Amendment notification.)

7
The main aim of the Study is to understand trends and practices of expenditure under CSR over past two years, i.e. 2014-15 and 2015-16, followed by major companies doing business in different segments in India and to make suggestions for strengthening the regulatory and reporting mechanism.
To make a fair assessment of implementation of legal provisions relating to CSR and other policies adopted by the companies, the following questions were framed to be answered:
1. Whether the purpose for which section 135 was introduced has been achieved, and if so to what extent?
2. What is the pattern of expenditure preferred by companies on yearly basis?
3. What is the accounting aspects of revenue and capital expenditure incurred under CSR activities especially when the company has incurred that expenditure itself?
4. What can be the best CSR practices which can become role model for others
to emulate, for implementation of strategies for improvement in operation standards?
5. What can be the guiding document to help execute and monitor CSR initiatives and to elucidate criteria for partnering implementation agencies?
6. How the companies have made CSR a key business process for sustainable development?
7. What can be the best approach to be adopted for evaluating success in achieving CSR objectives?
8. How an impact assessment of CSR initiatives has been made or can be improved upon?
9. Whether something is required to be done for better and transparent implementation and presentation?
10. Whether any changes in Sections / Rules of the Companies Act, 2013 for better implementation of the CSR provisions are required?
OBJECTIVES OF THE STUDY

8
Pictorial presentation of Sample selection
SECTORS
Public
Manufacturing (Group-1)
Service and Trading (Group-2)
Private
Family Owned Business Multi-National Companies
Manufacturing (Group-3)
Service and Trading (Group-4)
Manufacturing (Group-5)
Service and Trading (Group-6)
The Study has been carried out after collecting, reviewing and comparing the Annual Reports and CSR policies of 125 listed companies to whom Section 135 of the Companies Act, 2013 is applicable, for two years i.e. 2014-15 and 2015-16.
In the first step, these 125 companies were segregated into two sectors on the basis of their ownership namely (i) public sector companies, (ii) private sector companies. Private Sector was further divided into two sub sectors namely (i) Family owned businesses and (ii) multi-national companies operating in India. All the three sectors/ sub-sectors were further divided in two groups on the basis of their nature of products and services namely (i) manufacturing and (ii) service and trading.
METHODOLOGY OF THE STUDY
In the second step, top five companies in each group of the three sectors/sub-sectors were selected on the basis of their average net profit determined in term of section 135 of the Companies Act, 2013. This exercise gave the following six groups having five companies each:
Group-1 Five Central Public Sector Enterprises (CPSEs) in Manufacturing Sector
Group-2 Five Central Public Sector Enterprises (CPSEs) in Service and Trading Sector
Group-3 Five Family Owned Businesses (FOBs) in Manufacturing Sector
Group-4 Five Family Owned Businesses (FOBs) in Service and Trading Sector
Group-5 Five Multi-National Companies (MNCs) in Manufacturing Sector
Group-6 Five Multi-National Companies (MNCs) in Service and Trading Sector
The companies in each of these six Groups are listed below:
Group-1: Central Public Sector Enterprises (CPSEs) in Manufacturing Sector
1. Oil and Natural Gas Corporation Ltd (ONGC)
2. National Thermal Power Corporation Ltd (NTPC)
3. National Mineral Development Corporation Ltd (NMDC)
4. Indian Oil Corporation Ltd (IOC)
5. Bharat Petroleum Corporation Ltd (BPCL)

9
Group-2: Central Public Sector Enterprises (CPSEs) in Service and Trading Sector
1. Power Finance Corporation Ltd (PFC)
2. Rural Electrification Corporation Ltd (RECL)
3. The Power Grid Corporation of India Ltd (PGCL)
4. Oil India Ltd (OIL)
5. Container Corporation of India Ltd (CONCOR)
Group-3: Family Owned Businesses (FOBs) in Manufacturing Sector
1. Reliance Industries Ltd (RIL)
2. Tata Steel Ltd (Tata Steel)
3. Bajaj Auto Ltd (Bajaj Auto)
4. Mahindra and Mahindra Ltd (Mahindra and Mahindra)
5. UltraTech Cement Ltd (Ultratech Cement)
Group-4: Family Owned Businesses (FOBs) in Service and Trading Sector
1. Tata Consultancy Services Ltd (TCS)
2. Wipro Ltd (WIPRO)
3. HCL Technologies Ltd (HCL)
4. Bharti Airtel Ltd (Bharti Airtel)
5. Kotak Mahindra Bank Ltd (Kotak Mahindra Bank)
Group-5: Multi-National Companies (MNCs) in Manufacturing Sector
1. ITC Ltd (ITC)
2. Cairn India Ltd (Cairn India)
3. Larsen & Toubro Ltd (L & T)
4. Hindustan Unilever Ltd (HUL)
5. Maruti Suzuki India Ltd (Maruti Suzuki India)
Group-6: Multi-National Companies (MNCs) in Service and Trading Sector
1. HDFC Bank Ltd (HDFC Bank)
2. Infosys Ltd (Infosys)
3. Indiabulls Housing Finance Ltd (Indiabulls Housing Finance)
4. Zee Entertainment Enterprises Ltd (Zee Entertainment)
5. Blue Dart Express Ltd (Blue Dart Express)
From the audited financial statements of the above companies for the year ended 31.03.2015 and 31.03.2016, the following information was collected and tabulated on yearly basis:
1. Average net profit;
2. Amount spent for CSR;
3. Amount on CSR incurred directly and through implementation agencies;
4. Amount unspent; and
5. Head-wise spent on CSR.
(Refer Annexure 2.1 and 2.2 for the above referred company wise information for the years ended 31.03.2015 and 31.03.2016.)

10
It was found that the overall CSR spent by public sector has increased considerably by more than 48% on year on year basis as against an increase of less than 6% by private sector.
I. Expenditure under CSR (i). Trends of CSR spending by different sectors during Financial Year 2014-15 and FY
2015-16:
S. No. HeadsSpent (Amount in Cr.)
2014-15 2015-16 % Increase
1 Public Sector 1307.54 1935.91 48.06
2 Private Sector* 1207.08 1276.72 05.77
(a) FOBs 1496.89 1601.02 06.96
(b) MNCs 917.26 952.41 03.83
* As there were 20 companies in the Private Sector, an average of 10 has been taken to compare the same with
CPSEs.
FINDINGS/OBSERVATIONS OF THE STUDY

11
(ii) Trends of CSR spending by CPSEs (Manufacturing Sector) during Financial Year 2014-15 and FY 2015-16:
Initiative throughFY 2014-15 FY 2015-16 Total
Amount in Cr. % Amount in
Cr. % Amount in Cr. %
Own 133.89 13.28 500.27 36.43 634.16 26.63
Implementing Agency 874.64 86.72 872.95 63.57 1,747.59 73.37
Total 1,008.53 100.00 1,373.22 100.00 2,381.75 100.00
The above table shows that there is an increasing trend in CPSEs manufacturing sector towards taking up CSR initiatives on their own.
(iii) Trends of CSR spending by CPSEs (Service and Trading Sector) during Financial Year 2014-15 and FY 2015-16:
Initiative throughFY 2014-15 FY 2015-16 Total
Amount in Cr. % Amount in
Cr. % Amount in Cr. %
Own 80.79 27.02 68.22 12.12 149.02 17.29
Implementing Agency 218.22 72.98 494.47 87.88 712.69 82.71
Total 299.01 100.00 562.69 100.00 861.71 100.00

12
Initiative through
FY 2014-15 FY 2015-16 Total
Amount in Cr. % Amount in
Cr. % Amount in Cr. %
Own 294.50 26.71 158.44 14.68 452.93 20.76
Implementing Agency 808.15 73.29 921.13 85.32 1,729.28 79.24
Total 1,102.65 100.00 1,079.56 100.00 2,182.21 100.00
The above table shows that there is a decreasing trend in CPSEs service and trading sector towards taking up CSR initiatives on their own.
(iv) Trends of CSR spending by FOBs (Manufacturing Sector) during Financial Year 2014-15 and FY 2015-16:

13
Initiative through
FY 2014-15 FY 2015-16 Total
Amount in Cr. % Amount in
Cr. % Amount in Cr. %
Own 60.90 15.45 5.78 1.11 66.69 7.28
Implementing Agency 333.34 84.55 515.68 98.89 849.02 92.72
Total 394.25 100.00 521.46 100.00 915.71 100.00
The above table shows that there is a decreasing trend in FOBs manufacturing sector towards taking up CSR initiatives on their own.
(v) Trends of CSR spending by FOBs (Service and Trading Sector) during Financial Year 2014-15 and FY 2015-16:

14
Initiative through
FY 2014-15 FY 2015-16 Total
Amount in Cr. % Amount in
Cr. % Amount in Cr. %
Own 252.11 48.32 225.57 38.27 477.68 42.99
Implementing Agency 269.66 51.68 363.90 61.73 633.56 57.01
Total 521.77 100.00 589.47 100.00 1,111.24 100.00
The above table shows that there is a decreasing trend in FOBs service and trading sector towards taking up CSR initiatives on their own.
(vi) Trends of CSR spending by MNCs (Manufacturing Sector) during Financial Year 2014-15 and FY 2015-16:

15
Initiative through
FY 2014-15 FY 2015-16 Total
Amount in Cr. % Amount in
Cr. % Amount in Cr. %
Own 103.35 26.13 93.22 25.68 196.57 25.92
Implementing Agency 292.14 73.87 269.72 74.32 561.86 74.08
Total 395.49 100.00 362.94 100.00 758.43 100.00
The above table shows that there is a decreasing trend in MNCs manufacturing sector towards taking CSR initiatives on their own.
(vii) Trends of CSR spending by MNCs (Service and Trading Sector) during Financial Year 2014-15 and FY 2015-16:

16
The above table shows that there is almost no change in trend of MNCs service and trading sector towards taking CSR initiatives on their own or through some implementing agency.
In a Study published in Economic and Political Weekly (Vol.49, Issue No.50 dated 13th December, 2014), CSR expenditure by public sector firms increased considerably in 2012-13 compared to 2011-12. The passage of the Act also led to an increase in the average CSR spending of public sector firms from Rs.25.72 million (around Rs.2.57 Cr.) in 2012 to Rs.147 million (around Rs.14.7 Cr.) in 2013. The Study further shows that there has also been a significant increase in the average CSR expenditure by domestic firms as compared to foreign firms. Average CSR expenditure by domestic and foreign firms was Rs.3.79 million (around Rs.0.37 Cr.) and Rs.8.5 million (around Rs.0.85 Cr.) respectively in 2011-12, but this increased to Rs.22.6 million (around Rs.2.26
Cr.) and Rs.19.5 million (around Rs.1.95 Cr.) respectively in 2012-13.1
Further, an annual research publication ‘India CSR Outlook Report (ICOR)’ prepared by NGOBOX (Renalysis Consultants Pvt. Ltd) on CSR spending of 250 companies for the Financial Year 2015-16 showed that there was substantial improvement in the actual CSR spend to prescribed CSR in FY 2015-16. While it was 79% in FY 2014-15, it has increased to 92% in financial year 2015-16. There was an actual CSR spend of Rs.6578.66 Cr. as against prescribed CSR spend of Rs.7143.91 Cr. for the Financial Year 2015-16 for these 250 companies.2
II. CSR Expenditure Pattern:
(i) Overall spent:
A summary of spent on various CSR initiatives
in descending order of spent is as under:

17
S. No. HeadsSpent
FY Amount (in Cr.) % of Total Spent1 Health Care, Water and Sanitation 2014-15 1119.69 30.09
2015-16 1736.70 38.68
2 Promotion of Education 2014-15 782.70 21.03
2015-16 888.82 19.80
3 Infrastructure Development / Rural and Slum Area Development Projects
2014-15 584.86 15.18
2015-16 624.88 13.92
4 Social Empowerment / Skill development 2014-15 497.73 13.37
2015-16 428.66 09.55
5 Environment Sustainability 2014-15 441.84 11.87
2015-16 321.26 07.16
6 Capacity Building and Others 2014-15 142.01 03.82
2015-16 283.75 06.32
7 PMNRF and other Funds for relief to SC, ST, OBC, minorities and women
2014-15 56.47 01.52
2015-16 78.46 01.75
8 Protection of National Heritage, Arts & Culture
2014-15 77.73 02.09
2015-16 26.88 00.60
9 Promotion of Sports 2014-15 38.46 01.03
2015-16 23.67 00.53
10 Contribution to Technology Incubators located within academic institutions
2014-15 00.20 00.01
2015-16 72.05 01.60
11 Measures for benefit of armed forces veterans, war widows and their dependents
2014-15 NIL NIL
2015-16 04.22 00.09
Health Care / Water / Sanitation35%
Education20%
Social Empowerment / Skill development11%
Environment Sustainability9%
National Heritage, Arts &
Culture1%
Benefit of armed forces 0%
Sports 1%
PMNRF / Other Funds 2%
Technology Incubators located within academic institutions
1%
Infrastructure Development / Rural and Slum Area Development Projects
15%
Relief to victims of natural calamities / disasters0%
Directly by Subsidiaries (No breakup available)2%
Capacity Building3%
CSR Spent during FY 2014-15 & 2015-16 (All 30 Companies)

18
Health Care / Water / Sanitation30%
Education21%
Social Empowerment / Skill development13%
Environment Sustainability12%
National Heritage, Arts & Culture2%
Benefit of armed forces 0% Sports
1%
PMNRF / Other Funds
2%
Technology Incubators 0%
Infrastructure Development / Rural and Slum Area Development Projects
15%
Relief to victims of natural calamities / disasters0%
Directly by Subsidiaries (No breakup available)0%
Capacity Building4%
CSR Spent during FY 2014-15 (All 30 Companies)
Health Care / Water / Sanitation39%Education
20%
Social Empowerment / Skill development9%
Environment Sustainability7%
National Heritage, Arts & Culture1%
Benefit of armed forces 0% Sports
0%
PMNRF / Other Funds 2%
Technology Incubators 2%
Infrastructure Development / Rural and Slum Area Development Projects
14%
Relief to victims of natural calamities / disasters0%
Directly by Subsidiaries (No breakup available)4%
Capacity Building2%
CSR Spent during FY 2015-16 (All 30 Companies)

19
It was found that there is an overall increased focus in terms of percentage as well as quantum on Health Care and Water & Sanitation related initiatives (From 30.09% in FY 2014-15 to 38.68% in FY 2015-16). On the other hand, spent on Environment, Sustainability has come down from 11.87% in FY 2014-15 to 7.16% in FY 2015-16.
Further, most of the companies have taken negligible or no interest in Measures for benefit of armed forces veterans, war widows and their dependents, Contribution to Technology Incubators located within academic institutions, Promotion of Sports or Protection of National Heritage, Arts &
Culture in both the years.
In addition to the above contribution to the
Prime Minister’s National Relief Fund or any
other fund set up by the Central Government
for socio-economic development and relief
and welfare of the Scheduled Casts, the
Scheduled Tribes and other backward
classes, minorities and women, the companies
contributed almost similar percentage of
their CSR spent towards contribution in
both the years.
(ii) Sector-wise top three spending trends:
A summary of initiatives taken is as under:
Category: CPSEs
Financial Year Spent
Amount (in Cr.) %
2014-15 Environment Sustainability 322.40 24.7
Promotion of Education 264.90 20.3
Health Care / Water / Sanitation 234.56 17.9
2015-16 Health Care, Water and Sanitation 985.91 50.9
Infrastructure Development / Rural and Slum Area Development Projects
263.90 13.6
Promotion of Education 221.65 11.5
Category: Private Sector*
2014-15 Health Care / Water / Sanitation 442.56 36.7
Promotion of Education 258.90 21.5
Social Empowerment / Skill development 197.00 16.3
2015-16 Health Care, Water and Sanitation 375.39 29.4
Promotion of Education 333.58 26.1
Infrastructure Development / Rural and Slum Area Development Projects
180.49 14.1
* As there were 20 companies in the Private Sector, an average of 10 has been taken to compare the same with
CPSEs.

20
In case of Public Sector Enterprises, it was found that focus on Environment Sustainability (24.66%) during 2014-15 has been replaced by Health Care, Water and Sanitation (50.93%) in 2015-16. Also spent on Promotion of Education has been substantially gone down to 11.45% in 2015-16 as against more than 20% in 2014-15. The spent has also been reduced in absolute terms from Rs.265 Cr. in 2014-15 to 222 Cr in 2015-16.
On the other hand, in case of Private Enterprises, it is clear here that focus on Healthcare Water and Sanitation i.e. 36.66% during 2014-15 has been reduced to 29.40% in 2015-16. Also spent on Promotion of Education is increased from 21.45% in 2014-15 to 26.13% in 2015-16.
(iii) A further bifurcation of Private Sector Enterprises into FOBs and MNCs (top three spends):
Category: FOBs
Financial Year Heads Spent
Amount (in Cr.) %
2014-15 Health Care / Water / Sanitation 704.47 47.06
Promotion of Education 275.31 18.39
Social Empowerment / Skill development 205.04 13.70
2015-16 Health Care, Water and Sanitation 544.20 33.99
Promotion of Education 481.78 30.09
Infrastructure Development / Rural and Slum Area Development Projects
199.67 12.47
Category: MNCs
2014-15 Promotion of Education 242.49 26.44
Social Empowerment / Skill development 188.95 20.6
Health Care / Water / Sanitation 180.65 19.69
2015-16 Health Care, Water and Sanitation 206.57 21.69
Promotion of Education 185.37 19.46
Environment Sustainability 164.04 17.22
FOBs and MNCs both continued spending the highest amount towards Health Care, Water and Sanitation except by MNCs in the year 2014-15. However, FOBs have decreased the said expenditure in 2015-16 in percentage as well as in absolute terms, as compared to 2014-15. Same time in case of FOBs expenditure on Promotion of Education has been increase substantially
during 2015-16 as compared to previous year.
In case of FOBs, spent on Social Empowerment and Skill development has been replaced by Infrastructure Development and Rural and Slum Area Development Projects during 2015-16. Similarly, in case of MNCs Social

21
Category: CPSEs
Financial Year Heads Spent
Amount (in Cr.) %
2014-15 Promotion of Sports 25.46 1.95
Protection of National Heritage, Arts & Culture 30.15 2.31
Social Empowerment and Skill development 103.73 7.93
2015-16 Contribution to Technology Incubators located within academic institutions
72.04 3.72
Environment Sustainability 126.44 6.53
Social Empowerment and Skill development 176.12 9.1
Category: Private Sector*
2014-15 Protection of National Heritage, Arts & Culture 23.79 1.97
PMNRF and other Funds for relief to SC, ST, OBC, minorities and women
26.35 2.18
Environment Sustainability 59.72 4.95
2015-16 PMNRF and other Funds for relief to SC, ST, OBC, minorities and women
39.23 3.07
Environment Sustainability 97.41 7.63
Infrastructure Development and Rural and Slum Area Development Projects
180.49 14.14
* As there were 20 companies in the Private Sector, an average of 10 has been taken to compare the same with CPSEs.
Empowerment and Skill development has been replaced by Promotion of Education during 2015-16.
(iv) Sector-wise least spending trends (1% or more) during Financial Year 2014-15 and FY 2015-16:
As evident from earlier analysis, the public sector enterprises have given least preference to Promotion of Sports and Contribution to Technology Incubators located within academic institutions. And it may be due to complicacies involved in setting up of related infrastructure, operation and contingent outcomes with long gestation period. On the other hand, the private enterprises have given least preference to Protection of National Heritage, Arts & Culture and Contribution to PMNRF
and other Funds for relief to SC, ST, OBC,
minorities and women.
Still, public sector has shown seriousness
by taking up various social initiatives during
both the years as against private sector
which has more compliance only attitude by
donating to PMNRF and other related funds.
Some private sector domestic companies
seem to have taken more initiatives in
comparison to MNCs.

22
(v) A further bifurcation of Private Sector Enterprises into FOBs and MNCs (1% or more spend):
Category: FOBs
Financial Year Heads Spent
Amount (in Cr.) %
2014-15 PMNRF and other Funds for relief to SC, ST, OBC, minorities and women
23.48 1.57
Environment Sustainability 53.70 3.59
Infrastructure Development and Rural and Slum Area Development Projects
170.51 11.39
2015-16 PMNRF and other Funds for relief to SC, ST, OBC, minorities and women
15.44 01.00 (Approx.)
Social Empowerment and Skill development 127.11 7.94
Environment Sustainability 30.77 1.92
Category: MNCs
2014-15 PMNRF and other Funds for relief to SC, ST, OBC, minorities and women
29.21 3.19
Protection of National Heritage, Arts & Culture 38.92 4.24
Environment Sustainability 65.73 7.17
2015-16 PMNRF and other Funds for relief to SC, ST, OBC, minorities and women
63.02 6.62
Social Empowerment and Skill development 125.42 13.17
Infrastructure Development and Rural and Slum Area Development Projects
161.30 16.94
Category: CPSEs
Financial Year Heads Spent
Amount (in Cr.) %
2014-15 Measures for the benefit of armed forces veterans, war widows & their dependents
NIL 0.00
Contribution to Technology Incubators located within academic institutions
00.20 0.02
PMNRF and other Funds for relief to SC, ST, OBC, minorities and women
03.77 0.29
(vi) Sector-wise least spending trends (between NIL to 1%) during Financial Year 2014-15 and FY 2015-16:

23
Financial Year Heads Spent
Amount (in Cr.) %
2015-16 PMNRF and other Funds for relief to SC, ST, OBC, minorities and women
NIL 0.00
Measures for the benefit of armed forces veterans, war widows & their dependents
04.14 0.21
Protection of National Heritage, Arts & Culture 08.83 0.46
Promotion of Sports 12.30 0.64
Category: Private Sector*
2014-15 Measures for the benefit of armed forces veterans, war widows & their dependents
NIL NIL
Contribution to Technology Incubators located within academic institutions
NIL NIL
Promotion of Sports 06.49 0.54
2015-16 Contribution to Technology Incubators located within academic institutions
NIL NIL
Measures for the benefit of armed forces veterans, war widows & their dependents
NIL NIL
Promotion of Sports 05.69 0.45
Protection of National Heritage, Arts & Culture 09.02 0.71
* As there were 20 companies in the Private Sector, an average of 10 has been taken to compare the same with CPSEs.
(vii) A further bifurcation of Private Sector Enterprises into FOBs and MNCs (between NIL to 1%) :
Category: FOBs
Financial Year Heads Spent
Amount (in Cr.) %
2014-15 Measures for the benefit of armed forces veterans, war widows & their dependents
NIL 0.00
Contribution to Technology Incubators located within academic institutions
NIL 0.00
Protection of National Heritage, Arts & Culture 08.66 0.58
Promotion of Sports 12.76 0.85

24
Financial Year Heads Spent
Amount (in Cr.) %
2015-16 Measures for the benefit of armed forces veterans, war widows & their dependents
NIL 0.00
Contribution to Technology Incubators located within academic institutions
NIL 0.00
Protection of National Heritage, Arts & Culture 10.61 0.66
Promotion of Sports 11.37 0.71
Category: MNCs2014-15 Measures for the benefit of armed forces veterans,
war widows & their dependentsNIL 0.00
Contribution to Technology Incubators located within academic institutions
NIL 0.00
Promotion of Sports 00.22 0.02
2015-16 Measures for the benefit of armed forces veterans, war widows & their dependents
NIL 0.00
Contribution to Technology Incubators located within academic institutions
NIL 0.00
Promotion of Sports NIL 0.00
Protection of National Heritage, Arts & Culture 07.43 0.78
It can be observed from the above data that the following heads found either negligible or no focus from public as well as private sectors enterprises:
1. Measures for the benefit of armed forces veterans, war widows & their dependents,
2. Contribution to Technology Incubators located within academic institutions,
3. PMNRF and other Funds for relief to SC, ST, OBC, minorities and women,
4. Protection of National Heritage, Arts & Culture and
5. Promotion of Sports.
In a study published in the CRISIL CSR Yearbook published in January 2016, it was also observed that 82% of CSR spending was in only 4 major sectors i.e. education and skill development
(33%), healthcare and sanitation (27%), rural development projects (13%) and environment conservation (9%). 73% of the CSR spending was focused on education / skill development, health care / sanitation and rural development. Further, funds for technology development and setting up of incubation centers have received scant attention with a mere 6 out of around 1300 companies considering such investments. Similarly, support for armed forces veterans and their families, along with sports, barely received attention.3
Another study conducted by Institutional Investor Advisory Services published in January, 2016 also shows that majority of companies are spending their CSR funds on Hunger, Poverty and Healthcare, Education and Environment Sustainability.4
An annual research publication ‘India CSR

25
Outlook Report (ICOR)’ prepared by NGOBOX (Reanalysis Consultants Pvt. Ltd) on CSR spending of 250 companies for the Financial Year 2015-16 also showed that Education (including skilling) and Healthcare (including WASH) themes have been favorites of companies for implementing CSR projects. Rural sports promotion is the new area which is gradually becoming popular in CSR projects.2
A study conducted by Vision IAS Institute, the six areas that failed to attract significant interest
are slum development; technology incubators at
academic institutions; promotion of rural as well
as Paralympics and Olympic sports; the Prime
Minister’s Relief Fund; preservation of national
heritage, art and culture; and welfare of armed
forces veterans and war widows.5
III. Mode of CSR Expenditure:
(i) Trends of CSR spending by all enterprises
directly or through Implementation
Agency:
S. No. Heads Spent
2014-15 2015-16
Amount (in Cr.)
% Amount (in Cr.)
%
1 Direct 925.55 24.87 1051.50 23.42
2 Through Implementing Agencies 2796.15 75.13 3437.85 76.58

26
It was observed that CSR spent by majority of the companies has been through Implementing Agencies.
In a Study conducted by Institutional Investor Advisory Services published in January, 2016 revealed that during the financial year 2014-15 around 70% of CSR funds were spent by
implementing agencies and only 30% directly by
the company.2
(ii) Sector-wise trends of spending directly or through Implementation Agency during the last two financial years by different categories of companies:
S. No. Particulars Spent
2014-15 2015-16
Amount (in Cr.)
% Amount (in Cr.)
%
CPSEs
1 Direct 214.68 16.42 568.49 29.37
2 Through Implementing Agencies 1092.86 83.58 1367.42 70.63
Private Sector*
1 Direct 355.43 29.45 241.50 18.92
2 Through Implementing Agencies 851.64 70.55 1035.21 81.08
* As there were 20 companies in the Private Sector, an average of 10 has been taken to compare the same with CPSEs.
(iii) A further bifurcation of Private Sector Enterprises into FOBs and MNCs (directly or through Implementation Agency) :
S. No. Particulars Spent
2014-15 2015-16
Amount (in Cr.)
% Amount (in Cr.)
%
FOBs
1 Direct 355.40 23.74 164.22 10.26
2 Through Implementing Agencies 1141.49 76.26 1436.80 89.74
MNCs
1 Direct 355.47 38.75 318.79 33.47
2 Through Implementing Agencies 561.79 61.25 633.62 66.53
27
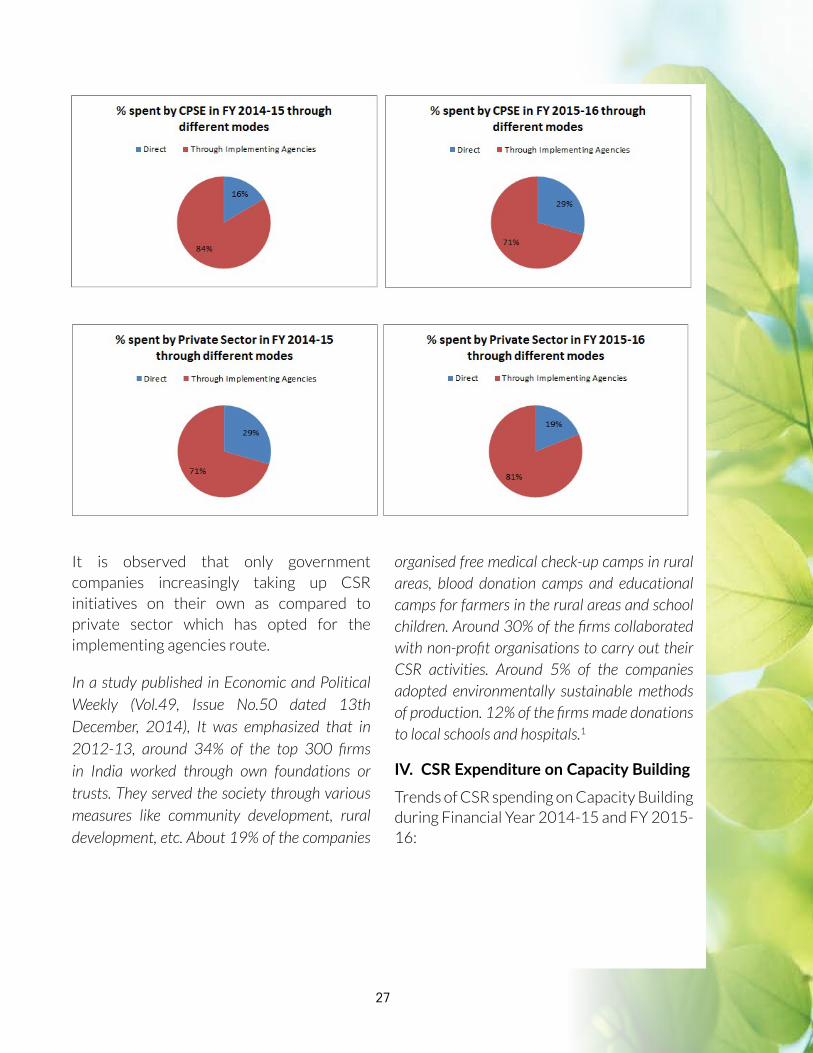
It is observed that only government companies increasingly taking up CSR initiatives on their own as compared to private sector which has opted for the implementing agencies route.
In a study published in Economic and Political Weekly (Vol.49, Issue No.50 dated 13th December, 2014), It was emphasized that in 2012-13, around 34% of the top 300 firms in India worked through own foundations or trusts. They served the society through various measures like community development, rural development, etc. About 19% of the companies
organised free medical check-up camps in rural areas, blood donation camps and educational camps for farmers in the rural areas and school children. Around 30% of the firms collaborated with non-profit organisations to carry out their CSR activities. Around 5% of the companies adopted environmentally sustainable methods of production. 12% of the firms made donations to local schools and hospitals.1
IV. CSR Expenditure on Capacity Building
Trends of CSR spending on Capacity Building during Financial Year 2014-15 and FY 2015-16:

28
S. No. Heads Spent
2014-15 2015-16
Amount (in Cr.)
% Amount (in Cr.)
%
1 CPSEs 82.93 6.34 29.08 1.50
2 Private Sector * 45.01 1.86 48.36 1.89
(a) FOBs 38.79 2.59 38.76 2.42
(b) MNCs 06.21 0.68 09.59 1.01
* As there were 20 companies in the Private Sector, an average of 10 has been taken to compare the same with CPSEs.
It was observed that public sector enterprises have spent a large part of CSR spent towards capacity building initiatives as compared to FOBs and MNCs especially in the year 2014-15.
V. Unspent CSR Allocation: During the period of two years, actual spent was less than prescribed spent in both the FY 2014-15 and FY 2015-16:
S. No. Heads Spent (Amount in Cr.)
2014-15 2015-16
Prescribed Actual % Prescribed Actual %
1 CPSEs 1894.11 1307.54 69.03 1821.03 1935.91 106.31
2 Private Sector * 1373.08 1207.08 87.91 1493.13 1276.72 85.51
(a) FOBs 1614.58 1496.89 92.71 1811.47 1601.42 88.40
(b) MNCs 1131.57 917.26 81.06 1174.79 952.41 81.07
Total (1) + (2) 4640.26 3721.70 4807.29 4489.34
* As there were 20 companies in the Private Sector, an average of 10 has been taken to compare the same with CPSEs.

29
A further breakup between Manufacturing Sectors and Service & Trading Sectors is as under:
S. No.
Heads Spent (Amount in Cr.)
2014-15 2015-16
Prescribed Actual % Prescribed Actual %
1 CPSEs
(a) Manufacturing Sector 1,437.77 1,008.53 70.15 1,312.42 1,373.22 104.63
(b) Service and Trading Sector 456.34 299.01 65.52 508.61 562.69 110.63
Total 1,894.11 1,307.54 1,821.03 1,935.91
2 FOBs
(a) Manufacturing Sector 932.09 1,102.65 118.30 937.01 1,079.56 115.21
(b) Service and Trading Sector 682.49 394.25 57.77 874.56 521.46 59.63
Total 1,614.58 1,496.89 1,811.47 1,601.02
3 MNCs
(a) Manufacturing Sector 594.15 521.77 87.82 612.77 589.47 96.20
(b) Service and Trading Sector 537.42 395.49 73.59 562.02 362.94 64.58
Total 1,131.57 917.26 1,174.79 952.41
Grand Total 4,640.26 3,721.70 4,807.29 4,489.34

30
It was found that during 2014-15, Public Sector Enterprises spent only 69% of the amount out of the prescribed amount but during 2015-16, they spent 106%. It is to be kept in mind that Government Guidelines require CPSEs to carry forward the unspent amount to the next year.
It can also be observed that Private Sector Enterprises spent only 88% of the prescribed amount during the year 2014-15 and that percentage further came down to 85.5% during the year 2015-16.
In a study published in the CRISIL CSR Yearbook published in January 2016, it was found that out of around 1000 companies only the half of the companies spent 2% of their profits on CSR and 60% of them spent 1.5% while 28% spent less than 1%.3
Further, as per Live Mint published on September 21, 2016, there was an increase of 11% and 27% in prescribed as well as actual spent respectively during the financial year 2015-16 as compared to financial year 2014-15.6
Other Important Observations: 1) It was observed that during the two years’
period ended 31.03.2016, the selected public sector companies have spent R 783.17 Crores directly by themselves and similarly selected private sector companies have also spent R 1193.87 Crores directly by themselves during that period. The information regarding amount spent on fixed assets (which have useful life of more than one year), if any, out the above expenditure was not available. Moreover, information on policy and accounting treatment of the
fixed assets so created out of that capital expenditure was also not available.
2) Similarly, policy and accounting treatment of income generated from the CSR related activities during the period, if any, was also not available.
3) During the two years’ period ended 31.03.2016, the selected public sector companies have spent R 2,460.28 Crores through Implementing Agencies and similarly selected private sector companies have also spent R 3,773.72 Crores through Implementing Agencies during that period. An assessment whether such expenditure was simply incurred by third parties or incurred as joint efforts where companies’ personnel were also involved, was not available in their reports.
4) It was observed that CSR policies of majority of identified corporates, relating to strategy and process for selection of CSR activities and implementing agencies, are general in nature.
5) It appeared that due to preference given to local area of operations for incurring CSR expenditure, such expenditure was concentrated to those states which are having higher industrial establishments within the states.
6) It was also noticed that formal process of making an impact assessment of CSR expenditure made by selected corporate was not in place. It was noticed that Reporting Format prescribed under the Rules was not facilitating availability of some important information on CSR expenditure.

31
There is no doubt that incorporating social responsibility of corporate in the statute has shown good results. In spite of the fact that statutory provisions are on the principle of “spend or explain”, most of the companies to whom the said provisions are applicable, have taken reasonable steps towards nation building by providing much needed funds for the benefit of civil society. However, to strengthen the mechanism of corporate social responsibility and based on the observations of the Study, some suggestions are being made.
The suggestions are bifurcated in three categories:
(a) Proposed changes in Law
(b) Proposed changes in Rules and Regulations
(c) Others
a) Proposed changes in Law (i) Section 135 of the Companies Act, 2013
may be amended to bring Private Sector companies at par with Public Sector companies with regard to provision of carried forward of unspent CSR allocation. Let them also move from ‘spent or explain’ to ‘spent or accumulate + spent’.
(ii) Schedule III to the Companies Act, 2013 may be amended so as to include information on fixed assets created out of CSR expenditure incurred by the company itself. However, depreciation on
that should not be allowed as an expense to the company.
b) Proposed changes in rules and Regulations
(i) The Rules may provide for preparation of outcome budget to be presented to the CSR Committee for any project to be undertaken where expenditure, including capital expenditure, exceeds R 10 Crores or so.
(ii) The Rules may provide for undertaking impact assessment in respect of CSR expenditure incurred on a single project. Such impact assessment may be done by a third party, which has prescribed technical and professional expertise available with it.
(iii) The Rules may provide for approval of the Board, if Implementing Agency, being engaged, has some interest representing the directors or their relatives. Such disclosure should be part of disclosure of ‘related party transactions’.
(iv) CSR Rules may be amended to provide for enhanced disclosures incorporating the above referred suggestions.
c) Other Suggestions(i) Some government agency like IICA
may be asked to publish successful case studies so that those can be replicated by other corporate.
(ii) Companies which have done good work in CSR initiative may be awarded and
SUGGESTIONS / RECOMMENDATIONS

32
appropriately circulated to encourage others.
(iii) IICA may be made a nodal agency to not only empanel various Implementing Agencies but also to make a database made of such agencies with information on their core expertise and successful projects executed, available to corporate.
(iv) With a view to make available the requisite workforce in various specialized field covered in schedule VII to the Companies Act, management institutes may be suggested to start specialized courses or diploma programs on the subjects.
(v) With a view to inculcate corporate social responsibilities awareness in the higher management of the companies, prospective mid-level management
cadre may be asked to work with some live projects before their induction in the management.
(vi) CSR projects carried out through implementing agencies and creating fixed assets, the benefits of which are to be there for a period more than one year, may continue to be reported by the companies in their CSR activities reporting with proper disclosure, even if they continue to be shown in the books of the Implementing Agencies.
(vii) The government should, with full clarity, give its stand as to whether any tax benefit should be available to expenses incurred under CSR spent or not. Situation where some of the expenses are eligible for tax benefits manipulate the flow of funds to some specified heads or agencies only.

,dy xhr
fuekZ.kksa ds ikou ;qx esa ge pfj=k fuekZ.k u Hkwysa
LokFkZ lk/uk dh vka/h esa olq/k dk dY;k.k u HkwysaA
ekuk vxe vxk/ flU/q gS la?k"kkZs dk ikj ugha gSA
fdUrq Mwcuk e>/kjksa esa lkgl dks Lohdkj ugha gSA
tfVy leL;k lqy>kus dks uwru vuqla/ku u HkwysaAA
'khy fou; vkn'kZ Js"Brk rkj fcuk >adkj ugha gSA
f'k{kk D;k Loj lk/ ldsxh ;fn uSfrd vk/kj ugha gSA
dhfrZ dkSeqnh dh xfjek esa laLÑfr dk lEeku u HkwysaAA
vkfo"dkjksa dh Økafr;ksa esa ;fn ekuo dk I;kj ugha gSA
l`tughu foKku O;FkZ gS çk.kh dk midkj ugha gSA
HkkSfrdrk ds mRFkkuksa esa thou dk mRFkku u HkwysaAA

De
sig
n &
Prin
ted
by
VIB
A P
RE
SS
PV
T. L
TD
. -
98
10
04
95
15