csm_pon_pf_thesis
TRANSCRIPT
A coupled flow and geomechanics model
for enhanced oil and gas recovery in
shale formations
Perapon Fakcharoenphol
Ph.D. thesis presentation
Outline
• Introduction
• Mathematical models
• Numerical studies
• Conclusions
• Recommendations
2

U.S. gas and oil production: recent history
and forecast
Ref: EIA (2013)
Gas production Crude oil production
3

Shale reservoir characteristics
• Low permeability (nD and µD)
• Low porosity and small pore size (nm to µm)
• Dominant transport mechanisms:
Gas: Darcy flow, Knudsen flow, desorption, molecular diffusion
Oil: Darcy flow
• High heterogeneity
Composition: kerogen, clay, quartz, calcite, etc.
Porosity types: inter-crystalline, inter-granular, and intra-kerogen
Fractures: microfractures and macrofractures
4

Production from shale formations
• Complex production characteristics
• Require horizontal well drilling and hydraulic
fracturing
• Low hydrocarbon recovery (EIA, 2013):
Gas recovery factor 20% - 30%
Oil recovery factor 3% - 7%
5

Effects of well shut-in on shale gas production
6
Water and gas production of a Marcellus gas shale well
from Cheng (2012)

Waterflood oil production potential:
Pilot test in Bakken Viewfield From: Wood and Milne (2011)
7
Well configuration for pilot no. 1 Oil production and water injection

Objective and scope of work
• Objective
Explore the possibility to devise methods to enhance gas and oil recovery in shale formations
• Scope of work
Develop numerical models to investigate:
� Increase in gas flow rate after long shut-in periods in some production wells
� Waterflood oil recovery potential in the greater Bakken formations
8
Mathematical models
• Flow in organic-rich shale
Investigate the effect of gravity, capillarity and osmotic forces
on phase re-distribution during well shut-in
• Flow and geomechanics in anisotropic rock
Determine the nature of the induced stress, caused by
waterflooding, which causes micro-fracturing
9

Flow in organic-rich shale
10
Ion-milled SEM of a Barnett
sample (Passey et al., 2011)
Triple-porosity modelSchematic of pore and fluid
distribution in shale

Flow model for organic-rich shale gas
11
• Governing equations:
Mass balance for water, gas, and salt
• Features:
Triple-porosity: Fractures, organic and inorganic pores
Gas storage: Free gas and absorbed gas on organic matrix
• Transport mechanisms:
Global(f-f): Darcy flow, gravity, capillarity
Local (f-m, m-m): Darcy flow, molecular diffusion (salt only), gravity, capillarity, and osmotic pressure

Geomechanic model for anisotropic rocks
• Governing equations:
Mass balance for water and oil
Energy balance
Force balance
• Features:
Single porosity: Fractures are modeled by explicit grids
Stress-strain relation: Non-linear and orthotropic materials
Rock failure analysis
• Transport mechanism
Darcy flow, gravity, capillarity 12
Model validation
• Flow model for organic-rich shale
• Single-phase flow in a hydraulically fractured well
(Gringarten, 1974)
• Osmotic pressure measurement (Al-Bazali et al., 2006)
• Geomechanic model for anisotropic rocks
• 1-D consolidation (Jaeger et al., 2007)
• 1-D thermal contraction (Jaeger et al., 2007)
• 2-D compaction for transversely isotropic porous media
(Abousleiman et al., 1996)
13

Numerical Results
• Effects of well shut-in on shale gas production
• Effects of waterflooding-induced stress on
microfracture creation
14

Part I: Effects of well shut-in on shale
gas production
15

Model setup
Base case input parameters
16
Properties Fractures Inorganic matrix Organic matrix
Porosity (-) 0.002 0.054 0.03
Permeability (mD) 0.01 0.0001 0.0001
Wettability - Mixed-wet Oil-wet
Osmotic efficiency (-) - 0.1 0.1
Salinity (ppm) 150,000 150,000 150,000
Maximum adsorption (scf/ton)
Langmuir coefficient (1/psi)
- - 2000
0.00044

Model initialization
Injecting 5,000 bbl of 1,000 ppm salinity-water
17
Water saturation in fractures, fraction Water salinity in fractures, ppm

18
Base case
Gas flow rate
Cum. gas
0-day shut-in
7-day shut-in
15-day shut-in
30-day shut-in
Water saturation in fractures, fraction
Well shut-in increases gas flow rate
19
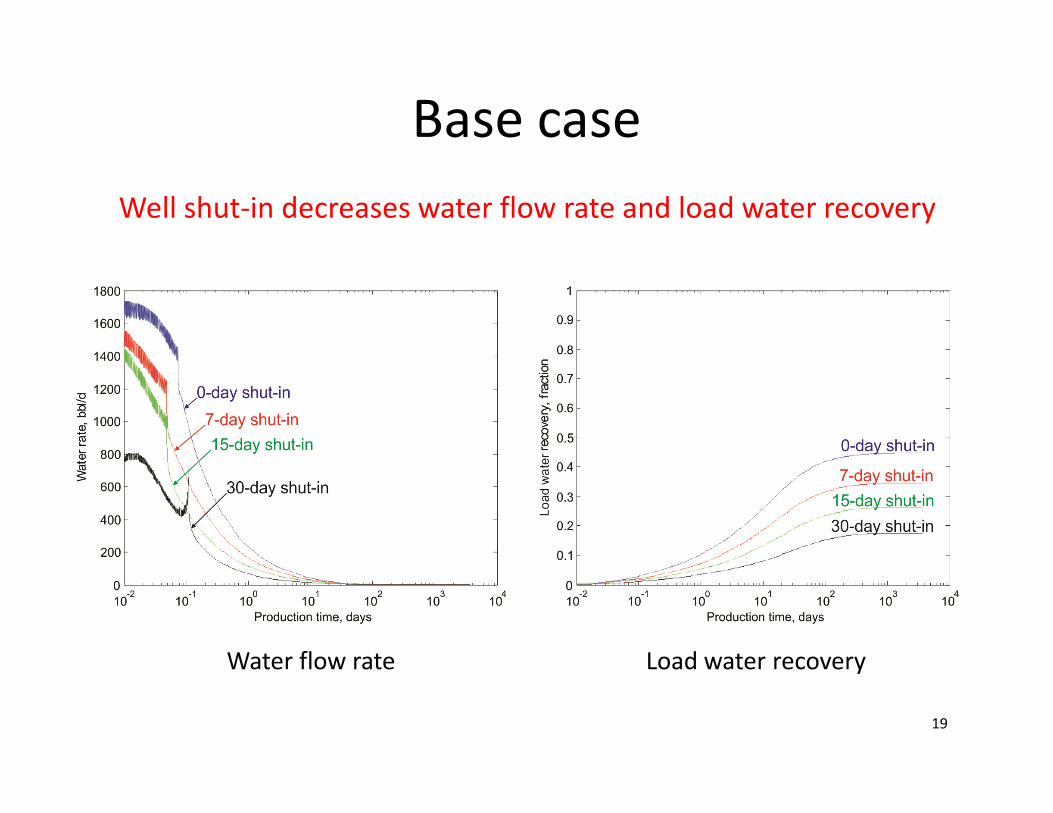
Base case
Well shut-in decreases water flow rate and load water recovery
Water flow rate Load water recovery

20
Base case
Produced water salinity profile is similar to field observation
Produced water salinity, ppm

21
Case 1: Wettability effect (without osmotic)
Base case:
Mixed-wet rockWater-wet rock Oil-wet rock
Water saturation in fractures, fraction
Capillary pressure helps imbibe the fracturing fluid filtrate into matrix

22
Case 1: Wettability effect (without osmotic)
Gas flow rate
15-day shut-in
Load water recovery
15-day shut-in
Capillary pressure helps increase gas flow rate and decrease
load water recovery after well shut-in
23
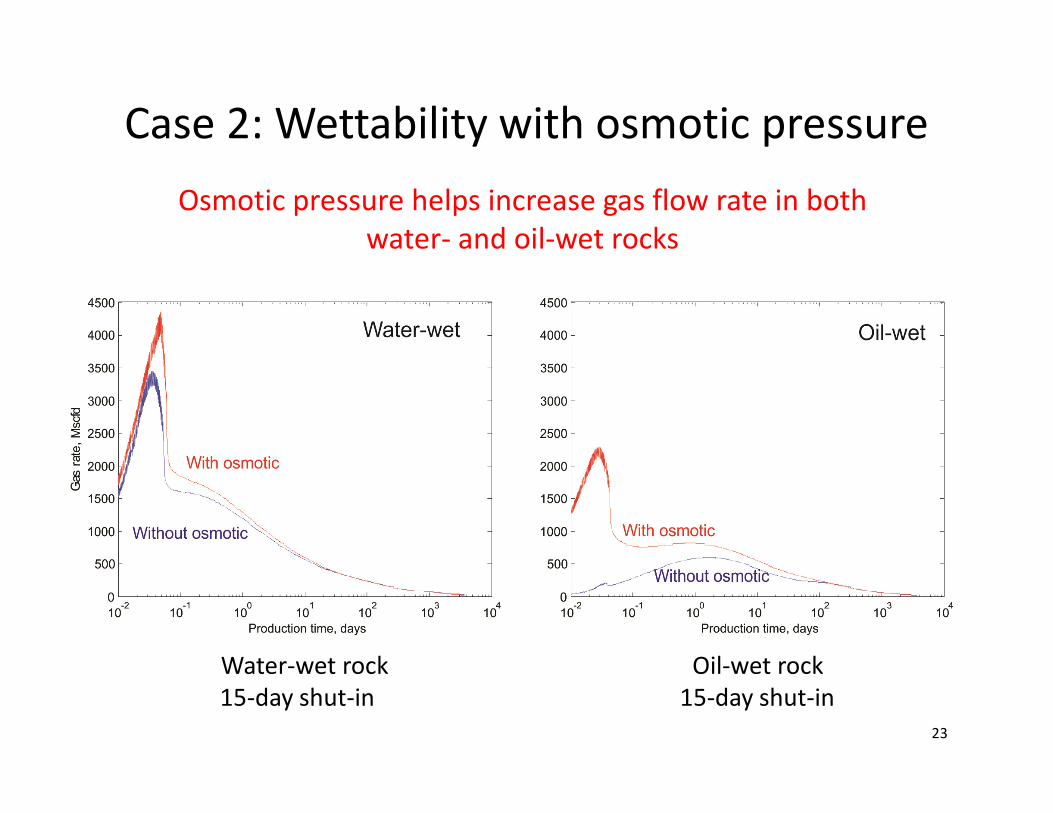
Case 2: Wettability with osmotic pressure
Water-wet rock
15-day shut-in
Oil-wet rock
15-day shut-in
Osmotic pressure helps increase gas flow rate in both
water- and oil-wet rocks

24
Case 3: Osmotic efficiency effect
Gas flow rate
15-day shut-in
Load water recovery
15-day shut-in
(base case)
(base case)
Osmotic pressure helps increase gas flow if osmotic
pressure efficiency is larger than 1%

25
Part I discussions:
• Well shut-in can increase gas flow rate if (1) inorganic
matrix is water-wet or mixed-wet, and (2) osmotic
pressure efficiency is larger than 1% .
• Well shut-in increases gas flow rate for about a month
without a significant cumulative production gain.
• Osmotic pressure promotes filtrate mass transfer between
fractures and matrix not only in the water-wet but also in
the oil-wet rocks.
• Gravity has minimal effect on the filtrate imbibition during
the well shut-in because shale matrix are very tight.

Part II: Effects of waterflooding-
induced stress on microfracture
creation
26

Model setup
27

Input parameters
28

' ' '
1 3 3N N Nm Sσ σ σ= + +
' ' '
1 3 31
N N NHB mσ σ σ= − − +
Hoek-Brown failure criterion:
Failure indicator:
Positive HB indicates rock failure
Failure criterion
29

30
Pressure and water saturation

31
Temperature and stress change
32
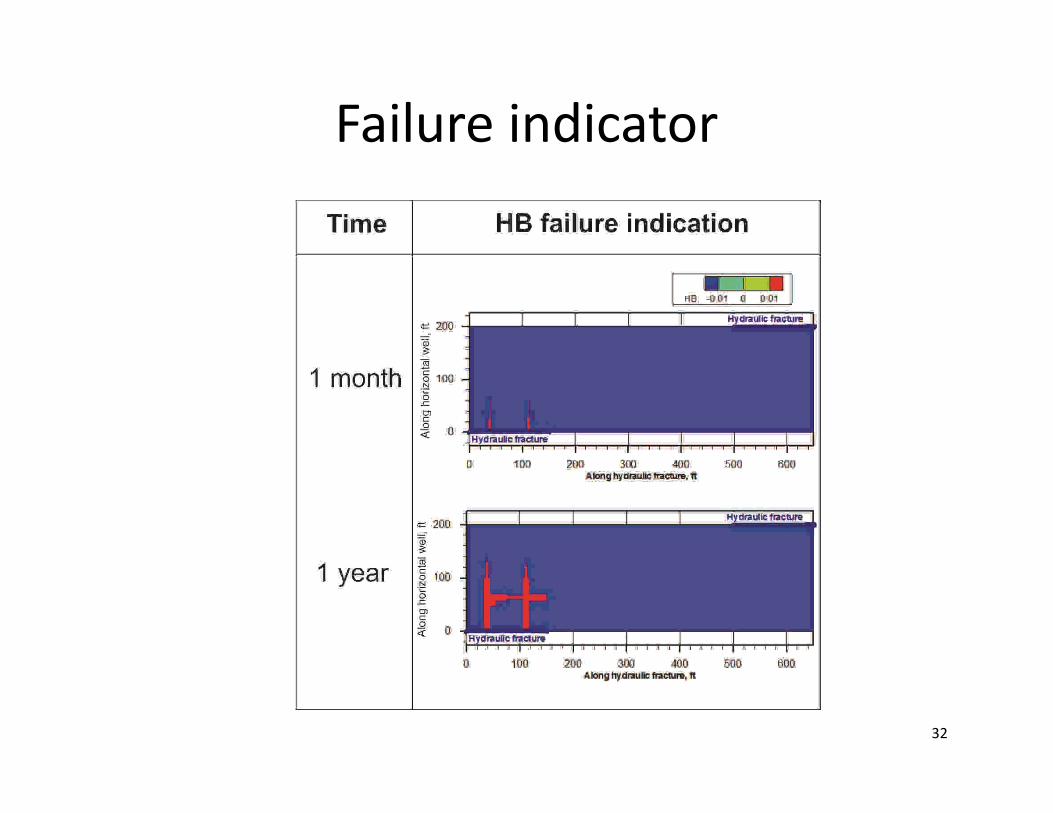
Failure indicator

33
• Pressure- and temperature-induced stress during
waterflooding could reactivate existing natural fractures or
create new microfractures
• These microfractures increases the interface area
between fractures and matrix
• These positive effects could take place farther away from
the immediate vicinity of hydraulic fractures.
Part II Discussions

34
Low-salinity cold-water injection could be used as an
enhance recovery method. The resulting enhanced
recovery mechanisms include:
• Increase fracture-matrix interface area due to
microfracturing
• Promote oil-water and oil-gas counter-current
flow due to capillarity and osmoticity
Part I and II: Enhanced oil and gas
production in shale formations
Overall conclusions
• Two mathematical models, fluid-flow in organic-rich
shale, and flow and geomechanics in anisotropic
rock, were developed:
• The models were validated against analytical
solutions and laboratory measurement.
• Two numerical studies were conducted to investigate
the underlying assumptions.
• The study results indicate the possibility of devising
an enhanced oil and gas recovery scheme in shale
formations to use low-salinity water injection.35
Recommendations
Measure:
• Relative permeability
• Capillary pressure
• Osmotic pressure
Further investigate using low-salinity cold-water injection as an enhanced recovery method in shales:
• Temperature-induced microfractures, similar to Siratovich et al. (2011) experiments but using shale samples
• Spontaneous imbibition with different water salinity
• Core flooding using fractured shale samples with low-salinity water
36

Recommendations (continued)
Extend the presented models to include:
• Geomechanics calculations for fractured rocks using (1) continuum
concept for natural fractures and (2) discrete fractures for hydraulic
fractures
• Shale matrix refinement to capture capillary end effect and transient
flow in shale matrix
37
Acknowledgements
• My advisors: Dr. Wu and Dr. Kazemi
• Dr. Winterfeld, Dr. Ozkan, Dr. Tutuncu, Dr. Griffiths, Dr. Yin, Dr. Miskimins, Dr. Curtis, and Dr. Rutqvist
• My classmates
• Denise Winn-Bower
• EMG for financial support
• MCERS, UNGI, FAST, and foundation CMG
• My wife Dr. Sarinya
38

39
Q&A