cse512 :: 14 jan 2014 visualization design
TRANSCRIPT

CSE512 :: 14 Jan 2014
Visualization Design
Jeffrey Heer University of Washington

Last Time:Data and Image Models

The Big Picturetaskquestions & hypothesesintended audience
dataphysical type int, float, etc.abstract type nominal, ordinal, etc.
domainmetadatasemantics conceptual model
processingalgorithms
mappingvisual encodingvisual metaphor
imagevisual channelperception
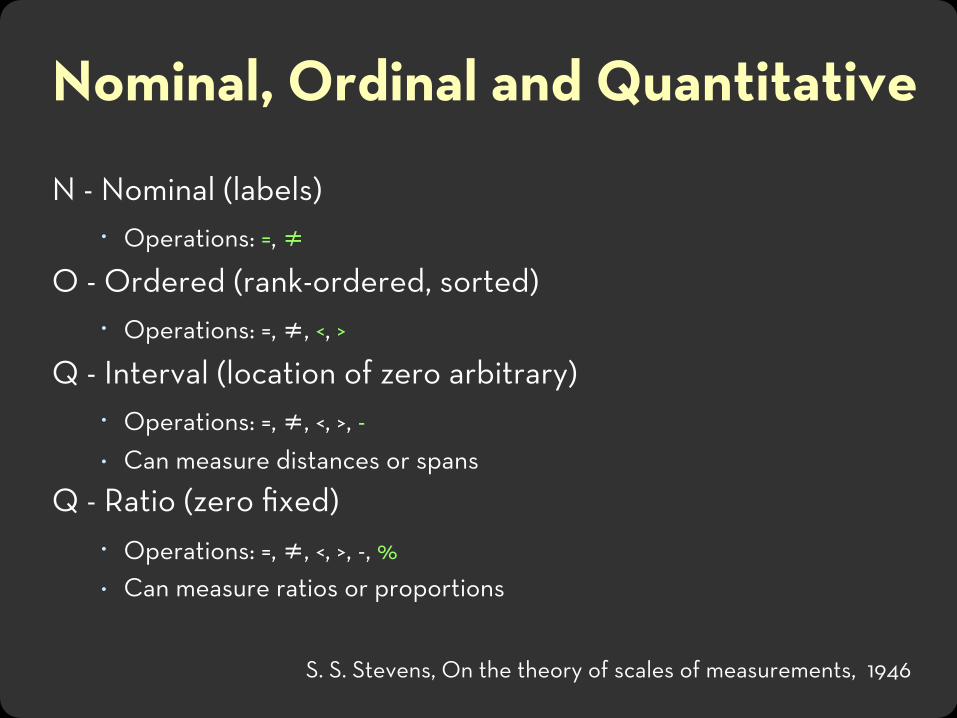
Nominal, Ordinal and Quantitative
N - Nominal (labels) Operations: =, ≠
O - Ordered (rank-ordered, sorted) Operations: =, ≠, <, >
Q - Interval (location of zero arbitrary) Operations: =, ≠, <, >, - Can measure distances or spans
Q - Ratio (zero fixed) Operations: =, ≠, <, >, -, % Can measure ratios or proportions
S. S. Stevens, On the theory of scales of measurements, 1946
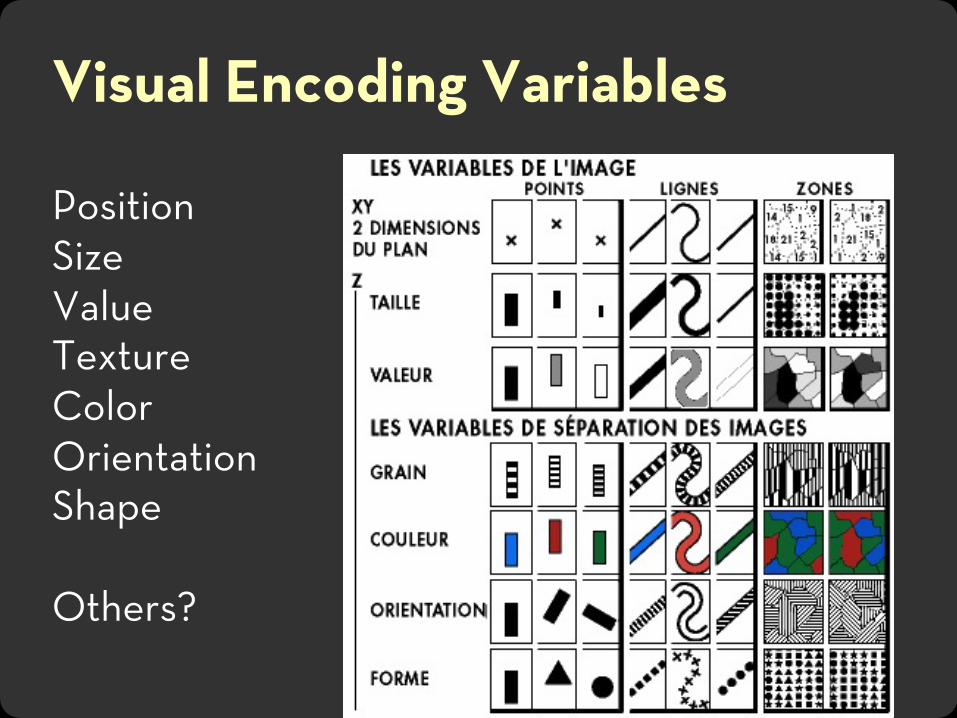
PositionSizeValueTextureColorOrientationShape
Others?
Visual Encoding Variables

Formalizing Design(Mackinlay 1986)

Choosing Visual Encodings
Challenge: Assume 8 visual encodings and n data attributes.We would like to pick the “best” encoding among a combinatorial set of possibilities with size (n+1)8
Principle of Consistency: The properties of the image (visual variables) should match the properties of the data.
Principle of Importance Ordering: Encode the most important information in the most effective way.

ExpressivenessA set of facts is expressible in a visual language if the sentences (i.e. the visualizations) in the language express all the facts in the set of data, and only the facts in the data.
Design Criteria (Mackinlay)
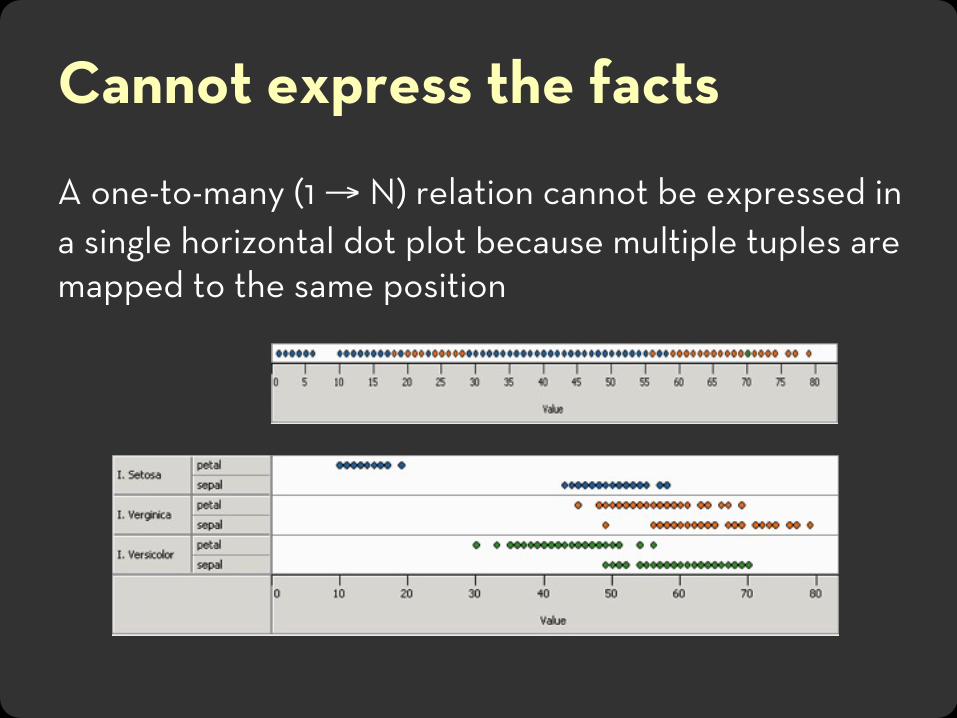
Cannot express the facts
A one-to-many (1 → N) relation cannot be expressed in a single horizontal dot plot because multiple tuples are mapped to the same position
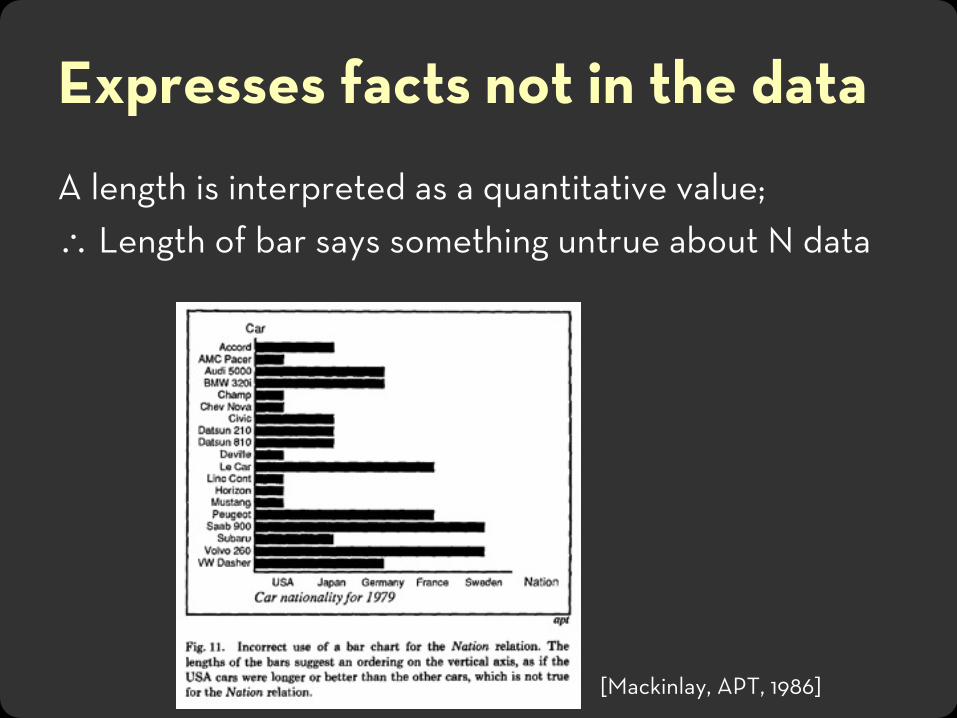
Expresses facts not in the dataA length is interpreted as a quantitative value;∴ Length of bar says something untrue about N data
[Mackinlay, APT, 1986]

ExpressivenessA set of facts is expressible in a visual language if the sentences (i.e. the visualizations) in the language express all the facts in the set of data, and only the facts in the data.
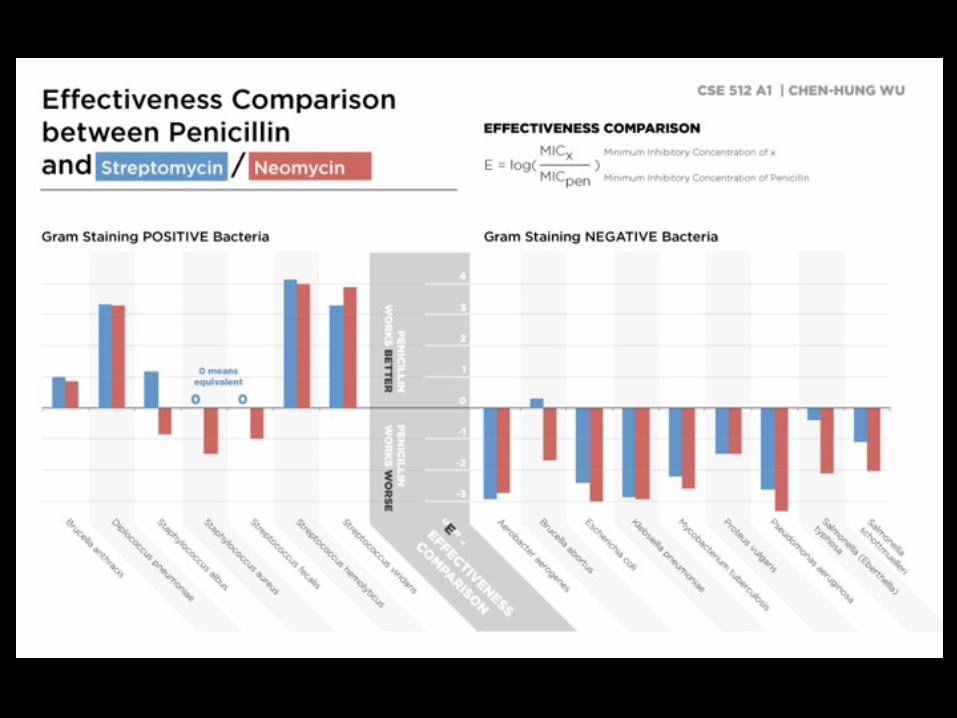
EffectivenessA visualization is more effective than another visualization if the information conveyed by one visualization is more readily perceived than the information in the other visualization.
Design Criteria (Mackinlay)
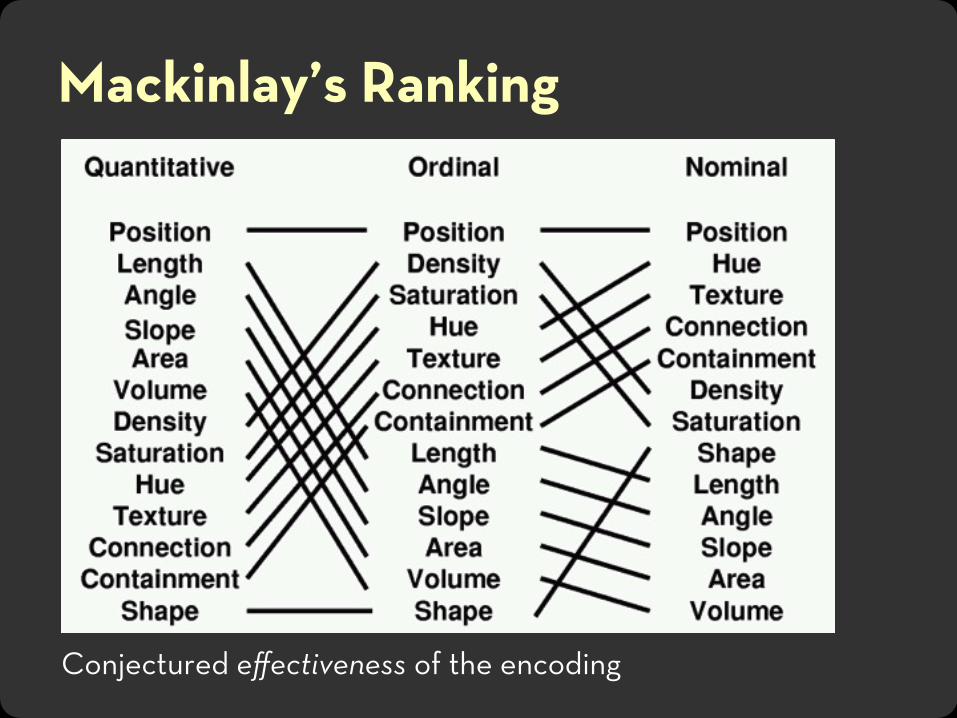
Mackinlay’s Ranking
Conjectured effectiveness of the encoding

Mackinlay’s Design Algorithm
User formally specifies data model and type Additional input: ordered list of data variables to show
APT searches over design space Tests expressiveness of each visual encoding Generates specification for encodings that pass test
Tests perceptual effectiveness of resulting image
Outputs the “most effective” visualization

Limitations
Does not cover many visualization techniques Bertin and others discuss networks, maps, diagrams
Does not consider 3D, animation, illustration, photography, …
Does not model interaction
Does not consider semantic data types / conventions

Assignment 1 Review
Design Considerations
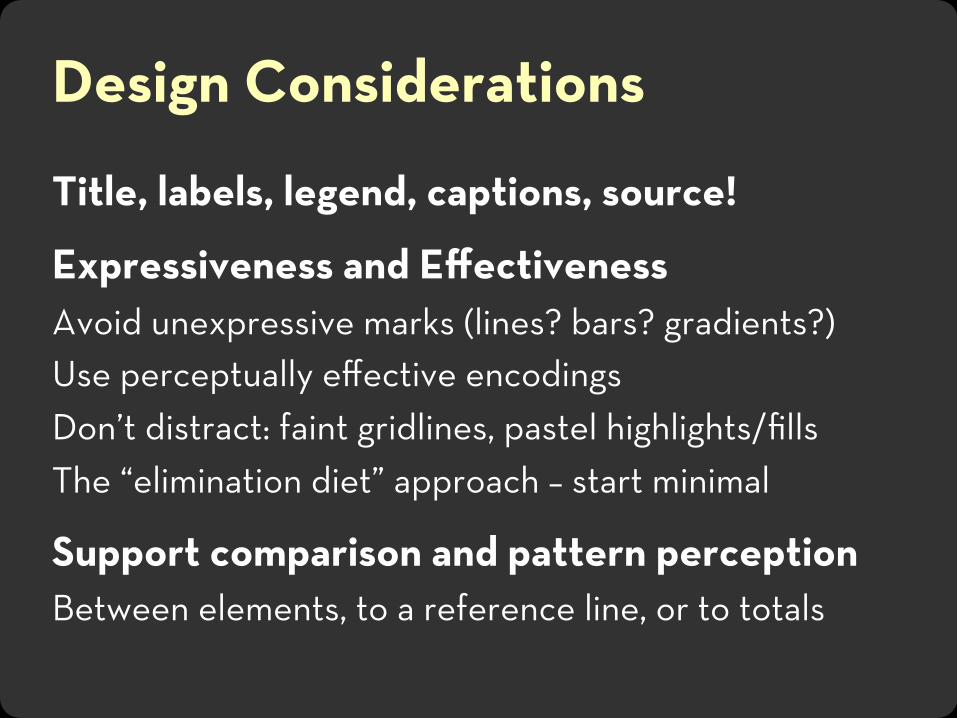
Title, labels, legend, captions, source!
Expressiveness and EffectivenessAvoid unexpressive marks (lines? bars? gradients?)Use perceptually effective encodingsDon’t distract: faint gridlines, pastel highlights/fillsThe “elimination diet” approach – start minimal
Support comparison and pattern perceptionBetween elements, to a reference line, or to totals

Design ConsiderationsGroup / sort data by meaningful dimensionsTransform data (e.g., invert, log, normalize)Are model choices (regression lines) appropriate?
Reduce cognitive overheadMinimize visual search, minimize ambiguity-> Avoid legend lookups if direct labeling works-> Avoid color mappings with indiscernible colors
Be consistent! Visual inferences should consistently support data inferences

In-Class Review RubricExpressiveness
Prioritizes important information / Avoids false inferences Consistent visual mappings (e.g., respect color mappings) Make encodings meaningful rather than arbitrary
Effectiveness Facilitates accurate decoding / Minimizes cognitive overhead Highlight elements of primary interest
Grouping / SortingData TransformationNon-Data Elements
Descriptive: Title, Label, Caption, Data Source, Annotations Reference: Gridlines, Legend

Bar Charts


27


33


Line Charts


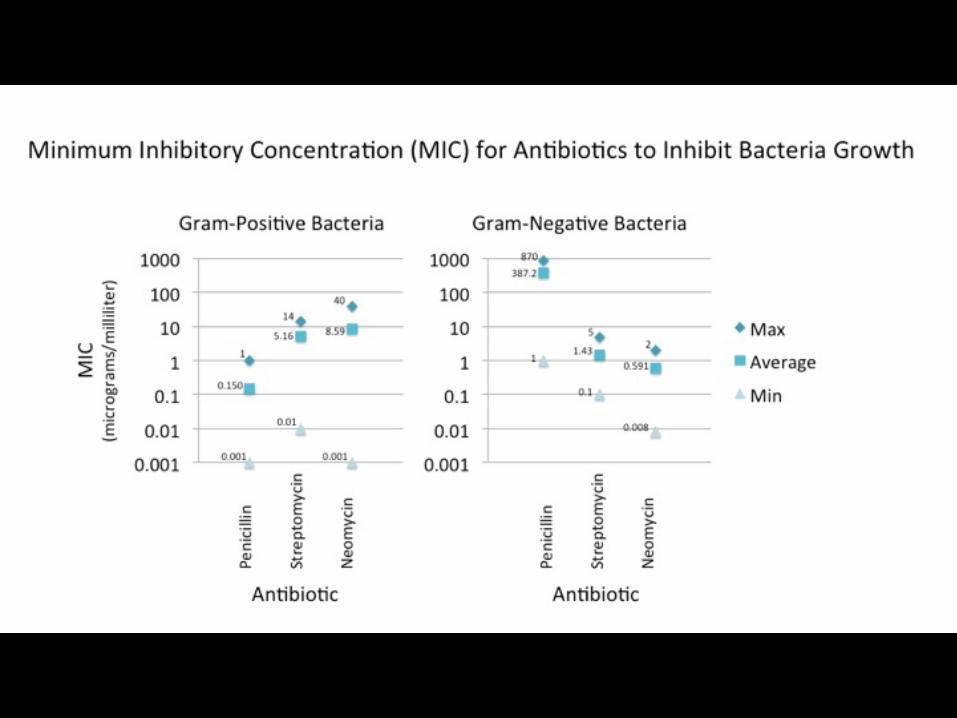
Dot Plots


Tables / Heat Maps


Other


Visualization DesignIn-Class Exercise

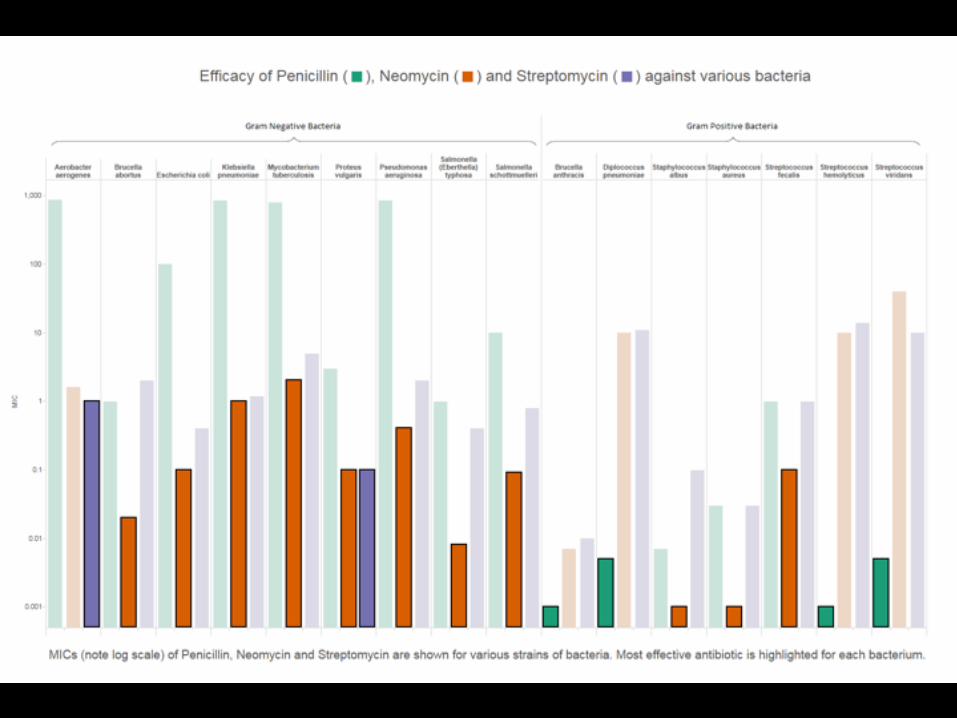
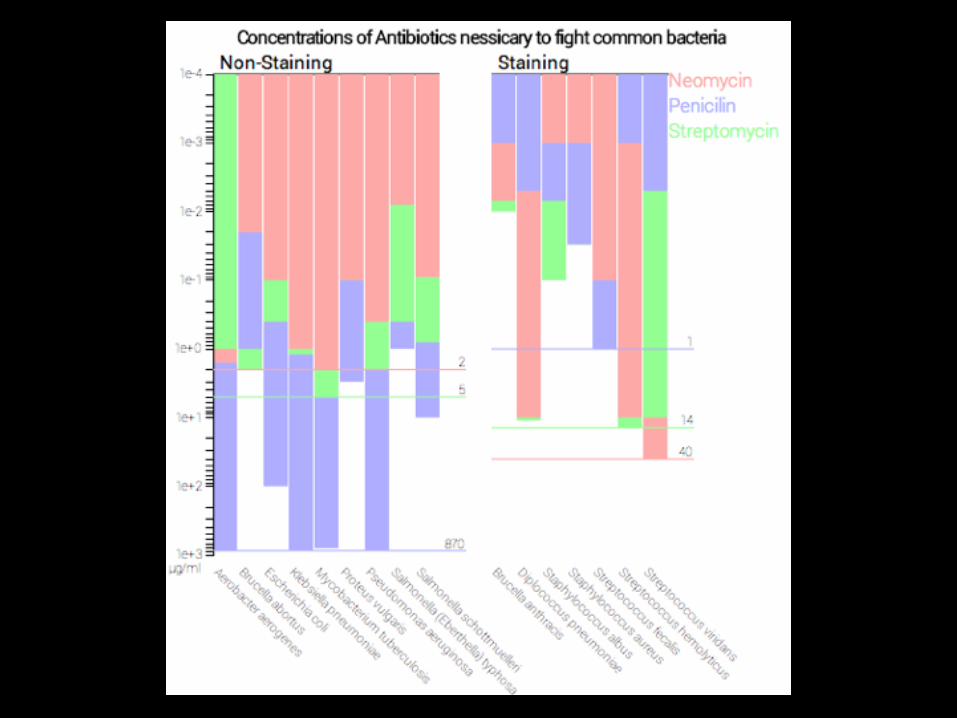
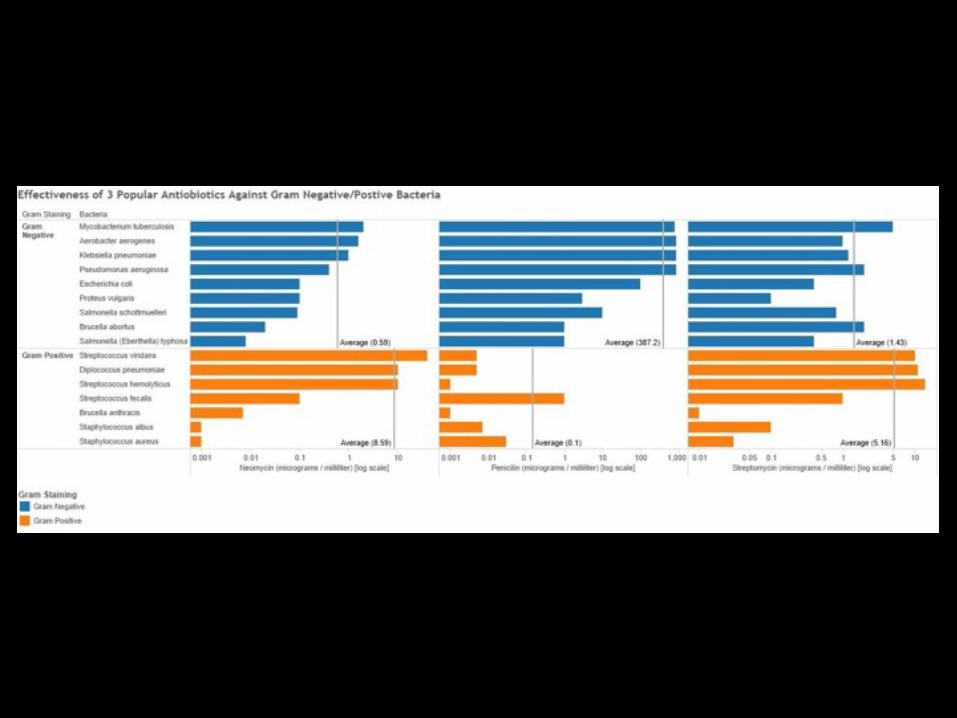
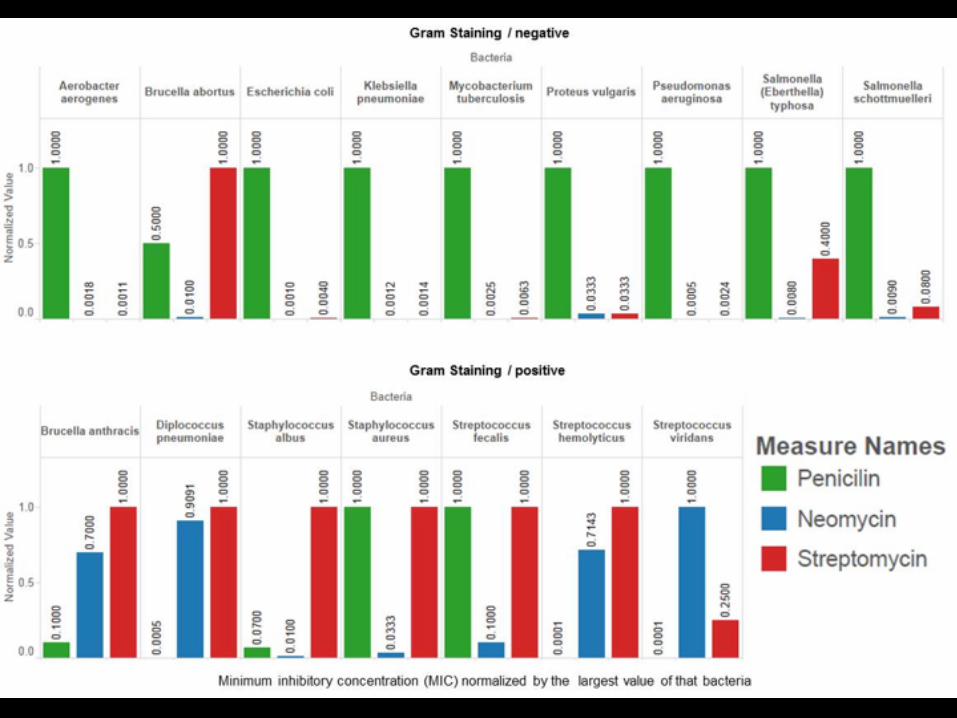
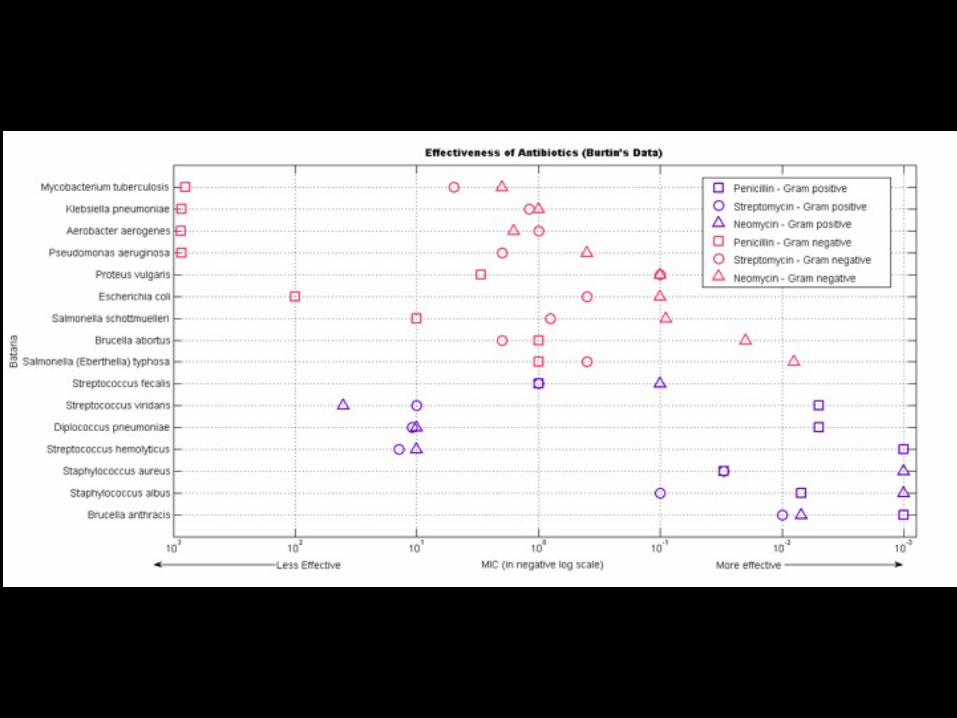
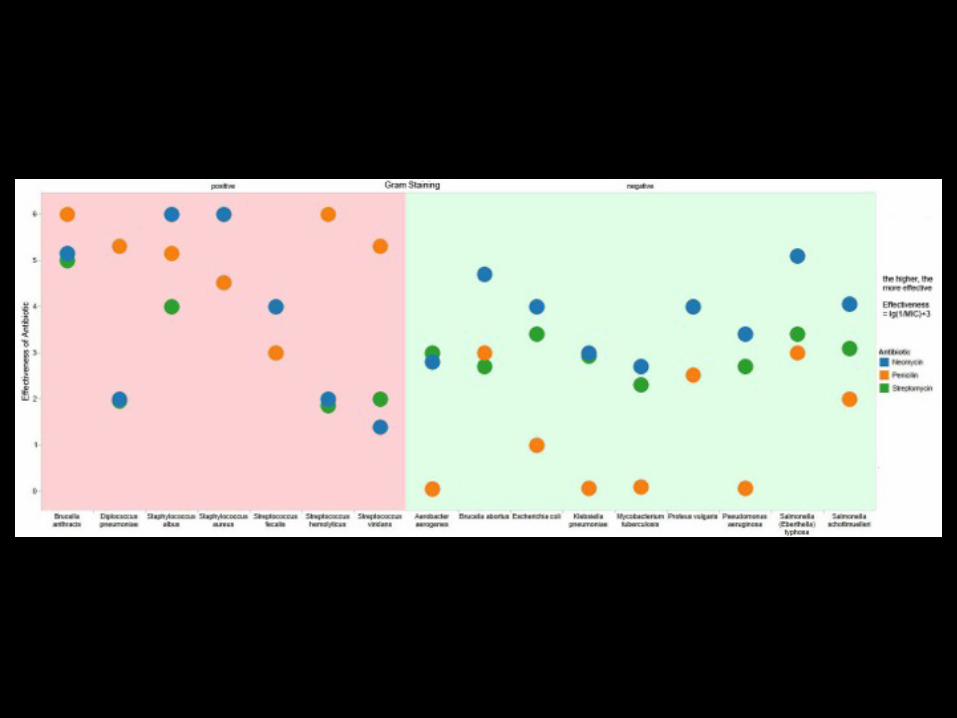
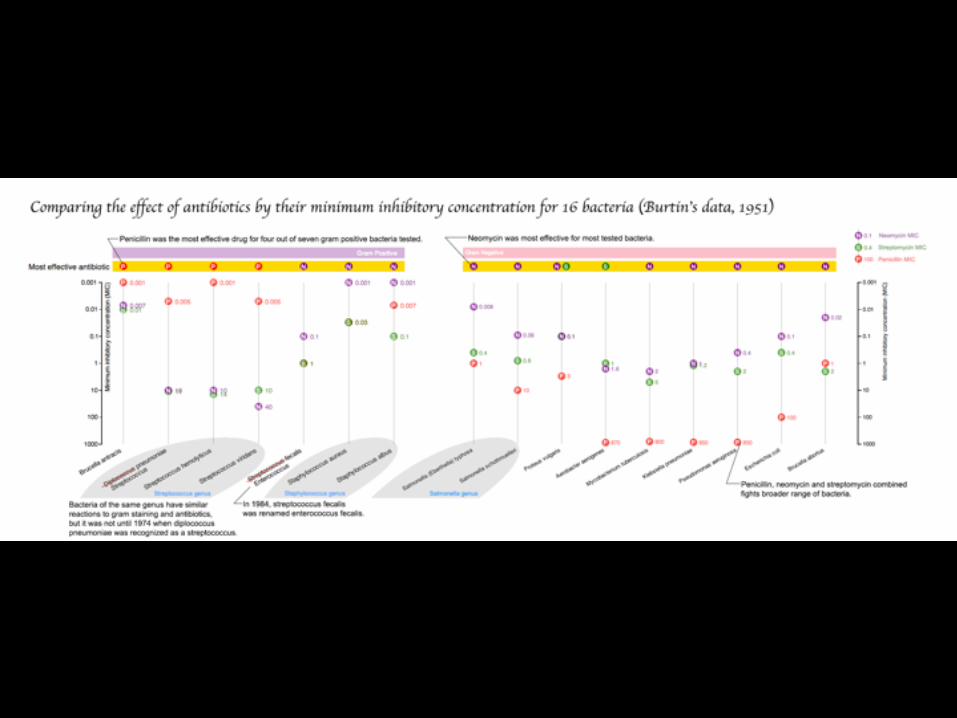
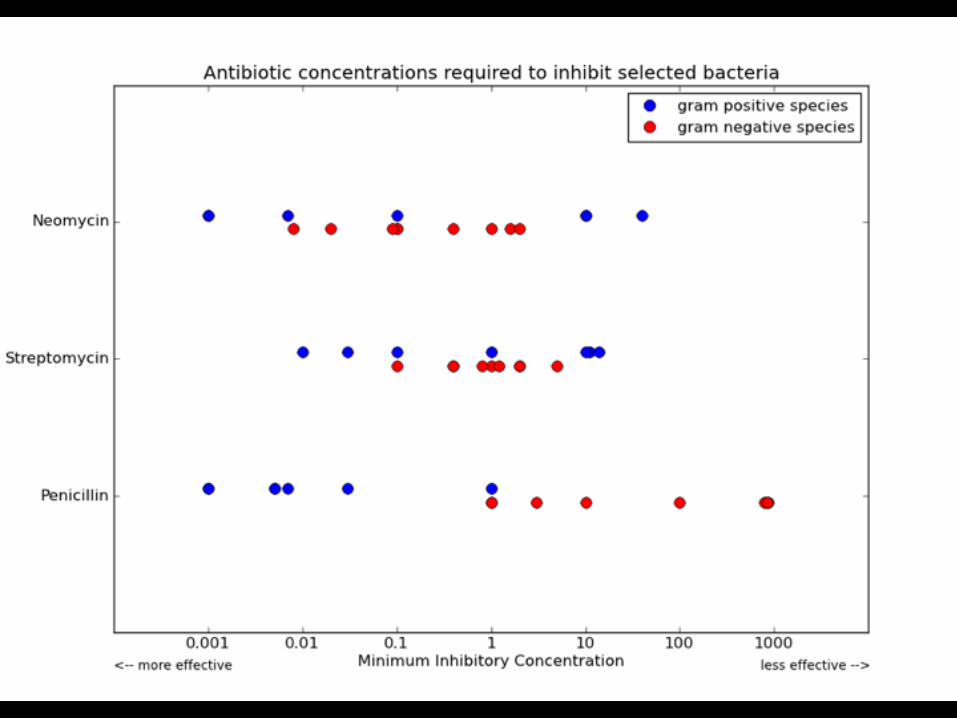
In-Class Design Exercise
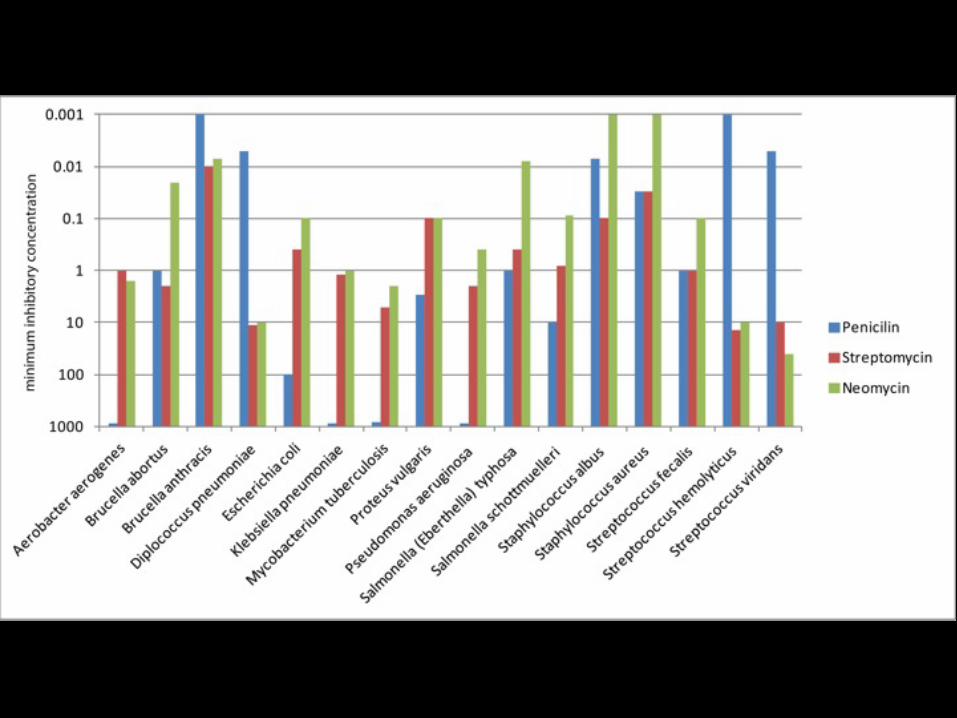
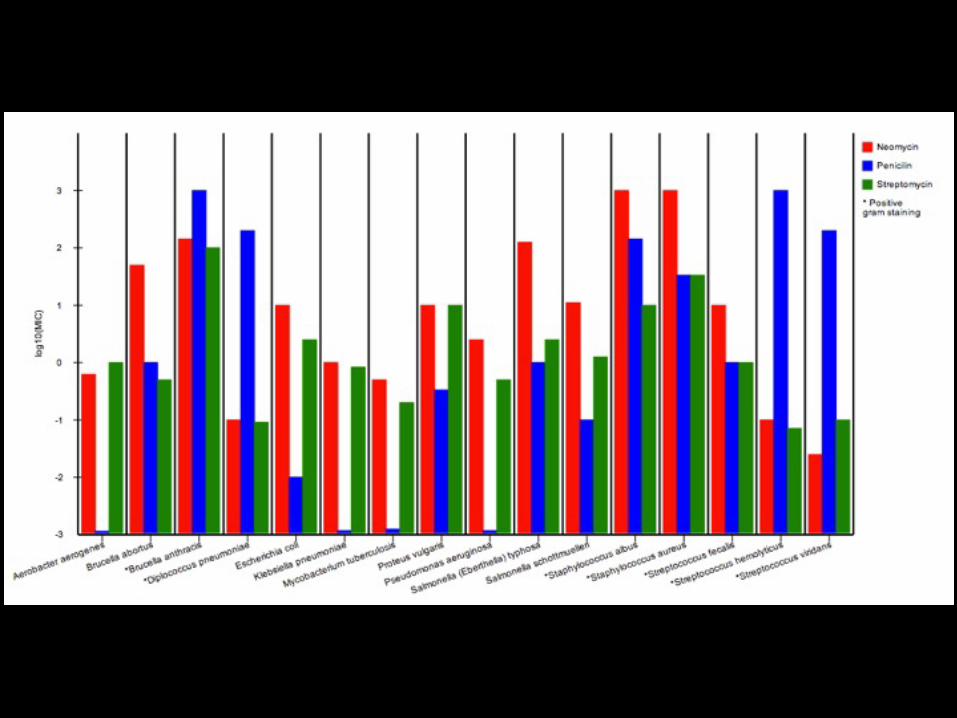
Task: Analyze and Re-design visualization
Identify data variables (n,o,q) and encodings Critique the design: what works, what doesn’t Sketch a re-design to improve communication Be ready to share your thoughts with the class
Break into groups with those sitting near you(~4 people per group)

Mackinlay’s Ranking
Conjectured effectiveness of the encoding
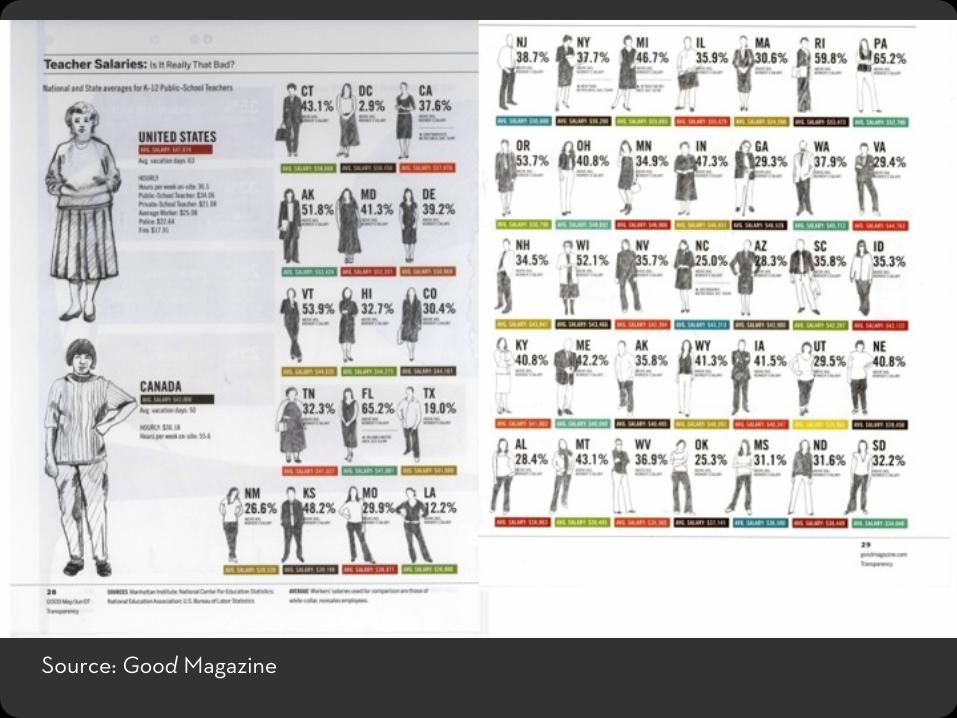
Source: Good Magazine
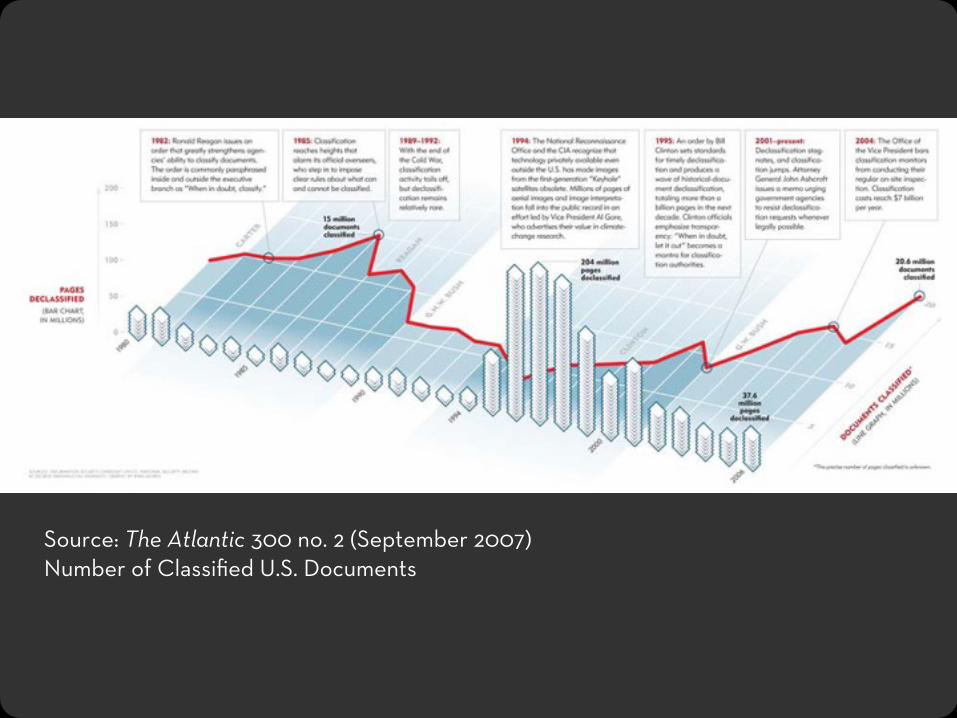
Source: The Atlantic 300 no. 2 (September 2007) Number of Classified U.S. Documents

Washington Dulles Airport MapSource: United Airlines Hemispheres

Source: National Geographic, September, 2008, p. 22.Silver, Mark. "High School Give-and-Take."
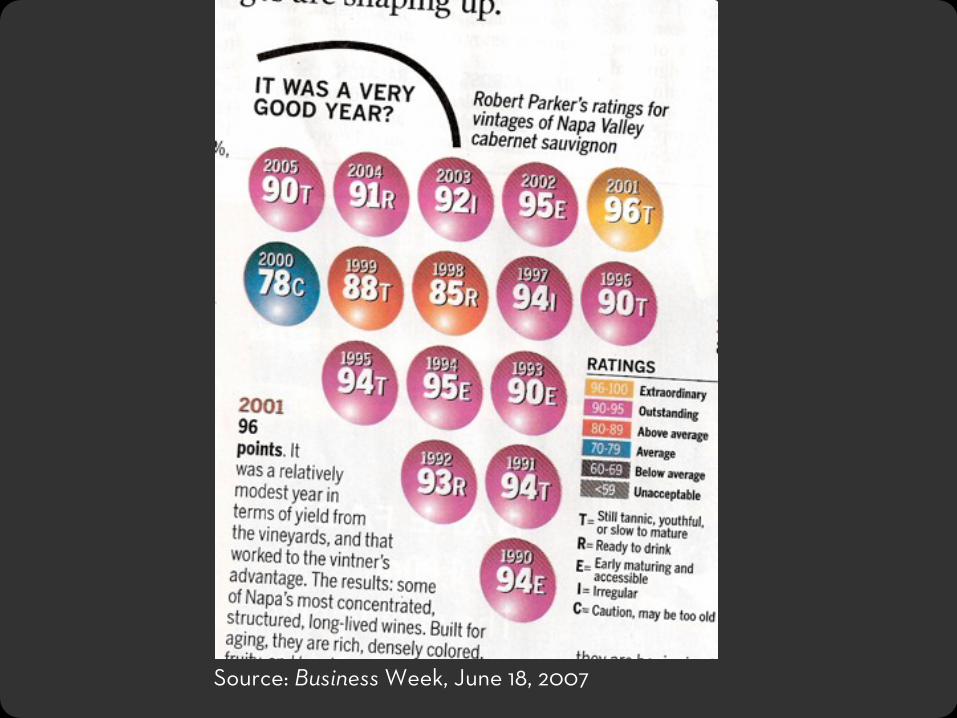
Source: Business Week, June 18, 2007

Preparing for a PandemicSource: Scientific American, 293(5). November, 2005, p. 50

Source: Wired Magazine, September 2008 EditionMusic: Super Cuts (page 92)