cse 7/5337: information retrieval and web search...
TRANSCRIPT

CSE 7/5337: Information Retrieval and Web SearchEvaluation & Result Summaries (IIR 8)
Michael Hahsler
Southern Methodist University
These slides are largely based on the slides by Hinrich SchutzeInstitute for Natural Language Processing, University of Stuttgart
http://informationretrieval.org
Spring 2012
Hahsler (SMU) CSE 7/5337 Spring 2012 1 / 52
Overview
1 Unranked evaluation
2 Ranked evaluation
3 Evaluation benchmarks
4 Result summaries
Hahsler (SMU) CSE 7/5337 Spring 2012 2 / 52

Outline
1 Unranked evaluation
2 Ranked evaluation
3 Evaluation benchmarks
4 Result summaries
Hahsler (SMU) CSE 7/5337 Spring 2012 3 / 52

Measures for a search engine
How fast does it indexI e.g., number of bytes per hour
How fast does it searchI e.g., latency as a function of queries per second
What is the cost per query?I in dollars
Hahsler (SMU) CSE 7/5337 Spring 2012 4 / 52

Measures for a search engine
All of the preceding criteria are measurable: we can quantify speed /size / money
However, the key measure for a search engine is user happiness.
What is user happiness?
Factors include:I Speed of responseI Size of indexI Uncluttered UII Most important: relevanceI (actually, maybe even more important: it’s free)
Note that none of these is sufficient: blindingly fast, but uselessanswers won’t make a user happy.
How can we quantify user happiness?
Hahsler (SMU) CSE 7/5337 Spring 2012 5 / 52
Who is the user?
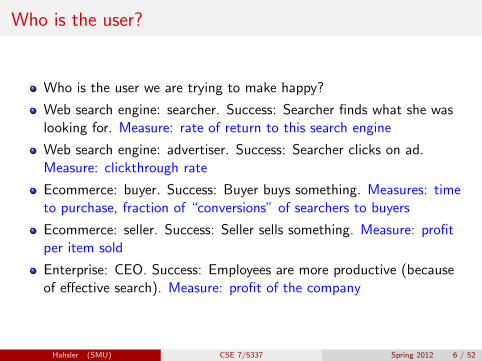
Who is the user we are trying to make happy?
Web search engine: searcher. Success: Searcher finds what she waslooking for. Measure: rate of return to this search engine
Web search engine: advertiser. Success: Searcher clicks on ad.Measure: clickthrough rate
Ecommerce: buyer. Success: Buyer buys something. Measures: timeto purchase, fraction of “conversions” of searchers to buyers
Ecommerce: seller. Success: Seller sells something. Measure: profitper item sold
Enterprise: CEO. Success: Employees are more productive (becauseof effective search). Measure: profit of the company
Hahsler (SMU) CSE 7/5337 Spring 2012 6 / 52
Most common definition of user happiness: Relevance
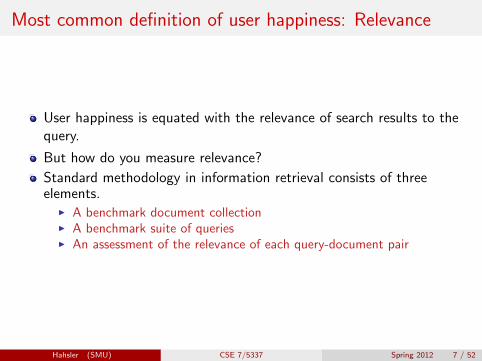
User happiness is equated with the relevance of search results to thequery.
But how do you measure relevance?
Standard methodology in information retrieval consists of threeelements.
I A benchmark document collectionI A benchmark suite of queriesI An assessment of the relevance of each query-document pair
Hahsler (SMU) CSE 7/5337 Spring 2012 7 / 52

Relevance: query vs. information need
Relevance to what?
First take: relevance to the query
“Relevance to the query” is very problematic.
Information need i : “I am looking for information on whether drinkingred wine is more effective at reducing your risk of heart attacks thanwhite wine.”
This is an information need, not a query.
Query q: [red wine white wine heart attack]
Consider document d ′: At heart of his speech was an attack on thewine industry lobby for downplaying the role of red and white wine indrunk driving.
d ′ is an excellent match for query q . . .
d ′ is not relevant to the information need i .
Hahsler (SMU) CSE 7/5337 Spring 2012 8 / 52
Relevance: query vs. information need
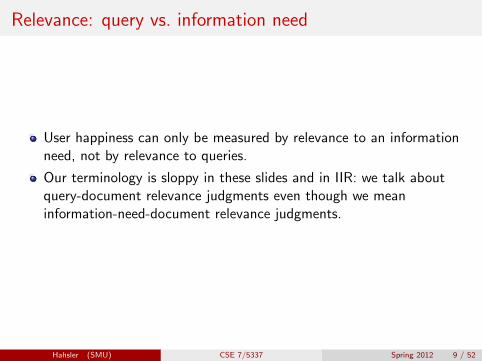
User happiness can only be measured by relevance to an informationneed, not by relevance to queries.
Our terminology is sloppy in these slides and in IIR: we talk aboutquery-document relevance judgments even though we meaninformation-need-document relevance judgments.
Hahsler (SMU) CSE 7/5337 Spring 2012 9 / 52

Precision and recall
Precision (P) is the fraction of retrieved documents that are relevant
Precision =#(relevant items retrieved)
#(retrieved items)= P(relevant|retrieved)
Recall (R) is the fraction of relevant documents that are retrieved
Recall =#(relevant items retrieved)
#(relevant items)= P(retrieved|relevant)
Hahsler (SMU) CSE 7/5337 Spring 2012 10 / 52

Precision and recall
Relevant Nonrelevant
Retrieved true positives (TP) false positives (FP)
Not retrieved false negatives (FN) true negatives (TN)
P = TP/(TP + FP)
R = TP/(TP + FN)
Hahsler (SMU) CSE 7/5337 Spring 2012 11 / 52

Precision/recall tradeoff
You can increase recall by returning more docs.
Recall is a non-decreasing function of the number of docs retrieved.
A system that returns all docs has 100% recall!
The converse is also true (usually): It’s easy to get high precision forvery low recall.
Suppose the document with the largest score is relevant. How can wemaximize precision?
Hahsler (SMU) CSE 7/5337 Spring 2012 12 / 52
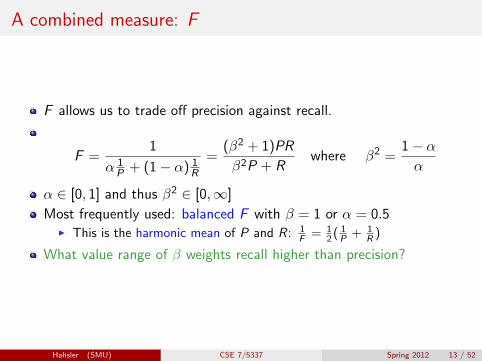
A combined measure: F
F allows us to trade off precision against recall.
F =1
α 1P + (1− α) 1
R
=(β2 + 1)PR
β2P + Rwhere β2 =
1− αα
α ∈ [0, 1] and thus β2 ∈ [0,∞]
Most frequently used: balanced F with β = 1 or α = 0.5I This is the harmonic mean of P and R: 1
F = 12 ( 1
P + 1R )
What value range of β weights recall higher than precision?
Hahsler (SMU) CSE 7/5337 Spring 2012 13 / 52
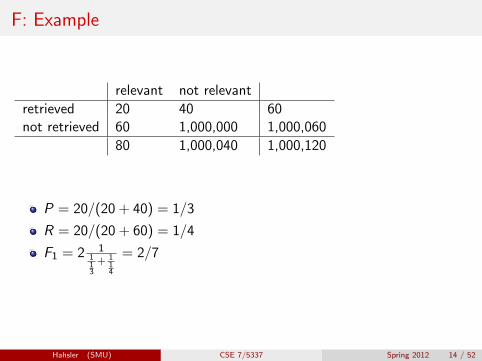
F: Example
relevant not relevant
retrieved 20 40 60not retrieved 60 1,000,000 1,000,060
80 1,000,040 1,000,120
P = 20/(20 + 40) = 1/3
R = 20/(20 + 60) = 1/4
F1 = 2 1113
+ 114
= 2/7
Hahsler (SMU) CSE 7/5337 Spring 2012 14 / 52
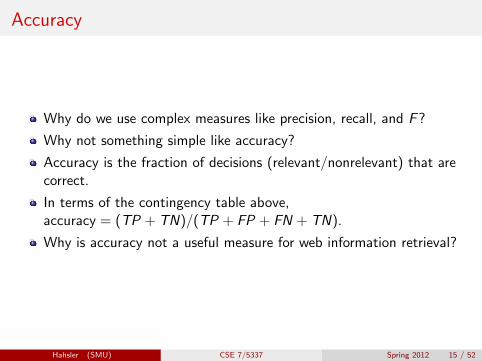
Accuracy
Why do we use complex measures like precision, recall, and F?
Why not something simple like accuracy?
Accuracy is the fraction of decisions (relevant/nonrelevant) that arecorrect.
In terms of the contingency table above,accuracy = (TP + TN)/(TP + FP + FN + TN).
Why is accuracy not a useful measure for web information retrieval?
Hahsler (SMU) CSE 7/5337 Spring 2012 15 / 52
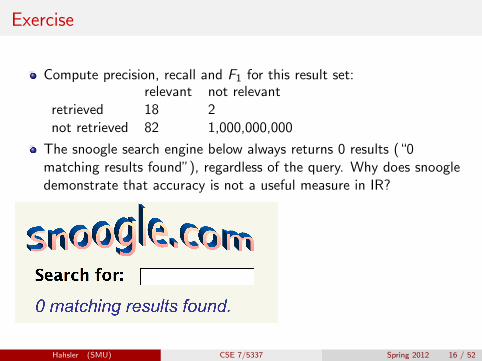
Exercise
Compute precision, recall and F1 for this result set:relevant not relevant
retrieved 18 2not retrieved 82 1,000,000,000
The snoogle search engine below always returns 0 results (“0matching results found”), regardless of the query. Why does snoogledemonstrate that accuracy is not a useful measure in IR?
Hahsler (SMU) CSE 7/5337 Spring 2012 16 / 52
Why accuracy is a useless measure in IR
Simple trick to maximize accuracy in IR: always say no and returnnothing
You then get 99.99% accuracy on most queries.
Searchers on the web (and in IR in general) want to find somethingand have a certain tolerance for junk.
It’s better to return some bad hits as long as you return something.
→ We use precision, recall, and F for evaluation, not accuracy.
Hahsler (SMU) CSE 7/5337 Spring 2012 17 / 52
F: Why harmonic mean?
Why don’t we use a different mean of P and R as a measure?I e.g., the arithmetic mean
The simple (arithmetic) mean is 50% for “return-everything” searchengine, which is too high.
Desideratum: Punish really bad performance on either precision orrecall.
Taking the minimum achieves this.
But minimum is not smooth and hard to weight.
F (harmonic mean) is a kind of smooth minimum.
Hahsler (SMU) CSE 7/5337 Spring 2012 18 / 52

F1 and other averages
0
20
40
60
80
100
0 20 40 60 80 100
Precision (Recall fixed at 70%)
Minimum
Maximum
Arithmetic
Geometric
Harmonic
We can view the harmonic mean as a kind of soft minimum
Hahsler (SMU) CSE 7/5337 Spring 2012 19 / 52
Difficulties in using precision, recall and F
We need relevance judgments for information-need-document pairs –but they are expensive to produce.
For alternatives to using precision/recall and having to producerelevance judgments – see end of this lecture.
Hahsler (SMU) CSE 7/5337 Spring 2012 20 / 52
Outline
1 Unranked evaluation
2 Ranked evaluation
3 Evaluation benchmarks
4 Result summaries
Hahsler (SMU) CSE 7/5337 Spring 2012 21 / 52
Precision-recall curve
Precision/recall/F are measures for unranked sets.
We can easily turn set measures into measures of ranked lists.
Just compute the set measure for each “prefix”: the top 1, top 2, top3, top 4 etc results
Doing this for precision and recall gives you a precision-recall curve.
Hahsler (SMU) CSE 7/5337 Spring 2012 22 / 52
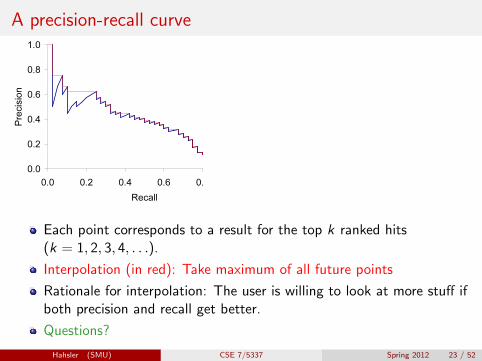
A precision-recall curve
0.0
0.2
0.4
0.6
0.8
1.0
0.0 0.2 0.4 0.6 0.8 1.0
Recall
Precision
Each point corresponds to a result for the top k ranked hits(k = 1, 2, 3, 4, . . .).
Interpolation (in red): Take maximum of all future points
Rationale for interpolation: The user is willing to look at more stuff ifboth precision and recall get better.
Questions?
Hahsler (SMU) CSE 7/5337 Spring 2012 23 / 52

11-point interpolated average precision
Recall InterpolatedPrecision
0.0 1.000.1 0.670.2 0.630.3 0.550.4 0.450.5 0.410.6 0.360.7 0.290.8 0.130.9 0.101.0 0.08
11-point average: ≈0.425
How can precisionat 0.0 be > 0?
Hahsler (SMU) CSE 7/5337 Spring 2012 24 / 52
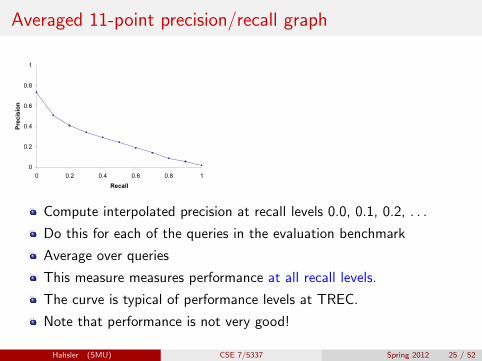
Averaged 11-point precision/recall graph
0
0.2
0.4
0.6
0.8
1
0 0.2 0.4 0.6 0.8 1
Recall
Precision
Compute interpolated precision at recall levels 0.0, 0.1, 0.2, . . .
Do this for each of the queries in the evaluation benchmark
Average over queries
This measure measures performance at all recall levels.
The curve is typical of performance levels at TREC.
Note that performance is not very good!
Hahsler (SMU) CSE 7/5337 Spring 2012 25 / 52
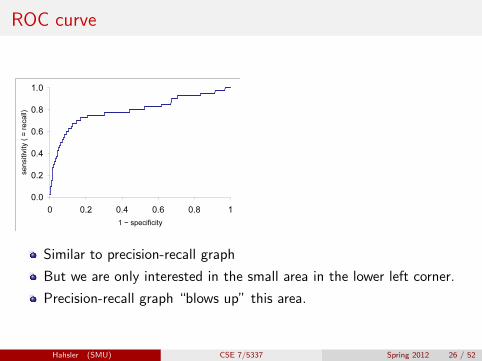
ROC curve
0.0
0.2
0.4
0.6
0.8
1.0
0 0.2 0.4 0.6 0.8 1
1 − specificity
se
nsitiv
ity (
= r
eca
ll)
Similar to precision-recall graph
But we are only interested in the small area in the lower left corner.
Precision-recall graph “blows up” this area.
Hahsler (SMU) CSE 7/5337 Spring 2012 26 / 52

Variance of measures like precision/recall
For a test collection, it is usual that a system does badly on someinformation needs (e.g., P = 0.2 at R = 0.1) and really well on others(e.g., P = 0.95 at R = 0.1).
Indeed, it is usually the case that the variance of the same systemacross queries is much greater than the variance of different systemson the same query.
That is, there are easy information needs and hard ones.
Hahsler (SMU) CSE 7/5337 Spring 2012 27 / 52

Outline
1 Unranked evaluation
2 Ranked evaluation
3 Evaluation benchmarks
4 Result summaries
Hahsler (SMU) CSE 7/5337 Spring 2012 28 / 52
What we need for a benchmark
A collection of documentsI Documents must be representative of the documents we expect to see
in reality.
A collection of information needsI . . . which we will often incorrectly refer to as queriesI Information needs must be representative of the information needs we
expect to see in reality.
Human relevance assessmentsI We need to hire/pay “judges” or assessors to do this.I Expensive, time-consumingI Judges must be representative of the users we expect to see in reality.
Hahsler (SMU) CSE 7/5337 Spring 2012 29 / 52
Standard relevance benchmark: Cranfield
Pioneering: first testbed allowing precise quantitative measures ofinformation retrieval effectiveness
Late 1950s, UK
1398 abstracts of aerodynamics journal articles, a set of 225 queries,exhaustive relevance judgments of all query-document-pairs
Too small, too untypical for serious IR evaluation today
Hahsler (SMU) CSE 7/5337 Spring 2012 30 / 52
Standard relevance benchmark: TREC
TREC = Text Retrieval Conference (TREC)
Organized by the U.S. National Institute of Standards and Technology(NIST)
TREC is actually a set of several different relevance benchmarks.
Best known: TREC Ad Hoc, used for first 8 TREC evaluationsbetween 1992 and 1999
1.89 million documents, mainly newswire articles, 450 informationneeds
No exhaustive relevance judgments – too expensive
Rather, NIST assessors’ relevance judgments are available only for thedocuments that were among the top k returned for some systemwhich was entered in the TREC evaluation for which the informationneed was developed.
Hahsler (SMU) CSE 7/5337 Spring 2012 31 / 52

Standard relevance benchmarks: Others
GOV2I Another TREC/NIST collectionI 25 million web pagesI Used to be largest collection that is easily availableI But still 3 orders of magnitude smaller than what Google/Yahoo/MSN
index
NTCIRI East Asian language and cross-language information retrieval
Cross Language Evaluation Forum (CLEF)I This evaluation series has concentrated on European languages and
cross-language information retrieval.
Many others
Hahsler (SMU) CSE 7/5337 Spring 2012 32 / 52
Validity of relevance assessments
Relevance assessments are only usable if they are consistent.
If they are not consistent, then there is no “truth” and experimentsare not repeatable.
How can we measure this consistency or agreement among judges?
→ Kappa measure
Hahsler (SMU) CSE 7/5337 Spring 2012 33 / 52
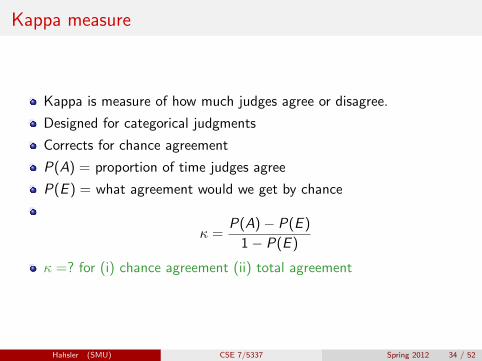
Kappa measure
Kappa is measure of how much judges agree or disagree.
Designed for categorical judgments
Corrects for chance agreement
P(A) = proportion of time judges agree
P(E ) = what agreement would we get by chance
κ =P(A)− P(E )
1− P(E )
κ =? for (i) chance agreement (ii) total agreement
Hahsler (SMU) CSE 7/5337 Spring 2012 34 / 52

Kappa measure (2)
Values of κ in the interval [2/3, 1.0] are seen as acceptable.
With smaller values: need to redesign relevance assessmentmethodology used etc.
Hahsler (SMU) CSE 7/5337 Spring 2012 35 / 52
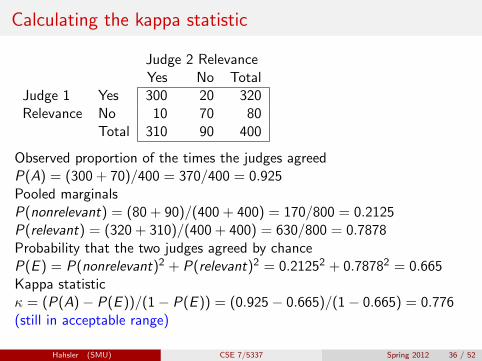
Calculating the kappa statistic
Judge 2 RelevanceYes No Total
Judge 1 Yes 300 20 320Relevance No 10 70 80
Total 310 90 400
Observed proportion of the times the judges agreedP(A) = (300 + 70)/400 = 370/400 = 0.925Pooled marginalsP(nonrelevant) = (80 + 90)/(400 + 400) = 170/800 = 0.2125P(relevant) = (320 + 310)/(400 + 400) = 630/800 = 0.7878Probability that the two judges agreed by chanceP(E ) = P(nonrelevant)2 + P(relevant)2 = 0.21252 + 0.78782 = 0.665Kappa statisticκ = (P(A)− P(E ))/(1− P(E )) = (0.925− 0.665)/(1− 0.665) = 0.776(still in acceptable range)
Hahsler (SMU) CSE 7/5337 Spring 2012 36 / 52

Interjudge agreement at TREC
information number of disagreementsneed docs judged
51 211 662 400 15767 400 6895 400 110
127 400 106
Hahsler (SMU) CSE 7/5337 Spring 2012 37 / 52

Impact of interjudge disagreement
Judges disagree a lot. Does that mean that the results of informationretrieval experiments are meaningless?
No.
Large impact on absolute performance numbers
Virtually no impact on ranking of systems
Supposes we want to know if algorithm A is better than algorithm B
An information retrieval experiment will give us a reliable answer tothis question . . .
. . . even if there is a lot of disagreement between judges.
Hahsler (SMU) CSE 7/5337 Spring 2012 38 / 52
Evaluation at large search engines
Recall is difficult to measure on the web
Search engines often use precision at top k , e.g., k = 10 . . .
. . . or use measures that reward you more for getting rank 1 right thanfor getting rank 10 right.
Search engines also use non-relevance-based measures.I Example 1: clickthrough on first resultI Not very reliable if you look at a single clickthrough (you may realize
after clicking that the summary was misleading and the document isnonrelevant) . . .
I . . . but pretty reliable in the aggregate.I Example 2: Ongoing studies of user behavior in the lab – recall last
lectureI Example 3: A/B testing
Hahsler (SMU) CSE 7/5337 Spring 2012 39 / 52

A/B testing
Purpose: Test a single innovation
Prerequisite: You have a large search engine up and running.
Have most users use old system
Divert a small proportion of traffic (e.g., 1%) to the new system thatincludes the innovation
Evaluate with an “automatic” measure like clickthrough on first result
Now we can directly see if the innovation does improve user happiness.
Probably the evaluation methodology that large search engines trustmost
Hahsler (SMU) CSE 7/5337 Spring 2012 40 / 52
Critique of pure relevance
We’ve defined relevance for an isolated query-document pair.
Alternative definition: marginal relevance
The marginal relevance of a document at position k in the result listis the additional information it contributes over and above theinformation that was contained in documents d1 . . . dk−1.
ExerciseI Why is marginal relevance a more realistic measure of user happiness?I Give an example where a non-marginal measure like precision or recall
is a misleading measure of user happiness, but marginal relevance is agood measure.
I In a practical application, what is the difficulty of using marginalmeasures instead of non-marginal measures?
Hahsler (SMU) CSE 7/5337 Spring 2012 41 / 52

Outline
1 Unranked evaluation
2 Ranked evaluation
3 Evaluation benchmarks
4 Result summaries
Hahsler (SMU) CSE 7/5337 Spring 2012 42 / 52

How do we present results to the user?
Most often: as a list – aka “10 blue links”
How should each document in the list be described?
This description is crucial.
The user often can identify good hits (= relevant hits) based on thedescription.
No need to “click” on all documents sequentially
Hahsler (SMU) CSE 7/5337 Spring 2012 43 / 52
Doc description in result list
Most commonly: doc title, url, some metadata . . .
. . . and a summary
How do we “compute” the summary?
Hahsler (SMU) CSE 7/5337 Spring 2012 44 / 52

Summaries
Two basic kinds: (i) static (ii) dynamic
A static summary of a document is always the same, regardless of thequery that was issued by the user.
Dynamic summaries are query-dependent. They attempt to explainwhy the document was retrieved for the query at hand.
Hahsler (SMU) CSE 7/5337 Spring 2012 45 / 52

Static summaries
In typical systems, the static summary is a subset of the document.
Simplest heuristic: the first 50 or so words of the document
More sophisticated: extract from each document a set of “key”sentences
I Simple NLP heuristics to score each sentenceI Summary is made up of top-scoring sentences.I Machine learning approach: see IIR 13
Most sophisticated: complex NLP to synthesize/generate a summaryI For most IR applications: not quite ready for prime time yet
Hahsler (SMU) CSE 7/5337 Spring 2012 46 / 52
Dynamic summaries
Present one or more “windows” or snippets within the document thatcontain several of the query terms.
Prefer snippets in which query terms occurred as a phrase
Prefer snippets in which query terms occurred jointly in a smallwindow
The summary that is computed this way gives the entire content ofthe window – all terms, not just the query terms.
Hahsler (SMU) CSE 7/5337 Spring 2012 47 / 52

A dynamic summary
Query: “new guinea economic development”
Snippets (in bold) that were extracted from a document: . . . In recent years, PapuaNew Guinea has faced severe economic difficulties and economic growth hasslowed, partly as a result of weak governance and civil war, and partly as a result ofexternal factors such as the Bougainville civil war which led to the closure in 1989 of thePanguna mine (at that time the most important foreign exchange earner andcontributor to Government finances), the Asian financial crisis, a decline in the prices ofgold and copper, and a fall in the production of oil. PNG’s economic developmentrecord over the past few years is evidence that governance issues underly many ofthe country’s problems. Good governance, which may be defined as the transparent andaccountable management of human, natural, economic and financial resources for thepurposes of equitable and sustainable development, flows from proper public sectormanagement, efficient fiscal and accounting mechanisms, and a willingness to makeservice delivery a priority in practice. . . .
Hahsler (SMU) CSE 7/5337 Spring 2012 48 / 52

Google examples for dynamic summaries
Hahsler (SMU) CSE 7/5337 Spring 2012 49 / 52
Generating dynamic summaries
Where do we get these other terms in the snippet from?
We cannot construct a dynamic summary from the positional invertedindex – at least not efficiently.
We need to cache documents.
The positional index tells us: query term occurs at position 4378 inthe document.
Byte offset or word offset?
Note that the cached copy can be outdated
Don’t cache very long documents – just cache a short prefix
Hahsler (SMU) CSE 7/5337 Spring 2012 50 / 52

Dynamic summaries
Real estate on the search result page is limited → snippets must beshort . . .
. . . but snippets must be long enough to be meaningful.
Snippets should communicate whether and how the documentanswers the query.
Ideally: linguistically well-formed snippets
Ideally: the snippet should answer the query, so we don’t have to lookat the document.
Dynamic summaries are a big part of user happiness because . . .I . . . we can quickly scan them to find the relevant document we then
click on.I . . . in many cases, we don’t have to click at all and save time.
Hahsler (SMU) CSE 7/5337 Spring 2012 51 / 52

Resources
Chapter 8 of IIR
Resources at http://ifnlp.org/irI The TREC home page – TREC had a huge impact on information
retrieval evaluation.I Originator of F -measure: Keith van RijsbergenI More on A/B testingI Too much A/B testing at Google?I Tombros & Sanderson 1998: one of the first papers on dynamic
summariesI Google VP of Engineering on search quality evaluation at Google
Hahsler (SMU) CSE 7/5337 Spring 2012 52 / 52