csce990 data visualization
TRANSCRIPT

CSCE990 Data Visualization
Hongfeng Yu
CSCE990 Data Visualization
By Professor HongFeng YuDepartment of Computer Science Engineering
CSCE990 Data Visualization
Hongfeng Yu
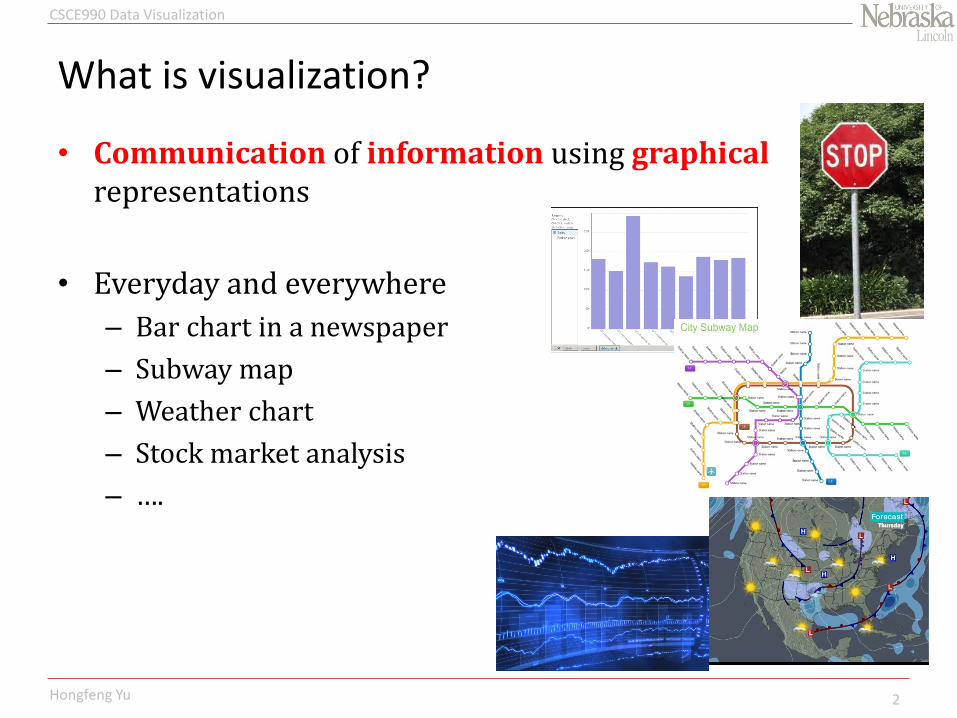
What is visualization?
• Communication of information using graphicalrepresentations
• Everyday and everywhere
– Bar chart in a newspaper
– Subway map
– Weather chart
– Stock market analysis
– ….
2
CSCE990 Data Visualization
Hongfeng Yu
Why visualization?
• Pictures have been used for communication since before the formalization of written language
• Our brain is well built for processing pictures– Speed
• Image interpretation is performed in parallel
• Text analysis is limited by sequential process of reading
• One biological study estimates the transmission speed of the optic nerve at around 9Mb/sec
– Pattern matching• Our visual system can quickly identify important patterns from
massive data– E.g. face recognition from a large number of people
3

CSCE990 Data Visualization
Hongfeng Yu
http://www.quicksprout.com/2013/08/08/this-is-your-brain-on-visualization/?display=wide
4
CSCE990 Data Visualization
Hongfeng Yu
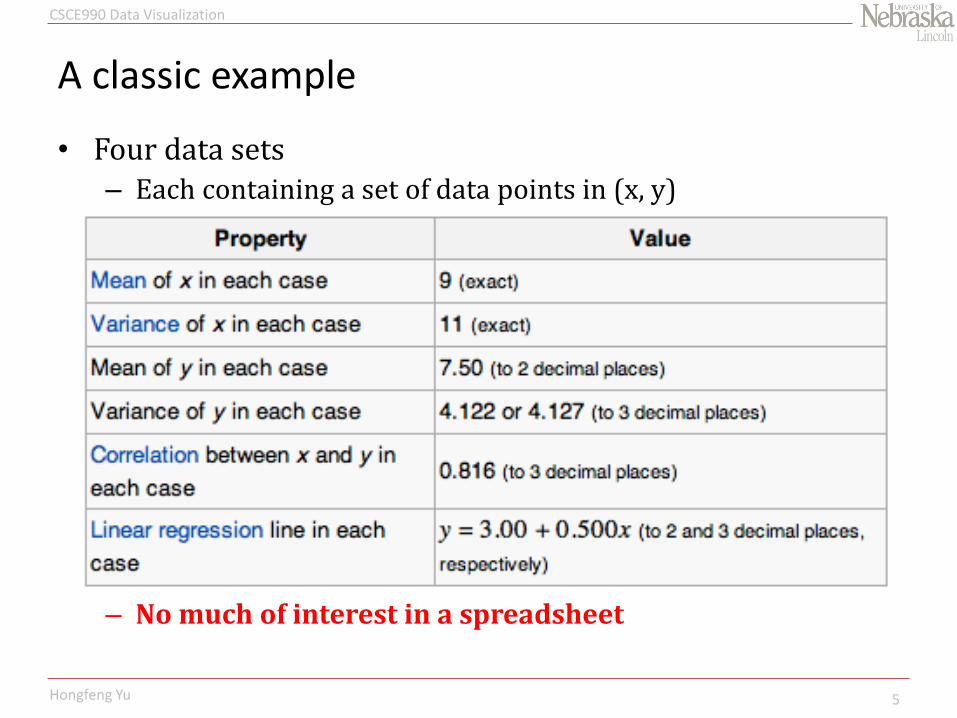
A classic example
• Four data sets– Each containing a set of data points in (x, y)
– No much of interest in a spreadsheet
5

CSCE990 Data Visualization
Hongfeng Yu
Magic!
6

CSCE990 Data Visualization
Hongfeng Yu
Why is visualization challenging?
7

CSCE990 Data Visualization
Hongfeng Yu
Why is visualization challenging?
The same data plotted with different scales is perceived dramatically differently.
8
CSCE990 Data Visualization
Hongfeng Yu
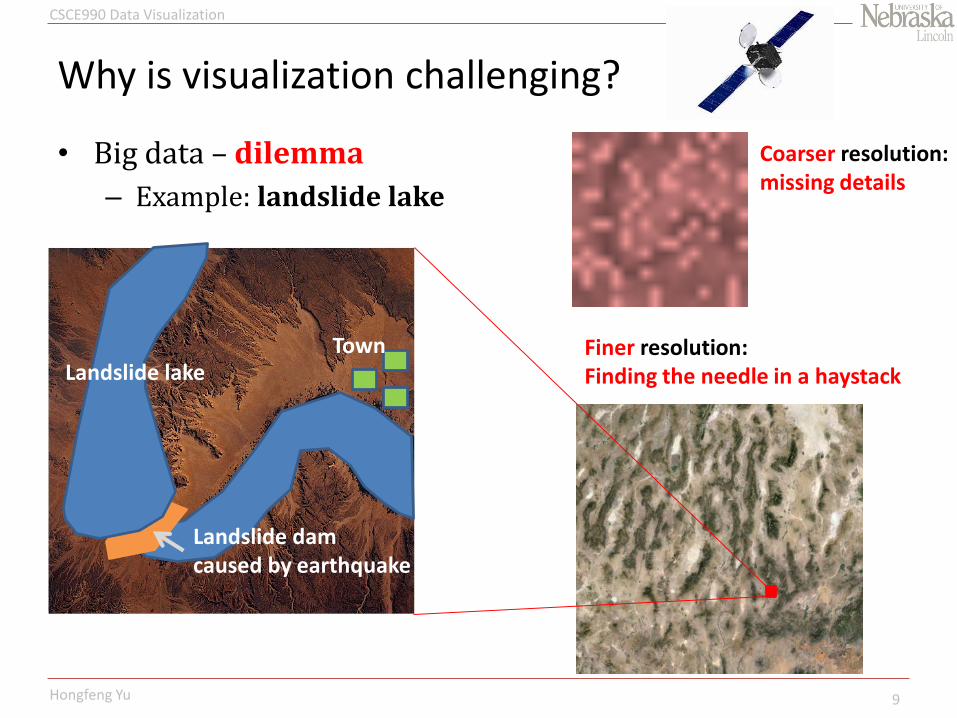
Why is visualization challenging?
• Big data – dilemma
– Example: landslide lake
Landslide damcaused by earthquake
Landslide lakeTown
Coarser resolution: missing details
Finer resolution:Finding the needle in a haystack
9
CSCE990 Data Visualization
Hongfeng Yu
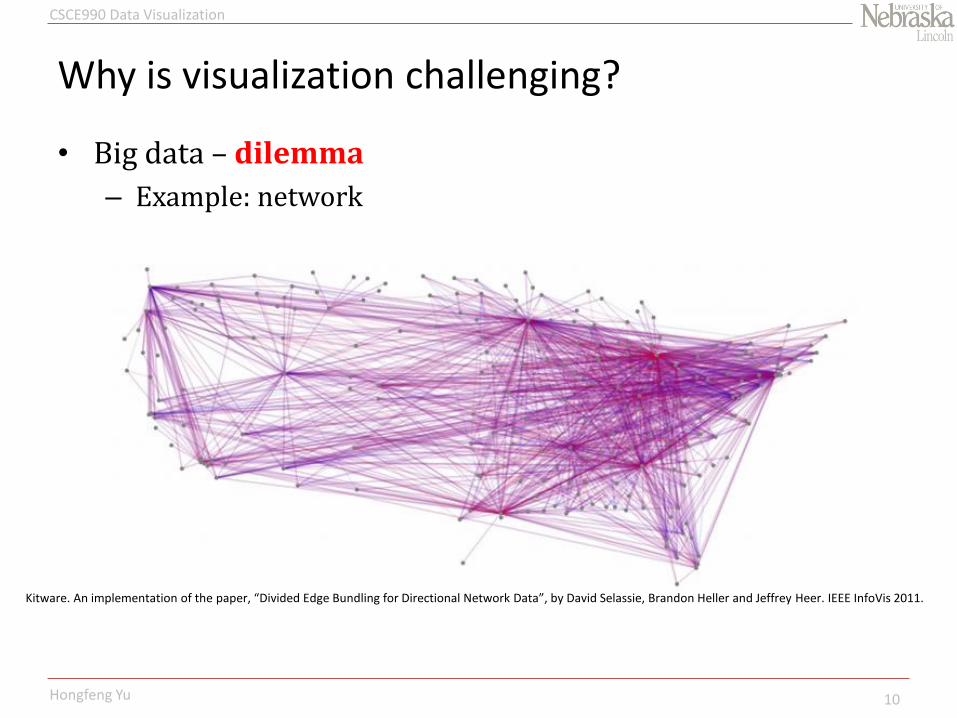
Why is visualization challenging?
• Big data – dilemma
– Example: network
10
Kitware. An implementation of the paper, “Divided Edge Bundling for Directional Network Data”, by David Selassie, Brandon Heller and Jeffrey Heer. IEEE InfoVis 2011.

CSCE990 Data Visualization
Hongfeng Yu
Why is visualization challenging?
• Big data – dilemma
– Example: network
11
Kitware. An implementation of the paper, “Divided Edge Bundling for Directional Network Data”, by David Selassie, Brandon Heller and Jeffrey Heer. IEEE InfoVis 2011.
CSCE990 Data Visualization
Hongfeng Yu
More important benefits
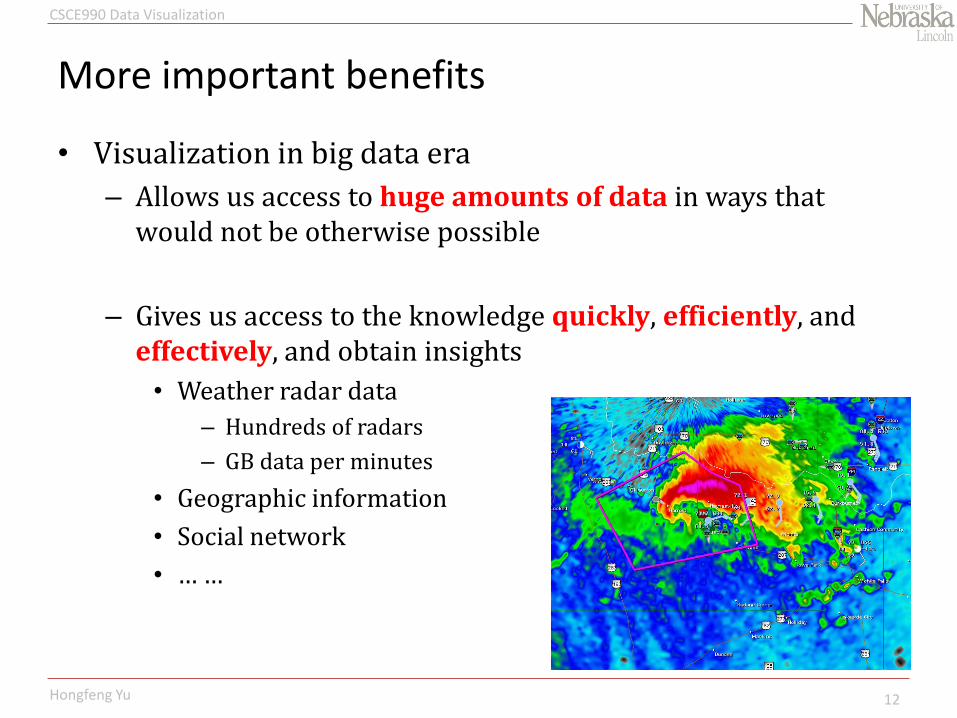
• Visualization in big data era
– Allows us access to huge amounts of data in ways that would not be otherwise possible
– Gives us access to the knowledge quickly, efficiently, and effectively, and obtain insights
• Weather radar data
– Hundreds of radars
– GB data per minutes
• Geographic information
• Social network
• … …
12

CSCE990 Data Visualization
Hongfeng Yu
Early Visualization
• Perhaps the first technique for graphically recording and presenting information
13
Cave paintings by early man approximately 30,000 years ago

CSCE990 Data Visualization
Hongfeng Yu
Early Visualization
• Early graphical writing
14
Tartaria Tablets, 5500BC Kish Tablet, 3500 BC

CSCE990 Data Visualization
Hongfeng Yu
Early Visualization
• Some necessary need for survival
15
Peutinger map: the road network in the Roman Empire. Created in 15th century based on a 4th-century map

CSCE990 Data Visualization
Hongfeng Yu
Early Visualization
The Lord of the Rings, 20th century
16

CSCE990 Data Visualization
Hongfeng Yu
Early Visualization
A section of John Snow’s map of the deaths from cholera in London in 1663.
Each bar within the houses represents one deceased individual.
17

CSCE990 Data Visualization
Hongfeng Yu
Early Visualization
Overview map of the deaths from cholera in London in 1663.
Note the concentration around the Broad Street Water Pump. Note as well the outliers.
18
CSCE990 Data Visualization
Hongfeng Yu
Early Visualization
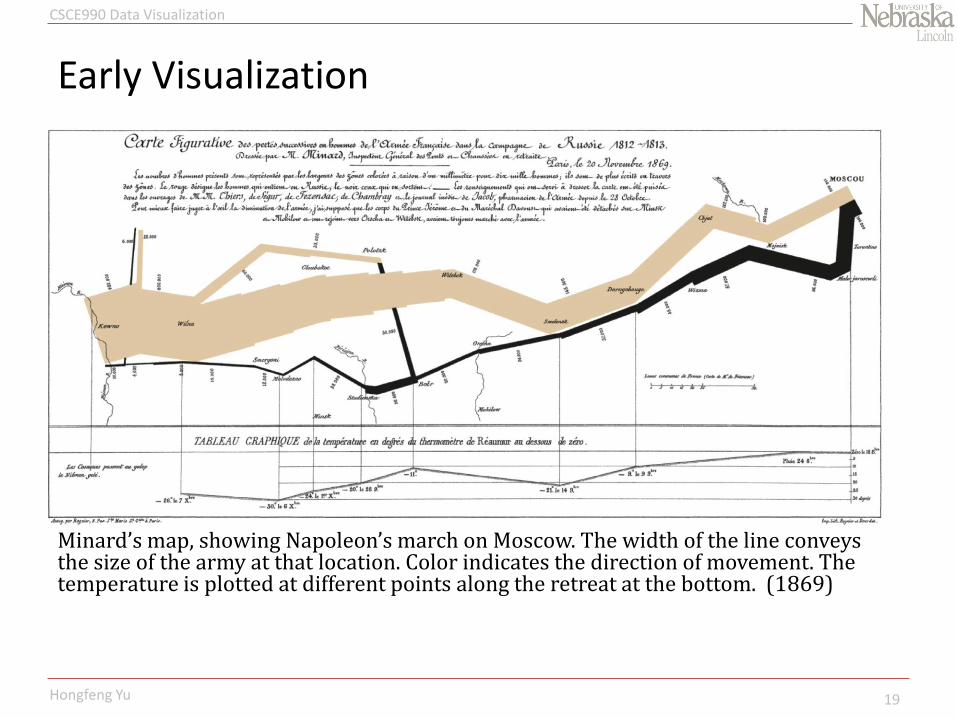
Minard’s map, showing Napoleon’s march on Moscow. The width of the line conveys the size of the army at that location. Color indicates the direction of movement. The temperature is plotted at different points along the retreat at the bottom. (1869)
19

CSCE990 Data Visualization
Hongfeng Yu
Early Visualization
Joseph Priestley’s display of the longevity of famous people (1765).
20

CSCE990 Data Visualization
Hongfeng Yu
Early Visualization
Florence Nightingale’s coxcomb chart showing monthly deaths from battle and other causes (1858).
Blue represents the deaths from disease, red represents deaths from wounds, and black represents all other deaths.
21

CSCE990 Data Visualization
Hongfeng Yu
Early Visualization
Leonardo Da Vinci’s study of the motion of the human arm (1510).
22
CSCE990 Data Visualization
Hongfeng Yu
Early Visualization
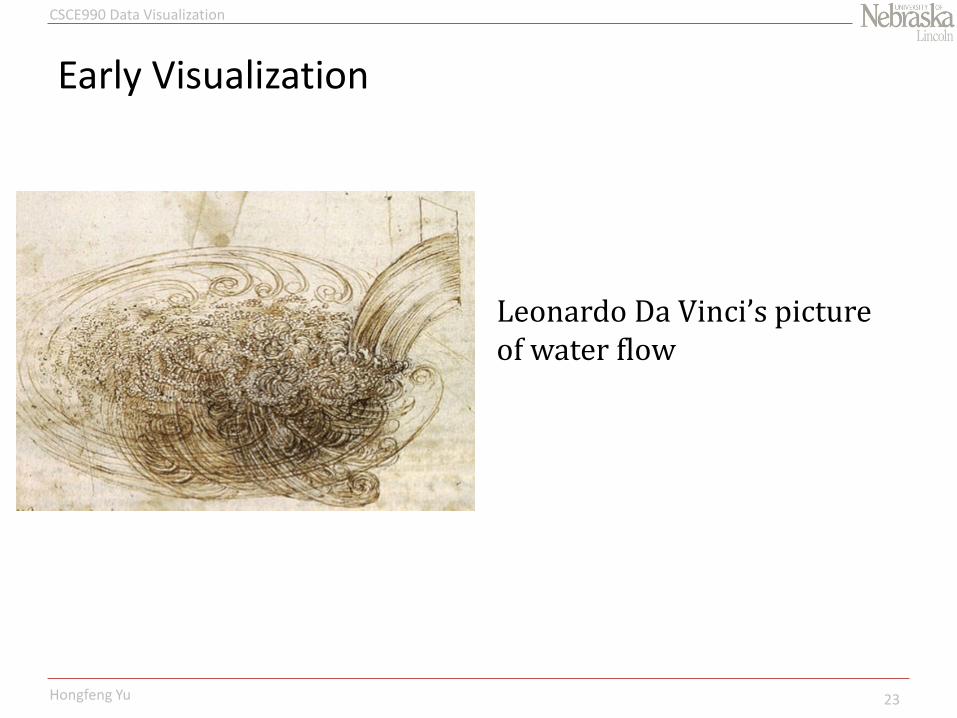
Leonardo Da Vinci’s picture of water flow
23
CSCE990 Data Visualization
Hongfeng Yu
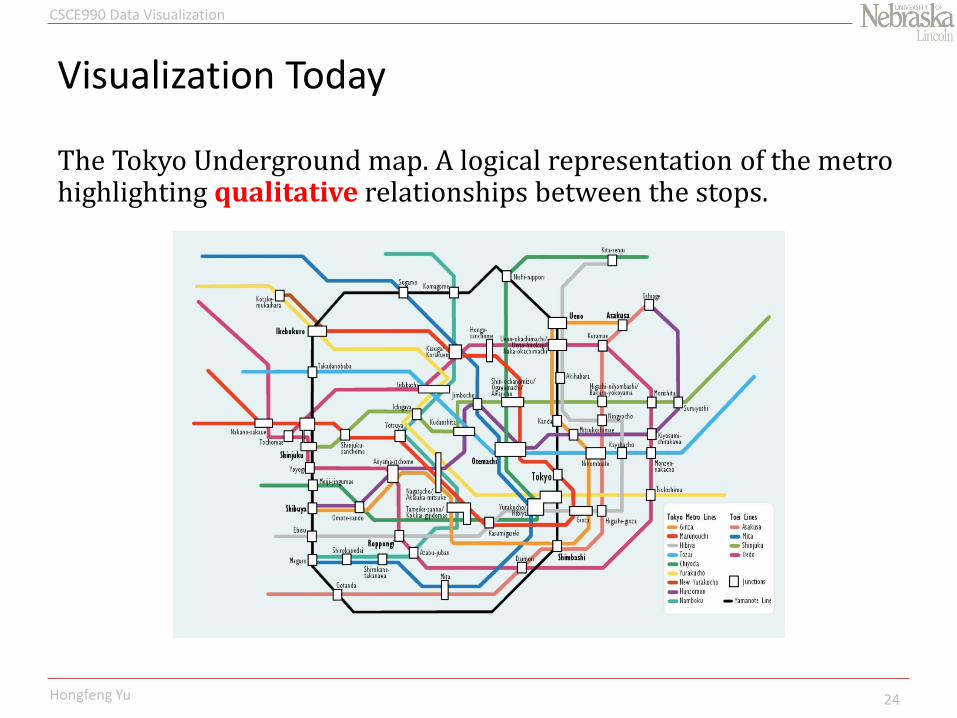
Visualization Today
The Tokyo Underground map. A logical representation of the metro highlighting qualitative relationships between the stops.
24

CSCE990 Data Visualization
Hongfeng Yu
Visualization Today
The google.com map directions from 198 Riverside St., Lowell, MA (UMass Lowell, North Campus) to 883 Broadway St., Lowell, MA (UMass Lowell, South Campus). Google.com maps provide graphical cues drawn on top of road maps to indicate driving directions from point A to point B.
25

CSCE990 Data Visualization
Hongfeng Yu
Visualization Today
Yeast mechanism of action data with regression line.
26

CSCE990 Data Visualization
Hongfeng Yu
Visualization Today
27

CSCE990 Data Visualization
Hongfeng Yu
Visualization Today
A pathway represented by a network with nodes representing genes and color the level of expression.
28
CSCE990 Data Visualization
Hongfeng Yu
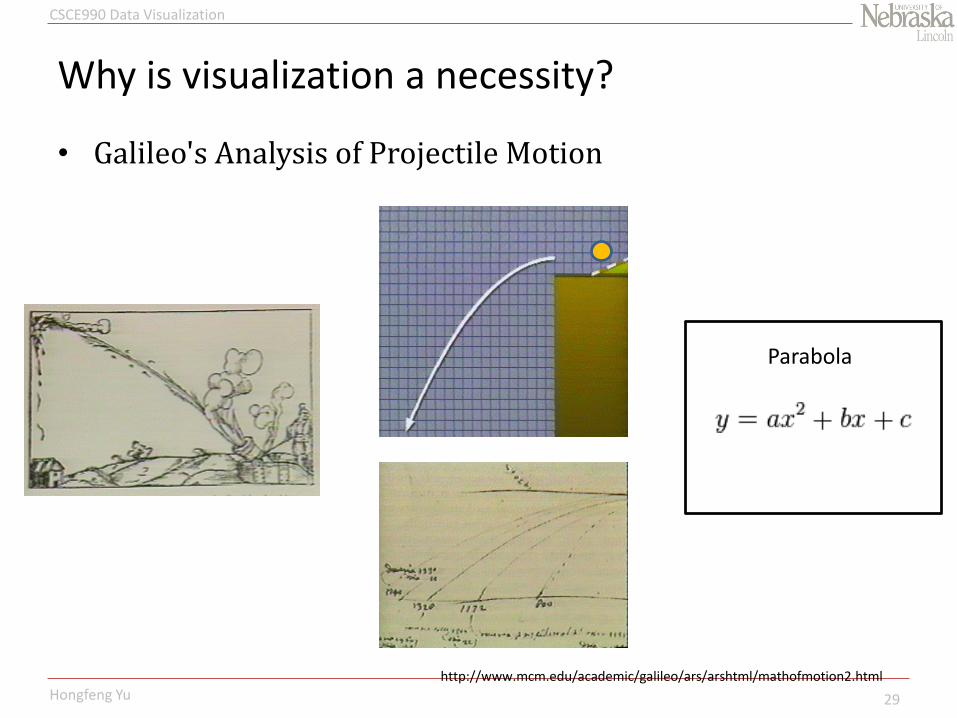
Why is visualization a necessity?
• Galileo's Analysis of Projectile Motion
29
http://www.mcm.edu/academic/galileo/ars/arshtml/mathofmotion2.html
Parabola

CSCE990 Data Visualization
Hongfeng Yu
Why is visualization a necessity?
• Many many examples
– Kepler's laws
– Newton’s laws
– DNA structure
– … …
– Numerous scientific publications
30
Produced by Biruni circa 1030. Shows the phases of the moon in orbit.
Planetary motion.
The x-ray diffraction image
CSCE990 Data Visualization
Hongfeng Yu
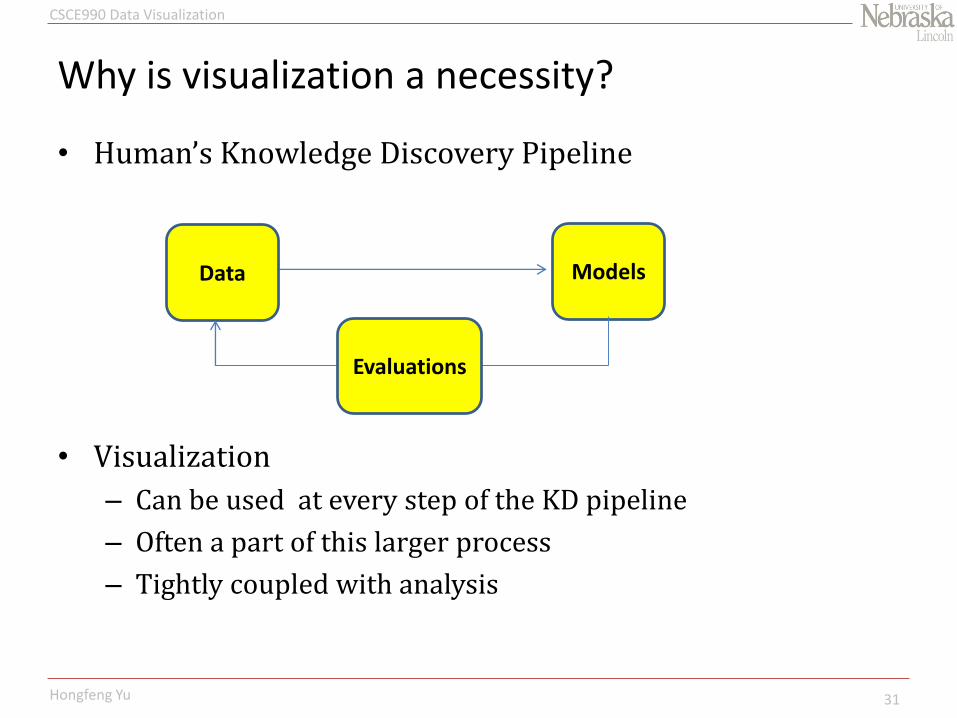
Why is visualization a necessity?
• Human’s Knowledge Discovery Pipeline
31
• Visualization
– Can be used at every step of the KD pipeline
– Often a part of this larger process
– Tightly coupled with analysis
ModelsData
Evaluations

CSCE990 Data Visualization
Hongfeng Yu
Visualization vs. Computer Graphics
• Computer Graphics– Graphical objects and organization of graphic primitives
• Visualization– More than simply computer graphics
– Based on the underlying data (spatial positions, populations, or physical measures)
– Include aspects from numerous other disciplines• Human-computer interaction
• Psychology for human perception
• Databases
• Statistics
• Data mining
• …
32

CSCE990 Data Visualization
Hongfeng Yu
Visualization vs. Computer Graphics
• Computer Graphics
– Creation of images and animations for visual realism
– Video games, cartoons, advertisements, and movie special effects
• Visualization
– Not emphasize visual realism, but effective communication of information
– Many applications do not deal with physical objects
33
CSCE990 Data Visualization
Hongfeng Yu
Visualization vs. Computer Graphics
• Computer Graphics provides tools for visualization
– Graphics-programming language
• OpenGL, DirectX, Processing, Java3D
– Underlying graphics Hardware
• Intel, Nvidia or AMD graphics cards
– Rendering process
• Different shading
– Output format
• JPEG, TIFF, AVI, MPEG
34

CSCE990 Data Visualization
Hongfeng Yu
Visualization vs. Computer Graphics
WEAVE—A system for visually linking 3D and
statistical visualizations (2000)
35

CSCE990 Data Visualization
Hongfeng Yu
Visualization vs. Computer Graphics
• Paper keywords from Computer Graphics Forum
36
This image itself is a visualization.