cs573 data privacy and security anonymization methods li xiong
TRANSCRIPT

CS573 Data Privacy and Security
Anonymization methods
Li Xiong

Today
• Permutation based anonymization methods (cont.)
• Other privacy principles for microdata publishing
• Statistical databases

Anonymization methods
• Non-perturbative: don't distort the data– Generalization– Suppression
• Perturbative: distort the data– Microaggregation/clustering– Additive noise
• Anatomization and permutation– De-associate relationship between QID and
sensitive attribute

Concept of the Anatomy Algorithm
• Release 2 tables, quasi-identifier table (QIT) and sensitive table (ST)
• Use the same QI groups (satisfy l-diversity), replace the sensitive attribute values with a Group-ID column
• Then produce a sensitive table with Disease statistics
tuple ID Age Sex Zipcode Group-ID1 23 M 11000 12 27 M 13000 13 35 M 59000 14 59 M 12000 15 61 F 54000 26 65 F 25000 27 65 F 25000 28 70 F 30000 2
QIT
Group-ID Disease Count1 headache 21 pneumonia 22 bronchitis 12 flu 22 stomach ache 1
ST

Specifications of Anatomy cont.
DEFINITION 3. (Anatomy)
With a given l-diverse partition anatomy will create QIT and ST tables
QIT will be constructed as the following:
(Aqi1, Aqi
2, ..., Aqid, Group-ID)
ST will be constructed as the following:
(Group-ID, As, Count)

Privacy properties
THEOREM 1. Given a pair of QIT and ST inference of the sensitive value of any individual is at mos 1/l
Age Sex Zipcode Group-ID Disease Count23 M 11000 1 dyspepsia 223 M 11000 1 pneumonia 227 M 13000 1 dyspepsia 227 M 13000 1 pneumonia 235 M 59000 1 dyspepsia 235 M 59000 1 pneumonia 259 M 12000 1 dyspepsia 259 M 12000 1 pneumonia 261 F 54000 2 bronchitis 161 F 54000 2 flu 261 F 54000 2 stomachache 165 F 25000 2 bronchitis 165 F 25000 2 flu 265 F 25000 2 stomachache 165 F 25000 2 bronchitis 165 F 25000 2 flu 265 F 25000 2 stomachache 170 F 30000 2 bronchitis 170 F 30000 2 flu 270 F 30000 2 stomachache 1

Comparison with generalization
• Compare with generalization on two assumptions:
A1: the adversary has the QI-values of the target individual A2: the adversary also knows that the individual is definitely in the microdata
If A1 and A2 are true, anatomy is as good as generalization 1/l holds true
If A1 is true and A2 is false, generalization is stronger
If A1 and A2 are false, generalization is still stronger
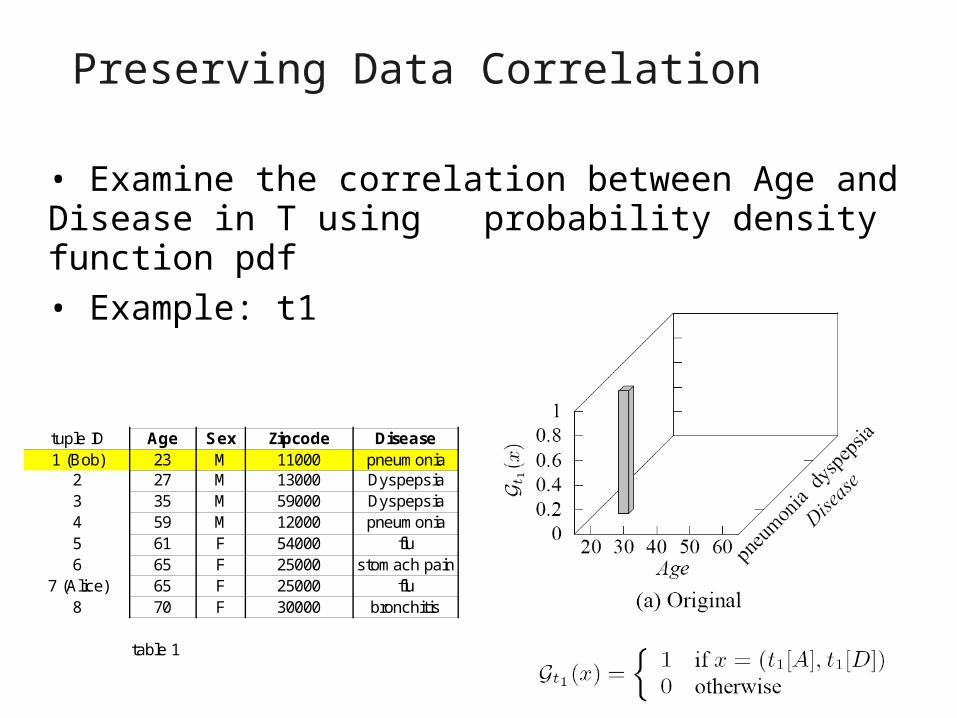
Preserving Data Correlation
• Examine the correlation between Age and Disease in T using probability density function pdf
• Example: t1
tuple ID Age Sex Zipcode Disease1 (Bob) 23 M 11000 pneumonia
2 27 M 13000 Dyspepsia3 35 M 59000 Dyspepsia4 59 M 12000 pneumonia5 61 F 54000 flu6 65 F 25000 stomach pain
7 (Alice) 65 F 25000 flu8 70 F 30000 bronchitis
table 1

Preserving Data Correlation cont.
• To re-construct an approximate pdf of t1 from the generalization table:
tuple ID Age Sex Zipcode Disease1 [21,60] M [10001, 60000] pneumonia2 [21,60] M [10001, 60000] Dyspepsia3 [21,60] M [10001, 60000] Dyspepsia4 [21,60] M [10001, 60000] pneumonia5 [61,70] F [10001, 60000] flu6 [61,70] F [10001, 60000] stomach pain7 [61,70] F [10001, 60000] flu8 [61,70] F [10001, 60000] bronchitis
table 2

Preserving Data Correlation cont.
• To re-construct an approximate pdf of t1 from the QIT and ST tables:
tuple ID Age Sex Zipcode Group-ID1 23 M 11000 12 27 M 13000 13 35 M 59000 14 59 M 12000 15 61 F 54000 26 65 F 25000 27 65 F 25000 28 70 F 30000 2
QIT
Group-ID Disease Count1 headache 21 pneumonia 22 bronchitis 12 flu 22 stomach ache 1
ST

Preserving Data Correlation cont.
• To figure out a more rigorous comparison, calculate the “L2 distance” with the following equation:
The distance for anatomy is 0.5 while the distance for generalization is 22.5

Preserving Data Correlation cont.
Idea: Measure the error for each tuple by using the following formula:
Objective: for all tuples t in T and obtain a minimal re-construction error (RCE):
Algorithm: Nearly-Optimal Anatomizing Algorithm

Experiments
• dataset CENSUS that contained the personal information of 500k American adults containing 9 discrete attributes
• Created two sets of microdata tables
Set 1: 5 tables denoted as OCC-3, ..., OCC-7 so that OCC-d (3 ≤ d ≤ 7) uses the first d as QI-attributes and Occupation
as the sensitive attribute As
Set 2: 5 tables denoted as SAL-3, ..., SAL-7 so that SAL-d (3 ≤ d ≤ 7) uses the first d as QI-attributes and Salary-class
as the sensitive attribute As g

Experiments cont.

Today
• Permutation based anonymization methods (cont.)
• Other privacy principles for microdata publishing
• Statistical databases• Differential privacy

Zipcode
Age Disease
476** 2* Heart Disease
476** 2* Heart Disease
476** 2* Heart Disease
4790* ≥40 Flu
4790* ≥40 Heart Disease
4790* ≥40 Cancer
476** 3* Heart Disease
476** 3* Cancer
476** 3* Cancer
A 3-anonymous patient table
Bob
Zipcode Age
47678 27
Carl
Zipcode Age
47673 36
Homogeneity attack
Background knowledge attack
Attacks on k-Anonymity
• k-Anonymity does not provide privacy if– Sensitive values in an equivalence class lack diversity– The attacker has background knowledge
slide 16

Caucas 787XX Flu
Caucas 787XX Shingles
Caucas 787XX Acne
Caucas 787XX Flu
Caucas 787XX Acne
Caucas 787XX FluAsian/AfrAm 78XXX FluAsian/AfrAm 78XXX FluAsian/AfrAm 78XXX AcneAsian/AfrAm 78XXX ShinglesAsian/AfrAm 78XXX AcneAsian/AfrAm 78XXX Flu
Sensitive attributes must be“diverse” within eachquasi-identifier equivalence class
[Machanavajjhala et al. ICDE ‘06]
l-Diversity
slide 17

Distinct l-Diversity
• Each equivalence class has at least l well-represented sensitive values
• Doesn’t prevent probabilistic inference attacks
slide 18
Disease
...
HIV
HIV
HIV
pneumonia
...
...
bronchitis
...
10 records8 records have HIV
2 records have other values
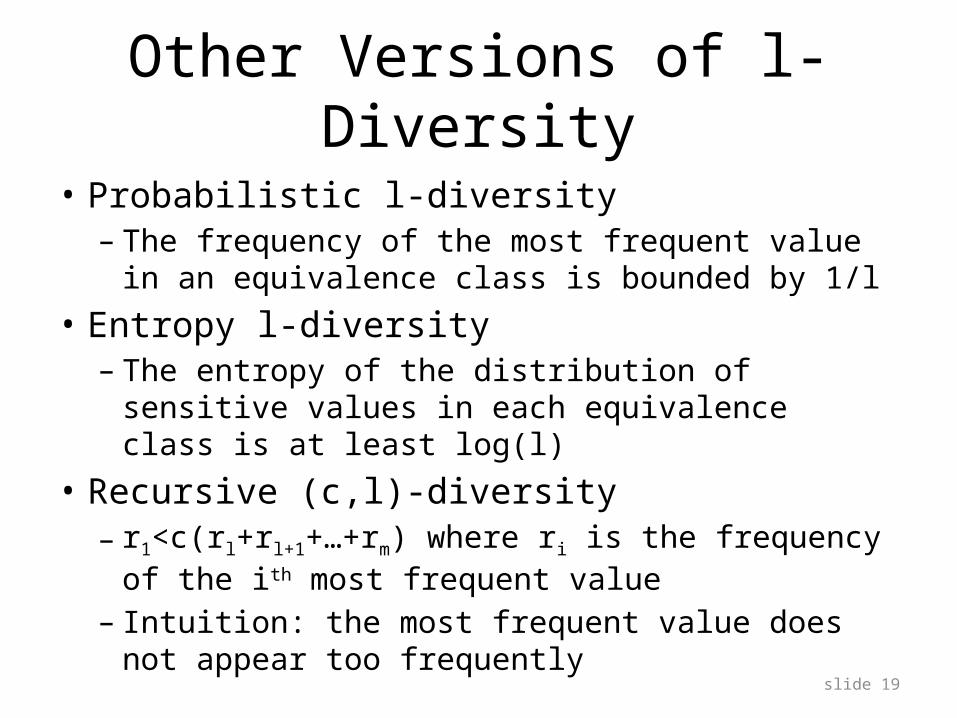
Other Versions of l-Diversity
• Probabilistic l-diversity– The frequency of the most frequent value in an
equivalence class is bounded by 1/l• Entropy l-diversity
– The entropy of the distribution of sensitive values in each equivalence class is at least log(l)
• Recursive (c,l)-diversity– r1<c(rl+rl+1+…+rm) where ri is the frequency of the ith
most frequent value– Intuition: the most frequent value does not appear
too frequently slide 19

… Cancer
… Cancer
… Cancer
… Flu
… Cancer
… Cancer
… Cancer
… Cancer
… Cancer
… Cancer
… Flu
… Flu
Original dataset
99% have cancer
Neither Necessary, Nor Sufficient

… Cancer
… Cancer
… Cancer
… Flu
… Cancer
… Cancer
… Cancer
… Cancer
… Cancer
… Cancer
… Flu
… Flu
Original dataset
Q1 Flu
Q1 Flu
Q1 Cancer
Q1 Flu
Q1 Cancer
Q1 Cancer
Q2 Cancer
Q2 Cancer
Q2 Cancer
Q2 Cancer
Q2 Cancer
Q2 Cancer
Anonymization A
99% have cancer
50% cancer quasi-identifier group is “diverse”50% cancer quasi-identifier group is “diverse”
Neither Necessary, Nor Sufficient
slide 21

… Cancer
… Cancer
… Cancer
… Flu
… Cancer
… Cancer
… Cancer
… Cancer
… Cancer
… Cancer
… Flu
… Flu
Original dataset
Q1 Flu
Q1 Cancer
Q1 Cancer
Q1 Cancer
Q1 Cancer
Q1 Cancer
Q2 Cancer
Q2 Cancer
Q2 Cancer
Q2 Cancer
Q2 Flu
Q2 Flu
Anonymization B
Q1 Flu
Q1 Flu
Q1 Cancer
Q1 Flu
Q1 Cancer
Q1 Cancer
Q2 Cancer
Q2 Cancer
Q2 Cancer
Q2 Cancer
Q2 Cancer
Q2 Cancer
Anonymization A
99% have cancer
50% cancer quasi-identifier group is “diverse”This leaks a ton of information
50% cancer quasi-identifier group is “diverse”This leaks a ton of information
99% cancer quasi-identifier group is not “diverse”99% cancer quasi-identifier group is not “diverse”
Neither Necessary, Nor Sufficient
slide 22

Limitations of l-Diversity
• Example: sensitive attribute is HIV+ (1%) or HIV- (99%)– Very different degrees of sensitivity!
• l-diversity is unnecessary– 2-diversity is unnecessary for an equivalence class
that contains only HIV- records• l-diversity is difficult to achieve
– Suppose there are 10000 records in total– To have distinct 2-diversity, there can be at most
10000*1%=100 equivalence classesslide 23

Skewness Attack
• Example: sensitive attribute is HIV+ (1%) or HIV- (99%)
• Consider an equivalence class that contains an equal number of HIV+ and HIV- records– Diverse, but potentially violates privacy!
• l-diversity does not differentiate:– Equivalence class 1: 49 HIV+ and 1 HIV-– Equivalence class 2: 1 HIV+ and 49 HIV-
slide 24
l-diversity does not consider overall distribution of sensitive values!

BobZip Age
47678 27
Zipcode
Age Salary Disease
476** 2* 20K Gastric Ulcer
476** 2* 30K Gastritis
476** 2* 40K Stomach Cancer
4790* ≥40 50K Gastritis
4790* ≥40 100K Flu
4790* ≥40 70K Bronchitis
476** 3* 60K Bronchitis
476** 3* 80K Pneumonia
476** 3* 90K Stomach Cancer
A 3-diverse patient table
Conclusion1. Bob’s salary is in [20k,40k],
which is relatively low2. Bob has some stomach-related
disease
l-diversity does not consider semantics of sensitive values!
Similarity attack
Sensitive Attribute Disclosure
slide 25

t-Closeness: A New Privacy Measure
• Rationale
ExternalKnowledge
Overall distribution Q of sensitive values
Distribution Pi of sensitive values in each equi-class
Belief Knowledge
B0
B1
B2
Observations Q is public or can be derived Potential knowledge gain from Q and
Pi about Specific individuals Principle
The distance between Q and Pi should be bounded by a threshold t.

Caucas 787XX Flu
Caucas 787XX Shingles
Caucas 787XX Acne
Caucas 787XX Flu
Caucas 787XX Acne
Caucas 787XX FluAsian/AfrAm 78XXX FluAsian/AfrAm 78XXX FluAsian/AfrAm 78XXX AcneAsian/AfrAm 78XXX ShinglesAsian/AfrAm 78XXX AcneAsian/AfrAm 78XXX Flu
[Li et al. ICDE ‘07]
Distribution of sensitiveattributes within eachquasi-identifier group shouldbe “close” to their distributionin the entire original database
t-Closeness
slide 27

Distance Measures
• P=(p1,p2,…,pm), Q=(q1,q2,…,qm)
Trace-distance
KL-divergence
None of these measures reflect the semantic distance among values. Q: {3K,4K,5K,6K,7K,8K,9K,10K,11k}
P1:{3K,4K,5k}P2:{5K,7K,10K}
Intuitively, D[P1,Q]>D[P2,Q]

Earth Mover’s Distance• If the distributions are interpreted as two different ways
of piling up a certain amount of dirt over region D, EMD is the minimum cost of turning one pile into the other– the cost is amount of dirt moved * the distance by which it is
moved– Assume two piles have the same amount of dirt
• Extensions for comparison of distributions with different total masses.– allow for a partial match, discard leftover "dirt“, without cost– allow for mass to be created or destroyed, but with a cost
penalty

Earth Mover’s Distance• Formulation
– P=(p1,p2,…,pm), Q=(q1,q2,…,qm)
– dij: the ground distance between element i of P and element j of Q.
– Find a flow F=[fij] where fij is the flow of mass from element i of P to element j of Q that minimizes the overall work:
subject to the constraints:

How to calculate EMD(Cont’d)• EMD for categorical attributes
– Hierarchical distance– Hierarchical distance is a metric
Flu Pneumonia BronchitisPulmonary
edemaPulmonary embolism
Gastric ulcer
Stomach cancer
Colon cancer
Colitis
Respiratory infection
Vascular lung diseases
Stomach diseases
Colon diseases
Respiratory system diseases
Digestive system diseases
Respiratory&digestive system diseases
( , )( , )
i ji j
level v vhierarchical dist v v
H

Earth Mover’s Distance
• Example– {3k,4k,5k} and {3k,4k,5k,6k,7k,8k,9k,10k,11k} – Move 1/9 probability for each of the following pairs
• 3k->6k,3k->7k cost: 1/9*(3+4)/8• 4k->8k,4k->9k cost: 1/9*(4+5)/8• 5k->10k,5k->11k cost: 1/9*(5+6)/8
– Total cost: 1/9*27/8=0.375– With P2={6k,8k,11k} , we can get the total cost is
1/9 * 12/8 = 0.167 < 0.375. This make more sense than the other two distance calculation method.
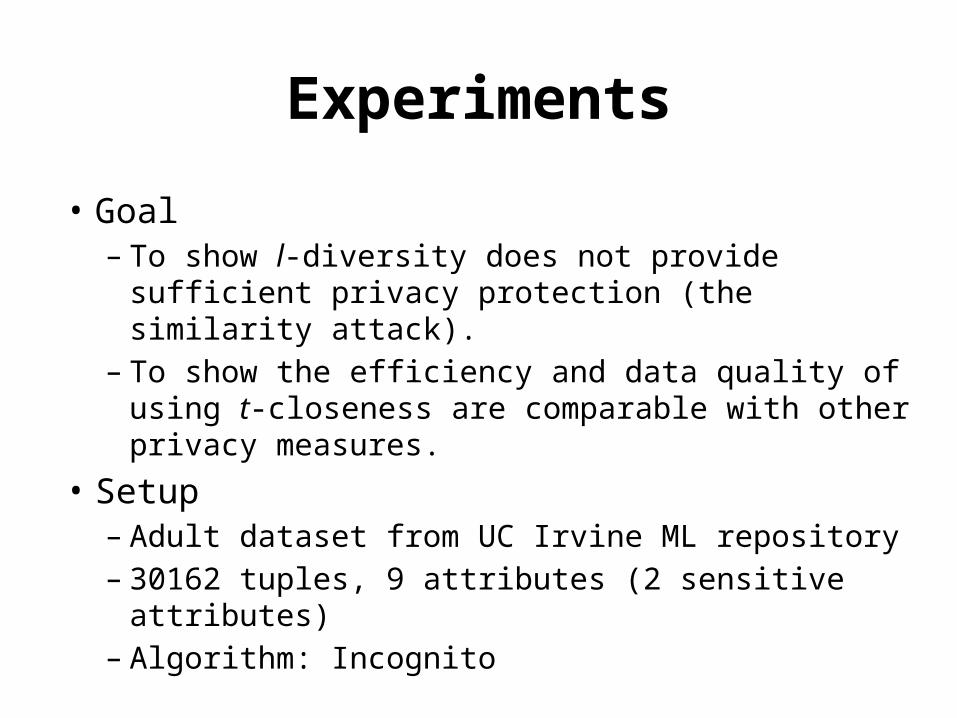
Experiments
• Goal– To show l-diversity does not provide sufficient
privacy protection (the similarity attack).– To show the efficiency and data quality of using t-
closeness are comparable with other privacy measures.
• Setup– Adult dataset from UC Irvine ML repository– 30162 tuples, 9 attributes (2 sensitive attributes)– Algorithm: Incognito

Experiments
• Comparisons of privacy measurements– k-Anonymity– Entropy l-diversity– Recursive (c,l)-diversity– k-Anonymity with t-closeness

Experiments
• Efficiency– The efficiency of using t-closeness is comparable
with other privacy measurements

Experiments• Data utility
– Discernibility metric; Minimum average group size– The data quality of using t-closeness is comparable with
other privacy measurements
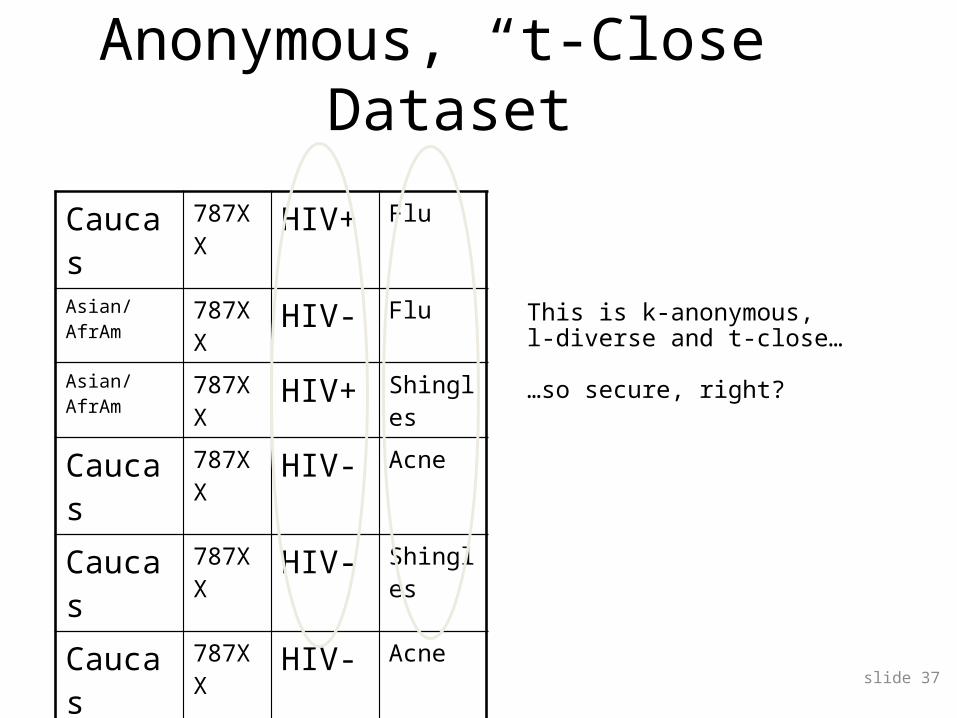
Caucas
787XX
HIV+ Flu
Asian/AfrAm
787XX
HIV- Flu
Asian/AfrAm
787XX
HIV+ Shingles
Caucas
787XX
HIV- Acne
Caucas
787XX
HIV- Shingles
Caucas
787XX
HIV- Acne
This is k-anonymous,l-diverse and t-close…
…so secure, right?
Anonymous, “t-Close” Dataset
slide 37

Caucas
787XX
HIV+ Flu
Asian/AfrAm
787XX
HIV- Flu
Asian/AfrAm
787XX
HIV+ Shingles
Caucas
787XX
HIV- Acne
Caucas
787XX
HIV- Shingles
Caucas
787XX
HIV- Acne
Bob is Caucasian andI heard he was admitted to hospital with flu…
slide 38
What Does Attacker Know?

Caucas
787XX
HIV+ Flu
Asian/AfrAm
787XX
HIV- Flu
Asian/AfrAm
787XX
HIV+ Shingles
Caucas
787XX
HIV- Acne
Caucas
787XX
HIV- Shingles
Caucas
787XX
HIV- Acne
Bob is Caucasian andI heard he was admitted to hospital …And I know three other Caucasions admitted to hospital with Acne or Shingles …
slide 39
What Does Attacker Know?

k-Anonymity and Partition-based notions
• Syntactic– Focuses on data transformation, not on what can
be learned from the anonymized dataset– “k-anonymous” dataset can leak sensitive
information• “Quasi-identifier” fallacy
– Assumes a priori that attacker will not know certain information about his target
slide 40

Today
• Permutation based anonymization methods (cont.)
• Other privacy principles for microdata publishing
• Statistical databases– Definitions and early methods– Output perturbation and differential privacy

• Originated from the study on statistical database
• A statistical database is a database which provides statistics on subsets of records
• OLAP vs. OLTP• Statistics may be performed to compute SUM,
MEAN, MEDIAN, COUNT, MAX AND MIN of records
Statistical Data Release

Types of Statistical Databases
Static – a static database is made once and never changes
Example: U.S. Census
Dynamic – changes continuously to reflect real-time data
Example: most online research databases

Types of Statistical Databases
Centralized – one database
Decentralized – multiple decentralized databases
General purpose – like census
Special purpose – like bank, hospital, academia, etc

• Exact compromise – a user is able to determine the exact value of a sensitive attribute of an individual
• Partial compromise – a user is able to obtain an estimator for a sensitive attribute with a bounded variance
• Positive compromise – determine an attribute has a particular value
• Negative compromise – determine an attribute does not have a particular value
• Relative compromise – determine the ranking of some confidential values
Data Compromise

Statistical Quality of Information
• Bias – difference between the unperturbed statistic and the expected value of its perturbed estimate
• Precision – variance of the estimators obtained by users
• Consistency – lack of contradictions and paradoxes– Contradictions: different responses to same query;
average differs from sum/count– Paradox: negative count

Methods Query restriction Data perturbation/anonymization Output perturbation

Data Perturbation
Noise Added
User 2
Query
Results
OriginalDatabase
PerturbedDatabase
User 1
Que
ry
Res
ults

Noise Addedto Results
User 2
Query
Results
OriginalDatabase
User 1
Query
Results
Output Perturbation
Query
Query Results
Results

Statistical data release vs. data anonymization
• Data anonymization is one technique that can be used to build statistical database
• Other techniques such as query restriction and output purterbation can be used to build statistical database or release statistical data
• Different privacy principles can be used

Security Methods Query restriction (early methods)
Query size control Query set overlap control Query auditing
Data perturbation/anonymization Output perturbation

Query Set Size Control A query-set size control limit the number of
records that must be in the result set Allows the query results to be displayed only if
the size of the query set |C| satisfies the condition
K <= |C| <= L – Kwhere L is the size of the database and K is a parameter that satisfies 0 <= K <= L/2

Query Set Size Control
Query 1
Query 1Results
Query 2Results
Query 2
K KQuery
Results
QueryResults
OriginalDatabase

Tracker• Q1: Count ( Sex = Female ) = A• Q2: Count ( Sex = Female OR
(Age = 42 & Sex = Male & Employer = ABC) ) = B
What if B = A+1?

Tracker• Q1: Count ( Sex = Female ) = A• Q2: Count ( Sex = Female OR
(Age = 42 & Sex = Male & Employer = ABC) ) = B
If B = A+1
• Q3: Count ( Sex = Female OR (Age = 42 & Sex = Male & Employer = ABC) & Diagnosis = Schizophrenia)
Positively or negatively compromised!
Query set size control
• With query set size control the database can be easily compromised within a frame of 4-5 queries
• For query set control, if the threshold value k is large, then it will restrict too many queries
• And still does not guarantee protection from compromise

• Basic idea: successive queries must be checked against the number of common records.
• If the number of common records in any query exceeds a given threshold, the requested statistic is not released.
• A query q(C) is only allowed if:| q (C ) ^ q (D) | ≤ r, r > 0
Where r is set by the administrator
Query Set Overlap Control

Query-set-overlap control
• Ineffective for cooperation of several users• Statistics for a set and its subset cannot be
released – limiting usefulness• Need to keep user profile• High processing overhead – every new query
compared with all previous ones• No formal privacy guarantee

Auditing
• Keeping up-to-date logs of all queries made by each user and check for possible compromise when a new query is issued
• Excessive computation and storage requirements
• “Efficient” methods for special types of queries
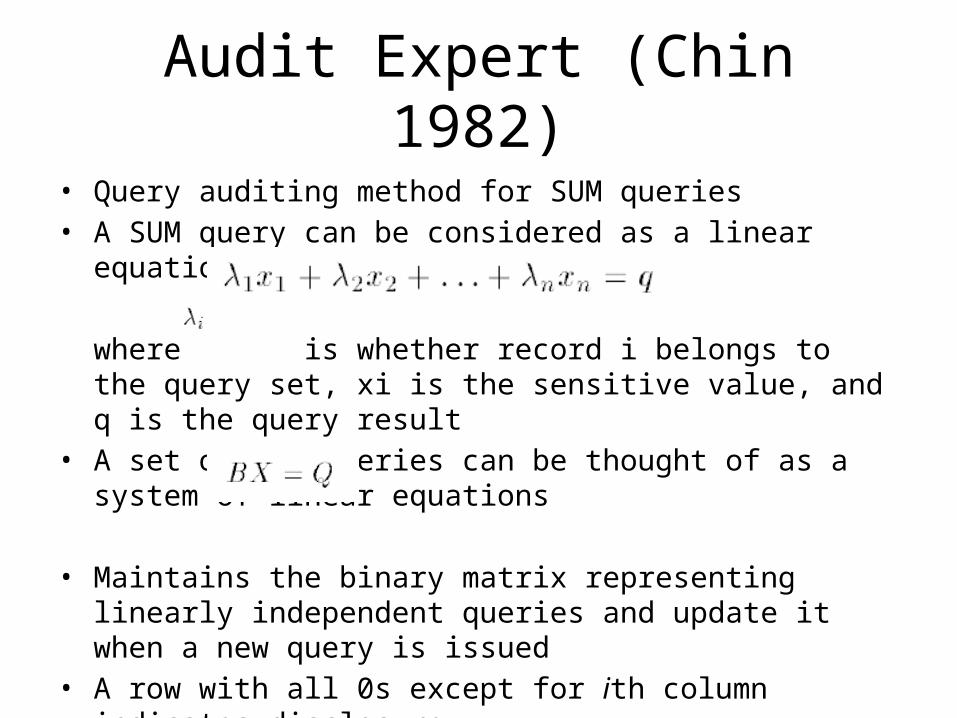
Audit Expert (Chin 1982)• Query auditing method for SUM queries• A SUM query can be considered as a linear equation
where is whether record i belongs to the query set, xi is the sensitive value, and q is the query result
• A set of SUM queries can be thought of as a system of linear equations
• Maintains the binary matrix representing linearly independent queries and update it when a new query is issued
• A row with all 0s except for ith column indicates disclosure

Audit Expert
• Only stores linearly independent queries
• Not all queries are linearly independentQ1: Sum(Sex=M)Q2: Sum(Sex=M AND Age>20)Q3: Sum(Sex=M AND Age<=20)

Audit Expert
• O(L2) time complexity• Further work reduced to O(L) time and space
when number of queries < L• Only for SUM queries• No restrictions on query set size• Maximizing non-confidential information is
NP-complete

Auditing – recent developments
• Online auditing– “Detect and deny” queries that violate privacy
requirement– Denial themselves may implicitly disclose sensitive
information• Offline auditing
– Check if a privacy requirement has been violated after the queries have been executed
– Not to prevent

Security Methods Query restriction Data perturbation/anonymization Output perturbation and differential
privacy– Sampling– Output perturbation

Sources Partial slides:
http://www.cs.jmu.edu/users/aboutams Adam, Nabil R. ; Wortmann, John C.; Security-Control
Methods for Statistical Databases: A Comparative Study; ACM Computing Surveys, Vol. 21, No. 4, December 1989
Fung et al. Privacy Preserving Data Publishing: A Survey of Recent Development, ACM Computing Surveys, in press, 2009