cs324e - elements of graphics and visualization color histograms
TRANSCRIPT

CS324e - Elements of Graphics and Visualization
Color Histograms

2
Color Histogram• Plot number of pixels with given intensity• horizontal axis: intensity (0 - 255)• Vertical axis:
– number of pixels with given intensity– or normalize to a percentage
3
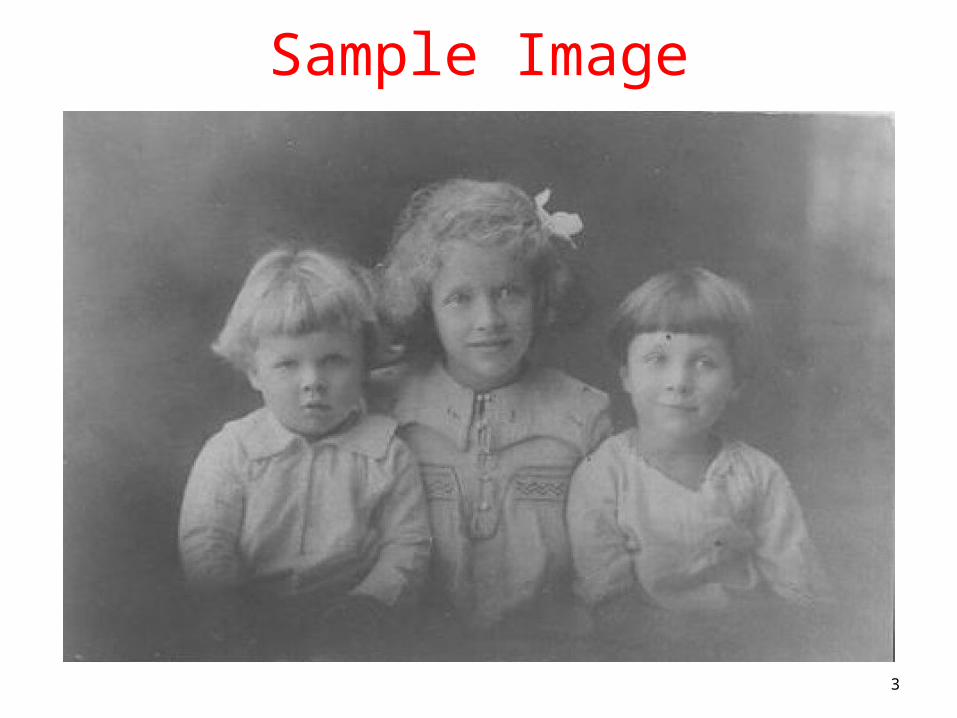
Sample Image

4
Histogram Of Grayscale

5
Histogram Equalization• Note the cluster in the middle• Not a lot of very bright or very dark pixels• Apply a Histogram Equalization filter to
the image

6
Histogram Equalization• An algorithm to try and improve the local
contrast of an image without altering overall contrast to a significant degree
• Spread out the clumps of intensities to improve the contrast

7
Histogram Equalization Example• Consider a color model with only 10
shades of gray 0 - 9• Consider a simple image with only 25
pixels

8
Histogram Equalization Example• Step 1: count the number of pixels with each intensityintensity count
0 31 6 2 43 24 25 16 17 1 What must the sum of 8 1 counts be?9 4

9
Histogram Equalization Example• Normalize the counts to fractions or percentagesintensity count fraction
0 3 3/251 6 6/252 4 4/253 2 2/254 2 2/255 1 1/256 1 1/257 1 1/258 1 1/259 4 4/25
Why divide by 25?
10
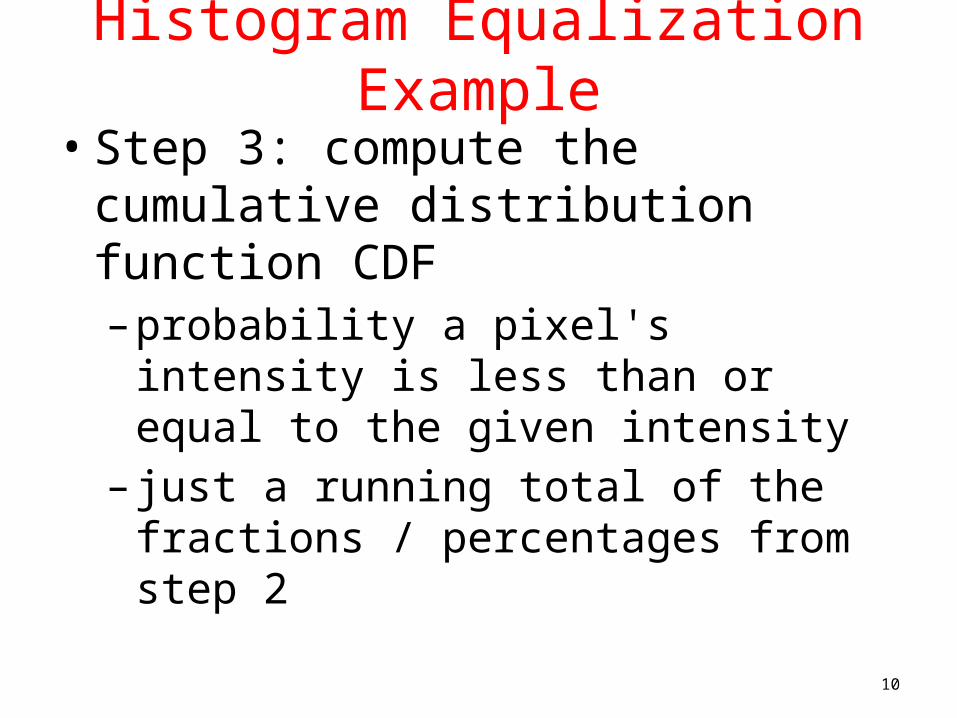
Histogram Equalization Example• Step 3: compute the cumulative
distribution function CDF – probability a pixel's intensity is less than or
equal to the given intensity– just a running total of the fractions /
percentages from step 2

11
Histogram Equalization Example• Step 3:intensity count fraction Cumulative Distribution
0 3 3/25 3/251 6 6/25 9/25 (3 + 6)2 4 4/25 13/25 (3 + 6 + 4)3 2 2/25 15/254 2 2/25 17/255 1 1/25 18/256 1 1/25 19/257 1 1/25 20/258 1 1/25 21/259 4 4/25 25/25

12
Histogram Equalization ExampleStep 4: Scale Cumulative Distribution to intensity rangeintensity count fraction CDF Scaled Intensity
0 3 3/25 3/25 0 (10 * 3 / 25 = 1 - 1 = 0)
1 6 6/25 9/25 32 4 4/25 13/2543 2 2/25 15/2554 2 2/25 17/2565 1 1/25 18/2566 1 1/25 19/2577 1 1/25 20/2578 1 1/25 21/2579 4 4/25 25/259

13
Histogram Equalization Example• Step 5: The scaled intensities become a lookup table to
apply to original image intensity in original intensity in result
0 01 32 43 54 65 66 77 78 79 9

14
Histogram Equalization Example• Step 6: apply lookup table
original 0 1 2 3 4 5 6 7 8 9
result 0 3 4 5 6 6 7 7 7 9
original result
0s stay 01s become 32s become 4and so forth

15
Recall Actual Image

16
Resulting Histogram

17
Resulting Image

18
Comparison

19
Example 2

20
Original Histogram

21
Resulting Histogram

22
Resulting Image

23
Comparison

24
Histogram Equalization on Color Images
• apply to color images• each channel (red, green, blue) treated
as separate histogram• equalize each independently• can lead to radical color changes in result

25
Histograms

26
Example of Color Histogram Equalization

Color as a low-level cue for Color Based Image Retreival
Blobworld systemCarson et al, 1999
Swain and Ballard, Color Indexing, IJCV 1991
Slides on CBIR from Kristen Grauman

R G B• Color histograms:
Use distribution of colors to describe image
• No spatial info – invariant to translation, rotation, scale
Color intensity
Pix
el c
ou
nts
Color as a low-level cue for CBIR
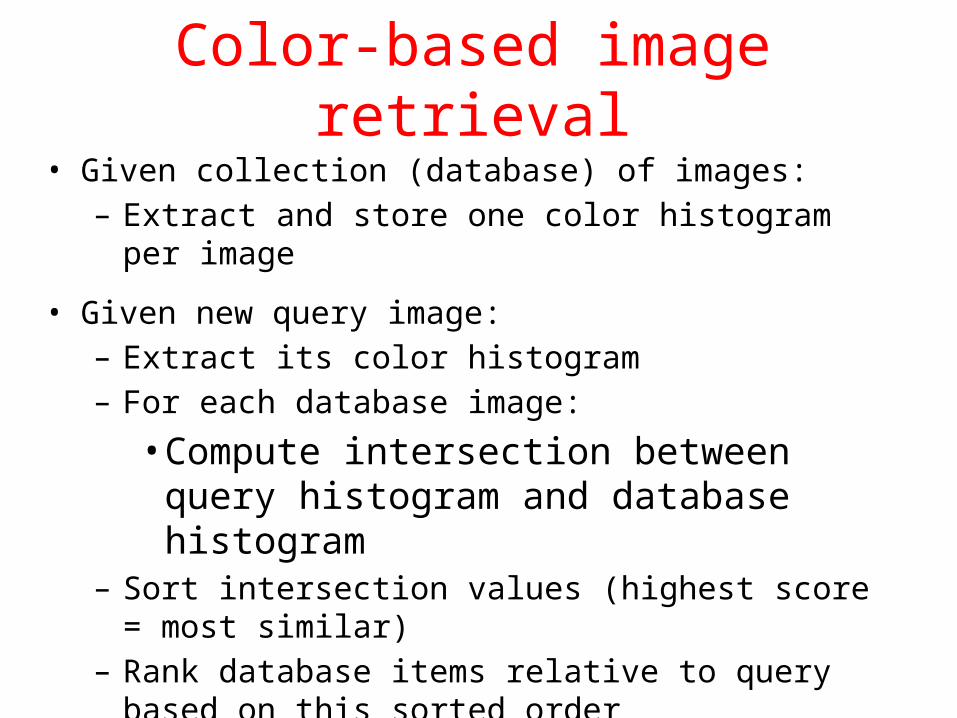
Color-based image retrieval• Given collection (database) of images:
– Extract and store one color histogram per image
• Given new query image:– Extract its color histogram– For each database image:
• Compute intersection between query histogram and database histogram
– Sort intersection values (highest score = most similar)– Rank database items relative to query based on this sorted
order

Color-based image retrieval
Example database

Example retrievals
Color-based image retrieval

Example retrievals
Color-based image retrieval
