cs 2750 project report jason d. bakos. project goals data sensor readings from 11 different people...
Post on 22-Dec-2015
216 views
TRANSCRIPT

CS 2750 Project Report
Jason D. Bakos

Project Goals Data
Sensor readings from 11 different people walking in a controlled environment
An accelerometer records floor vibration data from footfalls
A microphone records sounds from footballs This data is recorded 10 times for each
person Data gathered from 11 different people

Project Goals Use this data to perform multiple
classification Human gait analysis
Eventually want to determine if a person is in duress
Most important aspect: learn the nature of the data to determine how best to classify it

Data Preprocessing Data size
Data is collected at 15KHz for approximately 10 seconds
150,000 samples Must get data out of time domain
Must capture a “walk” as a single data point
Time series => cross sectional
Data Preprocessing Extract the largest intensity step from
the data Closest to sensors
Transform data to frequency domain Fourier transform
Used MatLab FFT – output is real array Integrated over time
Bin resultant data into bins These are now the features

Data Preprocessing Extracting footstep
Method 1 Find max value in time-domain Center fixed window around data 2000, 4000, 6000
Method 2 Actively find footstep Create new vector by recording sliding abs “mean”-
window Extract largest hill (using gradient descent and
threshold) Index from meanarray into data array Meanwindow sizes 1000, 2000, 3000

Data Preprocessing
Mean window of 1000

Data Preprocessing
Mean window of 2000
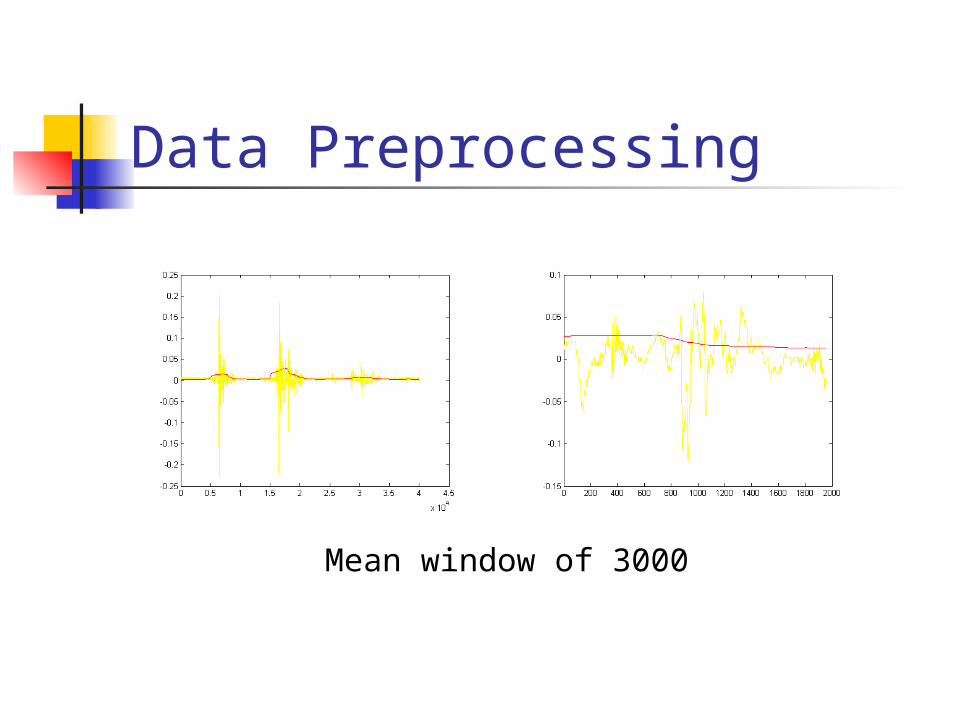
Data Preprocessing
Mean window of 3000

Analysis of Preprocessed Data Cluster analysis
Unsupervised learning 3 steps
Distance calculation Linkage analysis Clustering

Analysis of Preprocessed Data Distance Calculation
4 distance measures Euclid
Standard distance Standardized Euclid
Shorter distance between points who have relatively smaller variances
City Block Similar to Euclid, used for comparison
Minkowski Another way to measure distance, used for comparison
Result is array, distance from each point to every other point

Analysis of Preprocessed Data Linkage Analysis
Hierarchically link datapoints Methods
Shortest distance Average distance
Uses center points of clusters Centroid distance
Draws “sphere” around center point, uses furthest point as radius – use distance from edges of sphere
Incremental sum-of-squares Similar to centroid, used for comparison
Result is matrix

Analysis of Preprocessed Data Clustering
Force datapoints into a fixed number of clusters
Result is cluster vector and dendrogram

Analysis of Preprocessed Data How to judge how well the clustering
worked? My answer
Since there is exactly 10 samples from 11 people, define “uniformity” as a metric
( ) 1, 1 11j cluster i
count i for i
11 11
1 1
1
( ) ( )i j
uniformitycount i count j

Analysis of Preprocessed Data

Analysis of Preprocessed Data Checked all 12 charts
fix2000, fix4000, fix6000, win1000, win2000, win3000 for vibration and audio
Euclid/Sum-of-squares is best for vibration and audio
win3000 is best for vibration fix2000 is best for audio

Analysis of Preprocessed Data

Indirect Learning Used parametric Naïve Bayes model to
do multi-way classification 11 classes
Used 50-bin data Assumed data was multivariate
Gaussian Chose class based on maxium posterior
of C Used multiple train/test splits to train 3
models with bagging (voting)

Indirect Learning

Indirect Learning Bad results
Worse than random predictor Conclusion
Data is not Gaussian

Direct Learning Trained neural network with same
data Used softmax network to perform
multiway classification 1000 epochs, log sigmoid, gradient
descent Tried different parameters for
neural network

Direct Learning
Vibration
Audio

Direct Learning No improvement after 50 neurons
per level (vib and aud) 4 levels is best (including output
level) Results terrible for test sets

Conclusion Need
Better feature extraction Better classifiers
Or… maybe different sensors are needed Video