cru wa draft 8a - cpsbcpsb.com/research/articles/featured-articles/creating-innovative... · who...
TRANSCRIPT

CREATING MORE INNOVATIVE
WORKPLACES: LINKING PROBLEM-SOLVING STYLE AND
ORGANIZATIONAL CLIMATE
- A CRU TECHNICAL REPORT-
Scott G. Isaksen President and Senior Research Fellow
The Creative Problem Solving Group, Inc. Professor, Norwegian School of Management
Wouter S. Aerts
Program and Research Associate Creative Problem Solving Group, Brussels
Erik J. Isaksen
Manager of Database Operations The Creative Problem Solving Group, Inc.
Spring09

Page|2
Executive summary
Innovation and creativity as its prerequisite, are high priorities on the strategic agenda for those
who lead, manage, and work in organizations. Meeting the innovation challenge requires taking
a systemic approach – focusing on the people involved, the methods they are applying, the
environment within which they are working, as well as the desired innovative results.
While there are many competing models and methods for change and innovation,
applying any of them requires a consideration of the people involved and the context within
which they will be used. Indeed, a great deal of research and experience shows that those who
attempt to make change or innovation happen without considering people and place are
doomed to failure.
This study aimed to directly inquire and explore how people and place connect. The
idea that people and their work environments need productive fit is well established, but very
little is known about potential individual style differences and their personal perceptions on the
most and least desired work climate for creativity. As a result, this research project was
completed as part of a Masters Thesis done by Aerts (2008) with support from the Creativity
Research Unit (CRU) of CPSB, and was designed to explore the relationship between problem-
solving style and climates in best and worst-case experiences.
Two assessment approaches were taken. Best and worst-case climate was assessed
by administering two short forms of the Situational Outlook Questionnaire® in which 213
individuals identified a specific best and worst-case work experience and then responded to the
nine dimensions of creative climate. Problem-solving style was measured by VIEW: An
Assessment of Problem Solving StyleTM.
Key insights derived from this study include:
• There are extremely clear differences between best (most desired) and worst (least
desired) workplace climates – a confirmation of earlier research.
• Problem-solving style makes a difference for some of the dimensions of creative climate.
• There are clear implications for leaders and managers – one of which is that not
everyone needs the same thing when it comes to managing innovation.
Members of the CRU are currently working on a more extensive scientific summary that will be
published in the academic literature. This initial report highlights the results and implications.

Page|3
Table of Contents
EXECUTIVE SUMMARY.............................................................................................................. 2
TABLE OF CONTENTS ............................................................................................................... 3
THE IMPORTANCE OF INNOVATION........................................................................................ 4
The importance of people................................................................................................................... 5
The importance of place ..................................................................................................................... 8
Linking people and place ................................................................................................................... 9
Previous research on style and climate.......................................................................................... 10
OUR APPROACH ...................................................................................................................... 12
KEY FINDINGS .......................................................................................................................... 13
Clear differences between best- and worst-case climates............................................................ 13
Determining style through climate .................................................................................................. 14
Predicting climate through style...................................................................................................... 17
IN CONCLUSION ....................................................................................................................... 18
Some practical implications............................................................................................................. 19
REFERENCES ........................................................................................................................... 22
RESEARCH FELLOWS OF THE CREATIVITY RESEARCH UNIT.......................................... 24

Page|4
The importance of innovation
Management research confirms that organizations that meet the innovation challenge out
perform their competitors in terms of market share, profitability, growth and market capitalization
(Tidd, Bessant, & Pavitt, 2005). Innovative organizations are better able to mobilize the
knowledge, skills, and experiences of people, and successfully create new products, services
and ways of getting things done faster, better and cheaper. Although creativity is innovation’s
precursor, both are key issues for organizational survival and growth.
Innovation is increasingly seen as a key strategic priority due to its potential to create
sustainable competitive advantage. Barsh, Capozzi, and Davidson (2008), for example, found
that 70% of senior executives identified innovation as one of their top three drivers for improving
organizational performance. So, if innovation is so important, what practices and knowledge do
organizations apply to meet the challenge?
Many organizations apply a specific method, process or procedure to produce innovative
outcomes. These run the gambit from project management and new product development
methods to idea management and suggestion programs. Others focus their efforts on
innovative outcomes – setting clear and stretch targets for revenue from new products and
services. Some concentrate on the unique role that leaders play in sponsoring innovation or
selecting and encouraging the “right” people to play on innovation initiatives. A few
organizations focus on creating work environments that support creativity and innovation. Even
fewer organizations address the challenge by taking a blend of both strategic and tactical
reviews of best practices, and then customize their solutions to address their unique needs and
situations.
Given all the challenges organizations must face when managing for innovation, the
most productive way forward is to consider the whole system of change and creativity, rather
than only focusing on a single part (Isaksen & Tidd, 2006). In fact, there is emerging evidence
that high-performing innovative organizations work on all the key elements, including:
deliberately managing the innovation process; engaging in leadership practices that include and
involve a diverse collection of skills, styles, and talents; and intentionally working to establish
appropriate conditions to encourage and sustain creative efforts (Davis, 2000).
A practical way to systemically address the innovation challenge is to ask: What works
for whom, under what circumstances (see Figure 1)? The “what works” part of the question
refers to impact and effectiveness of the tools, techniques, processes, and methods of

Page|5
innovation. Those who lead and manage organizations have focused most of their attention on
“what works.” Many of these efforts have produced disappointing results because the methods
were simply transplanted or applied with little or no consideration for the people involved (“for
whom”) or the specific and unique conditions or context (“under what circumstances”).
Figure 1: What works for whom under what circumstances?
The purpose of this study was to more deeply explore the relationships between people
and place by assessing both style of problem solving and the nature of the work environment.
We used VIEW: An Assessment of Problem Solving StyleTM to assess people’s style and a short
form of the Situational Outlook Questionnaire® to assess the work environments of both best-
case and worst-case work environments.
The importance of people
We see creativity as the making and communicating of meaningful new connections and
insights. Innovation is the transformation of these ideas and insights into deliverable business
results. You can have creativity without innovation - but you can’t have innovation without
creativity. When it comes to innovation, it is important to recognize that people are the source
of creativity, which is the basis for innovation.
One way to understand people as a source of creativity is to focus on their capabilities,
skills, and motivations – particularly those that are more likely to produce creative behavior. The
literature on creativity has often embraced a multi-faceted approach to understanding creative
abilities, motivations, skills, and characteristics. This approach has been referred to as
concentrating on level of creativity.

Page|6
Another, more recent, way to understand creativity within people is through the lens of
style. Style has to do with the way or manner someone uses their creativity. A few researchers
have made sharp conceptual distinctions between level and style using the analogy that level
refers to the power of the engine, and style refers to how one drives the car. Unraveling level
from style involves making a distinction between a focus on capacity, competence, or the extent
or degree of one’s creative ability, (level, expressed informally in the question, “How creative
are you?”) and a focus on mode or preference for certain ways of expressing or applying
creativity (style, expressed informally in the question, “How are you creative?”). Consistent with
a view of creativity as multi-dimensional, we propose that both level and style are among the
factors that influence creative behavior.
Selection processes in organizations often include ways to find and hire people with the
requisite education, expertise, and experience. Further, there is fairly strong evidence that level
can be increased through deliberate training in creativity. This study, however, focuses on style
rather than level.
We define problem-solving styles as consistent individual differences in the ways people
prefer to plan and carry out generating and focusing activities, in order to gain clarity, produce
ideas, and prepare for action. The intention of understanding, appreciating, and managing
one’s style of problem solving is to assist individuals and groups in navigating their way through
the creative process. Once individuals understand and appreciate their own preferred style it
may be easier for them to understand and appreciate people with different styles. We would
also hope that the insights about style would help those who must behave in ways that ask them
to work outside their preferred mode and adapt their behavior to the needs of different
situations. Another potential implication of improved and shared understanding of diverse styles
is that people would be better able to lever the preferences and strengths of those with different
styles than their own.
There are many different, and widely used, measures of style that are based on various
definitions and concepts. Some, like the Myers-Briggs Type Indicator (MBTI), assess
psychological type and include four dimensions of style. Others, like the Kirton Adaption-
Innovation Inventory (KAI) assess cognitive style and include one dimension.
There are also many studies that have examined the impact and importance of style
when it comes to creativity and innovation. Some have shown that style affects the learning and
application of methods and tools for innovation (Isaksen & Geuens, 2007; Puccio, Wheeler, &
Cassandro, 2004). Other studies have shown the importance and value of particular styles in
specific stages of new product development (Stevens, Burley, & Divine, 1999).
Page|7
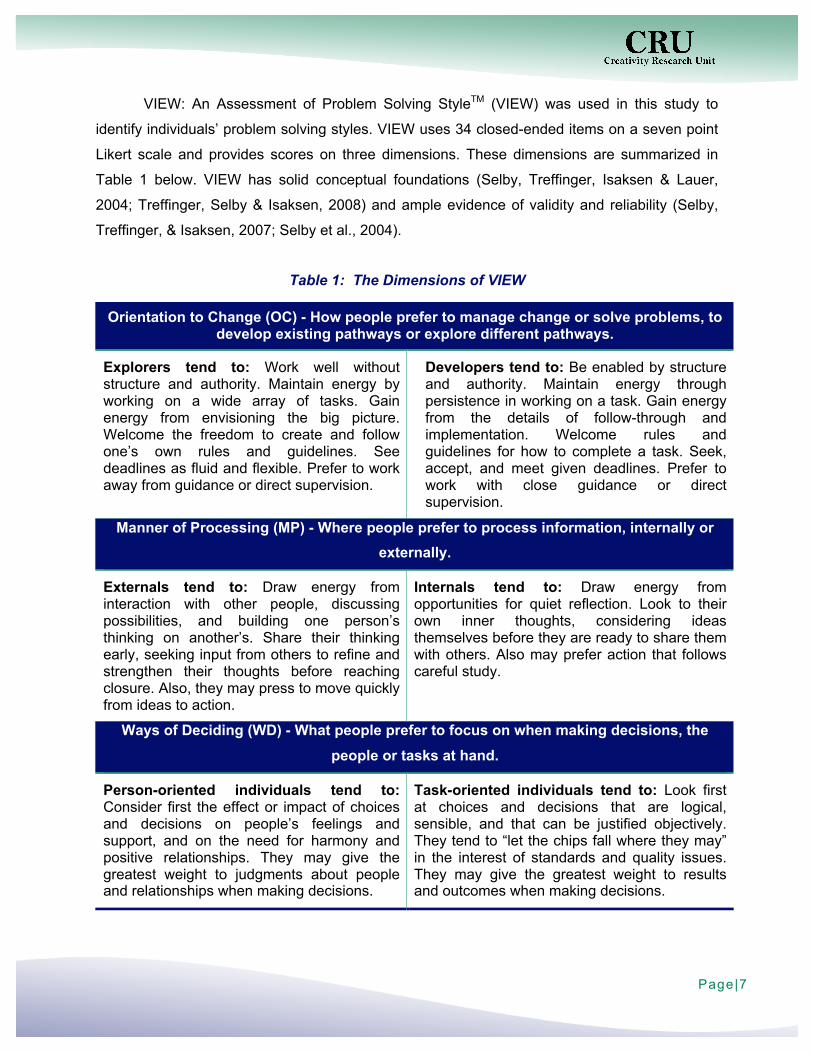
VIEW: An Assessment of Problem Solving StyleTM (VIEW) was used in this study to
identify individuals’ problem solving styles. VIEW uses 34 closed-ended items on a seven point
Likert scale and provides scores on three dimensions. These dimensions are summarized in
Table 1 below. VIEW has solid conceptual foundations (Selby, Treffinger, Isaksen & Lauer,
2004; Treffinger, Selby & Isaksen, 2008) and ample evidence of validity and reliability (Selby,
Treffinger, & Isaksen, 2007; Selby et al., 2004).
Table 1: The Dimensions of VIEW
Orientation to Change (OC) - How people prefer to manage change or solve problems, to develop existing pathways or explore different pathways.
Explorers tend to: Work well without structure and authority. Maintain energy by working on a wide array of tasks. Gain energy from envisioning the big picture. Welcome the freedom to create and follow one’s own rules and guidelines. See deadlines as fluid and flexible. Prefer to work away from guidance or direct supervision.
Developers tend to: Be enabled by structure and authority. Maintain energy through persistence in working on a task. Gain energy from the details of follow-through and implementation. Welcome rules and guidelines for how to complete a task. Seek, accept, and meet given deadlines. Prefer to work with close guidance or direct supervision.
Manner of Processing (MP) - Where people prefer to process information, internally or externally.
Externals tend to: Draw energy from interaction with other people, discussing possibilities, and building one person’s thinking on another’s. Share their thinking early, seeking input from others to refine and strengthen their thoughts before reaching closure. Also, they may press to move quickly from ideas to action.
Internals tend to: Draw energy from opportunities for quiet reflection. Look to their own inner thoughts, considering ideas themselves before they are ready to share them with others. Also may prefer action that follows careful study.
Ways of Deciding (WD) - What people prefer to focus on when making decisions, the people or tasks at hand.
Person-oriented individuals tend to: Consider first the effect or impact of choices and decisions on people’s feelings and support, and on the need for harmony and positive relationships. They may give the greatest weight to judgments about people and relationships when making decisions.
Task-oriented individuals tend to: Look first at choices and decisions that are logical, sensible, and that can be justified objectively. They tend to “let the chips fall where they may” in the interest of standards and quality issues. They may give the greatest weight to results and outcomes when making decisions.
Page|8
The key question for this study was: Do people who have different problem-solving
styles report differences in their best and worst-case work situations?
The importance of place
An organization’s ability to sustain innovation depends, in large part, on its work environment.
But what do we mean by work environment? Some researchers and practitioners believe that
the work environment is all about organizational culture. Others attempt to measure work
environment by including a variety of influencers like leadership behavior, availability of
resources, etc. Good measurement is preceded by clear definition.
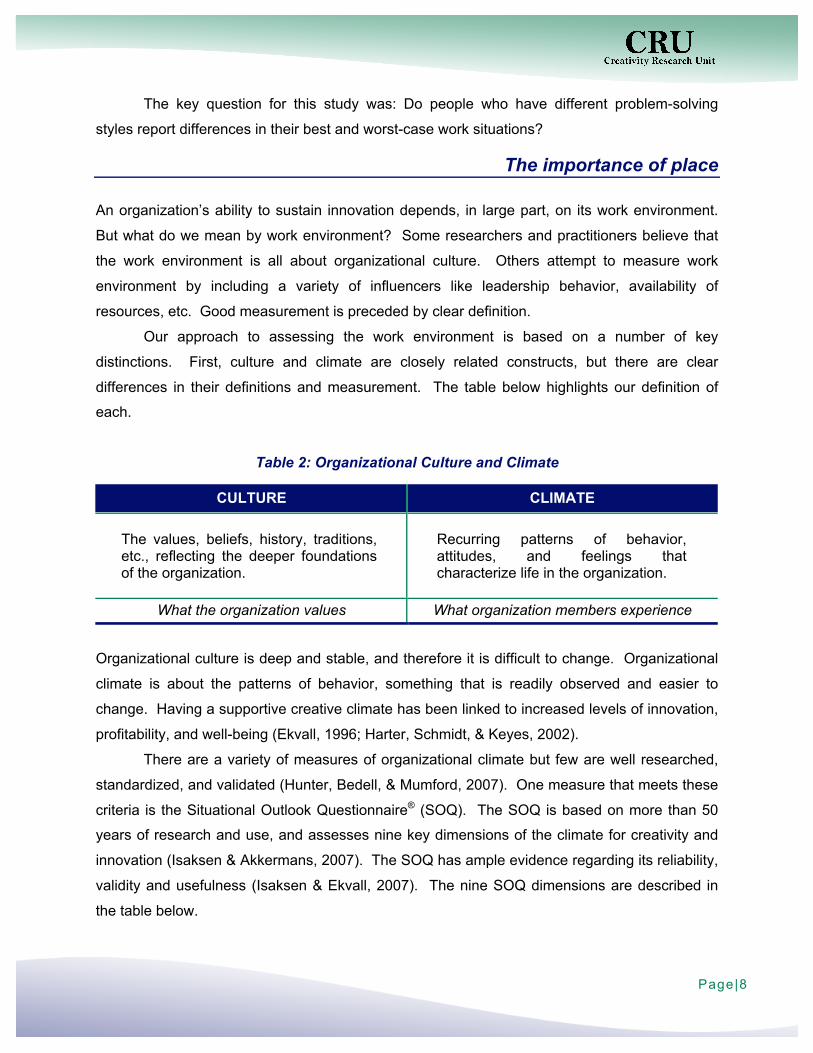
Our approach to assessing the work environment is based on a number of key
distinctions. First, culture and climate are closely related constructs, but there are clear
differences in their definitions and measurement. The table below highlights our definition of
each.
Table 2: Organizational Culture and Climate
CULTURE CLIMATE The values, beliefs, history, traditions, etc., reflecting the deeper foundations of the organization.
Recurring patterns of behavior, attitudes, and feelings that characterize life in the organization.
What the organization values What organization members experience
Organizational culture is deep and stable, and therefore it is difficult to change. Organizational
climate is about the patterns of behavior, something that is readily observed and easier to
change. Having a supportive creative climate has been linked to increased levels of innovation,
profitability, and well-being (Ekvall, 1996; Harter, Schmidt, & Keyes, 2002).
There are a variety of measures of organizational climate but few are well researched,
standardized, and validated (Hunter, Bedell, & Mumford, 2007). One measure that meets these
criteria is the Situational Outlook Questionnaire® (SOQ). The SOQ is based on more than 50
years of research and use, and assesses nine key dimensions of the climate for creativity and
innovation (Isaksen & Akkermans, 2007). The SOQ has ample evidence regarding its reliability,
validity and usefulness (Isaksen & Ekvall, 2007). The nine SOQ dimensions are described in
the table below.

Page|9
Table 3: The SOQ Dimensions
SOQ Dimensions High Level Definition
Challenge/Involvement The degree to which people are involved in daily operations, long-term goals, and visions. High Challenge/Involvement implies better levels of engagement, commitment, and motivation
Freedom The degree of independence shown by the people in the organization. High levels of Freedom imply more perceived autonomy and ability for individual discretion.
Trust/Openness The emotional safety in relationships. In high Trust/Openness situations people feel more comfortable sharing ideas and being frank and honest with each other.
Idea-Time The amount of time people can, and do, use for elaborating new ideas. When Idea-Time is high people can explore and develop new ideas that may not have been included in the original task.
Playfulness/Humor The spontaneity and ease displayed within the workplace. Good-natured joking and laughter and a relaxed atmosphere (lower stress) are indicators of higher levels of Playfulness and Humor.
Conflict The presence of personal and emotional tensions (a negative dimension – in contrast to the debate dimension). When Conflict is high people engage in interpersonal warfare, slander and gossip, and even plot against each other.
Idea-Support The way new ideas are treated. In a high Idea-Support situation people receive ideas and suggestions in an attentive and professional manner. People listen generously to each other.
Debate The occurrence and open disagreement between viewpoints, ideas, experiences, and knowledge. In the Debating situation many different voices and points of view are exchanged and encouraged.
Risk-Taking The tolerance of uncertainty and ambiguity. In a high Risk-Taking climate people can make decisions even when they do not have certainty and all the information desired. People can and do “go out on a limb” to put new ideas forward.
In addition to assessing these nine dimensions, the SOQ includes three open-ended
questions that provide additional insight regarding what is working well, what the barriers are,
and what needs to be done to make the climate more supportive of creativity and innovation.
This study used a short form of the SOQ to assess the nine dimensions of climate and did not
include the open-ended questions.
Another way of stating the key question for this study is: Do certain dimensions of
climate have different degrees of importance for people of differing styles, when considering
their best and worst-case work situations?
Linking people and place
Those who lead and manage organizations must produce innovative results to remain
competitive and grow. The natural focus of their attention has been on “what works”. But

Page|10
managing for innovation must also consider the people involved in innovation as well as the
climate that supports the use of their creative talents. Creative behavior, and the innovation that
results, is most certainly a function of both people and their context. So where do we look for
insights into how people and place need to be understood and managed?
The literature that should be most helpful deals with the interaction and relationships
between people and their situations, also known as person-environment (P-E) fit research. The
basic idea of P-E fit is the interest in work settings that create an appropriate match between the
characteristics of employees and their work context. The principle is that when people are
aligned with their environments positive outcomes result for both individuals and organizations
(Sekiguchi, 2004).
There are three main areas of study within the realm of P-E fit literature. The first is
called person-job (P-J) fit and is concerned with matching employees’ skills, knowledge, and
abilities to performing specific job-related tasks. This area includes developing appropriate
selection, orientation, development, and retention procedures to ensure that employees have
the right characteristics to effectively perform their duties (Edwards, 1994). The second area of
interest is called person-group (P-G) fit and is concerned with P-E fit at a group or team level.
The main issue for P-G fit is having a set of skills and behaviors that support both the work task
and maintenance dimensions for effective teamwork (Werbel & Johnson, 2001). The third main
area is called person-organization (P-O) fit and involves the matching of people’s interests,
values, and needs to the organizational context. The emphasis of most P-O research has been
on the match between people’s values and the organizational culture (Van Vianen, 2000).
The primary application of P-E fit literature has been within the area of human resource
management (Werbel & DeMarie, 2005). Very few studies relate to the deliberate management
of creativity and innovation (Choi, 2004). Some researchers have linked individual differences
in personal style to measures of productivity (Gustafson & Mumford, 1995; Puccio, Talbot, &
Joniak, 2000). Livingstone, Nelson and Barr (1997) found that demands for creativity on the job
led to higher levels of job satisfaction and lower strain. Even fewer studies examine P-E fit by
focusing on people’s styles and their perceptions of the organizational climate.
Previous research on style and climate
The initial study to deliberately examine the link between creative organizational climate and
personal style used a single-dimensional measure of cognitive style and an assessment of
organizational climate (Isaksen & Kaufmann, 1990). The aim of the exploratory study was to
see if there were relationships between cognitive style and creative climate using an aggregated
Page|11
sample of convenience (N = 634). The results indicated a few significant differences between
Kirton’s Innovators and Adaptors (Kirton, 2003) and two dimensions of creative climate
assessed by an earlier version of the SOQ. Kirton’s adaptors reported significantly more
challenge, and innovators reported significantly more conflict (personal tension).
Following a critique offered by Clapp and Kirton (1994), the senior author advised a
graduate student in conducting a study using the same two measures (Grivas, 1996). The
purpose of this multi-method study was to further explore the extent to which there were
relationships between cognitive style, as assessed by the KAI, and the creative climate, as
assessed by the SOQ. The sample included 147 research and development professionals
within one global consumer products organizations. The quantitative results using a smaller,
but more homogeneous sample, showed few low, but significant, correlations. Further, the
ANOVA and discriminant function analysis did not yield any significant differences for strong
adaptors or innovators. The qualitative analysis did produce some meaningful differences.
Those with a stronger adaptive preference require deliberate validation and
encouragement from their managers to express more Freedom and Risk-Taking, while those
with a stronger innovator orientation seem to innately assume that they can and should engage
in these dimensions. When it came to structure and rules, adaptors are less likely to push
against or violate them, while innovators perceived structure and rules as confining. When
considering how people of differing styles relate to the social aspects of the organization, strong
adaptors saw a cohesive and well-structured group as supportive of their creativity. Strong
innovators preferred not to be “bogged down” by needing to conform to a group.
In order to respond to the critique offered by Clapp and Kirton (1994), Isaksen and Lauer
(1999) reanalyzed their data from the 1990 study with an expanded data set (N = 646) using the
same two measures. Their earlier findings on Challenge and Involvement and Conflict were
replicated. In addition, Kirton’s adaptors were more likely to perceive more Risk-Taking in their
work environments than innovators.
The three previous studies used the KAI to assess the cognitive style of those
completing the SOQ. The KAI is a single-dimensional assessment that provides a continuous
score ranging from most adaptive to most innovative. Isaksen (2009) conducted a fourth study
to examine the relationship between style and climate, but used VIEW to assess problem-
solving style. Since VIEW includes three dimensions of style, the hope was that using a more
robust yet parsimonious assessment would yield deeper insights. Since Grivas (1996) found
such meaningful qualitative differences, a multi-method approach was taken. The study
Page|12
included 144 participants drawn from six different organizations with different professional
positions.
Two small, but significant, correlations were found out of the 27 coefficients computed.
Explorers perceived more Challenge and Involvement and Externals perceived more Idea-
Support. Further discriminant analysis with more extreme style preferences found no significant
differences. Some clear and meaningful differences were found from the qualitative analysis.
These results were somewhat consistent with the previous studies.
All these studies examined the relationship between cognitive or problem-solving style and
the existing perceptions of the current working climate. In general, only modest (if any)
quantitative relationships have been identified, but meaningful qualitative differences have
consistently been found. These findings led to our current study – one aimed to examine best-
and worst-case working climates, rather than current “here and now” perceptions of climate.
Our approach
The sample of this study consists of 213 individuals. One hundred forty-three respondents were
members of organizations while 70 were participants in educational institutions. They all came
from the United States of America or Norway.
For this study, the short form of the SOQ was used. This version consists of nine
questions, one for each of the nine dimensions. In order to get a clear distinction between the
best- and worst-case climates, participants were asked to complete two SOQ forms. Subjects
were asked to think about and reflect on their least creative work experience and then complete
one form labeled worst-case climate. Then they were asked to think about their most creative
work situation and complete the best-case form.
Since the study included so many different situations, it was important to ensure that there
was relative consensus in people’s perceptions of their best- and worst-case climates. Any time
we aggregated climate scores, we computed rWG values. These present an indication of the
interrater reliability, or level of perceptual agreement across the different situations. In general,
an rWG value of .70 or above would indicate that the means of the SOQ are sufficiently
homogeneous for within-group aggregation.
Page|13
Key findings
The observed means for the dimensions of Orientation to Change (OC), Manner of Processing
(MP) and Ways of Deciding (WD) were all similar to the observed means as reported in VIEW’s
technical manual and the most recent analysis of the VIEW database including over 20,000
subjects (Selby et al., 2007; Treffinger, 2009).
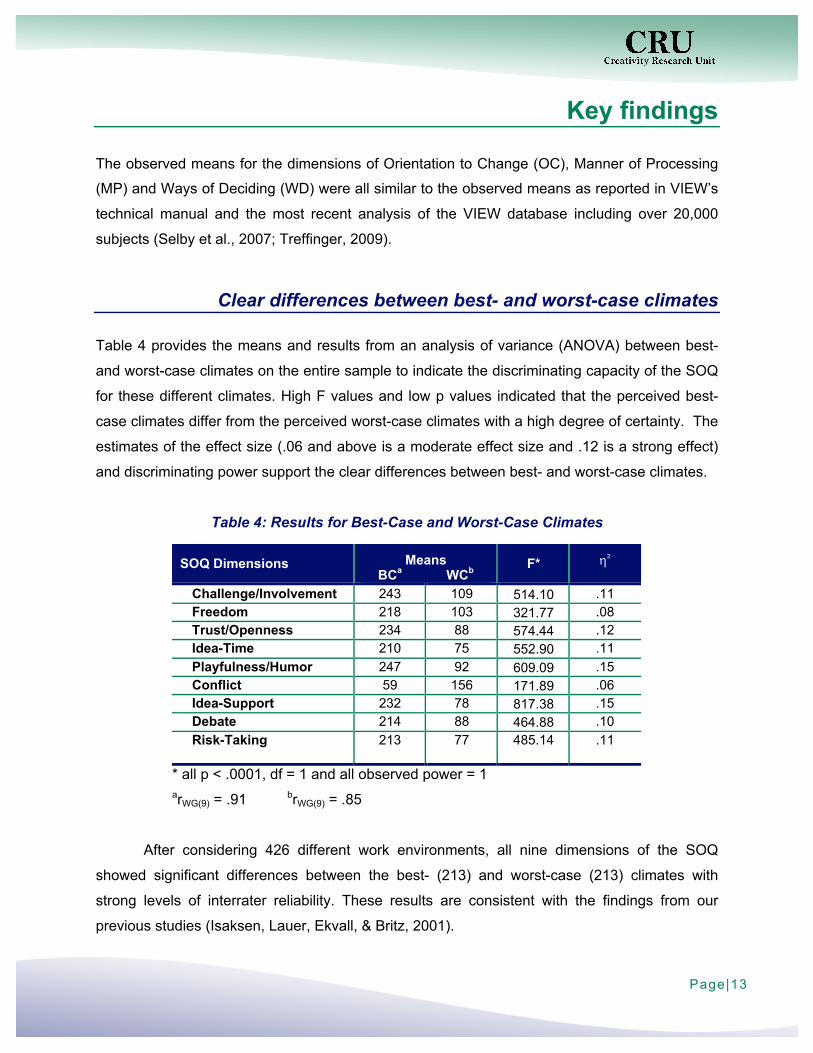
Clear differences between best- and worst-case climates
Table 4 provides the means and results from an analysis of variance (ANOVA) between best-
and worst-case climates on the entire sample to indicate the discriminating capacity of the SOQ
for these different climates. High F values and low p values indicated that the perceived best-
case climates differ from the perceived worst-case climates with a high degree of certainty. The
estimates of the effect size (.06 and above is a moderate effect size and .12 is a strong effect)
and discriminating power support the clear differences between best- and worst-case climates.
Table 4: Results for Best-Case and Worst-Case Climates
SOQ Dimensions Means
BCa WCb F* η2
Challenge/Involvement 243 109 514.10 .11 Freedom 218 103 321.77 .08 Trust/Openness 234 88 574.44 .12 Idea-Time 210 75 552.90 .11 Playfulness/Humor 247 92 609.09 .15 Conflict 59 156 171.89 .06 Idea-Support 232 78 817.38 .15 Debate 214 88 464.88 .10 Risk-Taking 213 77 485.14
.11
* all p < .0001, df = 1 and all observed power = 1
arWG(9) = .91 brWG(9) = .85
After considering 426 different work environments, all nine dimensions of the SOQ
showed significant differences between the best- (213) and worst-case (213) climates with
strong levels of interrater reliability. These results are consistent with the findings from our
previous studies (Isaksen, Lauer, Ekvall, & Britz, 2001).

Page|14
Determining style through climate
Given the clear and significant differences between best- and worst-case climates, the next
stage of the study was to determine if climate scores could predict scores of any of the three
dimensions of VIEW. The initial analysis included computing correlations between the nine
dimensions of the SOQ for both the best- and worst-case climates and scores on the three
dimensions of VIEW. A few significant relationships were found for OC and WD for the best-
case climate results, and for WD on the worst-case climates, but none for the MP dimension.
Results from both the best- and worst-case climates were able to predict two of VIEW’s
dimensions: OC and WD.
To be certain the participants had a clear and distinctive VIEW style preference, only
those who scored one half standard deviation above and below the observed mean for all three
dimensions were used in analysis. This procedure has been successfully applied in many
previous studies.
Table 5: Test of Equality of Means for OC
SOQ Dimensions Best-Case
Worst-Case
Wilks’ ∧ F Sig. Wilks’ ∧ F Sig. Challenge/Involvement 0.984 2.272 .134 0.998 0.217 .642 Freedom 0.949 7.374 .007 0.998 0.335 .564 Trust/Openness 0.991 1.201 .275 0.998 0.291 .590 Idea-Time 0.985 2.112 .148 0.998 0.310 .578 Playfulness/Humor 0.985 2.093 .150 0.985 2.061 .153 Conflict 0.991 1.181 .279 0.998 0.240 .625 Idea-Support 0.989 1.470 .227 0.972 3.929 .049 Debate 0.983 2.400 .124 0.996 0.536 .466 Risk-Taking
0.990 1.382 .242 0.987 1.857 .175
n = 138
The results presented in Table 5 clearly indicate that Explorers perceive significantly
more Freedom (mean of 231) in their best-case working climates than Developers do (mean of
202). Further analysis was conducted using discriminant function and found that Freedom was
an optimum predictor variable (Wilks’ Λ= .984, F=7.374, p<.007: 64.5% classification). This
means that higher scores on the Freedom dimension of the SOQ can provide some prediction
of an Explorer preference on VIEW for a best-case work situation.

Page|15
The largest difference between Explorers and Developers in their worst-case situation is
found on the Idea-Support dimension of the SOQ. Explorers tend to see less Idea-Support
(mean of 68) in their worst-case climates than Developers do (mean of 87). Further
examination using discriminant function analysis found that Idea-Support was an optimum
predictor variable (Wilks’ Λ = .972, F=3.929, p<.049: 55.8% classification), suggesting that
scores on Idea-Support can provide some prediction of scores on OC.
There are clear implications for those who aim to create the most desirable work setting.
Explorers prefer to work away from guidance or direct supervision, they welcome freedom to
create their own guidelines, they like to bend the rules and see structure as limiting and
confining. The results of the current study are consistent with earlier qualitative findings that
Explorers enjoy large amounts of leeway in making their own decisions and autonomy in
establishing their own direction for work. They see stringent planning processes as a barrier to
their creativity. Developers welcome authoritative guidelines and like working with close
guidance or direct supervision in a well structured and organized environment. Again, previous
qualitative findings indicate that Developers see ambiguity and a lack of clear goals and
structure as a barrier to their creativity.
There are also clear implications for those who wish to avoid the least desired work
setting. Explorers tend to explore possibilities and generate original ideas. To do so they need
the support from their peers and management. If they do not perceive enough support they may
lose the needed energy to continue pursuing high degrees of novelty. For example, previous
qualitative findings indicated that Explorers see long delays in senior management decision-
making as a barrier to their creativity. Developers are focused less on unique or daring ideas.
Therefore they would naturally see more Idea-Support than Explorers, even in a worst-case
setting, because it is easier for peers or managers to support an idea with a lower risk factor.
Previous qualitative findings indicated that Developers focused on manager or peer support and
encouragement as a stimulant for their creativity.
Page|16
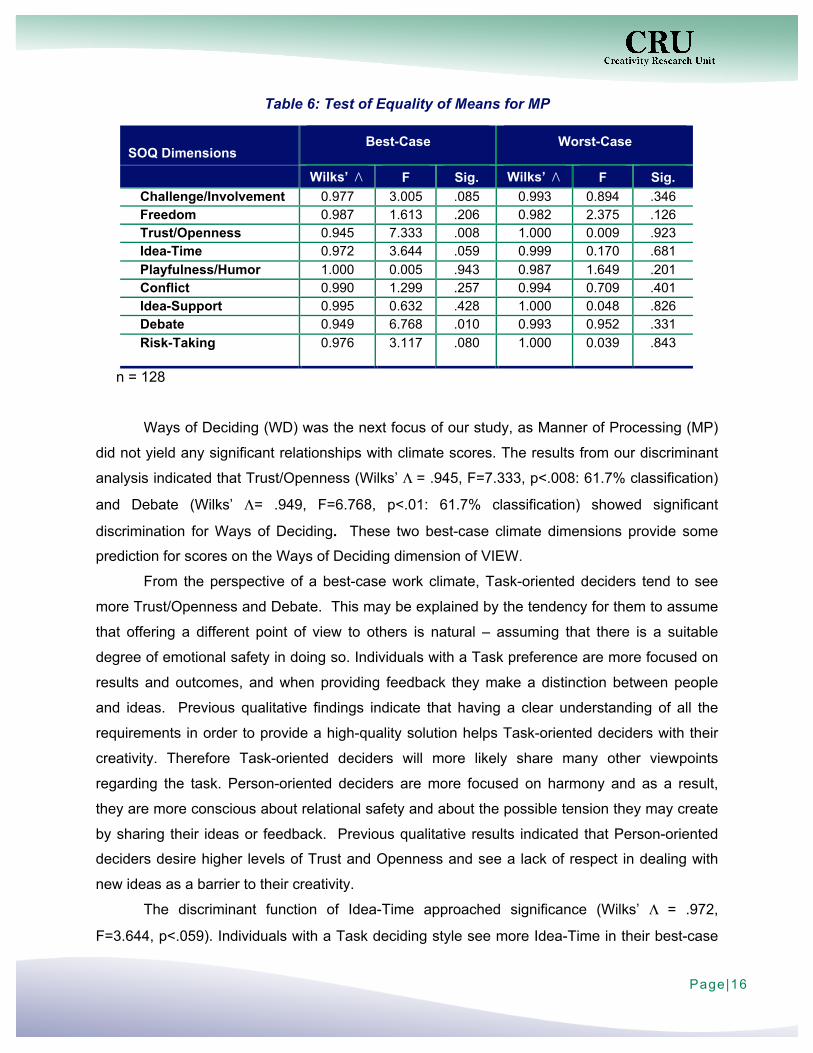
Table 6: Test of Equality of Means for MP
SOQ Dimensions Best-Case
Worst-Case
Wilks’ ∧ F Sig. Wilks’ ∧ F Sig. Challenge/Involvement 0.977 3.005 .085 0.993 0.894 .346 Freedom 0.987 1.613 .206 0.982 2.375 .126 Trust/Openness 0.945 7.333 .008 1.000 0.009 .923 Idea-Time 0.972 3.644 .059 0.999 0.170 .681 Playfulness/Humor 1.000 0.005 .943 0.987 1.649 .201 Conflict 0.990 1.299 .257 0.994 0.709 .401 Idea-Support 0.995 0.632 .428 1.000 0.048 .826 Debate 0.949 6.768 .010 0.993 0.952 .331 Risk-Taking
0.976 3.117 .080 1.000 0.039 .843
n = 128
Ways of Deciding (WD) was the next focus of our study, as Manner of Processing (MP)
did not yield any significant relationships with climate scores. The results from our discriminant
analysis indicated that Trust/Openness (Wilks’ Λ= .945, F=7.333, p<.008: 61.7% classification)
and Debate (Wilks’ Λ= .949, F=6.768, p<.01: 61.7% classification) showed significant
discrimination for Ways of Deciding. These two best-case climate dimensions provide some
prediction for scores on the Ways of Deciding dimension of VIEW.
From the perspective of a best-case work climate, Task-oriented deciders tend to see
more Trust/Openness and Debate. This may be explained by the tendency for them to assume
that offering a different point of view to others is natural – assuming that there is a suitable
degree of emotional safety in doing so. Individuals with a Task preference are more focused on
results and outcomes, and when providing feedback they make a distinction between people
and ideas. Previous qualitative findings indicate that having a clear understanding of all the
requirements in order to provide a high-quality solution helps Task-oriented deciders with their
creativity. Therefore Task-oriented deciders will more likely share many other viewpoints
regarding the task. Person-oriented deciders are more focused on harmony and as a result,
they are more conscious about relational safety and about the possible tension they may create
by sharing their ideas or feedback. Previous qualitative results indicated that Person-oriented
deciders desire higher levels of Trust and Openness and see a lack of respect in dealing with
new ideas as a barrier to their creativity.
The discriminant function of Idea-Time approached significance (Wilks’ Λ = .972,
F=3.644, p<.059). Individuals with a Task deciding style see more Idea-Time in their best-case

Page|17
climates as they separate ideas from people and strive for efficiency when using time. Person-
oriented deciding styles consider both people and their ideas. As a result they may have more
dynamics and complexity to consider because they think about people and their ideas as a
whole.
In summary, the differences in climate scores between best- and worst-case climates
were able to identify and predict, to some extent, different problem-solving styles.
Predicting climate through style
In the previous section, style was used as a dependent variable and climate as an independent
variable. In this section, we explore the relationships the other way around – what happens
when we attempt to predict climate scores? The analysis was conducted using climate as the
dependent variable. We summed the scores on all the SOQ dimensions to create an overall
climate score, reversing the scores on Conflict, so that the higher the overall score the better the
climate.
In addition to the three dimensions of VIEW (OC, MP and WD), we included gender,
age, and employment status as independent variables. Including gender and age would allow
us to consider the extent to which both contributed to predicting climate. Finally, we added
whether or not the participant was employed or was a student to see if there would be any value
in predicting climate based on employment level. Gender and employment status were both
included as “dummy” variables (not because they are stupid – just to make the analysis easier!).
We applied multiple linear regression analysis to determine a possible relationship
between problem-solving style and climate. This kind of analysis permitted us to examine the
relationship between a single dependent variable (creative climate) and several independent
variables (style, gender, age, etc.). It allows us to analyze the relative strength of relationship or
prediction of the independent variables on the dependent variable.
The six variables were entered in the regression model using a backward stepwise
elimination method. This way, all the variables are inserted in the first stage. Afterwards, the
items that do not have a significant influence in determining climate are filtered out for the next
stage of analysis.
It took three regression models to obtain the one that was the most appropriate fit for the
best-case climate. Gender, age, OC, and WD accounted for 7% of the variance in explaining
best-case climate score. Gender and age accounted for significant interaction with climate
scores in previous research (Lauer & Isaksen, 2001), but this was the first time two additional
style dimensions were identified as having significant interaction effects. Task-oriented deciders

Page|18
are more likely to score higher for their perceived best-case climate. Similarly, those who are
older and female will tend to score higher.
The final best-case regression model only accounted for 7% of the variance. Although
the predictor variables were significant, a great deal of the variance in climate scores remained
unexplained. This is understandable since many variables affect climate, and since it is an
intervening variable – influencing other outcome variables. Further, the Model for Organizational
Change (Isaksen et al., 2001) specifies and explains the many kinds of factors that influence
climate and that a creative climate is likely to affect other aspect of the MOC.
It took five stages of regression analysis to obtain the final model for the worst-case
climate results. Finally, only OC and WD had a significant influence on climate. These two
variables explained a small, but significant, amount of the total variance (3%). Once more, WD
explained the most variance.
Two key factors in determining the climate scores are the preferences of a strong
Explorer or Developer style, also strong preferences toward being Person- or Task-oriented in
Ways of Deciding. Someone who has a strong Explorer preference will perceive higher scores
in their worst-case situations. Task-oriented deciders would be more likely to have lower scores
in their worst-case situations. An explanation for this finding could be that Developers and
People-oriented individuals see less of the negatives in a worst-case climate and more of the
positives. Even if they find themselves in a worst-case situation they still perceive a better
relative worst-case climate.
So, we can conclude that in both regression models, two of the three VIEW dimensions, OC
and WD, have a significant influence on best- and worst-case climates.
In conclusion
The major question addressed by this study was: Do people of diverse problem-solving styles
require different climates for creativity? On the one hand, there are clear general pictures
regarding best- and worst-case creative working climates. This study confirmed earlier research
pointing out that people seem to have high levels of agreement on the kind of work climates
they perceive as best- and worst-case.
Page|19
Some practical implications
Benefits of understanding climate. There are numerous practical benefits derived from
understanding climate. At an individual level people can become more explicit about their own
climate and may be better able to shape that climate in the preferred direction. This may help
individuals reduce certain negative aspects and focus on steps they can take to increase the
positive ones. For teams and groups, having a shared understanding of their climate may
promote more open and honest communication and the development of concrete actions they
can take to ensure a productive environment to promote efficient functioning. At an
organizational level, understanding climate can help those who are charged with leading and
managing to examine the fit between the strategy, structure, and purpose of the organization
with the readiness, willingness and ability of the climate to sustain the appropriate kind of work.
Benefits of understanding style. There are also many concrete benefits from an improved
understanding of problem-solving style. Individuals can learn more about their preferred
strengths and challenges as well as under what conditions they will need to behave outside their
preferred style. Members of groups and teams can better understand and manage the diversity
of styles and work together to remove barriers to high performance. Those who lead and
manage organizations can increase the versatility and appreciation of the requisite diversity of
problem solving approaches to remain competitive and support innovation.
These benefits can be amplified by an improved understanding of how people of
different styles perceive their best- and worst-case climates differently. This study illustrated
that there are, indeed, a few important quantitative relationships between style and climate. It
also demonstrates the value of using a more robust measure of style. The OC dimension of
VIEW correlates with the KAI, so the results of this study confirm earlier relationships. However,
applying VIEW allowed the demonstration of some meaningful relationships with WD, a
dimension that does not exist in the KAI. Further research to better understand the relationship
between style and climate should continue to use multi-dimensional measures.
This study has a number of practical implications for consultants, managers and leaders.
These include:
There are clear differences between best- and worst-case climates. This study replicated
and confirmed previous research indicating that people have clear, meaningful, and significant
differences between their most preferred and least preferred work climates. Further, the nine
dimensions of the SOQ are able to assess these differences. Higher scores on the eight positive
dimensions and lower scores on the one negative dimension illustrate these differences.

Page|20
Fairness may not be about treating everyone the same. This study indicated that strong
Explorers desire more Freedom and autonomy than strong Developers in their best-case
workplace. Explorers perceive less Idea-Support than Developers in their worst-case work
climates. This implies that because of the nature of the ideas they generate and the way they
prefer to work, Explorers may be less likely to have their ideas treated in a positive way. When it
comes to Manner of Processing, those with a Task-oriented preference see higher levels of
Trust and Openness than People-oriented deciders in their best-case work climates, and more
frequently exchange different points of view (Debate).
Since these differences exist, those who manage and lead others must rethink the
notion that everyone should be treated exactly the same, particularly when the aim is to provide
a climate that is conducive to creativity and innovation. Managers and leaders must have a
range of managerial strategies to get the best out of everyone, providing equal opportunities for
people of all styles to contribute to meeting the innovation challenge.
Style differences have implications for workplace climate. Those who use style
assessments usually aim to provide insight regarding people (for whom). This study clearly
indicated that those who use VIEW to provide these insights may also be able to provide their
clients with useful information about workplace climate implications. Providing Explorers with
their desired and appropriate levels of autonomy and managing the dynamics of Task-oriented
deciders readily engaging in debate are just a few of the dynamics that may be more important
to manage.
Workplace climates have implications for different styles. The use of climate assessments
has a strong focus on providing insight for the workplace (under what circumstances). We found
that practitioners who use the SOQ to assess the work environment could also provide their
clients with implications regarding problem-solving styles. Here, the notion of mixed perceptions
on climate plays a great role, certainly on dimensions such as Freedom, Idea-Support, Trust
and Openness, and Debate. The possibility exists that the variance within one of these four
dimensions could be derived from a group of mixed style preferences within the organization or
a team (e.g. theoretically, 50% of the group will have no problem with the amount of Freedom
that is currently present in the organization, while 50% will have a problem and would like to
perceive more or less Freedom in their current climate). Adding style to the mix could help
clarify the mixed climate results.
Workplace climate and problem-solving style relate. The climate for creativity and
innovation is a distinct concept and can be assessed independently from individual differences.
Problem-solving style is another independent construct that is also capable of assessment. This

Page|21
study illustrates that there are interactions between style (people) and climate (place).
Practitioners who use both VIEW and SOQ in their interventions will have more information for
their clients to consider while giving feedback. By linking the outcomes of this study on
differences within the OC and the WD dimensions and the four climate dimensions with more
impact on best- and worst-case climates, deeper insights and interpretations will become more
apparent for them. By analyzing the style preferences of the organization or team and the
outcomes of the climate assessment, some target areas can be more easily identified; therefore
the outcomes of an intervention can have a more significant impact.
Some recent research and practical experience has indicated that leadership’s most
important role in obtaining innovation is in creating the climate for creativity (Akkermans,
Isaksen & Isaksen, 2008; Prokesch, 2009). This study underlines the importance of the leader’s
role and provides some concrete suggestions for how they may create more innovative
workplaces.
Since this was a unique and initial study, more research needs to be done in order to
generalize the outcomes. Furthermore it would be beneficial if the participants completed the
long form SOQ, which includes the three open-ended questions, instead of the short form. In
this way, one would be able to examine both more reliable quantitative and deeper qualitative
results into the nature of the relationships between style and climate to gain more meaningful
insights.

References
Aerts, W. (2008). Exploring the relationships between problem-solving style and climates in best and worst-case work experiences, Department of Business and Economics, Vlekho, Brussels, Unpublished Master’s Thesis. Akkermans, H. J., Isaksen, S. G., & Isaksen, E. J. (2008). Leadership for innovation: A global climate survey. Orchard Park, NY: The Creativity Research Unit of the Creative Problem Solving Group, Inc. Barsh, J., Capozzi, M. M., & Davidson, J. (2008). Leadership and innovation. The McKinsey Quarterly, 1, 37-47. Choi, J. N. (2004). Person–environment fit and creative behavior: Differential impacts of supplies–values and demands–abilities versions of fit. Human Relations, 57, 531-552. Clapp, R. G., & Kirton, M. J. (1994). The relationship between cognitive style and psychological climate, Some comments on the article by Isaksen and Kaufmann. Studia Psychologica, 36, 129-134. Davis, T. (2000). Global innovation and growth survey. London, UK: PricewaterhouseCoopers. Edwards, J. R. (1994). The study of congruence in organizational behavior research: Critique and proposed alternative. Organizational Behavior and Human Decision Processes, 58, 51-100. Ekvall, G. (1996). Organizational climate for creativity and innovation. European Journal of Work and Organizational Psychology, 5, 105-123. Grivas, C. C. (1996). An exploratory investigation of the relationship of cognitive style with perceptions of creative climate, State University College at Buffalo: Center for Studies in Creativity, Unpublished master’s thesis. Gustafson, S. B., & Mumford, M. D. (1995). Personal style and person-environment fit: A pattern approach. Journal of Vocational Behavior, 46, 163-188. Harter, J. K. Schmidt, F. L., & Keyes, C. L. (2002). Well-being in the workplace and its relationship to business outcome: A review of the Gallup Studies, In C. L. Keyes & J. Haidt (Eds.), Flourishing: The positive person and the good life (pp. 205-224). Washington, DC: American Psychological Association. Hunter, S. T., Bedell, K. E., & Mumford, M. D. (2007). Climate for creativity: A quantitative review, Creativity Research Journal, 19 (1), 69-90. Isaksen, S. G. (2009). Exploring the relationship between problem-solving style and creative psychological climate. In J. Funke, P. Meusburger, & E. Wunder (Eds.). Knowledge and space: Milieus of creativity (pp. 169-188). Dordrecht: Springer. Isaksen, S. G., & Akkermans, H. J. (2007). An introduction to climate. Orchard Park, NY: The Creative Problem Solving Group, Inc. Isaksen, S. G., & Ekvall, G. (2007). Assessing the context for change: A technical manual for the Situational Outlook Questionnaire® - Enhancing performance of organizations, leaders and teams for over 50 years (2nd ed.). Orchard Park, NY: The Creative Problem Solving Group, Inc. Isaksen, S. G., & Geuens, D. (2007). Exploring the relationships between an assessment of problem solving style and creative problem solving. The Korean Journal of Thinking and Problem Solving, 17(1), 5-27. Isaksen, S. G., & Kaufmann, G., (1990). Adaptors and innovators: Different perceptions of the psychological climate for creativity. Studia Psychologica, 32, 129-141.

Page | 23
Isaksen, S. G. & Lauer, K. J., (1999). Relationship between cognitive style and individual psychological climate: Reflections on a previous study. Studia Psychologica, 41, 177-192. Isaksen, S. G., Lauer, K. J., Ekvall, G., & Britz, A. (2001). Perceptions of the best and worst climates for creativity: Preliminary validation evidence for the Situational Outlook Questionnaire. Creativity Research Journal, 13, 171-184. Isaksen, S. G., & Tidd, J. (2006). Meeting the innovation challenge: Leadership for transformation and growth. Chichester, UK: Wiley. Kirton, M. J. (2003). Adaption-innovation in the context of diversity and change, London, Routledge. Lauer, K. J., & Isaksen, S. G. (2001). Managing the organizational climate for creativity and change: What you should be considering, in: L. van Geoffen, H. van der Meer & T. Rickards (Eds.), Fit for the future: Proceedings of the sixth European conference on creativity and innovation (pp. 132-141), Enschede: Twente University Press. Livingstone, L. P., Nelson, D. L., & Barr, S. H. (1997). Person-environment fit and creativity: An examination of supply-value and demand ability versions of fit. Journal of Management, 23, 119-146. Prokesch, S. (2009). How GE teaches teams to lead change. Harvard Business Review, 87, 99-106. Puccio, G. J., Talbot, R. J., & Joniak, A. J. (2000). Examining creative performance in the workplace through a person-environment fit model. Journal of Creative Behavior, 34, 227-247. Puccio, G. J., Wheeler, R. A., & Cassandro, V. J. (2004). Reactions to Creative Problem Solving training: Does cognitive style make a difference? Journal of Creative Behavior, 38, 192-216. Selby, E. C., Treffinger, D. J., & Isaksen, S. G. (2007). VIEW: An assessment of problem solving style – Technical Manual (2nd ed), Sarasota, Center for Creative Learning. Selby, E. C., Treffinger, D. J., Isaksen, S. G., & Lauer, K. J. (2004). Defining and assessing problem-solving style: Design and development of a new tool, Journal of Creative Behavior, 38, 221-243 Sekiguchi, T. (2004). Toward a dynamic perspective of person-environment fit. Osaka Keidai Ronshu, 55, 177-190. Stevens, G., Burley, J., & Divine, R. (1999). Creativity + business discipline = higher profits faster from new product development. Journal of Product Innovation Management, 16, 455-468. Tidd, J., Bessant, J., & Pavitt, K. (2005). Managing innovation: Integrating technological, market and organizational change (3rd ed.). Chichester, UK: Wiley. Treffinger, D. J. (2009). VIEW: An assessment of problem solving style – 2008 technical update. Sarasota, FL: Center for Creative Learning. Treffinger, D. J., Selby, E. C., & Isaksen, S. G. (2008). Understanding individual problem-solving style: A key to learning and applying Creative Problem Solving. Learning and Individual Differences, 18, 390-401. Van Vianen, A. E. M. (2000). Person-organization fit: The match between newcomers’ and recruiters’ perceptions for organizational cultures. Personnel Psychology, 53, 113-149. Werbel, J. D., & DeMarie, S. M. (2005). Aligning strategic human resource management and person-environment fit. Human Resource Management Review, 15, 247-262. Werbel, J. D., & Johnson, D. (2001). The use of person-group fit for employment selection: A missing link in person-environment fit. Human Resource Management, 40, 227-240.

Page | 24
Research Fellows of the Creativity Research Unit
Dr. Göran Ekvall Professor Emeritus, Industrial and Organizational Psychology
University of Lund – Sweden -
Dr. Scott G. Isaksen President, The Creative Problem Solving Group, Inc. – USA
Professor, The Norwegian School of Management -
Dr. Geir Kaufmann Professor, Organizational Psychology and Leadership
Norwegian School of Management – Norway -
Dr. Kenneth W. McCluskey Associate Professor of Education University of Winnipeg – Canada
-
Dr. Ruth B. Noller Distinguished Service Professor of Creative Studies, Emeritus
Center for Studies in Creativity – USA (In Memoriam)
-
Dr. Guido Prato-Previde Founder
Decathalon Consulting – Italy -
Dr. Edwin C. Selby Adjunct Professor, Graduate School of Education
Fordham University – USA -
Dr. Donald J. Treffinger President, Center for Creative Learning
Professor Emeritus, Center for Studies in Creativity – USA