crowdsourcing for search evaluation - school of computer science
TRANSCRIPT

SIGIR 2010 Geneva, Switzerland
July 19-23, 2010
Crowdsourcing for Search Evaluation
Workshop of the 33rd
Annual International ACM SIGIR Conference
on Research and Development in Information Retrieval
Organised by Vitor Carvalho, Microsoft Bing
Matthew Lease, University of Texas at Austin Emine Yilmaz, Microsoft Research

Crowdsourcing for Search Evaluation (CSE 2010)
A Workshop at the 33rd Annual International ACM SIGIR Conference on
Research and Development in Information Retrieval
Geneva, Switzerland – July 23, 2010
Organized by
Vitor Carvalho, Microsoft Bing
Matthew Lease, University of Texas at Austin
Emine Yilmaz, Microsoft Research
Program Committee
Eugene Agichtein, Emory University
Ben Carterette, University of Delaware
Charlie Clarke, University of Waterloo
Gareth Jones, Dublin City University
Michael Kaisser. University of Edinburgh
Jaap Kamps, University of Amsterdam
Gabriella Kazai, Microsoft Research
Mounia Lalmas, University of Glasgow
Winter Mason, Yahoo! Research
Don Metzler, University of Southern California
Stefano Mizzaro, University of Udine
Gheorghe Muresan, Microsoft Bing
Iadh Ounis, University of Glasgow
Mark Sanderson, University of Sheffield
Mark Smucker, University of Waterloo
Siddharth Suri, Yahoo! Research
Fang Xu, Saarland University
Proceedings of the SIGIR 2010 Workshop on Crowdsourcing for Search Evaluation (CSE 2010) - July 23, 2010 2

Crowdsourcing for Search Evaluation (CSE 2010)
Workshop Proceedings
Crowdsourcing for Affective Annotation of Video: Development of a Viewer-reported Boredom Corpus.
Mohammad Soleymani and Martha Larson. …………….………………………………………. 4
Crowdsourcing Preference Judgments for Evaluation of Music Similarity Tasks.
Julian Urbano, Jorge Morato, Monica Marrero and Diego Martin. ..............……………………. 9
Ensuring quality in crowdsourced search relevance evaluation.
John Le, Andy Edmonds, Vaughn Hester and Lukas Biewald. ...……………………………… 17
An Analysis of Assessor Behavior in Crowdsourced Preference Judgments.
Dongqing Zhu and Ben Carterette. …………………………………………………………….. 21
Logging the Search Self-Efficacy of Amazon Mechanical Turkers. ..………………………….. 27
Henry Feild, Rosie Jones, Robert C. Miller, Rajeev Nayak, Elizabeth F. Churchill and Emre Velipasaoglu
Crowdsourcing a News Query Classification Dataset.
Richard M. C. McCreadie, Craig Macdonald and Iadh Ounis. ……………………………….... 31
Detecting Uninteresting Content in Text Streams.
Omar Alonso, Chad Carson, David Gerster, Xiang Ji, Shubha U. Nabar. .................................. 39
Proceedings of the SIGIR 2010 Workshop on Crowdsourcing for Search Evaluation (CSE 2010) - July 23, 2010 3
Crowdsourcing for Affective Annotation of Video:
Development of a Viewer-reported Boredom Corpus
Mohammad Soleymani Computer Vision and Multimedia Laboratory
University of Geneva
Martha Larson Multimedia Information Retrieval Lab
Delft University of Technology
ABSTRACT Predictions of viewer affective response to video are an important source of information that can be used to enhance the performance of multimedia retrieval and recommendation systems. The devel-opment of algorithms for robust prediction of viewer affective response requires corpora accompanied by appropriate ground truth. We report on the development a new corpus to be used to evaluate algorithms for prediction of viewer-reported boredom. We make use of crowdsourcing in order to address two shortcom-ings of previous affective video corpora: small number of annota-tors and gap between annotators and target viewer group. We describe the design of the Mechanical Turk setup that we used to generate the affective annotations for the corpus. We discuss spe-cific issues that arose and how we resolve them and then present an analysis of the annotations collected. The paper closes with a list of recommended practices for the collection of self-reported affective annotations using crowdsourcing techniques and an out-look on future work.
Categories and Subject Descriptors H.3.1 [Information Storage and Retrieval]: Content Analysis and Indexing
General Terms Algorithms, Measurement, Design, Experimentation,
Keywords Affective computing, multimedia benchmarking, internet video
1. INTRODUCTION Developing video processing algorithms capable of predicting viewer boredom requires suitable corpora for development and testing. This paper reports on the development of the MediaEval 2010 Affect Task Corpus for boredom prediction of Internet video. Standard limitations on viewer affective response annota-tion are overcome by making use of crowdsourcing. Using Me-chanical Turk (MTurk), we rapidly gather self-reported boredom scores from a large user group that is demographically diverse and also represents our target population (Internet video viewers).
Ultimately, our boredom-prediction algorithms will be used to improve multimedia retrieval and recommendation. Relatively little research has investigated topic-independent factors that con-tribute to the relevance of multimedia content to the user informa-tion need. In the area of text-based retrieval, incorporation of quality information has been used to improve results, as, for ex-ample in [14]. Our larger goal is to extend such techniques to multimedia information retrieval and recommendation.
We focus on viewer affective response, and in particular on bore-dom, as a reflection of perceived video quality. We are also inter-ested in variation of affective response among viewers that will help us to develop recommendation and retrieval systems that incorporate information on personal preference.
Our starting point is a set of specifications that our corpus was required to fulfill. The annotation process needed to control as much as possible for extraneous effects, such as reaction of the annotators to the topic of the video, tiredness or underlying mood of the annotators. We wanted to have a relatively large number of annotators for each video, but also a certain number of annotators who annotated the whole collection. We wanted to avoid violating copyright law in order to be able to license our corpus for public use the MediaEval 2010 benchmark. Finally, we had limited re-sources to invest in corpus development. After a short section on to related work, this paper describes the MediaEval 2010 Affect Task and then the MTurk task that was used to annotate the Affect Task Corpus. We discuss how we fulfilled the specifications of the corpus and met other challenges arising along the way. Fi-nally, we present an analysis of the collected annotations and we distill our experience into a list of recommendations for using crowdsourcing for viewer affective response annotation.
2. RELATED WORK There are two notable efforts by psychologists to create standard affective video corpora for emotional studies [8][6]. In both stud-ies, movie excerpts extracted from Hollywood movies were used. Because only the time codes of the excerpts and their description are published, the datasets are difficult to re-use. Moreover, use of copyrighted video material depends on the regulations of individ-ual countries. In general, it cannot be shared between researchers or shown to the public for purposes of conducting experiments, gathering annotations or demonstrating systems. The research in the field of multimedia content analysis for affec-tive understanding of videos lacks significant user studies and only relies on the feedback from limited number of participants [5][10][13]. Multimedia corpora with affective annotations make it possible to investigate interesting research questions and de-velop useful algorithms, but are time-consuming to generate. The number of participants contributing annotations is a significant factor that limits their usefulness. We describe the 2009 Affect Task in the VideoCLEF (now called MediaEval) benchmark [5] as an example of such a case. The 2009 Affect Task involved narrative peak detection – automatic identification of points within a video at which users experience a heightened sense of dramatic tension. Narrative peak detection is related to highlights detection in sports videos cf. [2], but cannot rely on the presence of audience reaction (the roar of the crowd) in the video. The 2009 Affect Task corpus contains 45 eight-minute videos that are
Copyright is held by the author/owner(s). Workshop on Crowdsourcing for Search Evaluation SIGIR’10, July 19–23, 2010, Geneva, Switzerland.
Proceedings of the SIGIR 2010 Workshop on Crowdsourcing for Search Evaluation (CSE 2010) - July 23, 2010 4
documentaries on the visual arts, hosted by a well-known Amster-dam professor, Henk van Os. Three assessors watched each video in its entirety and marked the start and end points of the segments that they identified to be the top three narrative peaks. The annota-tion is necessary time-consuming. In order to understand peaks against the background of their narrative context, it is necessary to watch the video as a whole. Generally, annotating the videos took 2-3 times the run-time of the video. In the 45 videos, there were only 22 peaks that all three assessors identified as among the top three. Although the agreement might have been higher, had we examined a longer top-N list, the annotations generated strongly suggest that there is a personal component determining where viewers perceive narrative peaks. In order to gain a deeper under-standing of this component it would be necessary to have more than 3 assessors watch the entire video set. Moreover, assessors reported a familiarity effect. Their sensitivity to narrative peaks developed the more of Prof. van Os’ material that they watched. The familiarity effect seemed to be related to a better understand-ing and appreciate the narrator’s style, e.g., sense of humor. More annotations are necessary in order to understand better how affec-tive response changes or develops with familiarity.
To our knowledge there has been only one effort to gather online affective annotations with a large set of participants [11]. During that study more than 1300 annotations from 40 volunteer partici-pants were gathered for 155 video excerpts extracted from Holly-wood movies. Although the number of participants is among the largest population size in its kind, the dataset is not redistributable due to the copyright violations issues. The participants who usu-ally volunteer to participate in academic studies are from a certain age group and limited geographical locations or cultural back-ground. In the current dataset, both copyright problems and popu-lation size and diversity are addressed.
3. AFFECT PREDICTION TASK The MediaEval 2010 Affect Task involves automatically predict-ing the level of user boredom for a video. The Affect Task is running in 2010 within the MediaEval benchmarking initiative [5], which offers tasks to the multimedia research community that help consolidate and synchronize research effort and concentrate it on forward-looking, challenging research areas. Research groups build systems that predict affect and test them on the Af-fect Task Corpus. For the purpose of the Affect Task and related research, we adopt a fairly simply definition of boredom. We take boredom to be related to the viewer's sense of keeping focus of attention and to be related to the apparent passage of time [4]. We understand boredom to be a negative feeling associated with viewer perceptions of the viewer-perceived quality (viewer ap-peal) of the video being low. We are interested in studying two aspects of viewer-reported boredom. First, the 2010 Affect Task corpus will be used to inves-tigate universal aspects of user boredom. On the Internet, certain videos emerge as being more popular than others (as reflected by views, links or viewer-contributed ratings). This popularity can be taken as a reflection of an underlying consensus of an inherent quality of the video, i.e., in some sense it is “worth watching.” If this quality is at least in part related to the video content, then we believe that it is worthwhile investigating the extent to which it can be predicted using automatic methods. We know that Internet videos differ not only in subject material, but also with respect to other factors. Among the factors that influence the creation proc-ess of a video are: novelty of videographic style, resources avail-
able, production skill of the film maker and amount of care in-vested in planning and realization.
Second, the corpus will be used to investigate personal variation. Affective reaction to video content differs widely from viewer to viewer. We are interested in determining if it is possible to build user-specific models for prediction of self-reported boredom. Additionally, we would like to investigate whether affective reac-tion can be modeled at a level between the universal and the per-sonal. In other words, we would like to determine whether predic-tive models can be built for certain groups of users.
The dataset selected for the corpus is Bill’s Travel Project, a travelogue series called "My Name is Bill" created by the film maker Bill Bowles (http://www.mynameisbill.com/). The series consists of 126 videos between two to five minutes in length. This data was chosen since it represents the sort of multimedia content that has risen to prominence on the Internet. Bill’s travelogue follows the format of a daily episode related to his activities and as such is comparable to “video journals” that are created by many video bloggers. We believe that results of investigations on Bill’s Travel Project will extend to other video bloggers, and also perhaps to other sorts of semi-professional user generated video content. Because we are interested in aspects of the data that are independent of topic and genre, we were careful to choose data related to the same topic (travel) and genre (video blog). Further, the fact the video predominantly involves only a single speaker (Bill) helps to abstract away from personal preferences of the viewer that might be based on the gender or appearance of the central figure(s) rather than on the content of the video. The focus is kept squarely on pacing, narrative devices and manner of pres-entation. Finally, since the video is not Creative Commons li-censed we contacted Bill, who kindly granted us permission to use it for the Affect Task. In this way, we were able to develop the corpus without concerns about copyright violations.
The relationship of the 2010 boredom prediction task to the 2009 narrative peak predication task also requires a note of explanation. We would like to investigate if there is a relationship between affective reactions within the video (i.e., their magnitude and tim-ing) to the overall appeal of the video for users. As a result of the experience with the creation of the 2009 corpus, in 2010, we will be investigating possible “familiarity” effects in viewer-reported affective response. In other words, we are interested in whether there is a trend in viewer’s reactions to Bill’s videos as they grow more acquainted with his material. Specifically, we would like to know whether viewers report increasing boredom as they watch more of Bill’s material or whether we find evidence a “fan of Bill” effect, namely, that they report less boredom with growing familiarity with Bill, his journey and his personal style. The participants carrying out the Affect Task in MediaEval 2010 are various international research groups involved in multimedia information retrieval and affective computing research. The groups are free to design their own algorithms for automatic bore-dom detection and can make use of features derived from the vis-ual channel, audio channel or speech recognition transcripts. Speech recognition transcripts were supplied with the corpus and generously donated to the benchmark by ICSI and SRI Intera-tional [12]. Groups approach the tasks in multiple ways. Gener-ally, they first formulate an idea of what properties of the video contribute to user perceived boredom and then build a model that captures these properties. In a typical model, the focus is on prop-erties of the video related to production, for example the cutting or audio mixing, but they also include a wide range of factors.
Proceedings of the SIGIR 2010 Workshop on Crowdsourcing for Search Evaluation (CSE 2010) - July 23, 2010 5

We were also able to formulate theories about the sources of pos-sible viewer interest in the video by interviewing Bill Bowles concerning the strategies that he makes use of as a film maker to add interest to his videos. In particular he mentioned, that he keeps shots short (< 1 minute), he varies the rhythm of the shot length, he doesn't make the videos any longer than necessary and he varies between close ups and distance shots. Finally, and per-haps presenting the biggest challenge to capture in an automatic algorithm, he attempts to continuously surprise his viewer with a novel approach to his subject material. For example, he switches his role (e.g., between observer, interviewer and commentator) and uses word play and comic devices. Bill also mentioned that how he makes the video is affected by his own mood at the time. This point is not relevant for the Affect Task, which deals with viewer-reported mood, but is an interesting vista for future work.
4. DESIGN OF CROWDSOURCING TASK We approached the design of the MTurk task by first reading crowdsourcing literature, for example [3], searching for informa-tion the Internet on the subject of using MTurk and reflecting on our past experience collecting annotations online. We decided for a two-step approach. The first step was the pilot that consisting of a single micro-task (HIT) involving one video would be used for the purposes of recruiting and screening MTurk users (referred to as “workers”). The second step was the main task and involved a series of 125 micro-tasks, one for each of the remaining videos in the collection. We discuss each step in turn.
4.1 Pilot The pilot contained three components corresponding to qualities that we required of our recruits. The first section contained ques-tions about the personal background (age, gender, cultural back-ground). We made judicious use of MTurk’s ability to block workers from certain countries in order to maintain the overall balance. The second section contained questions about viewing habits: we asked the workers if they were regular viewers of In-ternet video. The third section tested their seriousness by asking them to watch the video, select a word that reflected their mood at the moment and also write a summary. The summary constituted a "verifiable" question, recommended by [3]. The summary offered several possibilities for verification. Its length and whether it con-tained well-formulated sentences gave us an indication of the level of care that the worker devoted to the HIT. Also, the descrip-tive content indicated to us whether the worker had watched the entire video, or merely the beginning. We also checked serious-ness by ensuring that workers did not complete the HIT faster than the run-time length time of the video. A final question en-quired if they were interested in further HITs of the same sort. We were interested in deflecting the attention of the worker away from the main goal of the task, i.e., collecting affective annota-tions. For this reason we placed the summary box prominently in the HIT. We also believe it was an effective distracter since it was the element of the HIT that was the longest and most intellectually challenging to answer.
4.2 Main Task We chose the workers for the main task from the participants of the pilot by considering the quality of their description and choos-ing a diverse group of respondents. The qualification was only granted to the participants who answered all the questions com-pletely. We invited workers to do the main study by sending them an invitation e-mail invitation via their ID number on the MTurk platform. The e-mail informed the users that we had assigned
them our MTurk qualification. Use of a qualification serves to limit those workers that carry out the HIT to invitees only. Each HIT in the main study consisted of three parts. In the first part, the workers were asked to specify the time of day, which gave us a rough estimate of how tired they were. Also the workers were asked to choose a mood word from a drop down list that best ex-pressed their reaction to an imaginary word, such as those used in [7]. The mood words were pleased, helpless, energetic, nervous, passive, relaxed, and aggressive. These questions gave us an es-timate of their underlying mood. In the second part, they were asked to watch the video and give some simple responses. They were asked to choose the word that best represented the emotion they felt while watching a video from a second list of emotion words in the drop down list. The emotion list contained Ekman six basic emotions [1], namely, sadness, joy, anger, fear, surprise, and disgust, in addition to boredom, anxiety, neutral and amuse-ment, which cover the entire affective space, as defined by the conventional dimensions of valence and arousal [9]. The emotion and mood word lists contained different items, which were in-tended to disassociate them for the user. Next, they were asked to provide a rating specifying how boring they found the video and how much they liked the video, both on a nine point scale. Then, they were asked to estimate how long the video lasted. Here, we had to rely on their full cooperation in order not to cheat and look at the video timeline. Finally, they were asked to describe the contents of the video in one sentence. We emphasized the descrip-tion of the video rather than the mood word or the rating, in order to conceal the main purpose of the HIT. Quality control of the responses was carried out by checking the description of the video and also by ensuring that the time that they took to complete the HIT was reasonable.
4.3 Issues and solutions The most important issue with the MTurk task arose because we needed each worker to finish all 125 videos. In the invitation to the main task we named the total sum workers would earn by completing all 125 HITs as an enticement, but we also mentioned that we would only accept the HITs if they completed all 125. Approximately half of the workers we invited to do the task re-sponded positively to this arrangement. Many wrote personal e-mails with specific questions or asking for assurances from our side that we would accept their HITs. The personal communica-tion with the workers was a key factor in collecting the annota-tions. We were surprised at workers’ willingness to give up their anonymity by writing us e-mails and also revealing to us their worker IDs. Many also mentioned their base location in their e-mails. This evolving openness gave us more confidence in trusting the original demographic information collected in the pilot, since by revealing their identities the workers showed themselves will-ing to provide us with the opportunity to verify at least some of the personal information provided in the pilot. We noticed that many workers were not willing to make the commitment to do all 125 HITs. Building trust was very important. It quickly became clear that some workers were reluctant to risk starting on the se-ries out of fear that we would reject their hits and ruin their repu-tations on MTurk. Receiving the payment seemed to be secon-dary. We noticed that at least one person really appreciated that completing the whole series gave them a substantial goal to work for and that the sum that they earned could then be used to buy a particular book. Personal communication via e-mail was essential when the video server that we were using developed a technical problem and the videos did not load. We fielded many e-mails on
Proceedings of the SIGIR 2010 Workshop on Crowdsourcing for Search Evaluation (CSE 2010) - July 23, 2010 6

those days, and on the whole were surprised at the patience that and cooperative spirit of the workers in the face of the problems.
5. ANALYSIS OF ANNOTATIONS Our pilot HIT was initially published for 100 workers and finished in the course of a single weekend. We re-published the HIT for more workers when we realized we needed more people in order to have an adequate number of task participants. Only workers with the HIT acceptance rate of 95% or higher were admitted to participate in the pilot HIT. In total, 169 workers completed our pilot HIT, 87.6% of which reported that they watch videos on the Internet. We took this response as confirmation that our tasks participants were close to the target audience of our research. Out of 169 workers, 105 were male and 62 were female and two did not report their gender. Their age average was 30.48 with the standard deviation of 12.39. The workers in the pilot HITs identi-fied themselves by different cultural backgrounds from North American, Caucasian to South and East Asian. Having such a group of participants with a high diversity in their cultural back-ground would have been difficult without using the crowd-sourcing platforms. Of the 169 pilot participants, 162 had interest in carrying out similar HITs. Of the interested group, the 79 workers were determined to be qualified and assigned our task-specific qualification within MTurk. This means only 46.7% of the workers who did the pilot HIT were able to answer all the questions and had the profile we required for the main task.
In total, 32 workers have participated and also annotated more than 60 of the 125 videos in the main task HIT series. This means only 18.9% of the participants in the pilot and 39.0% of the quali-fied participants committed to do the main task HIT series seri-ously. Of this group of 32 serious participants, 18 are male and 11 are female with ages ranging from 18 to 81 (average 34.9; stan-dard deviation 14.7).
To evaluate the quality of the annotations, the time spent for each HIT was compared to the video length. In 81.8% of the completed HITs the working duration for each HIT was longer than the video length. This means that in 18.2% of the HITs the workers did not follow the instructions. Also, their reported perception of the time is invalid. This shows the importance of having workers with the right qualifications and trustworthy pool of workers in annotation or evaluation hits. Even after the pilot task and disqualifying 60% of the first participants, 16 participants or 39.0% of our final pool did not watch at least 10% of their submitted HITs’ videos com-pletely. Rejecting those HITs reduced the number of workers who carried out more than 60 videos in the main series of HIT to 25 from which 17 are male and 8 are female ages ranging from 19 to 59 (average 33.9, standard deviation 11.8).
Three questions were asked about each video to assess the level of boredom. First, how boring the video was on nine-point scale from the most to the least boring. Second, how much the user liked the video on the nine-point scale and third how long the video was. Boredom was shown to have on average a strong nega-tive correlation, ρ= - 0.86 with liking scores. The time perception did not show a significant correlation for all users and it varied from 0.4 down to -0.27. Although positive correlation was ex-pected from boredom scores and the perception of time seven participants’ boredom scores have negative correlation with the time perception.
The correlation between the order of watching the videos for each participant and the boredom ratings was also examined. No posi-tive linear correlation was found between the order and boredom
score. This means that watching more videos did not increase the level of boredom and in contrary for 2 of participant it decreased their boredom. Additionally, the correlation between the video length and boredom scores was investigated. No positive correla-tion was found between the boredom scores and videos’ duration. We can conclude that the lengthy videos are not necessarily per-ceived as more boring than the shorter videos.
To measure the inter-annotator agreement, the Spearman correla-tion between participants’ pairwise boredom scores was com-puted. The average significant correlation coefficient was very low ρ = 0.05. There were even cases where the correlation coeffi-cients were negative, which shows complete disagreement be-tween participants. For each worker we then grouped videos into two rough categories, above and below the mean boredom score of that worker. We computed the average pair-wise Cohen’s kappa for these categories and here found only slight agreement (κ = 0.01). We also compared agreement on the emotion words workers associated with viewers. Here, again Cohen’s kappa indi-cated only slight agreement (κ = 0.07). The strong correlations suggest that it is indeed important to investigate personalized ap-proaches to affective response prediction.
Figure 1 The mean absolute difference (on the vertical axis) versus number of participants. One of the key questions in such studies is the number for partici-pants for a significant result. In order to address this question, the situation of having fewer participants was simulated and the mean absolute difference with the final average was computed (see Fig-ure 1). In this simulation, participants were randomly drawn and added to the pool of participants with the pool size of one to the maximum possible size of 25. This random simulation was per-formed 1000 times and the mean absolute difference between the participants’ average annotations and the average scores of all 25 participants were computed. As it can be seen in Figure 1, with 10 participants the difference between the averaged scores is smaller than 5% of the possible range, 0.05×8= 0.4. Although the gain of having more participants gets smaller after 10, in the real world applications a larger pool of annotators is always a valuable asset for information retrieval and recommendation studies.
6. BEST PRACTICES Crowdsourcing using MTurk provided an effective means of col-lecting the viewer affective response annotations needed to create a corpus to be used in the development of automatic prediction of
Proceedings of the SIGIR 2010 Workshop on Crowdsourcing for Search Evaluation (CSE 2010) - July 23, 2010 7
viewer reported boredom. Our experience can be distilled into a list of recommendations that will enable the development of addi-tional such corpora to proceed smoothly.
• The MTurk task should consist of two steps, the first identifies appropriate workers to invite and the second involves the gen-eration of the annotations.
• For a long HIT series tasks, invite five times as many workers to do the pilot as you wish to have complete the main task.
• Expect that up to 75% of the workers you will invite will not be interested in carrying out a HIT that has the feeling of tradi-tional "work", i.e., requires a long time commitment. In the invi-tation e-mail, specify a date by which they need to reply so that you can disinvite them and invite others if necessary.
• Consider breaking down long HIT series into packages and giving a small reward to the completion of individual packages in addition to a larger bonus for completing the whole series in order to prevent fatigue of the workers.
• As suggested by [3], we use multiple methods to verify that the workers are doing a good job on the question, for example, as a verifiable question and also check time.
• Include dummy questions to veil the purpose of the HIT. Establishing trust with workers is a key factor in getting the same users to do a long HIT series. It is important to remember that they are concerned about maintaining their reputation on MTurk. Trust can be built by accepting HITs as quickly as possible and also being prompt with the bonuses. We suggest making the pay-ment for each HIT very small and then accepting the HIT rela-tively indiscriminately. Workers who complete the entire series and do it well then receive the bonus. Effort invested in establish-ing trust accumulates since users exchange information on re-questers on Turker Nation (http://www.turkernation.com/) con-cerning the HITs and the bonuses rewarded.
Our future work will concentrate on scaling up to be able to col-lect annotations for a larger set of videos with less intervention on our part. We now realize that for long HIT series, such as the ones necessary for a single person to annotate many videos, MTurk does not “run by itself”, but rather requires constant attention in terms of contacting workers and answering e-mail. In the future, we plan to be highly active during the initial stage of our main task to help speed up the process. In the future, we would like to develop a more complex pilot HIT that provides a more effective recruitment tool for workers. We are considering including more videos in the pilot HIT, or implementing a two-stage pilot, involv-ing two HITs. A key factor here might be to use the MTurk API more extensively to achieve a higher level of automation. Ad-dressing a practical problem, we would also like to work on de-veloping a mechanism to deal elegantly with the failure of exter-nal resources. If a video fails to load, then the HIT is lost for the worker and needs to be manually reinitiated. The speed of the response depends on the amount of the reward offered. We paid viewers US $37.50 for watching 125 short videos. Paying less might have been possible. It would be worthwhile to determine if we can offer lower rewards without compromising quality. We also would like to investigate the bias introduced into the system by the fact that a certain type of personality is attracted to MTurk tasks and in particular to our Affect Task. Finally, we would like to move from boredom detection to other affective annotations. Our experiences with the MediaEval 2010 Affect Task Corpus suggest that crowdsouring is a valuable technique to collect affec-tive annotations and we have just begun to tap its potential.
7. ACKNOWLEDGMENTS The research leading to these results has received funding from the EC FP7 under grant agreement n° 216444 (PetaMedia Net-work of Excellence). The work of the first author is supported in part by the Swiss National Science Foundation.
8. REFERENCES [1] P. Ekman et al., Universals and cultural differences in the
judgments of facial expressions of emotion, Journal of Per-sonality and Social Psychology, 53(4):712-717, 1987.
[2] A. Hanjalic and L.-Q. Xu. A selective video content repre-sentation and modeling. IEEE Transactions on Multimedia, 7(1):143-154, 2005.
[3] A. Kittur, E.H. Chi, and B. Suh. Crowdsourcing user studies with Mechanical Turk. In Proceedings of the 26th Annual ACM conference on Human Factors in Computing Systems (CHI'08), 453-456, 2008.
[4] J.D. Laird. Feelings: The Perception of Self. Oxford Univer-sity Press, 2007.
[5] M. Larson, E. Newman, G.J.F. and Jones, G. J. F. Overview of Video-CLEF 2009: New perspectives on speech-based multimedia content enrichment. In C.Peters et al. (eds.), Mul-tilingual Information Access Evaluation, Vol. II Multimedia Experiments, Springer, to appear 2010.
[6] P. Philippot. Inducing and assessing differentiated emotion-feeling states in the laboratory. Cognition & Emotion 7(2):171-193, 1993.
[7] M. Quirin, M. Kazen, and J. Kuhl, J. When nonsense sounds happy or helpless: The Implicit Positive and Negative Affect Test (IPANAT). Journal of Personality and Social Psychol-ogy, 97:500-516, 2009.
[8] J. Rottenberg, R.D.Ray and J.J.Gross. Emotion elicitation using films. In A.Coan and J.J.B.Allen (eds.), The Handbook of Emotion Elicitation and Assessment. Oxford University Press, 2007.
[9] J. Russell and A. Mehrabian. Evidence for a 3-factor theory of emotions, Journal of Research in Personality, 11(3):273-294, 1977.
[10] M. Soleymani, G. Chanel, J.J.M. Kierkels, and T. Pun. Af-fective characterization of movie scenes based on content analysis and physiological changes. International Journal of Semantic Computing, 3(2):235-254, 2009.
[11] M. Soleymani, J. Davis, and T. Pun. A collaborative person-alized affective video retrieval system. In Proceedings of the International Conference on Affective Computing & Intelli-gent Interaction (ACII 2009), 588-589.
[12] A. Stolcke, X. Anguera, K. Boakye, Ö Çetin, A. Janin, M. Magimai-Doss, C. Wooters, and J. Zheng. In Steifelhagen et al. (eds.) The SRI-ICSI Spring 2007 Meeting and Lecture Recognition System. LNCS vol. 4625, Springer, 450-463, 2008.
[13] H.L. Wang and L.F. Cheong Affective understanding in film, IEEE Transactions on Circuits and Systems for Video Tech-nology, 16(6):689-704, 2006.
[14] X. Zhu and S. Gauch. Incorporating quality metrics in cen-tralized/distributed information retrieval on the World Wide Web. In Proceedings of the 23rd Annual International ACM SIGIR Conference on Research and Development in Informa-tion Retrieval (SIGIR '00), 288-295, 2000.
Proceedings of the SIGIR 2010 Workshop on Crowdsourcing for Search Evaluation (CSE 2010) - July 23, 2010 8

Crowdsourcing Preference Judgments for Evaluation of Music Similarity Tasks
Julián Urbano, Jorge Morato, Mónica Marrero and Diego Martín
University Carlos III of Madrid Department of Computer Science
Leganés, Madrid, Spain
{jurbano, jmorato, mmarrero, dmandres}@inf.uc3m.es
ABSTRACT
Music similarity tasks, where musical pieces similar to a query
should be retrieved, are quite troublesome to evaluate. Ground truths based on partially ordered lists were developed to cope with problems regarding relevance judgment, but they require such man-power to generate that the official MIREX evaluations had to turn over more affordable alternatives. However, in house evaluations keep using these partially ordered lists because they are still more suitable for similarity tasks. In this paper we propose a cheaper alternative to generate these lists by using
crowdsourcing to gather music preference judgments. We show that our method produces lists very similar to the original ones, while dealing with some defects of the original methodology. With this study, we show that crowdsourcing is a perfectly viable alternative to evaluate music systems without the need for experts.
Categories and Subject Descriptors H.5.1 [Multimedia Information Systems]: Evaluation/ methodology; H.3.3 [Information Search and Retrieval]; H.3.4 [Systems and Software]: Performance evaluation (efficiency and effectiveness).
Keywords
Crowdsourcing, relevance judgment, music information retrieval.
1. INTRODUCTION Evaluation experiments are the corner stone of Information Retrieval (IR), as they are the main research tool for scientifically comparing retrieval techniques and figuring out which improve
the state-of-the-art and which do not [1]. These evaluations have traditionally followed the so called Cranfield paradigm, where the set of relevance judgments are the most important and most expensive part of test collections. Usually, these ground truths take the form of a matrix containing information, assessed by humans, about the relevance of each document for each information need.
Music Information Retrieval (MIR) is a relatively young
discipline, and this kind of evaluations has been somewhat scarce until the arrival of the Music Information Retrieval Evaluation eXchange (MIREX) in 2005, as a first attempt to perform TREC-like evaluations in the musical domain [2]. Evaluation in Music IR differs greatly from evaluation in Text IR, mainly with regard to the construction and maintenance of test collections [3]. On the one hand, MIR has been traditionally biased toward classical music because of many issues concerning copyright laws and
royalties. On the other hand, many retrieval tasks defined for the music domain are inherently more complex to evaluate. This is
the case of the Symbolic Melodic Similarity (SMS) and Audio Music Similarity (AMS) tasks, as defined in MIREX, in which systems are asked to retrieve a ranked list of musical pieces deemed similar to some piece of music acting as query. In particular, it is unclear how to assess the relevance of a document
for a given query.
Ground truths are traditionally based on a fixed scale of relevance with levels such as “relevant” and “not relevant”. However, several studies indicate that relevance is continuous for information needs involving music similarity [4][5][6]. Single melodic changes such as moving a note up or down in pitch, or extending or shortening its duration, are not perceived to change the overall melody. However, the relationship with the original
melody is gradually weaker as more changes are applied to it. There are no common criteria to split the degree of relevance into different levels, so assessments based on a fixed scale do not seem suitable as it would be difficult to draw the line between levels.
Major advancements in this matter were achieved by Typke et al. by the beginning of 2005. They developed a methodology to create ground truths where the relevance of a document does not belong to any prefixed scale, but it is rather implied by its relative
position in a partially ordered list [5]. These lists have ordered groups of candidates assumed to be equally relevant to the query, so that the earlier a group appears in the list, the more relevant its documents are (see Figure 2). That way, the ideal retrieval technique should return these documents in order of relevance, and permutations within the same group are not penalized. With this new form of ground truth, there does not need to be any prefixed scale of relevance, and human assessors only need to be sure that any pair of documents is well ordered according to their
similarity to the query.
In the first edition of MIREX, a Symbolic Melodic Similarity task was run using ground truths based on partially ordered lists [7]. These lists have also been widely accepted by the research community as the most comprehensive means to evaluate new retrieval techniques, such as [8][9][10] and [11]. However, they have proven to be expensive to generate, which forced the MIREX evaluations to move to traditional level-based relevance
judgments in the 2006, 2007 and 2010 editions.
In this paper we propose a modification of the original methodology followed to create these lists, by means of crowdsourced preference judgments that allow the candidate documents to arrange and aggregate themselves into relevance groups [12]. We implemented it with Amazon Mechanical Turk (AMT), as an attempt to explore its suitability for music tasks. Indeed, we show that our method generates lists very similar to
the original ones with far less cost and no need for music experts. Copyright is held by the author/owner(s).
SIGIR’10, July 19–23, 2010, Geneva, Switzerland.
Proceedings of the SIGIR 2010 Workshop on Crowdsourcing for Search Evaluation (CSE 2010) - July 23, 2010 9

The rest of the paper is organized as follows. In Section 2 we describe the issues that motivate our work, reviewing the current methodology followed to create these ground truths and some of its problems. Section 3 presents our alternative methodology, and Section 4 shows how we implemented it with Mechanical Turk. In
Section 5 we summarize the results obtained, showing that our alternative leads to very good results in terms of cost, consistency and agreement between assessors. The paper finishes in Section 6 with conclusions and lines for future research.
2. MOTIVATION Ground truths based on partially ordered lists have two main drawbacks: they are hard to replicate and expensive to generate in terms of man-power, and they have several inconsistency problems where equivalent music pieces are judged differently.
2.1 Expensiveness In the original lists created by Typke et al. [5], 35 music experts were needed for 2 hours to generate the ground truth for just 11 queries, and only 11 of them were able to work on all queries.
This exceeds MIREX's human resources for a single task [2]. In part because of this restriction, the official MIREX evaluations were forced to move to traditional level-based relevance judgments from 2006 on. Two different scales were used: BROAD and FINE. The BROAD scale contained 3 levels: not similar (NS), somewhat similar (SS) and very similar (VS). The FINE scale was numerical, ranging from 0.0 to 10.0 with one decimal digit (note that this is not different than an ordinal scale
with 101 levels). This choice of relevance scales presented several issues concerning assessor agreement, and the line between levels was again found to be very diffuse [6][2].
Figure 1. Distribution of FINE scores across BROAD levels, for the SMS and AMS tasks in 2006 and 2007. Taken from [2].
Figure 1 shows the distribution of FINE scores given across BROAD levels, both for the 2006 and 2007 editions of MIREX’s Symbolic Melodic Similarity and Audio Music Similarity tasks. It
can be seen that there was a great overlap between the FINE scores corresponding to the SS BROAD level and the NS and VS levels, as well as a large number of outliers, indicating that assessors were not very consistent when facing two different relevance scales. This is, again, evidence on the difficulty that relevance assessment posses for these tasks.
2.2 Inconsistencies Due to Ranking The original method to generate ground truths based on partially ordered lists, as described in [5], was used with the RISM A/II collection [13], which at the time contained about half a million musical incipits (short excerpts from the beginning of musical
pieces). The methodology followed may be divided in four steps: filtering, ranking, arranging and aggregating:
1. Filtering. Several musical features were calculated for each document (musical incipits in this case). Filtering by these features and using several melodic similarity algorithms, the initial collection was gradually narrowed down to about 50 candidate incipits per query.
2. Ranking. For each query, 35 experts ranked its candidates in terms of melodic similarity to the corresponding query. Incipits that seemed very different from the query could be left unranked. A limit of 2 hours per expert was imposed, so not every expert could work on every list.
3. Arrangement. Incipits were arranged according to the median of their rank sample, using the means to solve possible ties. Therefore, the incipits that on average were ranked higher by the experts appeared with higher ranks in the ordered list.
4. Aggregation. Incipits with similar rank samples were aggregated within a group, so as to indicate that they were similarly relevant to the query. Thus, a retrieval system could return them with their ranks swapped and still be considered correct. The Mann-Whitney U test (also known as Wilcoxon Rank-Sum test) [14] was used between the rank samples of two incipits to tell whether they were similar or not.
Several works have noted the presence of odd results in these lists [5][10][15]. The experts were instructed to disregard changes that do not alter the actual music perception, such as changes in clef or in key and time signatures. To compare, the textual counterpart of
these changes would be something like changing the language of the text or replace some words with their synonyms, which do not change the actual contents but only its form [8]. Experts were also told to consider two incipits as equally relevant if one of them was part of the other.
Group 1 (same as the query): 190.011.224-1.1.1
Group 2
A: 310.000.728-1.16.1
Group 3
B: 700.000.686-1.1.1
Group 4
C: 453.001.547-1.1.3
D: 450.034.972-1.1.1
E: 451.509.336-1.1.1
Figure 2. Excerpt of the ground truth for query 190.011.224-1.1.1.
However, incipits with such irrelevant differences ended up in different groups. For example, the second result (incipit A) expected for query 190.011.224-1.1.1 is like the query itself, but with the key signature changed (see Figure 2). Ignoring the leading silence, no listener would be able to tell the difference between this melody and the query, because they are the same
note by note. Nonetheless, it was judged as less similar when compared to the query itself. The third result (incipit B) is like the second one, but with a change both in clef and key signature (see Figure 2). Again, these two melodies should be considered as equally similar to the query, but they ended up in different groups of relevance anyway.
Proceedings of the SIGIR 2010 Workshop on Crowdsourcing for Search Evaluation (CSE 2010) - July 23, 2010 10

Group 1 (same as the query)
600.053.475-1.1.1
Group 2
A: 550.018.151-1.1.1
Group 3
B: 600.500.641-1.1.1
Figure 3. Excerpt of the ground truth for query 600.053.475-1.1.1
The top three results for query 600.053.475-1.1.1 show similar problems (see Figure 3). The third one (incipit B) is just like the second one (incipit A) but with 3 notes missing at the end, and this one is just like the first one (the query itself) with 3 notes missing at the end too. These three results ended up in different groups of relevance according to the rankings they were given by the experts, when they were instructed to judge them as equally
similar. There are also cases were incipits with virtually the same changes in the melody were placed in different groups, as with the second and third results for query 000.111.706-1.1.1.
Despite they are no longer used in MIREX, ground truths based on partially ordered lists are still used to date for the evaluation of new retrieval techniques, as they are clearly more suitable for similarity tasks than traditional assessments. However, as no new lists have been generated since 2005, in house evaluations may be overfitting to this single collection. Therefore, we strongly believe that partially ordered lists should be brought back to the official MIREX evaluations so that new test collections are adopted. For
that, further research should focus on new and more affordable ways to generate them. In a previous work we analyzed and dealt with inconsistencies originated in the latter steps of the methodology to generate the lists [15], and in this paper we deal with inconsistencies originated by the experts from the very beginning, while cheapening the whole process.
It has been hypothesized that with sufficient description of the information need sought by these tasks, any reasonable person should concur as to whether a given returned item satisfies the intention of the query (in our case, whether a returned piece is similar to another one). This is called the “reasonable person
assumption” [3]. We decided to use Amazon Mechanical Turk to examine whether crowdsourcing alternatives can be used to gather accurate relevance judgments without the need for experts [16][17]. Doing so, we review the reasonable person assumption, evaluate crowdsourcing for a task very different from the usual ones focused on text, and study whether this alternative is doable and produces reliable results to evaluate music similarity tasks with partially ordered lists.
3. ALTERNATIVE METHODOLOGY In a first attempt to bring partially ordered lists back to the evaluation of music similarity tasks, we explored alternatives in the current methodology to make the process more affordable and work toward large-scale evaluations, while trying to minimize
inconsistencies. We opted for two changes: allow assessors to indicate that certain incipits are equally relevant, and have them perform simple preference judgments [12].
3.1 Equally Relevant Incipits Reviewing the inconsistencies due to ranking (see Section 2.2), the reason seems to be clear: experts were not allowed to judge two incipits as equally relevant in the first place, they were only
able to rank one above or below the other. Under this condition, for the example list in Figure 2 they will rank first the same incipit as the query, as it is identical. Even though incipit A is perceived as the same melody, they will surely rank it below and not above, as it has a change in key signature, even if they are told to ignore
it. Same thing happens with incipit B (a change in clef). One would expect the experts to randomly assign opposite orders to such pairs of incipits for their medians to average out, but that is hardly the case. For instance, half the experts might rank incipit A as the second most similar, and incipit B right after, while the other half might rank them the other way around. However, any person looking at the staves would rank A before B because its image is more similar to the query’s. In the example of Figure 3,
the three incipits should be equally ranked, but the experts ranked them according to the number of notes missed. In no case should we expect such incipits to have similar ranks if we do not allow the experts to give them similar ranks in the first place.
The immediate solution to this problem would be to allow experts to specify groups of relevance from the very beginning. Also, the query-candidate pairs could be given as audio files to listen instead of as images of the corresponding staves. That way, the irrelevant changes indicated in Section 2.2 would be undistinguishable to the assessors, besides other misleading changes such as different arrangements of the stems of a group of eighth notes (quavers).
3.2 Preference Judgments It is also important to note that the experts had to judge all candidates at once for each query. That is, they had to return a list of relevant candidates ranked by similarity. It is normal to guess that they would have more problems to set up a new incipit as the list grows: the first two candidates can be easily ordered, but once the list has, say, 15 incipits, it is clearly more difficult to decide
where between those 15 should the next one be placed. This phenomenon could clearly accelerate assessor fatigue, and it was already observed for the level-based relevance judgments gathered in the 2006 and 2007 editions of MIREX [2][6]. Some experts had to go back and re-judge some documents, surely after they were presented a candidate which made them realize that a previous judgment was not very congruent. This agrees with the overlapping of FINE scores across BROAD levels shown in
Figure 1, and indicates, again, that the relevance for music similarity is rather continuous and the differences between levels is certainly not clear.
To alleviate this problem we propose to ask for preference judgments of the form "incipit A is more similar to the query than incipit B" (A < B for short). Carterette et al. studied the use of preference judgments for text IR and showed that they are better than traditional level-based judgments, both in terms of agreement and time to answer [12]. However, in their study they decided not to allow an option like "A and B are equally relevant" (A = B for short), which we must permit in our case to form groups (see
Section 4.1). Using preference judgments, we could implement a modified QuickSort algorithm to make the incipits auto-organize themselves following the preferences of the assessors. Such an algorithm has been shown to reduce dramatically the number of judgments needed to fully order a list, as the rate of growth in the number of comparisons is O(n·lg n), much slower than the O(n2) growth rate of all comparisons [12]. Table 1 shows an example.
In the first iteration of the algorithm, we choose the last document as the pivot, which is F in this case. The assessors would have to
Proceedings of the SIGIR 2010 Workshop on Crowdsourcing for Search Evaluation (CSE 2010) - July 23, 2010 11

answer preference judgments between F and each of the other documents. In this case, every document was judged as more similar, except for G, which was judged equally similar (or dissimilar). Therefore, a new segment appears to the left of F with all the candidates judged more relevant, and G is set up in the
same group as F. For the second iteration, in the rightmost segment no judgment is needed because F and G were already compared, and B would be the pivot for the leftmost segment. Incipits A and C are judged similar to B, but D and E are judged as less similar, so they are set up in a segment to the right of B. At the end, there are 3 ordered groups of relevance formed with preference judgments. Note that not all the 21 judgments were needed to arrange and aggregate every incipit (e.g. G is only compared with F).
Table 1. Example of self-organized partially ordered list. Pivots for each
segment appear in bold face. Documents that have been pivots already
appear underlined.
Iteration Segments Preference Judgments
1 C, D, E, A, G, B, F C<F, D<F, E<F, A<F, G=F, B<F
2 C, D, E, A, B , F, G C=B, D>B, E>B, A=B
3 B, C, A , D, E , F, G C=A, D=E
4 (A, B, C), (E, D), (F, G) -
With preference judgments, the sample of rankings given to each candidate is less variable than with the original method. Whenever a candidate is preferred over another one, it would be given a rank
of 1 and -1 otherwise. In case it was judged equally similar, a rank of 0 would be added to its sample. With the original methodology, on the other hand, the ranks given to an incipit could range from 1 to well beyond 20, which increases the variance of the samples. Note that, with our scheme, the two samples of rankings given to each pair of documents are the opposite and therefore have the same variance. Signed Mann-Whitney U tests can be used again to decide whether two rank samples are different or not. Because
the samples are less variable, the effect size is larger, which increases the statistical power of the test and makes it more likely for it to find a true difference where there is one. As a consequence, fewer assessors are needed overall.
4. CROWDSOURCING PREFERENCES The use of a crowdsourcing platform seems very appropriate for our purposes. If the reasonable person assumption holds, we could use non experts to generate a ground truth like these. Because we
no longer show the image of the staves, but offer an audio file instead, no music expertise is needed. We have also seen how to use preference judgments to generate partially ordered lists instead of having assessors rank all candidates at once. Therefore, the whole process can be divided into very small and simple tasks where one incipit has to be preferred over the other, which seems perfectly doable for any non expert. Also, the number of judgments between pairs of documents can be smaller, and given that we use non experts, the overall cost should be much less.
We are not aware of any work examining the feasibility of music related tasks with crowdsourcing platforms like Amazon
Mechanical Turk (AMT), so we decided to use it for our experiments. AMT has been widely used before for tasks related to Text IR evaluation. HITs (each of the single tasks assigned to a worker) have traditionally used the English language, but it has been shown recently that workers can also work in other languages such as Spanish [18]. Other multimedia tasks, such as image tagging, have also been proved to be feasible with crowdsourcing [19].
4.1 HIT Design The use of preference judgments is prone to have a very simple
HIT design (see Figure 4). We asked workers to listen to the query or “original melody”, as we called it. Then, they had to listen to what we called “variations”, that is, the two incipits to compare. Next, they were asked what variation was more similar to the original melody, allowing 3 options: A is more similar, B is more similar, and they are either equally similar or dissimilar. We indicated them that if one melody was part of another one, they had to be considered equally similar, so as to comply with the
original guidelines. As optional questions, they were asked for their musical background, if any, and for comments or suggestions to give us some feedback.
Figure 4. Example of HIT for music preference judgment.
The evaluation collection used in MIREX 2005 (Eval05 for short) had about 550 short incipits in MIDI format, which we transformed to MP3 files as they are easier to play in a standard web browser. The average duration was 6 seconds, ranging from 1 to 57 seconds. However, many incipits start with rests (see query and incipit C in Figure 2), which would make workers lose a lot of time. Therefore, we trimmed the leading and tailing silence, which
resulted in durations from 1 to 26 seconds, with an average of 4 seconds. With this cuts, the average time needed to listen to the 3 files in a HIT at least once was 13 seconds, ranging from 4 to 24 seconds. This decision agrees with the initial guidelines that were given to the experts, as two incipits should be considered equally relevant despite one of them having leading or tailing rests (i.e. one would be just part of the other). We uploaded all these trimmed MP3 files to a private web server, as well as the source
of a very simple Flash player to play the queries and candidate incipits. Therefore, our HIT template was designed to display the MP3 players and stream the audio files from our server.
We created a batch of HITs for each of the iterations calculated with our methodology, and paid every answer with 2 cents of dollar (plus half a cent for Amazon’s fee). After downloading the results and analyzing them, we calculated the next preference judgments to perform and uploaded a new batch to AMT,
Proceedings of the SIGIR 2010 Workshop on Crowdsourcing for Search Evaluation (CSE 2010) - July 23, 2010 12

corresponding to the next iteration. Whenever all pairs of incipits within the same segment had been judged, we considered that segment closed, and whenever all segments were closed, the list was completed.
4.2 Threats to Validity The initial order of candidates in the first iteration and the choice
of the pivot element could clearly affect the results. If the pivot chosen were the query itself, most of the incipits would be judged less similar and go to the right segment, which would not provide much information. Therefore, we randomized the initial order of incipits in the first iteration. Moreover, we always chose the last incipit of a segment as the current pivot, and for the next iteration this element would be the first one of the equally-similar segment. See for example incipit A from iterations 3 to 4, in Table 1.
Workers could be tempted to stop listening to the original melody (i.e. the query) after a few HITs have been answered. Then, whenever the query changes as they start judging for another list,
all answers given from that point on would be plainly useless. Even within the list of a single query, there will usually be several pivots, each of which will be compared with different incipits. Likewise, if the pivot is always kept as the first or second variation, workers could stop listening to them and just listen to the other variation, which would again make every answer useless after the pivot is changed when a new segment begins to be evaluated. See for example the 3rd iteration in Table 1, where both
A and E are pivots. Again, we addressed this problem by randomizing the HITs: not all HITs from the same queries were presented together, and pivots were sometimes the variation A and some others the variation B. The HIT design explicitly warned the workers about this randomization anyway.
We also have to deal with carelessness of the workers. In first trials of our experiment we found that sometimes they judged some incipits as more similar to the query than the query itself, in cases where it was clearly different. We tried to alleviate this problem by accepting workers only with a 95% or higher rate of acceptance, and by using a sufficiently large number of answers
per HIT. We chose to ask for 10 different workers per HIT, which we considered enough given that fewer answers are needed to begin with (see Section 3.2). This decision was also successfully taken by Alonso et al. when crowdsourcing relevance judgments for TREC documents [17]. We also found 2 workers that always gave the “Equal” answer in exactly 8 seconds. It seemed clear to us that we were dealing with some kind of robot, so we directly blocked them from our experiments and re-assigned their HITs.
5. RESULTS The 11 lists in the Eval05 collection account for a total of 119 candidate documents to judge for relevance, ranging from 4 to 23 documents per query. In order to complete the judgments, we had
to submit 8 batches to Mechanical Turk, each corresponding to an iteration of the self-organizing algorithm. These batches were submitted from April 14th to April 17th, with some time taken between iterations to semi-automatically calculate what documents to compare for the next batch.
5.1 Summary of Submissions The 119 candidate documents in the 11 lists sum up 740 pairs of candidates (i.e. the O(n2) case), We only needed to judge a total of 281 (38%) pairs of documents to completely organize the 11 lists, which account for a total of 2810 preference judgments by the workers (see Table 2). A total of 79 unique workers performed those judgments, with an average of 55% of the workers in an iteration having worked in previous ones. It took for them almost 22 seconds in median to submit the judgments, although this time
reflects only how long they took to complete the assignment since they accepted it, rather than since it was displayed to them. Summing up the time to complete all iterations, the 2810 judgments took about a day and a half.
For all the 2810 judgments the total cost of generating the ground truths was about 70 dollars. The original lists needed 35 music experts for 2 hours, and during this time only 11 of them were able to work on the 11 queries. This accounts for roughly 70 hours of the time of one single expert, which is about twice as much as we needed using non-expert workers from Mechanical Turk.
5.2 Worker Feedback and Music Background Out of the 79 unique workers, 23 gave us feedback. Four of them reported very positive comments about the HITs, one asked for more money and two reported problems loading one of the MP3 files for two HITs (the other workers did not report to have such problems for the same HITs).
Five workers explicitly indicated not to have any musical background, but fourteen did. Six of them had formal musical education, mainly in college and high school, while nine reported to have been practitioners for several years. Nine played an instrument, mainly piano, and six others performed in a choir.
5.3 Agreement between Workers and Experts For each of the 281 HITs (i.e. pairs of candidates) we have 10 judgments made by workers. We calculated their inter-agreement score for each HIT as follows. Consider the 45 pairs of answers given for a single HIT, adding 2 points to the score if the two workers agreed (complete agreement); adding 1 point if one judged “Equal” and the other judged either document (partial agreement), and adding nothing if they judged both documents (no agreement). The perfect agreement would sum up 90 points,
so we divided the score obtained by 90 to normalize from 0 (no agreement at all) to 1 (perfect agreement). Table 2 shows the mean agreement for every HIT judged in each iteration. We can
Table 2. Summary of batches submitted to Mechanical Turk.
Iteration Pairs judged Unique workers Previous
workers (%)
Median time per
judgment (seconds)
Time to
completion
Inter-agreement
per pair Cost (US $)
1 107 32 - 26 13h 29m 0.656 26.75
2 83 20 4 (20%) 14 3h 2m 0.822 20.75
3 51 15 11 (73%) 19 3h 0.72 12.75
4 19 17 10 (59%) 30 10h 3m 0.644 4.75
5 10 16 11 (69%) 21 3h 29m 0.663 2.5
6 5 12 8 (67%) 24 2h 48m 0.732 1.25
7 4 11 7 (64%) 15.5 1h 21m 0.569 1
8 2 11 4 (36%) 24.5 28m 0.506 0.5
Total/Avg. 281 79 55% 21.75 37h 40m 0.664 70.25
Proceedings of the SIGIR 2010 Workshop on Crowdsourcing for Search Evaluation (CSE 2010) - July 23, 2010 13

see that the agreement among workers is very high, ranging from 0.506 to 0.822, averaging to 0.664.
It is also interesting to measure the agreement between the workers of AMT and the music experts that ranked the original lists. We compared each of the resulting 281 preference judgments (aggregating the 10 corresponding answers of the workers, see Section 3.2) with the rankings given by the experts,
inferring their preference judgments as well with signed Mann-Whitney U tests over the rankings they gave to each document. Table 3 shows the results.
Table 3. Agreement between workers (columns) and experts (rows) for
aggregated judgments. Percentages are calculated over the row total.
Workers
Less (56) Equal (110) Greater (115)
Ex
per
ts
Less (91) 38 (42%) 37 (41%) 16 (18%)
Equal (55) 11 (20%) 31 (56%) 13 (24%)
Greater (135) 7 (5%) 42 (31%) 86 (64%)
Not surprisingly, the agreements are fairly high. There were 155 (55%) cases of complete agreement, 102 (36%) cases of partial agreement and only 23 (8%) cases of no agreement at all. Computing a global score as before, rewarding complete agreements with 2 points and partial agreements with 1 point, the agreement between workers and experts results in 0.735. These
figures serve as empirical verification of the reasonable person assumption, indicating that the notion of musical similarity, though not formally formulated, appears to be common between experts and non experts.
Table 4. Agreement among single workers with no music background and
experts. Percentages are calculated over the row total.
Workers with no music background
Less (81) Equal (97) Greater (193)
Ex
per
ts
Less (100) 55 (55%) 27 (27%) 18 (18%)
Equal (92) 16 (17%) 35 (38%) 41 (45%)
Greater (179) 10 (6%) 35 (20%) 134 (75%)
We also calculated the agreement between the original experts and the 5 workers that explicitly reported no music background, the 14 that reported to have some background, and the other 60 that did not answer. The workers that reported no background
fully agreed with the experts 60% of the times, partially agreed 32% and did not agree in 8% of the judgments, which accounts for a total agreement of 0.764 (see Table 4).
Table 5. Agreement among single workers with music background and
experts. Percentages are calculated over the row total.
Workers with music background
Less (70) Equal (80) Greater (116)
Ex
per
ts
Less (70) 45 (64%) 18 (26%) 7 (10%)
Equal (67) 15 (22%) 32 (48%) 20 (30%)
Greater (129) 10 (8%) 30 (23%) 89 (69%)
When considering the workers that reported some background, the agreement rises to 0.78, having 62% cases of total agreement with the experts, 31% of partial agreement and 6% of no agreement at all (see Table 5).
Table 6. Agreement among single workers with unknown music
background and experts. Percentages are calculated over the row total.
Workers with unknown background
Less (426) Equal (1230) Greater (517)
Ex
per
ts
Less (390) 218 (56%) 152 (39%) 20 (5%)
Equal (941) 127 (13%) 707 (75%) 107 (11%)
Greater (842) 81 (10%) 371 (44%) 390 (46%)
The 60 workers that did not report anything about musical background had an agreement score with the experts of 0.777, with 60% of total agreement, 34% of answers with partial agreement and 5% of no agreement (see Table 6). All these results support again the reasonable person assumption, as very similar
agreement scores can be found not only between groups of workers, but also between single workers with and without music background. As a consequence, they also support the use of crowdsourcing platforms to gather music relevance judgments.
5.4 Comparison with the Original Lists Given the high agreement scores obtained by the workers of Mechanical Turk, one would expect to obtain lists very similar to the original ones generated with experts. To measure the
similarity, we considered the original lists as ground truths and the crowdsourced lists as if they were the results of a system, evaluating the ADR score that would be obtained in a real evaluation [20]. Moreover, we considered the original lists as aggregated with the Any-1 function we proposed in [15], as the resulting lists proved to be the most consistent. Finally, and to compare lists in both directions, we considered the crowdsourced lists as ground truths and the original ones as results.
There is one important detail to note, though: both the ground truth list and the results list have groups of relevance, but the latter will be considered as a fully ranked list (i.e. a sequence
without groups) when computing the ADR score. For example,
consider the list L1= (A, B, C), (D, E) is taken as ground truth
and the list L2= (A, B), (D, E, C) as results. When evaluating L2,
it would be considered as A, B, D, E, C , which results in an
ADR score of 0.933 because at position 3 the document retrieved is D, when C was expected. However, C and D were judged as equally relevant. These cases depend directly on the order the documents were randomly arranged at the beginning. If the results
list were L3= (A, B), (C, D, E) , which is equivalent to L2, the
ADR score would be 1. To account for the random effect of the initial arrangement, we generated 1000 random versions of the lists obtained with Mechanical Turk, by randomly permuting the order of documents within the same group. The results of the comparisons appear in Table 7, with the minimum, mean and
maximum ADR scores obtained for the 1000 random sets of equivalent lists.
Table 7. Comparison between the original lists and the lists crowdsourced,
in terms of average ADR score. Columns represent lists acting as ground
truth, rows for lists acting as results. The numbers between square
brackets indicate the minimum and maximum scores.
Ground truth
All-2 Any-1 MTurk
Res
ult
s
All-2 1 0.872
[0.830-0.927]
0.824
[0.785-0.872]
Any-1 1 1 0.850
[0.828-0.873]
MTurk 0.943
[0.915-0.977]
0.840
[0.812-0.881] 1
When compared to the original lists generated by Typke et al. (i.e. All-2), the crowdsourced lists performed exceptionally well, with very high ADR scores across the 11 queries, between 0.915 and 0.977. As expected, the Any-1 lists reduce the scores because they are more restrictive than the All-2 alternatives, although the averages are still high over 0.812. When using the crowdsourced lists as ground truth, the average across the 11 queries is still high. The Any-1 lists would obtain a higher score than the All-2,
showing that the crowdsourced lists are also more restrictive than
Proceedings of the SIGIR 2010 Workshop on Crowdsourcing for Search Evaluation (CSE 2010) - July 23, 2010 14

the original ones. These results confirm that the lists generated with Mechanical Turk workers are, in fact, very similar to the ones generated by experts, as already anticipated by the high agreement scores.
5.5 Judgments Consistency We examined the crowdsourced lists to check whether inconsistent results like the ones described in Section 2.2 did still appear or not, and in several cases they did not. For example, the first two incipits in Figure 3 ended up in the same group of relevance, at the top of the list, as did the first three incipits in Figure 2. Other lists, like the one for query 600.054.278-1.1.1, also showed such correct variations.
5.6 MIREX 2005 Results Revisited The question is whether those small variations in the lists would affect the evaluation of real systems or not [1]. We re-evaluated the 7 systems that participated in the MIREX 2005 Symbolic Melodic Similarity task with the crowdsourced ground truth lists. In addition, we also re-evaluated and compared the Splines method we proposed in [8] (see Table 8). Again, we compare also with the Any-1 version of the original lists.
Table 8. ADR results of the systems that participated in MIREX 2005
with the original and crowdsourced lists. GAM = Grachten, Arcos and
Mántaras; O = Orio; US = Uitdenbogerd and Suyoto; TWV = Typke,
Wiering and Veltkamp; L(P3) = Lemström (P3), L(DP) = Lemström (DP);
FM = Frieler and Müllensiefen. Best scores appear in bold face. * for significant difference at the 0.05 level and
** at the 0.01 level.
Splines GAM O US TWV L(P3) L(DP) FM
All-2 0.71 0.66 0.65 0.642 0.571 0.558 0.543 0.518
Any-1 0.646* 0.583 0.593
* 0.594
* 0.556 0.515 0.494
* 0.483
*
MTurk 0.6**
0.574* 0.572
* 0.546
** 0.517
* 0.51
* 0.467
* 0.462
*
As with the Any-1 version, the crowdsourced lists seem to be more restrictive than the original All-2. All systems get reductions in average ADR score between 9% and 15%, and all these differences were statistically significant according to 1-tailed
paired Mann-Whitney U tests. The important result is, however, that the ranking of systems is exactly the same as with the original lists. That is, the crowdsourced lists ranked the 7 systems in terms of average ADR score as the original lists did. This, again, supports the use of our methodology for evaluation of music similarity tasks.
6. CONCLUSIONS AND FUTURE WORK Ground truths based on partially ordered lists represented a big leap towards the scientific evaluation of music similarity tasks. They have been widely accepted by the community, but their use in the MIREX evaluations was interrupted mainly because of their expensiveness in terms of man-power and need for music experts.
In this paper we have proposed a modification of the methodology followed to generate these lists, and we have implemented it with Amazon Mechanical Turk to gather music relevance judgments, showing that crowdsourcing platforms are viable alternatives for
the evaluation of music retrieval systems. This allowed us to review the reasonable person assumption, which may lead to more affordable and large-scale evaluations without the need for music experts. We provided empirical evidence supporting it, showing high agreement scores between workers and experts.
Our methodology has several advantages. Fewer assessors are needed to judge, so more queries can be evaluated with the same man-power. Preference judgments are easier to perform, and the number of actual judgments made by the assessors is far less,
because they do not need to assess where between several candidates should a new incipit be placed. Allowing judgments of the form "A and B are equally similar", we avoid inconsistency problems where incipits equal for all purposes were judged differently. Offering the incipits as audio files instead of images,
also helps in this matter, and it seems to avoid the necessity of having experts.
Further research should focus on the sorting algorithm used to organize incipits. The choice of good pivots is essential, and more empirical research should focus on the nature of music similarity to assess whether it is transitive or even symmetrical. That is, if A is preferred over B and B is preferred over C, will A be preferred over C? And if A is preferred over B for query C, will C be preferred over B for query A? So far it has been assumed that these properties hold, but such assumption should be subject of further experimental studies. In case it were valid, more work in
the line of Carterette et al. should be carried out to minimize the number of judgments needed to sort all candidates and find true differences in the performance of retrieval systems [21].
7. ACKNOWLEDGMENTS We would like to thank Omar Alonso for his thoughtful comments
on Mechanical Turk and the paper itself. We also thank Carlos Gómez, Rainer Typke, and the IMIRSEL group, especially Stephen Downie and Mert Bay, for providing us with the MIREX 2005 evaluation data.
8. REFERENCES [1] Voorhees, E.M. The Philosophy of Information Retrieval
Evaluation. Workshop of the Cross-Language Evaluation Forum (2002), 355-370.
[2] Downie, J.S., Ehmann, A.F., et al. The Music Information Retrieval Evaluation eXchange: Some Observations and Insights. Advances in Music Information Retrieval. W.R. Zbigniew and A.A. Wieczorkowska. Springer. 2010. 93-115.
[3] Downie, J.S. The Scientific Evaluation of Music Information Retrieval Systems: Foundations and Future. Computer Music Journal. 28, 2 (2004), 12-23.
[4] Selfridge-Field, E. Conceptual and Representational Issues in Melodic Comparison. Computing in Musicology. 11, (1998), 3-64.
[5] Typke, R., den Hoed, M., et al. A Ground Truth for Half a Million Musical Incipits. Journal of Digital Information Management. 3, 1 (2005), 34-39.
[6] Jones, M.C., Downie, J.S., et al. Human Similarity Judgments: Implications for the Design of Formal Evaluations. International Conference on Music Information Retrieval (2007), 539-542.
[7] Downie, J.S., West, K., et al. The 2005 Music Information Retrieval Evaluation Exchange (MIREX 2005): Preliminary Overview. International Conference on Music Information Retrieval (2005), 320-323.
[8] Urbano, J., Lloréns, J., et al. Using the Shape of Music to Compute the Similarity between Symbolic Musical Pieces. International Symposium on Computer Music Modeling and Retrieval (2010), 385-396.
[9] Pinto, A. and Tagliolato, P. A Generalized Graph-Spectral Approach to Melodic Modeling and Retrieval. International ACM Conference on Multimedia Information Retrieval (2008), 89-96.
[10] Hanna, P., Ferraro, P., et al. On Optimizing the Editing Algorithms for Evaluating Similarity Between Monophonic Musical Sequences. Journal of New Music Research. 36, 4 (2007), 267-279.
Proceedings of the SIGIR 2010 Workshop on Crowdsourcing for Search Evaluation (CSE 2010) - July 23, 2010 15

[11] Grachten, M., Arcos, J., et al. A Case Based Approach to Expressivity-Aware Tempo Transformation. Machine Learning. 65, 2 (2006), 411-437.
[12] Carterette, B., Bennett, P.N., et al. Here or There: Preference Judgments for Relevance. European Conference on Information Retrieval (2008), 16-27.
[13] Saur Verlag, K. Répertoire International des Sources Musicales (RISM). Serie A/II, Manuscrits Musicaux après 1600.
[14] Mann, H.B. and Whitney, D.R. On a Test of Whether One of Two Random Variables is Stochastically Larger than the Other. Annals of Mathematical Statistics. 18, 1 (1947), 50-60.
[15] Urbano, J., Marrero, M., et al. Improving the Generation of Ground Truths based on Partially Ordered Lists. International Society for Music Information Retrieval Conference (2010).
[16] Alonso, O., Rose, D.E., et al. Crowdsourcing for Relevance Evaluation. ACM SIGIR Forum.
[17] Alonso, O. and Mizzaro, S. Can We Get Rid of TREC assessors? Using Mechanical Turk for Relevance Assessment. SIGIR Workshop on the Future of IR Evaluation (2009), 15-16.
[18] Alonso, O. and Baeza-Yates, R. An Analysis of Crowdsourcing Relevance Assessments in Spanish. Spanish Conference on Information Retrieval (2010).
[19] Nowak, S. and Rüger, S. How Reliable are Annotations via Crowdsourcing? A Study about Inter-annotator Agreement for Multi-label Image Annotation. International ACM Conference on Multimedia Information Retrieval (2010), 557-566.
[20] Typke, R., Veltkamp, R.C., et al. A Measure for Evaluating Retrieval Techniques based on Partially Ordered Ground Truth Lists. IEEE International Conference on Multimedia and Expo (2006), 1793-1796.
[21] Carterette, B. and Allan, J. Incremental Test Collections. ACM International Conference on Information and Knowledge Management (2005), 680-687.
Proceedings of the SIGIR 2010 Workshop on Crowdsourcing for Search Evaluation (CSE 2010) - July 23, 2010 16
Ensuring quality in crowdsourced search relevanceevaluation: The effects of training question distribution
John Le1, Andy Edmonds2, Vaughn Hester1, Lukas Biewald1
1CrowdFlower455 Valencia Street
San Francisco, CA, 94103+1-415-621-2343
{john, vaughn, lukas}@crowdflower.com
2eBay Search Science2065 Hamilton AvenueSan Jose, CA, 95125
ABSTRACTThe use of crowdsourcing platforms like Amazon Mechan-ical Turk for evaluating the relevance of search results hasbecome an effective strategy that yields results quickly andinexpensively. One approach to ensure quality of workerjudgments is to include an initial training period and sub-sequent sporadic insertion of predefined gold standard data(training data). Workers are notified or rejected when theyerr on the training data, and trust and quality ratings are ad-justed accordingly. In this paper, we assess how this type ofdynamic learning environment can affect the workers’ resultsin a search relevance evaluation task completed on AmazonMechanical Turk. Specifically, we show how the distribu-tion of training set answers impacts training of workers andaggregate quality of worker results. We conclude that in arelevance categorization task, a uniform distribution of la-bels across training data labels produces optimal peaks in 1)individual worker precision and 2) majority voting aggregateresult accuracy.
Categories and Subject DescriptorsH.3.3 [Information Storage and Retrieval]: Systemsand Software–performance evaluation
General TermsPerformance, Design, Experimentation, Human Factors.
KeywordsCrowdsourcing, search relevance evaluation, quality control.
1. INTRODUCTIONCrowdsourcing is the use of large, distributed groups of
people to complete microtasks or to generate information.Because traditional search relevance evaluation requiring ex-pert assessment is a lengthy process [2, 3, 5], crowdsourc-ing has gained traction as an alternative solution for thesetypes of high volume tasks [2, 1]. In some cases, crowdsourc-ing may provide a better approach than a more traditional,highly-structured judgment task because it facilitates thecollection of feedback from a wide variety of viewpoints forthe same comparison. Feedback from varying viewpointsnaturally captures the myriad interpretations a particularproblem may have.
Quality assurance is a major challenge of crowdsourcing[8, 9]. Without a rigorous quality control strategy, workers
Copyright is held by the author/owner(s).SIGIR ’10, July 19-23, 2010, Geneva, Switzerland
often produce an abundance of poor judgments. Poor judg-ments by a worker can occur when a worker is ethical butmisinterprets the designer’s intent for the task. This is acase of a worker’s bias introducing error. Unethical workers,who do not attempt to honestly complete tasks but simplyanswer as many questions as quickly as possible, are anothersource of erroneous judgments. In the first case we are leftwith some erroneous judgments which can adversely affectour results. The second case we are left with completelyunusable judgments which invalidate our results.
To deal with each of these cases, we train our workers onpreviously defined gold standard data (training data) in andynamic learning environment that gives instant feedbackfor why the answer they chose was incorrect. If a workeranswers too many questions incorrectly, suggesting they arean unethical worker, we ban them from returning to thetask.
By running tasks like this we saw that worker responseswere influenced by the distribution of correct answers in thetraining data. Ethical workers naturally developed notionson how the data was distributed and actively applied whatwas learned to future questions. This situation is similarto that in machine learning, where classifiers develop biastowards the training data. When testing machine learningalgorithms, training data must be fairly sampled from theunderlying population distribution to ensure minimal bias.Unethical workers optimize their responses to maximize rev-enues while minimizing the time spent making judgments.For example, if a worker perceives 80% of the answers areof label A then they will answer A every time.
In this paper we attempt to quantify the influence of thedynamic learning environment by examining how the distri-bution of correct answers in the training data affects workerresponses. We hypothesize that training data in which thedistribution of correct answers is more uniform yields op-timal results with respect to worker quality and aggregatemajority vote result quality. We test this hypothesis on atask where we ask workers to categorize query results intofour categories. We compiled a test set that had a skewedunderlying distribution (a higher proportion of one label),and then trained different sets of workers on five differenttraining sets. This will be explained in more detail in Sec-tions 3 and 4.
2. BACKGROUNDAmazon Mechanical Turk (AMT) is a platform offered
Proceedings of the SIGIR 2010 Workshop on Crowdsourcing for Search Evaluation (CSE 2010) - July 23, 2010 17
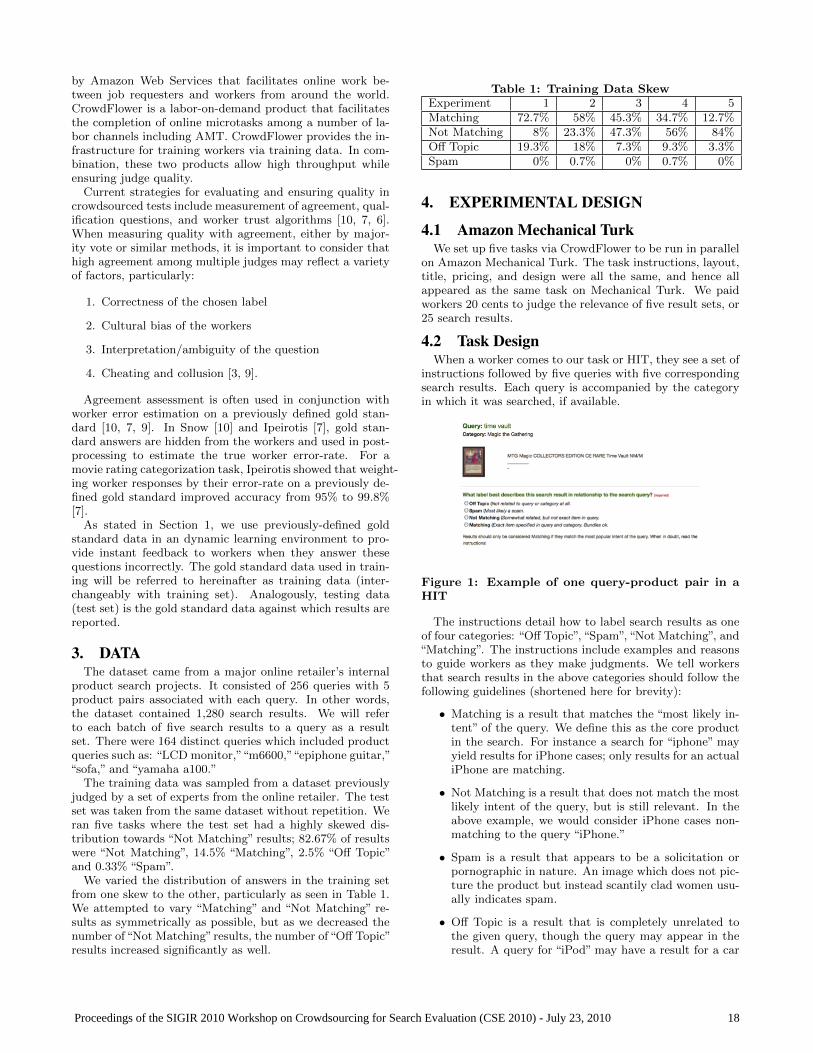
by Amazon Web Services that facilitates online work be-tween job requesters and workers from around the world.CrowdFlower is a labor-on-demand product that facilitatesthe completion of online microtasks among a number of la-bor channels including AMT. CrowdFlower provides the in-frastructure for training workers via training data. In com-bination, these two products allow high throughput whileensuring judge quality.
Current strategies for evaluating and ensuring quality incrowdsourced tests include measurement of agreement, qual-ification questions, and worker trust algorithms [10, 7, 6].When measuring quality with agreement, either by major-ity vote or similar methods, it is important to consider thathigh agreement among multiple judges may reflect a varietyof factors, particularly:
1. Correctness of the chosen label
2. Cultural bias of the workers
3. Interpretation/ambiguity of the question
4. Cheating and collusion [3, 9].
Agreement assessment is often used in conjunction withworker error estimation on a previously defined gold stan-dard [10, 7, 9]. In Snow [10] and Ipeirotis [7], gold stan-dard answers are hidden from the workers and used in post-processing to estimate the true worker error-rate. For amovie rating categorization task, Ipeirotis showed that weight-ing worker responses by their error-rate on a previously de-fined gold standard improved accuracy from 95% to 99.8%[7].
As stated in Section 1, we use previously-defined goldstandard data in an dynamic learning environment to pro-vide instant feedback to workers when they answer thesequestions incorrectly. The gold standard data used in train-ing will be referred to hereinafter as training data (inter-changeably with training set). Analogously, testing data(test set) is the gold standard data against which results arereported.
3. DATAThe dataset came from a major online retailer’s internal
product search projects. It consisted of 256 queries with 5product pairs associated with each query. In other words,the dataset contained 1,280 search results. We will referto each batch of five search results to a query as a resultset. There were 164 distinct queries which included productqueries such as: “LCD monitor,”“m6600,”“epiphone guitar,”“sofa,” and “yamaha a100.”
The training data was sampled from a dataset previouslyjudged by a set of experts from the online retailer. The testset was taken from the same dataset without repetition. Weran five tasks where the test set had a highly skewed dis-tribution towards “Not Matching” results; 82.67% of resultswere “Not Matching”, 14.5% “Matching”, 2.5% “Off Topic”and 0.33% “Spam”.
We varied the distribution of answers in the training setfrom one skew to the other, particularly as seen in Table 1.We attempted to vary “Matching” and “Not Matching” re-sults as symmetrically as possible, but as we decreased thenumber of“Not Matching”results, the number of“Off Topic”results increased significantly as well.
Table 1: Training Data SkewExperiment 1 2 3 4 5Matching 72.7% 58% 45.3% 34.7% 12.7%Not Matching 8% 23.3% 47.3% 56% 84%Off Topic 19.3% 18% 7.3% 9.3% 3.3%Spam 0% 0.7% 0% 0.7% 0%
4. EXPERIMENTAL DESIGN
4.1 Amazon Mechanical TurkWe set up five tasks via CrowdFlower to be run in parallel
on Amazon Mechanical Turk. The task instructions, layout,title, pricing, and design were all the same, and hence allappeared as the same task on Mechanical Turk. We paidworkers 20 cents to judge the relevance of five result sets, or25 search results.
4.2 Task DesignWhen a worker comes to our task or HIT, they see a set of
instructions followed by five queries with five correspondingsearch results. Each query is accompanied by the categoryin which it was searched, if available.
Figure 1: Example of one query-product pair in aHIT
The instructions detail how to label search results as oneof four categories: “Off Topic”, “Spam”, “Not Matching”, and“Matching”. The instructions include examples and reasonsto guide workers as they make judgments. We tell workersthat search results in the above categories should follow thefollowing guidelines (shortened here for brevity):
• Matching is a result that matches the “most likely in-tent” of the query. We define this as the core productin the search. For instance a search for “iphone” mayyield results for iPhone cases; only results for an actualiPhone are matching.
• Not Matching is a result that does not match the mostlikely intent of the query, but is still relevant. In theabove example, we would consider iPhone cases non-matching to the query “iPhone.”
• Spam is a result that appears to be a solicitation orpornographic in nature. An image which does not pic-ture the product but instead scantily clad women usu-ally indicates spam.
• Off Topic is a result that is completely unrelated tothe given query, though the query may appear in theresult. A query for “iPod” may have a result for a car
Proceedings of the SIGIR 2010 Workshop on Crowdsourcing for Search Evaluation (CSE 2010) - July 23, 2010 18

where “iPod” is in the result string. The main productin the result is a car which has nothing to do with theiPod.
The full instruction set and task interface are availablehere: <http://crowdflower.com/judgments/mob/13838>.
4.3 Dynamic Learning for Quality ControlThis experiment used the training data first in an entry
training module, in which each worker has to complete 20query-result pairs successfully before proceeding to test-setquestions. The workers are notified that only upon passingthis section will they receive payment. We inform workersof their mistakes. After this training period, training datais used as periodic screening questions [4] to provide livefeedback when workers err. The feedback explains what thecorrect answer should be and why. For every 20 query-resultpairs a worker saw, they also were exposed to five trainingdata questions in periodic screening.
As a worker answers these training data questions, wecalculate their accuracy and use it as an estimate for theworker’s “true” accuracy. We rely on a simplified metric,the percent of correct responses, as described by Snow et al[10]. Workers are blocked from continuing on a task if theiraccuracy is poor. Before being blocked, a worker will receivea warning that their accuracy is too low and that they shouldreread the instructions to correct mistakes. Unlike in [10, 7],we did no post-processing to refine worker error estimation.
5. RESULTS
5.1 WorkersThere were 255 unique workers who participated in these
five experiments. There were no AMT qualifications to ex-clude certain workers from this task. The workers were splitrandomly into one of the tasks that were live simultaneouslysuch that test group sizes were uniform. We stored the taskassignment of each worker on our servers; if a worker hadpreviously been working on a task and then resumed thesession, he/she would be returned to the same task.
Routing to a task stopped if the task fulfilled its judgmentneeds of five trusted judgments per result. The distributionof unique workers across each task is affected by a varietyof factors: individual worker output, untrusted workers, thenumber of judgments needed to complete each task, changesin the routing of workers away from tasks that had fulfilledtheir judgment needs, etc. Table 2 shows the distribution ofworker involvement.
Table 2: Worker DistributionExperiment 1 2 3 4 5Came to the task 43 42 42 87 41Did Training 26 25 27 50 21Passed Training 19 18 25 37 17Failed Training 7 7 2 13 4Percent Passed 73% 72% 92.6% 74% 80.9%
5.2 Individual Worker QualityIn the experiments where the underlying distribution skewed
toward “Not Matching,” individual worker test accuracy in-creased as the training set more closely reflected the un-derlying distribution. Optimal worker accuracy is achieved
when training distributions match the population distribu-tion. But when the test set is highly skewed, other measuresmay be more effective since a worker can achieve 82% ac-curacy by answering all “Not Matching.” Worker precisionon “Not Matching” labels peaked when the training answerswere uniform over the labels (Table 3).
Table 3: Average Worker Performance MeasuresWorker \ Experiment 1 2 3 4 5Accuracy (Overall) 0.690 0.708 0.749 0.763 0.790Precision (Not Matching) 0.909 0.895 0.930 0.917 0.915Recall (Not Matching) 0.704 0.714 0.774 0.800 0.828
5.3 Aggregate Result QualityThe aggregate majority vote results have the greatest ac-
curacy (87.67%) when the distribution of training data an-swers is the most uniform. This accuracy is 5% greater thanbaseline accuracy (82.67%) and 12.77% greater than individ-ual worker accuracy as shown in Table 3. Baseline accuracyfor the aggregate results would be defined as a majority ofworkers answering all questions as “Not Matching.” Whenthe training data distribution is the same as the underly-ing distribution accuracy was 85% (3% above baseline accu-racy).
Percent of "Not Matching" Items in Training Data
Acc
urac
y
0.76
0.78
0.80
0.82
0.84
0.86
0.88
0.90
0 20 40 60 80 100
Figure 2: Aggregate Accuracy on Test Data
In these experiments the underlying distribution is so heav-ily skewed towards one label that we may want to optimizeother performance metrics. As seen in Table 4, each measureis maximized in Experiment 3 (which contained a uniformtraining set distribution).
Table 4: Aggregate Performance MeasuresExperiment 1 2 3 4 5Precision 0.921 0.932 0.936 0.932 0.912Recall 0.865 0.917 0.919 0.863 0.921
Proceedings of the SIGIR 2010 Workshop on Crowdsourcing for Search Evaluation (CSE 2010) - July 23, 2010 19

Note that as the training distribution more closely reflectsthe skewed population distribution in experiment 5, recallexceeded precision. A majority of workers were optimizingfor the “Not Matching” label, labeling more items as “NotMatching” at the cost of being less precise.
6. DISCUSSIONThe task environment is one in which workers can learn
what is expected of them as they progress through the task.This enables the task designer to incorporate more detailedinstructions with the expectation that workers can and willskip the instructions to immediately begin answering ques-tions. We anticipate that many workers will only referencethe instructions upon notification of their mistakes.
The training method is analogous to training a classifierwith a machine learning algorithm. Most machine learningalgorithms are applied using a randomly selected trainingset, which would be expected to approximate the underlyingdistribution.
We found that workers yielded greater precision on iden-tifying “Not Matching” items when they were trained ona training set with a more uniform distribution of correctanswers. Results aggregated by majority vote had greateraccuracy even though the test set had a skewed distributiontowards “Not Matching” items.
Workers are very adept at realizing that items are heavilyskewed to a certain label (an anchoring effect) and may bepredisposed to select the label with the highest prior. Work-ers would then be more likely to miss items that deviatefrom their expectations. Thus in this learning environment,training questions should predispose no bias.
This phenomenon may be due in part to workers’ abilityto learn testing data as they are exposed to it. Machine-learned classifiers generally cannot learn from test data asit is processed, which is why it is so important to have ro-bust training sets. Humans are not machines, so when doingmachine-learning-like tasks where we use humans as classi-fiers, we must apply different techniques to train them. Tonget al [11] noted that incorporating active learning methods intraining machine-learned classifiers may offer improvementsto traditional methods. This result may also imply thatstrategies for training humans could inform future researchon machine learning algorithms.
This experiment suggests broader implications for prac-titioners; namely that a dynamic learning environment canbe used strategically to: 1) identify unethical workers and2) train ethical workers more effectively. However, the at-tributes of the learning environment are critical. In particu-lar the choice of training examples will affect worker output.Further development and application of these principles willenable us to approach search relevance tasks involving am-biguous queries or even more complex tasks that requiredomain-specific knowledge.
7. FUTURE WORKWe shall run more experiments to further validate these
results. Future research should also extend the learning envi-ronment, possibly by incorporating active learning methodsto train workers on similar examples of items they got in-correct and by developing a more refined model for estimat-ing the “true” error rate of workers using a full multinomialmodel [10]). Having such a model for worker responses may
better show why workers are getting questions wrong andmay also point to difficulty and ambiguity in our task. If wedifferentiate workers by demographics we may also be ableto identify cultural differences, which could in turn improvetask design.
8. NOTESWe have run this type of task numerous times over the
past year on AMT, and as such workers may have enteredthe job with expectations as to what answers allow themto pass training questions. On previous runs of this task,items were overwhelmingly “Matching” (about 80%). Be-cause repeat workers can learn the training data throughrepeated exposure, our experiments skewed the distributionof items towards “Not Matching.” We point out that thetraining data used for these experiments had not been usedpreviously on any crowdsourcing platform.
We priced this task at an extremely high rate for an AMTtask. An unusually high price tends to attract many oppor-tunistic or untrustworthy workers. Part of the goal of thisexperiment was to engage a diverse set of both ethical andunethical workers.
9. ACKNOWLEDGMENTSWe would like to thank Brian Johnson (eBay), James
Rubinstein (eBay), Aaron Shaw (Berkeley), Alex Sorokin(CrowdFlower), Chris Van Pelt (CrowdFlower) and MeiliZhong (PayPal).
10. REFERENCES[1] O. Alonso. Guidelines for designing crowdsourcing-based
relevance evaluation. In ACM SIGIR, July 2009.
[2] O. Alonso, D. E. Rose, and B. Stewart. Crowdsourcing forrelevance evaluation. SIGIR Forum, 42(2):9–15, 2008.
[3] B. Carterette, P. N. Bennett, D. M. Chickering, and S. T. Hereor there: Preference judgments for relevance. In Proceedings ofthe European Conference on Information Retrieval (ECIR),2008.
[4] J. S. Downs, M. B. Holbrook, S. Sheng, and L. F. Cranor. Areyour participants gaming the system?: screening mechanicalturk workers. In CHI ’10: Proceedings of the 28thinternational conference on Human factors in computingsystems, pages 2399–2402. ACM, 2010.
[5] G. Dupret, V. Murdock, and B. Piwowarski. Web search engineevaluation using click-through data and a user model. InProceedings of the Workshop on Query Log AnalysisWWW2007, May 2007.
[6] C. Grady and M. Lease. Crowdsourcing document relevanceassessment with amazon’s mechanical turk. In NAACL/HLT2010 Workshop on Creating Speech and Language Data WithAmazon’s Mechanical Turk (at the 11th Annual Conferenceof the North American Chapter of the Association forComputational Linguistics), 2010.
[7] P. Ipeirotis, F. Provost, and J. Wang. Quality management onamazon mechanical turk. In KDD-HCOMP ’10, 2010.
[8] J. Kamps, S. Geva, C. Peters, T. Sakai, A. Trotman, andE. Voorhees. In Report on the SIGIR 2009 workshop on thefuture of IR evaluation, volume 43, pages 13–23. ACM, 2009.
[9] G. Kazai and N. Milic-Frayling. On the evaluation of thequality of relevance assessments collected throughcrowdsourcing. In Proceedings of the SIGIR 2009 Workshopon the Future of IR Evaluation, pages 21–22, 2009.
[10] R. Snow, B. O’Connor, D. Jurafsky, and A. Y. Ng. Cheap andfast—but is it good?: evaluating non-expert annotations fornatural language tasks. In EMNLP ’08: Proceedings of theConference on Empirical Methods in Natural LanguageProcessing, pages 254–263. Association for ComputationalLinguistics, 2008.
[11] S. Tong, D. Koller, and P. Kaelbling. Support vector machineactive learning with applications to text classification. InJournal of Machine Learning Research, pages 999–1006, 2001.
Proceedings of the SIGIR 2010 Workshop on Crowdsourcing for Search Evaluation (CSE 2010) - July 23, 2010 20

An Analysis of Assessor Behavior in CrowdsourcedPreference Judgments
Dongqing Zhu and Ben CarteretteDepartment of Computer & Information Sciences
University of DelawareNewark, DE, USA 19716
[zhu | carteret]@cis.udel.edu
ABSTRACTWe describe a pilot study using Amazon’s Mechanical Turkto collect preference judgments between pairs of full-pagelayouts including both search results and image results. Spe-cifically, we analyze the behavior of assessors that partici-pated in our study to identify some patterns that may bebroadly indicative of unreliable assessments. We believe thisanalysis can inform future experimental design and analysiswhen using crowdsourced human judgments.
Categories and Subject DescriptorsH.3.4 [Information Storage and Retrieval]: Systemsand Software—Performance Evaluation
General TermsExperimentation, Measurement, Human Factors
Keywordscrowdsourcing, preference judgements, experimental design
1. INTRODUCTIONThe search engine results page (SERP) layout has a greatimpact on users’ searching experience. With the emergenceof images, ads, news, blog posts, and even micro-blog postsin the search results, how to smartly integrate them intoweb pages to assist searching becomes an interesting thoughchallenging problem. As the first step, we explore how tomake the search results layout more user-friendly by varyingthe positions of images relative to ranked results. Images canassist users in finding the information they want and makesearching more effective. On the other hand, images maytake up too much valuable space on the SERP due to theirsizes.
This work describes a pilot study we performed to deter-mine the optimal placement of images among search results.The objects to be assessed are full page layouts consisting ofboth ranked results and results from image search verticals.
Copyright is held by the author/owner(s).SIGIR’10 , July 19–23, 2010, Geneva, Switzerland.
It is the positions of images and ranked results relative toone another rather than the relevance of individual itemson the page that we are interested in assessing. Because webelieve the quality of a full layout is difficult to assess onan absolute scale, we used preference judgments: assessorssee two different possible layouts and choose the one theyprefer. Over a large number of assessors, we should be ableto determine the most preferred general layout, as well asspecific queries that deviate from the overall most preferred.
Preference judgments can be made quickly and are less proneto disagreements between assessors than absolute judgments[2]. Using preference judgments to evaluate is also more ro-bust to missing judgments than using absolute judgmentsto evaluate [1]. Preferences between full page layouts seemto correlate well to traditional evaluation measures basedon absolute relevance judgments on documents [9]. Finally,preference judgments can be mapped to much finer-grainedgrades of utility than is possible with absolute judgments [8].Preference judgments do have some problems: the number ofpairs to be judged grows quadratically rather than linearly,and assessors seem to find the increased number much moretedious [2]. Furthermore, when assessing full layouts, thenumber of objects that need to be assessed can grow fac-torially as individual items are rearranged relative to oneanother. And depending on how much layouts are allowedto vary, there can be a“credit assignment problem”: it is dif-ficult to tell why an assessor prefers one layout to another.
Nevertheless, preference judgments seem an ideal tool forthis task, and because we both need many of them and theycan be made quickly, they seem to be an ideal candidate forcrowdsourcing via Amazon’s Mechanical Turk1 (MTurk) orsome other system. The fact that they can be made quickly,however, may lead assessors being paid very low rates perjudgment to “cheat” or produce otherwise unreliable data invarious ways so that they can make more money withoutexpending much effort. When data is unreliable, it leadsto bias in judgments and possibly severe errors in evalu-ations [4]. Experimenters naturally would like to be ableto prevent, detect, and compensate it [6][10][7]. But thischeating creates an adversarial relationship with the experi-menter, in that as experimenters learn how to detect cheat-ing, the assessors find new ways to cheat them. In our pilotstudy, we discovered that assessors seem to be cheating inways that are not initially obvious, and further that they willsometimes cheat on one task while seemingly taking another
1http://www.mturk.com
Proceedings of the SIGIR 2010 Workshop on Crowdsourcing for Search Evaluation (CSE 2010) - July 23, 2010 21

seriously.
The rest of this paper is organized as follows: in Section 2, wedescribe our experimental design. In Section 3, we providesome analysis on the behavior of MTurk workers, and inSection 4 we summarize our results and describe directionsfor future work.
2. EXPERIMENTAL DESIGNWe set up an online survey that asks assessors to give theirpreferences on variations of the Yahoo! SERP layout for 47queries formed from 30 topics taken from the TREC 2009Web track [5] and the TREC 2009 Million Query track [3].To limit the space of possibilities, we selected only queriesthat have results from an image vertical but not from anyother vertical. We keep the search results fixed (we alwaysuse the same 10 URLs with the same summaries), and weinsert image vertical results into one of three places: aboveall search results (top), below the top five results (middle),and below all ten results (bottom). In addition to resultsfrom the image vertical, some URLs have an inline imageassociated with them as well. These we displayed to eitherthe left or the right of the summary. In all, each query hadup to six different layout variants: queries with only inlineimages had two variants, queries with image vertical resultshad three variants, and queries with both had six. Twolayout variations are shown side by side to the assessors asillustrated in Fig. 1.
We take the advantage of Amazon Mechanical Turk as aplatform to involve search engine users with different back-grounds around the world. In Mechanical Turk, “requesters”submit “HITs” (Human Intelligence Tasks) to be completedby “MTurkers” (Mechanical Turk Workers). We redirectMTurkers from our HIT (Human Intelligent Task) questionto our own survey website, which allows us to show eachMTurker a sequence of preferences and to log additional in-formation such as time-on-task. MTurkers complete the sur-vey, submit the confirmation code at the end of the surveyvia the HIT, and get paid US$0.13 for every 17 preferencesthey complete once their submissions are validated.
There are three different batches of survey questions, cor-responding to queries with inline images only, image verti-cal results only, and both types. Each batch consists of 17queries, and for each query there is a single preference judg-ment. We limited to one preference judgment per query perassessor to control possible learning on topic effects, eventhough it prevents us from acquiring all preference judg-ments for a query from a single assessor. The order of show-ing those 17 queries is randomized to control possible ordereffects and to allow analysis on whether assessors’ behav-ior was changing as they learned about the task. For eachquery, two result pages are randomly selected and presentedto the user, who may choose the “left” layout, the “right”variant, or express “no preference”. Though each batch hasdifferent number of layout variants, we can easily control thedata size required for each batch by letting user groups ofdifferent sizes to complete the survey.
We added an additional absolute-scale rating task for eachquery. Users not only give preferences for layouts but alsorate the pictures by relevance on a ternary scale (“poor”,
Figure 1: A sample survey question page. The firstquestion asks assessors to make their perference.The second question asks assessors to rate the im-ages in the SERP.
Welcome to the survey!
You will give preferences on the layouts of Search Engine Result Pages (SERPs). Please look at boththe images and context to make your decisons. There are total 17 pairs and each requires just a fewmouse clicks to complete. The survey will take 5~7 minutes. At the end of the survey you will be givena confirmation number for the HIT in Amazon Mechanical Turk. Please be sure not to click on the 'Goback' button on your browser. Thank you!
Before we start, please answer a simple question: Which one of the following all-purpose searchengines do you use most often?
Yahoo
Bing
Ask
Other: (please specify)
Now, click the button on the right if you are ready to take the survey.
Figure 2: Welcome page of the survey with A simplequestion to identify user’s favorite search engine.
“OK”,“good”). In this way we can test whether the relevanceof the pictures is also an important factor that influences thelayout preference.
Out of the 17 queries, two are “trap” questions (followingSanderson et al. [9]) that have two identical result pages.We put them at the 6th and 15th respectively in the surveyquestion sequence. Thus, assessors should have no prefer-ence for those pairs. The purpose of setting up the trapquestions is to detect dishonest workers—if they do not se-
Proceedings of the SIGIR 2010 Workshop on Crowdsourcing for Search Evaluation (CSE 2010) - July 23, 2010 22

lect “no preference”, they are probably not paying attention.
Finally, we add a simple question at the beginning of thesurvey to identify a user’s favorite search engine (Fig. 2).The purpose of this is to determine whether expectationplays any role in preference: Yahoo!’s default for inline im-ages is to display them on the right, while Google’s is todisplay them on the left (Bing’s seems to vary by query).Our hypothesis is that Yahoo! users may prefer the rightwhile Google users may prefer the left, at least initially.
3. DATA ANALYSISFirst we rejected the HITs that failed our trap question.After that, this pilot study produced a total of 25 approvedHITs for which we had timing information (seconds per judg-ment), preferences, image ratings, and search engine prefer-ence. 24 of 25 preferred Google, so we were not able to testour hypothesis about expectations.
3.1 Time analysisWe plot the time in seconds that assessors spend on eachpreference judgment against the query sequence. Three gen-eral types of assessors are found and three representativecurves are shown in Fig. 3. Fig. 3(a) shows the Normalpattern: the assessor starts out slow, quickly gets faster ashe or she learns about the task, and then roughly maintainstime. This is expected because assessors who never did thissurvey before require more time on the first few questions,but as they get more familiar with the questions, they makequicker responses. 17 out of the 25 assessors (68%) fall intothis category.
Fig. 3(b) shows the Periodic pattern which indicates verystrange user behavior: some judgments are made fast andsome are made slow, but the fast and slow tend to alternate.One possible explanation might be that these assessors werenot fully dedicated to doing the survey. They are probablynot purposely cheating, but they might be absent-mindedperiodically, calling their data into question. 6 out of the 25assessors (24%) fall into this Periodic category.
Fig. 3(c) shows the Interrupted pattern in which occa-sional peaks appears under the background of Normal pat-tern. Users who have this kind of pattern might be inter-rupted in the middle of the survey, e.g., receiving a phonecall while doing the survey; it seems unlikely they are cheat-ing or allowing the interruption to affect their results signif-icantly. Only 2 assessors fall into this category.
3.2 Image rating analysisAs to the image ratings in Fig. 4, they also exhibit 3 differ-ent patterns. Fig. 4(a) shows the Normal pattern. Usersgive rating 2 or 3 most often and give rating 1 occasionally(suggesting that Yahoo!’s image results are pretty good, aswe expect). 21 of 25 assessors (84%) have this Normal timepattern.
Fig. 4(b) shows a Periodic pattern similar to that observedfor timing: a user shows a tendency to alternate betweena subset of ratings. These assessors may be cheating, butexhibiting an advanced cheating behavior by purposefullytrying to “randomize” their responses so that it would be
0 5 10 150
10
20
30
40Time
Sec
onds
Query (No.1 ~ No.15)
(a) Normal assessors start out slow and quickly get up to aconsistent judgment speed.
0 5 10 1510
20
30
40
50Time
Sec
onds
Query (No.1 ~ No.15)
(b) Periodic assessors vacillate between relatively fast judg-ments and relatively slow judgments.
0 5 10 150
50
100
150
200
250Time
Sec
onds
Query (No.1 ~ No.15)
(c) Interrupted assessors look like normal assessors exceptfor a large spike in time.
Figure 3: Each plot shows the time an assessor tookto make a preference judgment for each of 15 queriesin a randomized order. “Trap” queries have beenexcluded. The plots are not averages; each is anexemplar of one of the cases.
difficult for requesters to discover their dishonesty. 2 out of25 assessors (8%) fall into this category and we find that oneof these two assessors also shows a periodic time pattern.
Note that Figures 4(a) and 4(b) actually have roughly equalnumbers of “good” judgments. If indeed images for 8 ofthe 15 queries can be given the highest rating, then becausethe order is randomized, there is some chance that an honestassessor will actually produce such a periodic pattern. How-ever, the probability of any periodic or even quasi-periodic(i.e., with some short repetitions) pattern being observeddue to chance alone is very low—we estimate it to be lessthan one in a thousand. It therefore seems safe to concludethat both assessors produced invalid data.
Fig. 4(c) shows the Fixed pattern in which all or most ofthe images rating are the same. 2 out of 25 assessors (8%)have the Fixed pattern. This type of assessor seem clearlynot interested in rating the images and thus almost always
Proceedings of the SIGIR 2010 Workshop on Crowdsourcing for Search Evaluation (CSE 2010) - July 23, 2010 23

0 5 10 151
1.5
2
2.5
3
3.5Image Rating (1−Bad 2−OK 3−Good)
Rat
ing
Query (No.1 ~ No.15)
(a) Normal assessors demonstrate no clear pattern in theirimage relevance judgments.
0 5 10 151.5
2
2.5
3
3.5Image Rating (1−Bad 2−OK 3−Good)
Rat
ing
Query (No.1 ~ No.15)
(b) Periodic assessors vacillate between two or more ratingsin a consistent way.
0 5 10 152
2
2Image Rating (1−Bad 2−OK 3−Good)
Rat
ing
Query (No.1 ~ No.15)
(c) Fixed assessors give every image set the same judgment.
Figure 4: Each plot shows the rating an assessorgave to the set of images retrieved by the imagevertical.
give a fixed rating.
3.3 Preference judgment analysisIn this section we analyze preference judgments for the mixedset (both inline and vertical image results) to determinewhether we can identify one or the other as the primaryfactor in the assessor’s preference. If so, we may be ableto (partially) address the “credit assignment problem” de-scribed in Section 1.
We separately analyzed the inline placement and verticalplacement preferences for the time being. We assign TMB(top/middle/bottom vertical variants) and LR (left/right in-line variants) scores to indicate the layout preferences ac-cording to the following method:
• Given a T-B pair, if the user prefers T, we assign 1.5as TMB score of that pair. Otherwise, we assign -1.5.
• Given an M-B pair, if the user prefers M, we assign 1as TMB score of that pair. Otherwise, we assign -1.
• Given a T-M pair, if the user prefers T, we assign 1 asTMB score of that pair. Otherwise, we assign -1.
• Given an L-R pair, if the user prefers L, we assign 1as LR score of that pair. Otherwise, we assign -1.
In the example in Figure 1, if an assessor preferred the leftlayout to the right, the judgment would have a TMB scoreof 1 because the assessor prefers vertical results in the mid-dle rather than the bottom, and an LR score of 1 becausethe assessor prefers inline images on the left to the right.Note that the first three items above are mutually exclusive.Thus, higher TMB and LR scores indicate the preference forhigher vertical images position and left inline image position.
Figures 5 and 6 show moving averages of the TMB and LRscores (red and blue lines, respectively) against query num-ber; we call these curves layout preference curves. Theyare moving averages to control for variance in which layoutvariants the assessor saw. There are roughly two patternsof layout preference curves: either only one of the scoreschanges over time, or both do. Fig. 5 shows two representa-tive curves of the first pattern along with judgment time andimage rating curves (note that both assessors are more-or-less normal types as defined above). In Fig. 5(a), the inlineimage preference gradually goes from a left-preference to aright-preference while the vertical image preference remainshigh. In Fig. 5(b), the inline image preference stays fixedon the right while the vertical image preference seems to bechanging periodically (with a relatively long wavelength).We infer from this that it is the layout preference associ-ated with the varying curve that is the leading factor inmaking preferences: assessor 5(a) definitely prefers verticalresults towards the top, so bases his or her judgments on theposition of the inline images, while assessor 5(b) definitelyprefers inline images on the right, so bases his or her judg-ments on the position of the vertical results. The alternativepossible explanation, that the assessor simply doesn’t careabout one or the other type, is probably not the case: sinceeach variant for each type was equally likely to occur in ei-ther the left or right position, the assessor had to consciouslychoose their consistent preference every time.
Fig. 6 shows two representative curves of the second patternalong with judgment time and image rating curves (again,both assessors seem normal w.r.t. time, though there is asense that assessor 6(a) stopped doing the image rating taskwhile assessor 6(b) has somewhat periodic ratings). In thispattern, both TMB and LR curves vary over time, so wecannot conclude that one or the other is responsible for thepreference. However, we may take this as an indicator ofexpectations shifting as the assessor becomes more familiarwith the different layouts. Assessor 6(a) starts out with apreference for inline images on the right but gradually comesto have no preference; he or she also starts with no preferencefor vertical image placement but gradually comes to preferthem on the top. In these cases we may need to look ateach SERP pair individually to determine if TMB and LRpositions have a combinational effect on layout preference.
3.4 Analysis of rejected dataFinally, we looked at the assessors that failed the “trap”question by expressing a preference when the layouts were
Proceedings of the SIGIR 2010 Workshop on Crowdsourcing for Search Evaluation (CSE 2010) - July 23, 2010 24

2 4 6 8 10−2
0
2Moving Average of Preferences
Query (No.3 ~ No.12)
Sco
re
0 5 10 150
50
100Time
Sec
onds
0 5 10 150
2
4Image Rating (1−Bad 2−OK 3−Good)
Rat
ing
Query (No.1 ~ No.15)
(a) Varying inline image preference curve (LR curve).
2 4 6 8 10−2
0
2Moving Average of Preferences
Query (No.3 ~ No.12)
Sco
re
0 5 10 150
50
100Time
Sec
onds
0 5 10 150
2
4Image Rating (1−Bad 2−OK 3−Good)
Rat
ing
Query (No.1 ~ No.15)
(b) Varying vertical image preference curve (TMB curve).
Figure 5: One layout preference curve (top plots) changes dramatically over time while the other changesslightly. The solid red line with ∗ indicates TMB score (for vertical image preference) and the solid blue linewith × indicates LR score (for inline image preference). The solid red lines are the upper and lower boundsfor TMB score while the dashed blue lines are bounds for LR score. The moving window size is 5. Thus, thecurve starts at Query No.3 and ends at No.12. The middle and bottom plots show the judgment time andimage rating curves respectively.
2 4 6 8 10−2
0
2Moving Average of Preferences
Query (No.3 ~ No.12)
Sco
re
0 5 10 150
20
40Time
Sec
onds
0 5 10 151
2
3Image Rating (1−Bad 2−OK 3−Good)
Rat
ing
Query (No.1 ~ No.15)
(a)
2 4 6 8 10−2
0
2Moving Average of Preferences
Query (No.3 ~ No.12)
Sco
re
0 5 10 150
50Time
Sec
onds
0 5 10 150
2
4Image Rating (1−Bad 2−OK 3−Good)
Rat
ing
Query (No.1 ~ No.15)
(b)
Figure 6: Both layout preference curves (top plots) change over time. The solid red line with ∗ indicatesTMB score (for vertical image preference) and the solid blue line with × indicates LR score (for inline imagepreference). The solid red lines are the upper and lower bounds for TMB score while the dashed blue linesare bounds for LR score. The moving window size is 5. Thus, the curve starts at Query No.3 and ends atNo.12. The middle and bottom plots show the judgment time and image rating curves respectively.
identical. Eight assessors were rejected for this reason; ofthese, one showed a periodic time pattern (Fig. 7(a)) andone showed an interruption (Fig. 7(b)). Two showed an ab-normal time pattern of taking longer on the last few queries(Fig. 7(c), Fig. 7(d)); this was not observed among assessorsthat passed the trap question. One showed a fixed ratingpattern (Fig. 7(e)) one showed a partially periodic ratingpattern (Fig. 7(f)), and two seemed normal in both timeand rating (Fig. 7(g) and 7(h)).
4. CONCLUSIONSWe performed a pilot study to determine whether AmazonTurk could produce useful preference judgments for distin-guishing between different layouts including both search en-gine results and image results. Though we did not discuss itin the main body of this work, the overall results were over-whelmingly in favor (by a factor of roughly 2:1) of verticalimage results near the top of the page and inline image re-
Proceedings of the SIGIR 2010 Workshop on Crowdsourcing for Search Evaluation (CSE 2010) - July 23, 2010 25

0 5 10 15 200
50
100Time
Sec
onds
0 5 10 15 200
2
4Image Rating (1−Bad 2−OK 3−Good)
Rat
ing
Query (No.1 ~ No.17)
(a) Periodic time pattern
0 10 200
500
1000Time
Sec
onds
0 10 200
2
4Image Rating (1−Bad 2−OK 3−Good)
Rat
ing
Query (No.1 ~ No.17)
(b) Interrupted time pattern
0 5 10 15 200
100
200Time
Sec
onds
0 5 10 15 200
2
4Image Rating (1−Bad 2−OK 3−Good)
Rat
ing
Query (No.1 ~ No.17)
(c) Abnormal time pattern
0 5 10 15 200
200
400Time
Sec
onds
0 5 10 15 200
2
4Image Rating (1−Bad 2−OK 3−Good)
Rat
ing
Query (No.1 ~ No.17)
(d) Abnormal time pattern
0 5 10 15 200
50Time
Sec
onds
0 5 10 15 202
3
4Image Rating (1−Bad 2−OK 3−Good)
Rat
ing
Query (No.1 ~ No.17)
(e) Fixed image rating pat-tern
0 5 10 15 2010
20
30Time
Sec
onds
0 5 10 15 200
2
4Image Rating (1−Bad 2−OK 3−Good)
Rat
ing
Query (No.1 ~ No.17)
(f) Partially periodic imagerating pattern
0 5 10 15 200
50Time
Sec
onds
0 5 10 15 200
2
4Image Rating (1−Bad 2−OK 3−Good)
Rat
ing
Query (No.1 ~ No.17)
(g) Normal
0 5 10 15 200
50
100Time
Sec
onds
0 5 10 15 200
2
4Image Rating (1−Bad 2−OK 3−Good)
Rat
ing
Query (No.1 ~ No.17)
(h) Normal
Figure 7: Analysis of assessors that failed the “trap” question.
sults on the left. However, we believe our analysis providessome interesting data for designing future studies:
1. Unreliable assessors may reveal their unreliability indifferent ways: some through periodic timings, somethrough abnormal timings, some through periodic rat-ings, some through fixed ratings.
2. When asked to perform more than one task, assessorsmay be reliable on one without necessarily producingreliable data for the other.
3. Trap questions are useful for identifying unreliable as-sessors, as 6 of the 8 responses rejected for failing thetrap question also exhibited unusual behavior patterns.
4. Trap questions alone may not identify all the unreli-able assessors, as 6 of 25 passed the trap question butshowed periodic timings and 4 of 25 passed the trapquestion but showed strange image rating behavior.
5. The use of periodic image ratings may suggest MTurk-ers learning how to avoid being detected when cheat-ing.
Certainly there is more analysis that can be done, partic-ularly in terms of the total number of assessments needed,whether it is “safe” to have a single assessor make multiplepreference judgments for the same query, and how to ag-gregate preferences over assessors to learn about particularqueries. These are all directions we are pursuing currently.
AcknowledgementsThis work was supported in part by a gift from Yahoo! Labsand in part by the University of Delaware Research Founda-tion. Any opinions, findings, and conclusions or recommen-dations expressed in this material are those of the authorsand do not necessarily reflect those of the sponsor.
5. REFERENCES[1] B. Carterette and P. N. Bennett. Evaluation measures
for preference judgments. In Proceedings of SIGIR,2008.
[2] B. Carterette, P. N. Bennett, D. M. Chickering, andS. T. Dumais. Here or there: Preference judgments forrelevance. In Proceedings of ECIR, pages 16–27, 2008.
[3] B. Carterette, V. Pavlu, H. Fang, and E. Kanoulas.Overview of the trec 2009 million query track. InProceedings of TREC, 2009.
[4] B. Carterette and I. Soboroff. The effect of assessorerrors on ir system evaluation.
[5] C. L. A. Clarke, N. Craswell, and I. Soboroff.Overview of the trec 2009 web track. In Proceedings ofTREC, 2009.
[6] A. Kittur, E. H. Chi, and B. Suh. Crowdsourcing userstudies with mechanical turk. In CHI ’08: Proceedingof the twenty-sixth annual SIGCHI conference onHuman factors in computing systems, pages 453–456,New York, NY, USA, 2008. ACM.
[7] V. C. Raykar, S. Yu, L. H. Zhao, A. Jerebko,C. Florin, G. H. Valadez, L. Bogoni, and L. Moy.Supervised learning from multiple experts: Whom totrust when everyone lies a bit. In L. Bottou andM. Littman, editors, Proceedings of the 26th ICML,pages 889–896, Montreal, June 2009. Omnipress.
[8] M. E. Rorvig. The simple scalability of documents.JASIS, 41(8):590–598, 1990.
[9] M. Sanderson, M. L. Paramita, P. Clough, andE. Kanoulas. Do user preferences and evaluationmeasures line up? In Proceedings of SIGIR, 2010.
[10] R. Snow, B. O’Connor, D. Jurafsky, and A. Y. Ng.Cheap and fast—but is it good?: evaluatingnon-expert annotations for natural language tasks. InProceedings of EMNLP, pages 254–263, Morristown,NJ, USA, 2008. Association for ComputationalLinguistics.
Proceedings of the SIGIR 2010 Workshop on Crowdsourcing for Search Evaluation (CSE 2010) - July 23, 2010 26

Logging the Search Self-Efficacy of Amazon MechanicalTurkers
Henry Feild∗
Dept. of Computer ScienceUniversity of Massachusetts
Amherst, MA [email protected]
Rosie JonesYahoo! Labs
4 Cambridge CenterCambridge, MA 02142
Robert C. MillerMIT CSAIL
32 Vassar StCambridge, MA 02139
Rajeev NayakMIT CSAIL
32 Vassar StCambridge, MA 02139
Elizabeth F. ChurchillYahoo! Research
4301 Great America ParkwaySanta Clara, CA
Emre VelipasaogluYahoo! Labs701 First Ave
Sunnyvale, CA [email protected]
ABSTRACTConducting focused but large-scale studies and experimentsof user search behavior is highly desirable. Crowd-sourcingservices such as the Amazon Mechanical Turk allow suchstudies to be conducted quickly and cheaply. They also havethe potential to mitigate the problems associated with tra-ditional experimental methods, in particular the relativelysmall and homogenous participant samples used in typicalexperiments. Our current research project addresses therelationship between searcher self-efficacy assessments andtheir strategies for conducting complex searches. In thiswork-in-progress paper, we describe our initial tests of us-ing Amazon Mechanical Turk to conduct experiments in thisarea. We describe a platform for logging the actions taken byTurkers, and a questionnaire we conducted to assess searchself-efficacy of average Turkers. Our results indicate Turkershave a similar range of search self-efficacy scores to under-graduate students, as measured by Kelly [8]. We were ableto reach a large number of searchers in a short time anddemonstrated we can effectively log interactions for rigor-ous log-based evaluation studies. Changing the amount ofremuneration Turkers received had a significant effect onthe time spent filling out the questionnaire, but not on theself-efficacy assessments. Finally, we describe the design ofan experiment to use Turkers to evaluate search assistancetools.
∗Work completed while at Yahoo!
Permission to make digital or hard copies of all or part of this work forpersonal or classroom use is granted without fee provided that copies arenot made or distributed for profit or commercial advantage and that copiesbear this notice and the full citation on the first page. To copy otherwise, torepublish, to post on servers or to redistribute to lists, requires prior specificpermission and/or a fee.SIGIR’10 Workshop on Crowdsourcing July 19–23, 2010, Geneva, Switzer-land.Copyright 2010 ACM Copyright is held by the author/owner(s). ...$10.00.
General TermsKeywordssearch, self-efficacy, crowd-sourcing, Amazon Mechanical Turk,user study, iterative method design
1. INTRODUCTIONThis work is motivated by our current research project
to study the effectiveness of search assistance. FollowingCompeau and Higgin’s [5] research suggesting that a deter-miner of computer use is people’s self-efficacy assessmentsaround computer literacy or competence, our hypothesis isthat search self-efficacy may affect users’ willingness to inter-act with search assistance tools such as relevance feedbackand query suggestions. Self-efficacy is defined by Bandurato be “concerned with people’s beliefs in their capabilitiesto produce given attainments” [2]; self-efficacy measures of-fer an assessment of a person’s confidence in their ability toperform task(s). We would like to study users with a rangeof search self-efficacy levels, and log their interactions with asearch engine, including a variety of search assistance tools.
We have several desiderata when we attempt to evaluatethe quality of search engines for web search users. Firstly wewould like to evaluate over a representative sample of searchusers. An effective way of doing this is with live tests on asearch engine such as described by Anick [1]. However, livetests have two draw-backs: they are risky in that a bad testcould alienate users. In addition, the meaning of user clickand interaction behavior is still an area of active research,and its relationship to goal success and user satisfaction isstill only approximately understood [7, 3].
A second desirable property is to understand the range ofusers well. Finding study populations in universities allowsus to study the users in detail, including surveying theirdemographics, and other properties, but these users maynot be representative of general web searchers. In partic-ular for our study we would like to sample web searcherswith a range of search abilities, orientations to Internet use,and search self-efficacy levels. Getting participants who are
Proceedings of the SIGIR 2010 Workshop on Crowdsourcing for Search Evaluation (CSE 2010) - July 23, 2010 27

representative along all these dimensions is unlikely in aneasily accessible, and relatively homogenous population likestudents at a university or workers in an Internet company.For example, considering our current area of interest, self-efficacy, Kelly [8] measured the search self-efficacy of under-graduate students, and found that they had generally highsearch self-efficacy. To evaluate search on such a populationmay overestimate the ease with which people find things, byunder-representing low search self-efficacy users.
Running tests on crowd-sourcing services such as the Ama-zon Mechanical Turk (AMT) may mitigate the problemswith both university-based and live-search based evalua-tions. However, there are two challenges in evaluation us-ing workers on AMT (“Turkers”). The first is logging thesearches and clicks they perform during the task. Turkersprefer not to download software or toolbars that could beused to track their interactions. The second is understand-ing how representative Turkers are of general web searchers.
In Section 2 we describe search self-efficacy in more de-tail, and give the details of the search efficacy scale we usein this work. In Section 3 we describe our preliminary re-sults from the questionnaire on search self-efficacy of Turkersand compare it to the results obtained by Kelly [8] on un-dergraduate students. In Section 4 we give details of theplatform which we will use to log search interactions in ourfull study. In Section 5 we describe some open design is-sues for our full study, arising from this preliminary studyof Turkers. Finally in Section 6 we describe the full study weare preparing, which will measure the effectiveness of searchassistance tools for searchers with different levels of searchself-efficacy, and different levels of frustration.
2. SEARCH SELF-EFFICACYKelly’s search self-efficacy scale, presented below, covers a
range of activities involved in searching, from general queryformulation to query refinement to results filtering and man-agement. Users are asked to rate their self-confidence on anumber of tasks using a numerical scale from 1 to 10, where1 is totally unconfident and 10 is totally confident. Questionson the scale are as follows:
I can...
1. Identify the major requirements of the search from theinitial statement of the topic.
2. Correctly develop search queries to reflect my require-ments.
3. Use special syntax in advanced searching (e.g., AND,OR, NOT).
4. Evaluate the resulting list to monitor the success ofmy approach.
5. Develop a search query which will retrieve a large num-ber of appropriate articles.
6. Find an adequate number of articles.7. Find articles similar in quality to those obtained by a
professional searcher.8. Devise a query which will result in a very small per-
centage of irrelevant items on my list.9. Efficiently structure my time to complete the task.
10. Develop a focused search query that will retrieve asmall number of appropriate articles.
11. Distinguish between relevant and irrelevant articles.12. Complete the search competently and effectively.13. Complete the individual steps of the search with little
$0.50 HIT $0.05 HITMin 47.00 28.00Median 117.50 92.50Mean 134.89 99.06Max 503.00 123.75Stddev 74.92 50.02
Table 1: Statistics about the time (in seconds) eachuser spent on the surveys.
difficulty.14. Structure my time effectively so that I will finish the
search in the allocated time.
In presenting our results, we use these numbers to reflectefficacy assessments across our participant population.
3. RESULTSWe ran a questionnaire on AMT two different times, each
with 100 Turkers. The questionnaire asked users their ageand gender in addition to the fourteen search self-efficacyquestions presented in section 2. For our first presentationof the questionnaire we paid workers $0.50 to fill out thequestionnaire. The second presentation of the questionnairepaid only $0.05. While the time of month varied, the day ofthe week and time of day when the AMT human-intelligencetask (HIT) was released was the same. We compare thedifferences between these two presentations below.
3.1 DemographicsThe populations showed very similar gender splits and a
somewhat similar spread in ages. The workers that com-pleted the first HIT consisted of 57 males and 43 females.Their ages ranged from 18 to 81, with a mean of 32 years.For the second HIT, there were 55 males and 45 femalesranging in age from 18 to 62 years old, with a mean of 30.
3.2 Time to CompletionEach HIT was released at 8:30pm American Eastern Day-
light Savings Time (EDT) on two different Mondays duringJune 2010. The $0.50 HIT was released first. Within 106minutes, all 100 assignments were accepted by workers. Thesecond HIT was issued a few weeks later and it took 540minutes for all 100 assignments to be accepted—five timesas long. Table 1 shows the statistics for per-worker sur-vey completion in seconds for each of the survey versions.The means are statistically different according to a Welch’stwo-sided t-test (p < 0.0002). We see that workers spentsignificantly more time on the questionnaire in the first pre-sentation, when workers were paid $0.50 rather than $0.05.
3.3 Self-efficacy ResponsesUsers were asked to rate their confidence in being able to
perform each of the fourteen search self-efficacy questionsusing the scale described in Section 2. Figure 1 shows therange of responses for each question for the two presentationsof the questionnaire. We can see that both plots are skewedtowards the higher end, suggesting a ceiling effect.
The mean over average scores per user was 7.63 (sd=1.38;min=3.74; max=10.00) for the $0.50 version of the ques-tionnaire and 7.26 (sd=1.35; min=3.86; max=10.00) for the$0.05 version. The average scores for our two HITs didnot differ significantly according to a two-sided T-test (p =0.054). The scores seem consistent with the mean found
Proceedings of the SIGIR 2010 Workshop on Crowdsourcing for Search Evaluation (CSE 2010) - July 23, 2010 28

●
●● ●
●
● ●
●● ●
●●
●
●
●●●
●
●●●
● ●
●
●
●
Q1 Q2 Q3 Q4 Q5 Q6 Q7 Q8 Q9 Q10 Q11 Q12 Q13 Q14
24
68
10
Questions
Res
pons
es
●
●
●●●●●●
● ● ●
● ●●
●
●
●
●●
● ● ●
Q1 Q2 Q3 Q4 Q5 Q6 Q7 Q8 Q9 Q10 Q11 Q12 Q13 Q14
24
68
10
Questions
Res
pons
es
Figure 1: Boxplots of the responses for each questions from the $0.50 (left) and $0.05 (right) versions of thequestionnaire.
by Kelly [8] over 23 students: 7.319 (sd=1.38; min=5.14;max=9.79).
4. EXPERIMENT PLATFORMOur previous study of search frustration [6] was conducted
in a lab setting, which allowed a variety of custom softwareand sensors to be deployed and logged participants’ search-ing and browsing behavior in detail. Transitioning to an on-line experimental platform like AMT brings with it a cost inthe richness of the information that can be logged, becausethe experimenter can no longer completely control and trackthe participant’s environment.
For our current experiments, we will be using a platformdesigned for AMT that also retains some of the benefitsof a lab study. In the lab, we log searching and browsingbehavior using an open-source browser toolbar, the LemurQuery Log toolbar, which records not only queries and resultclick-throughs on the search engine, but also page views ontarget sites. Unfortunately, it is too much to expect AMTworkers to install new software in their browsers, especiallysoftware that may inadvertently violate the worker’s privacyin other browsing, unrelated to the assigned search task.
Instead, we log the search session by requiring the workerto issue searches and browse results through a proxy thatwe control. We show each Turker a page with a form and animbedded frame, which points to the proxy. A diagram ofthe setup is shown in Figure 2. The form, located in the taskpane, consists of the task to be completed and a text areawhere the user is required to respond to the task. The proxyframe is directed to a modified search engine interface madefor the study. The proxy rewrites all links on every pagethat passes through so that those pages are redirected viathe proxy as well. It injects JavaScript calls so that events,such as pages visited and mouse movements, can be logged.When the user has completed a task, they click the “Next”button in the task pane. This causes several hidden fieldsin the form to be populated with the events logged by theinjected JavaScript. This data can either be uploaded to adatabase or sent to the outer frame in the AMT HIT page.
Alternatively, the proxy server could record a search logas pages pass through it, associating the log with a sessionidentifier. We chose the JavaScript injection approach in-stead because it allows us to capture client side information,
such as mouse movements. One could inject an off-the-shelfanalytics package like userfly1, which generates videos ofbrowsing sessions, but we feel it would be more valuable tostore low-level events directly in the search log for furtheranalysis.
We have tested a variation of this platform by postingdozens of simple search tasks on AMT (such as “What isthe record for the fastest mile run?” and “Who is the presi-dent of Harvard University?”), with a proxy frame includedin the task, and successfully captured search logs from userson a variety of browsers. Two preliminary observations canbe made, relevant to running these kinds of experiments onAMT. First, AMT workers copy-and-paste heavily, in orderto work as efficiently as possible. As a result, the first queryin many logs is the exact wording of the question, copieddirectly from the task frame into the search box. In ex-periments, it may be desirable to inhibit direct copying bypresenting the task as an image, rather than as text. Sec-ond, a few workers answered the task without generatingany search log, suggesting either that they already knew theanswer or that they searched for it outside the proxy frame(contrary to the instructions of the task). This problemcould be addressed by requiring use of the proxy frame be-fore the answer can be submitted – e.g., by requiring thatsome part of the answer be selected, copied, and pasted fromthe proxy frame, which can be observed by selection events.
5. OPEN DESIGN ISSUESWe are currently in the process of completing the design
for our search self-efficacy studies, and while we have de-termined there is much to be gained from using AMT toconduct this study, we have some open design issues to ad-dress.
5.1 ScreeningWe would like to include web searchers with both low and
high self-efficacy in our study. AMT has the advantage of al-lowing a very large potential pool of study participants. Wecan administer the search self-efficacy scale as a screeningtool, then administer our search assistance experiment to astratified sample of users at different levels of search self-efficacy, ensuring that we screen sufficient numbers of users
1http://www.userfly.com
Proceedings of the SIGIR 2010 Workshop on Crowdsourcing for Search Evaluation (CSE 2010) - July 23, 2010 29

1. Re−writes links to pass back through the proxy2. Injects JavaScript calls to functions in the outer window
+ mouse movements + queries entered + pages clicked + pages viewed + scrolling + anything else that JavaScript can capture
− this can keep track of, with time stamps:
Next
Task: Answer:
(a.) The task pane
(b.) The proxy frame
Figure 2: The proxy setup for the study.
to find enough at low self-efficacy levels. However, from ourinitial investigations, the range of search self-efficacy seen inTurkers appears to be similar to those of the undergraduatepopulation [8].
5.2 Time to CompletionTime to completion raises questions of several kinds. One
is consideration of the hourly wage being paid. An impor-tant ethical question we may want to examine is how muchpeople are being paid for their work [9]. If the median timeto complete a questionnaire is used as a marker, the hourlywage paid for the two HITs issued for this study were $15.31and $1.95 per hour, respectively. The latter was an alarm-ing number, and so we paid a bonus of $0.17 to each workerto increase the median rate to $8.55 per hour, the highestminimum wage in the United States as reported by the U.S.Department of Labor2.
The second concern with time to completion is how muchattention users give to their answers. For example, is theTurker answering the self-efficacy part of the questionnairein 28 seconds actually reading the questions, or just fillingit in arbitrarily as quickly as possible. This point is relatedto “instrument reliability”, our next design issue.
5.3 Instrument ReliabilityThe questionnaire we presented to the Turkers contained
only questions for which a high score means high self-efficacy.This does not provide us with any error checking. As men-tioned in Section 4, Turkers have shown a tendency to com-plete tasks as efficiently as possible, which may include min-imizing mouse movements. This means that one way tocomplete the questionnaire is simply to select items by lo-cation on the screen. We intend to experiment with differ-ent question wording in our full study. One technique thatpotentially enables identification of people who may not beengaging in depth with questions on surveys has been to pro-vide questions with both positively and negatively phrasedversions [2]. In our own work, this approach has allowed usto identify and filter out survey respondents whose answerprofiles suggest they are selecting options so as to optimizetime-to-completion and are therefore unlikely to be provid-ing useful data [4].
2http://www.dol.gov/whd/minwage/america.htm
5.4 TruthfulnessWhile self-efficacy relates only to self-perception and not
performance, we would like users’ honest opinions abouttheir self-efficacy. If Turkers view the questionnaire as ascreening mechanism akin to a job interview, they may be in-centivized to report higher self-efficacy than they truly feel.This is clearly an issue with all surveys of this kind, whereparticipants often has a sense of what are “desirable” re-sponses [2]. One way for us to address this is again througha slightly different phrasing on the questions such that desir-able responses are not so clearly implied by the context (e.g.,search ability is clearly a good skill to have and stronglyaligned with being online—so Turkers likely skew towardsseeing search prowess as desirable).
6. NEXT STEPSThe work described here gives us the ingredients needed
for our full study. Our next steps are to complete the studyusing the following design:
• Modify the search self-efficacy scale so we can estimatereliability
• Screen Turkers with cross-checked search self-efficacyassessments to create a stratified sample by search self-efficacy
• Integrate search assistance mechanisms into the Turkersearch logging platform
• Design a post-survey about the level of task difficulty• Evaluate the effects of search assistance, taking into
account searcher self-efficacy and task difficulty
7. REFERENCES[1] P. G. Anick. Using terminological feedback for web
search refinement: a log-based study. In SIGIR, pages88–95. ACM, 2003.
[2] A. Bandura. Self-efficacy: Toward a unifying theory ofbehavioral change. Psych. Review, 84(2):191–215, 1977.
[3] O. Chapelle and Y. Zhang. A dynamic bayesiannetwork click model for web search ranking. In Proc. ofWWW, pages 1–10, 2009.
[4] C. Cheshire, J. Antin, and E. Churchill. Behaviors,adverse events and dispositions: An empirical study ofonline discretion and information control. JASIST,61(7):1487–1501, 2010.
[5] D. Compeau and C. Higgins. Computer self-efficacy:Development of a measure and initial test. MISQuarterly, 189(211), June 1995.
[6] H. Feild, R. Jones, and J. Allan. Predicting searcherfrustration. In Proc. of SIGIR, 2010.
[7] A. Hassan, R. Jones, and K. L. Klinkner. Beyond DCG:user behavior as a predictor of a successful search. InProc. of WSDM, pages 221–230, 2010.
[8] D. Kelly. A preliminary investigation of searchself-efficacy. Technical Report TR-2010-01, U. of NorthCaroline School of Information and Library Science,2010.
[9] K. Mieszkowski. “I make $1.45 a week and I love it”.Salon.com, 2006.
Proceedings of the SIGIR 2010 Workshop on Crowdsourcing for Search Evaluation (CSE 2010) - July 23, 2010 30

Crowdsourcing a News Query Classification Dataset
Richard M. C. McCreadieDepartment of Computing
ScienceUniversity of GlasgowGlasgow, G12 8QQ
Craig MacdonaldDepartment of Computing
ScienceUniversity of GlasgowGlasgow, G12 8QQ
Iadh OunisDepartment of Computing
ScienceUniversity of GlasgowGlasgow, G12 8QQ
ABSTRACTWeb search engines are well known for aggregating news verticalcontent into their result rankings in response to queries classifiedas news-related. However, no dataset currently exists uponwhichapproaches to news query classification can be evaluated andcom-pared. This paper studies the generation and validation of anewsquery classification dataset comprised of labels crowdsourced fromAmazon’s Mechanical Turk and details insights gained. Notably,our study focuses around two challenges when crowdsourcingnewsquery classification labels: 1) how to overcome our workers’lackof information about the news stories from the time of each queryand 2) how to ensure the resulting labels are of high enough qualityto make the dataset useful. We empirically show that a worker’slack of information about news stories can be addressed throughthe integration of news-related content into the labellinginterfaceand that this improves the quality of the resulting labels. Overall,we find that crowdsourcing is suitable for building a news queryclassification dataset.
General Terms: Performance, Experimentation
Keywords: News Query Classification, Crowdsourcing, VerticalSearch
1. INTRODUCTIONGeneral-purpose Web search engines are well known for inte-
grating focused news vertical content into their search rankingswhen the user query is judged as holding some news-related in-tent [8, 12]. In particular, every user query submitted is classified aseither having a news-related intent or not. If so, the Web search en-gine will aggregate appropriate news content into the search rank-ing returned. However, while it is likely that commercial searchengines have large internal datasets for evaluating their news queryclassification performance, there currently exists no publicly avail-able dataset upon which news query classification approaches canbe evaluated and compared.
On the other hand,crowdsourcing [13] has been championedas a viable method for creating datasets both quickly and cheaply,whilst still maintaining a reasonable degree of quality [1]. We hy-pothesise that crowdsourcing is a suitable means to generate a newsquery classification dataset, which will be useful when investigat-ing news query classification using evidence from various sources,e.g. the full query-log. In this paper, we detail the generation andvalidation of a such a dataset comprised of real user queriesfroma search engine query log and associated news classificationlabelscrowdsourced using Amazon’s Mechanical Turk.
In our study, we follow an iterative design methodology, as rec-ommended in [2], during the creation our news query classification
Copyright is held by the author/owner(s).CSE’2010, July 23rd, 2010, Geneva, SwitzerlandACM XXX-X-XXXXX-XXX-X/XX/XX.
dataset. We propose multiple interfaces for crowdsourced querylabelling and evaluate these interfaces empirically in terms of thequality of the resulting labels on a small representative sample ofuser queries from a Web search engine query log. Later, we usethebest performing of these interfaces to generate our final news queryclassification dataset comprised of a larger query sample from thesame log. We report the quality of our resulting news query clas-sification dataset in terms of inter-worker labelling agreement andaccuracy with regard to labels created separately by the authors.Moreover, we further investigate its quality in the form of an ad-ditional agreement study, in which crowdsourcing is leveraged forquality assurance.
Notably, one of the most interesting aspects of news query classi-fication labelling is the temporal nature of news-related queries [16].In particular, a query should only be labelled as news-related ifthere was a relevant noteworthy story in the news around the timeeach query was made. However, the query log we employ datesback to 2006 [7], hence there is no guarantee that our workerswillremember what the major news stories were from the time of eachquery. In this work, we empirically investigate the effect that thishas on labelling quality. Moreover, we propose the integration ofnews headlines, article summaries and Web search results into theinterface seen by the workers to address this problem.
The main contributions of this paper are four-fold: firstly,weexamine the suitability of crowdsourcing for the creation of a newsquery classification dataset; secondly we both propose and evaluatemethods to overcome the temporal nature of news queries describedabove; thirdly, we investigate a novel application of crowdsourcingas a quality assurance tool; and lastly we propose some best prac-tices based on experience gained from creating this dataset.
The remainder of the paper is structured as follows. In the nextsection, we further motivate the need for a news query classificationdataset as well as describe related work in news-aggregation. Sec-tion 3 provides a brief background into crowdsourcing in general,as well as recent studies that have used crowdsourcing. In Sec-tion 4, we define the methodology used to create our news queryclassification dataset, discuss query sampling and describe the in-terfaces evaluated later. Section 5 covers our experimental setup. InSection 6, we empirically determine the best of our proposedinter-faces, report on the quality of the news query classificationdatasetproduced and provide some best practices when crowdsourcing. Fi-nally, in Section 7, we provide concluding remarks.
2. NEWS AGGREGATIONNews aggregation is an important problem in Information Re-
trieval (IR), with as much as 10% of queries possibly being news-related [5]. Moreover, classifying queries as news-related or not isa challenging task. In particular, the news-relatedness ofa query isnot solely dependent upon the terms it contains, but also themainnews stories of the time. Hence, two identical queries made at dif-
Proceedings of the SIGIR 2010 Workshop on Crowdsourcing for Search Evaluation (CSE 2010) - July 23, 2010 31

ferent times may not always receive the same label. For example,the query ‘ash’ normally would not be seen as being news-related,since the dominant interpretation is the rock band with the samename. However, in April 2010 the query suddenly became so, asan ash cloud grounded aircraft in Europe and the United States.Furthermore, there are also notable challenges when classifyingqueries as news-related or not soon after a story breaks. Indeed,as news-related queries are now being submitted to Web searchengines mere minutes after a newsworthy event occurs [19], newapproaches need to be developed which can correctly classify such‘breaking news’ queries [16]. Hence, the need is clear for a datasetas a basis upon which to investigate these classification challenges.
In addition, news aggregation has recently become a somewhathot topic in IR. In particular, Arguelloet al. [3] investigated theconstruction of offline classifiers for vertical content in the pres-ence of user feedback, while Diazet al. [8] investigated the onlineaggregation of news content using explicit user feedback. However,these studies use private datasets to evaluate performance.
Our goal is to produce a standard dataset such that news queryclassification approaches both old and new can be easily evalu-ated and compared. We examine the suitability of crowdsourcingto build such a dataset from a query log provided by a real Websearch engine. In the following section, we provide a brief back-ground into crowdsourcing and motivate its application forcreatinga news query classification dataset.
3. CROWDSOURCINGIn this work, we propose to build a news query classification
dataset using crowdsourcing [13]. Crowdsourcing is an attractiveoption for researchers and industry alike as a method for datasetgeneration. In particular, simple repetitivejobs, e.g. query la-belling, can be completed at a relatively small cost, and often veryquickly [1]. However, crowdsourcing has also been the subject ofmuch controversy as to its effectiveness, in particular with regard tothe lower quality of work produced [4], the lack of motivation forworkers due to below-market wages [6] and susceptibility tomali-cious workers [10]. In general, the advantages of generating a newsquery classification dataset using crowdsourcing are easily quanti-fied. Indeed, the total cost of the experiments reported in this paperis less than $200, with even the longest single job taking less than3 days to complete. Still, the quality of the resulting labels maybe questionable, due either to insufficient worker understanding ofthe job given to them, or a lack of important information needed tocomplete the job satisfactorily.
In this work, we use CrowdFlower, which is an on-demand labourwebsite providing job creation, monitoring and analyticalserviceson top of crowdsourcing marketplaces, most notably Amazon’sMechanical Turk (MTurk). MTurk is a service that can providerealhuman judgements for a variety of simple repetitive jobs. Inpar-ticular, the crowdsourcer defines ahuman intelligence task (HIT),where aworker views an interface containing instructions on howto complete the HIT, typically along with some content to be pro-cessed, and then uses the same interface to provide feedbackto thesystem. Workers are normally paid a small sum of money or micropayment for each HIT they complete.
Notably, there have been multiple studies into crowdsourcingwith MTurk to date, which provide useful information for thosewishing to use crowdsourcing for IR-related tasks. In particular,Snowet al. [21] and Callison-Burch [6] investigated the accuracyof labels generated using MTurk within a natural language pro-cessing context. They concluded that ‘expert’ levels of labellingquality can be achieved by having multiple workers completeeachcrowdsourcing job and taking a majority label. Indeed, for the ex-periments reported in this paper, we require that three individualworkers label each query, taking the majority result.
Date Time Query Query ID2006-05-01 00:00:08 What is May Day? 37afe7af832649d22006-05-08 14:43:42 protest in Puerto rico 71ddb381f574410e
Table 1: Two example queries from the MSN Web search querylog for May 2006.
Kittur et al. [14] also examined labelling quality when moder-ating Wikipedia pages. Their results highlight the need to validatethe output produced by each worker, pointing out that some work-ers produce random or malicious labels. Following this recommen-dation, for both query samples used in this paper we create groundtruth labels to vet our workers’ output in an online manner. In thisway, we can detect and then eject poorly performing workers fromour jobs early on in the evaluation, saving us money and hopefullyimproving the quality of the final labels produced. Indeed, we laterempirically show through experimentation the effect that validationhas on the quality of our resulting labels.
Lastly, Alonsoet al. [1] tackled the related task of building aTREC-style ad-hoc test collection using crowdsourcing. Our workdiffers from this, in that we propose to have workers label queriesas news-related or not, instead of labelling a document’s relevanceto a query. Moreover, our news query classification task alsohas anovel temporal component which needs to be addressed, i.e. thata query’s news-relatedness is dependent not only on the terms itcontains, but also on the news stories that were important atthetime the query was issued. Furthermore, unlike in [1], we alsoperform an empirical analysis of the produced labels’ quality.
Taking this prior work into account, in the next section, we detailthe methodology and data used to generate our news query classi-fication dataset. Most notably, the creation of our two querysets,including validation queries, and the five job interfaces that are usedduring evaluation.
4. METHODOLOGYThe task that we address in this paper is the creation of a general,
high quality dataset to evaluate approaches to news query classifi-cation. In particular, the dataset in question is comprisedof a setof queries, each to be labelled as holding a news-related intent ornot. The performance of any news query classification approachcan then be evaluated on how well it performs against the dataset.In this work, we use real queries sampled from American usersof the MSN Search engine (now Microsoft Bing) query log from2006 [7], while we propose to generate the news query classifica-tion labels through crowdsourcing. Two example queries from theMSN query log are shown in Table 1. In particular, for each userquery q from the set of all queries to be included in the dataset,we want our crowdsourced workers to classifyq as holding a news-related intent or not for the timet, i.e. the time the query was made.
However, there are some important challenges that we need toaddress during the crowdsourcing of our dataset to ensure that theresulting labels are of a high enough quality for the datasetto beuseful. Firstly, we identify the possibility of workers choosing la-bels in a random or malicious manner, which we propose to ad-dress in two ways, namely through having multiple workers labeleach query in addition to worker validation. Secondly, we also notethat our workers’ lack of information about the main news storiesfrom the time of the query may hinder labelling quality. We pro-pose to mitigate this by integrating news content from the time ofthe query into the job interface. Indeed, we empirically examinethe integration of both news article content, i.e. headlines and newssummaries, and Web search engine result rankings into the job in-terface, to determine which best overcomes the workers’ lack ofinformation and so provides the highest quality labels.
In order to investigate these challenges, and indeed our proposedsolutions to them, we follow an iterative design methodology [2].
Proceedings of the SIGIR 2010 Workshop on Crowdsourcing for Search Evaluation (CSE 2010) - July 23, 2010 32

In particular, we begin by creating a small set of queries of approx-imately 1
10th of the final desired dataset size for testing purposes.
This query set is referred to as thetestset. This testset is advanta-geous as it allows us to much more cheaply and quickly investigatethe challenges described earlier. Indeed, it is important to note thatprototyping, while a valuable tool when crowdsourcing, candra-matically increase the total cost of the task one wishes to address.Using the testset, we empirically evaluate the effect of validationusing a baseline interface and subsequently test our proposed alter-native interfaces integrating news content in an iterativemanner.
Having determined the most effective job design, we then createa full size query sample, denoted thefullset, and crowdsource la-bels for it, hence creating our final dataset. We lastly evaluate thequality of this dataset in terms of inter-worker labelling agreement,accuracy with regard to labels created manually by the primary au-thor of this paper and also in the form of a meta-agreement studyperformed using crowdsourcing. In the remainder of this section,we describe our query sampling and worker validation approaches,in addition to the interfaces used in later experiments.
4.1 Query Log SamplingRecall that we propose to use two sets of queries during our ex-
perimentation: a small query set, which we refer to as the testset, aswell as a larger set of queries to be included in our final dataset, de-noted the fullset. Importantly, the MSN Search engine querylog [7]contains almost 15 million real user queries spread over thecourseof May 2006, which is many times the size of either of our desiredquery sets. Indeed, such a large query set could not be exhaustivelylabelled within a reasonable time-frame, even with crowdsourcing.Instead, we propose to sample the MSN query log to create our twoquery sets.
Notably, there are two desirable properties that we wish oursam-pled query-sets to hold. Firstly, we wish our samples to berepre-sentative [18]. This means that the sampling method chosen shouldmaintain the statistics of the query log as a whole. Secondly, oursamples need to beunbiased [17], i.e. every query within the querylog should have an equal chance to be selected. Should the result-ing sample lack either of these properties, our final datasetwill beof limited use, as the dataset would not represent the querying be-haviour of real users.
A well-known and straightforward sampling strategy is randomsampling [22]. In random sampling, the query log is considereda ‘bag’ of queries. Queries are then iteratively selected atrandomfrom the query log without replacement. Notably, random sam-pling is unbiased. Indeed, each query has an equal chance of beingselected. However, in practice, random sampling often produces anunrepresentative sample, as there is no guarantee that the selectedqueries will be spread over the entire log [17].
An alternative sampling strategy that has proved popular isknownas systematic sampling [17]. Here, the query log is considered asa time-ordered stream, where queries are iteratively selected basedupon a time interval. For example, given a time interval of threeminutes, one query will be selected for every three minutes of log.A systematic sampling approach is advantageous, in that a fairlyrepresentative sample of the query log will be produced, with sam-pled queries being spaced evenly across the time-range of the log.On the other hand, systematic sampling is not unbiased, as theprobability of a query being selected is independent from the den-sity of queries within each time interval [18]. Hence, a query withina very dense time interval has a much lower probability of being se-lected that one from a sparser time interval.
In light of the drawbacks of these two prior approaches, the Pois-son sampling strategy has been proposed as a means to create bothan unbiased and representative sample [18]. In particular,Pois-son sampling also treats the query log as a time-ordered stream.
Poisson Sampling - Pseudo-Code1: Input
query log: a temporally ordered stream of queriesα: a parameter to control global the sampling ratequerylogsize: the number of queries inquery logµ, ̟ andς: parameters to control the sampling rate over time
2: Outputquery-set: a set of sampled queries
3: IntegernumToSkip = 10004: Integerpos = 05: Integerskipped = 06: for each queryq in query log7: if skipped == numToSkip8: addq to query-set9: IntegernewNumToSkip = 010: double[]values11: whilevalues[newNumToSkip] ≤ exp(numToSkip) loop12: newNumToSkip = newNumToSkip + 113 values[newNumToSkip]=rand(0,1)*values[newNumToSkip-1]14: end loop15: Doubleβ = cos(((pos/querylogsize)*µ)+̟)+ς16: numToSkip = numToSkip * α * β17: skipped = 018: end if19: skipped = skipped + 120: pos = pos + 117: end loop
Figure 1: Pseudo-code interpretation of Poisson sampling.
Queries are then sampled probabilistically in an iterativemannerbased upon the density of queries within the current time interval.The idea is that, for a fixed time-interval, the number of queriessampled should reflect the query density, such that each query hasan equal chance to be selected. For example, during a dense sectionof the query log, the probability of being sampled will be higher,such that the probability of sampling any query remains constantover time. Hence, we choose Poisson sampling to sample bothquery-sets used in this paper. The pseudo-code of our implementa-tion of this sampling strategy is shown in Figure 1.
Notably, to control the overall rate at which we sample the logunder this approach, and hence determine the final sample size, weintroduced a parameterα on the distance between sampled queries,referred to asnumToSkip in Figure 1. Furthermore, we note thatqueries near the start and end of the query log might be less usefulwhen using the final dataset to evaluate approaches to news queryclassification. In particular, approaches that leverage evidence fromother temporally close queries from the log [8] may be unfairlypenalised due to a lack of available surrounding queries. Assuch,we favour our sampling towards the centre of the query log usinga second parameterβ on numToSkip. Specifically, theβ value isdependent of the current position in the query log.numToSkip willbe increased for queries near the start and end of the query log,hence the number of sampled queries will be less, whilenumToSkipis decreased for queries near the centre of the query log, therebyincreasing the number of queries sampled. The exact distributionof β values is defined in terms of three parameters,µ, ̟ and ς,which were set experimentally to 3, 1.6 and 1.5 respectively, suchthat aβ distribution with the above properties was observed.
Using this sampling method, we created the two aforementionedquery-sets, i.e the testset and the fullset, from the MSN query log.In particular, through experimentation we selected anα value of 3to create the fullset, resulting in a sample of just over 1000of the 15million original queries. However, we also noted that when creatingthe testset, the resulting sample was very sparse, i.e. onlyaround 3queries per day were sampled on average in our tests. Moreover, welater evaluate some interfaces that include news-related content forthe day of a set of queries. To ensure that jobs have enough queriesfor a given day, we instead limit our Poisson sampling approach
Proceedings of the SIGIR 2010 Workshop on Crowdsourcing for Search Evaluation (CSE 2010) - July 23, 2010 33

MSN query log fullset testsetTime Range 01/05 to 31/05 01/05 to 31/05 15/05
Number of Queries 14,921,286 1206 91Mean Queries per Day 481,331 38.9 91Mean Query Length 2.29 2.39 2.49
Table 2: Statistics for the MSN query log from 2006, as well asthe sampled testset and fullset.
fullset testsetTime Range 01/05 to 31/05 15/05
Number of Queries 61 9Mean Queries per Day 1.97 9% of Target Query-set 5% 10%News-Related Queries 47 5
Non-News-Related Queries 14 4
Table 3: Statistics for the validation sets created for the testsetand fullset.
to only those queries from a single day. In particular, we useMay15th, which is the middle of the query log. In this way, we create atestset which is representative of a single day only, but where eachjob contains enough queries for it to be realistic. The assumptionwe make is that worker labelling performance will be similarfordifferent days. With this restriction in place, we create our testsetusing anα value of 2, resulting in a query-set of approximately1
10th the size of the fullset. Statistics for both the query-sets created
are shown in Table 2.
4.2 Validation of Worker LabellingEarlier, we raised the possibility that workers might labelour
queries in a random or malicious manner [14]. Indeed, it is logicalfor a worker to try to maximise their profit while minimising theeffort required if there is no penalty in doing so [10]. This is es-pecially acute in our case, as the binary labelling jobs thatwe askour workers to complete can be easily and quickly accomplishedby selecting labels at random. Hence, to address this, we proposeto perform online validation of our worker labels against a set ofground-truth query-label pairs. The idea is that should a workertry and ‘game’ our system by randomly labelling queries, their ac-curacy on the ground-truth queries will be low. As such, we canidentify and then eject those workers from our jobs. This is ad-vantageous not only because ‘bad’ worker labels can be ignored,thereby improving the quality of the resulting dataset, butworkersejected on such grounds are left un-paid.
To perform this type of validation, we create one validationsetcomprised of ground-truth queries and associated labels for eachof the two query-sets previously described. As recommendedbyCrowdFlower, which supports this form of validation, we createvalidation sets of between 5% to 10% of the target query-set size1.Notably, when selecting validation queries, it is important to con-sider the background probability of queries belonging to each class.For example, in our case, at best only 10% of queries might benews-related [5]. Therefore, if we choose a representativedistribu-tion for our validation set, then just by labeling each queryas non-news-related a worker would achieve 90% accuracy. Instead,wefavoured our validation sets toward the news-related class, therebyforcing our workers to pick out the validation queries from thepredominently non-news-related background queries. Statistics forour two validation sets are shown in Table 3.
4.3 Query Labelling InterfacesRecall that the job that we want our workers to complete is the
labelling of the queries in our aforementioned query sets asnews-
1http://crowdflower.com/docs/gold
Figure 2: The basic instructions shown to our workers for eachjob.
Figure 3: The basic interface with which our workers labeleach query.
related or not. However, due to the temporal nature of news, thetime at which each query was made must also be considered. In par-ticular, a query should only be labelled as news-related if there wasalso a relevant noteworthy story in the news at the time the querywas made. Indeed, even though two identical queries from differenttimes may be judged, there is no guarantee that they should beas-signed the same label. To this end, we need to design an interfacecomprised of two distinct components, namely: a set of instruc-tions explaining the job the worker is to complete; and a labellinginterface with which the user labels each query.
With this in mind, we designed our basic job interface as shownin Figures 2 and 3. In particular, the instructions we provide toeach worker are presented by Figure 2. Notably, the first paragraphis a summary of the job and is displayed to workers searching foravailable jobs to complete. Hence, it is important that thissuc-cinctly describes what the worker will be asked to do. The sec-ond paragraph further clarifies the meaning of news-relatedness,as news-relatedness can be subjective in nature. For example, aworker might label the query ‘ipad sales’ as being news-related atthe time this paper was written, as there was a news story indicat-ing that the Apple iPad had sold over 2 million units. However,a worker uninterested in technology or holding anti-Apple viewsmight label it otherwise.
Figure 3 shows the labelling interface with which our workerswill interact during a job. Importantly, this labelling interface isreplicated for each query. In particular, the workers are shown aquery in addition to the date and time it was made, and asked tojudge that query as being news-related or not. This interface com-bination is referred to asBasic.
However, earlier we identified our workers’ lack of informationabout the news stories from the time of the queries as a factorwhichmight hinder labelling quality. Indeed, we hypothesise that ourBa-sic interface, as described above, will be insufficient to garner high-quality judgements, as our workers lack the information needed toaccurately judge queries as news-related or not. Furthermore, thequery log that we use dates from 2006, hence, our workers willlikely remember little from that far back. Moreover, the nature ofcrowdsourcing, in particular the lack of worker motivation, makesit unlikely that workers will independently attempt to address this,e.g. by searching news archives.
To address this issue, we propose to incorporate news-relatedcontent from the time of the queries into our interface design. Ourintuition is that by providing the workers with informationaboutthe news stories from around the time of the query, the workerswill be able to make better informed judgements, hence increasing
Proceedings of the SIGIR 2010 Workshop on Crowdsourcing for Search Evaluation (CSE 2010) - July 23, 2010 34

Headline:32 Dead in Iraq Attacks
Summary:Two suicide car bombers tore into a checkpoint for Baghdad’s airport, killing at least 14 people andwounding 16. It was the first bomb attack in nearly a year aimed at the airport, and the worst in aspree of violent assaults that left at least 32 people dead on Iraq’s deadliest day in weeks.
Figure 4: Example headline and news summary extracted from aNew York Times article.
Figure 5: Examples of additional content added to the labellingcomponent of theHeadline_Inline interface.
labelling quality. In particular, we identify two sources of news-related content that our workers might find informative, i.e. newsarticles (headlines and/or news summaries) and Web search results.
Initially, to supplement our interface with news article content,we use a collection of news headlines and article summaries fromthe time of the query log, as provided by the New York Times. Anexample headline and associated news story summary is showninFigure 4. It is likely that the more relevant news-related informationour workers have available the better they can judge each query. Forinstance, providing the summary in addition to the headlinemightenable our workers to identify queries that do not contain terms inthe headline but were related to the news story. Consider, for exam-ple, the news summary shown in Figure 4. A worker might be ableto label the query ‘baghdad airport’ as news-related havingread thenews summary but would be unlikely do so from the headline alone.
However, we suspect that the amount of useful information wecan provide our workers with is limited, as overloading the inter-face with surplus irrelevant content will cause our workersto ei-ther ignore it or reject the job in the first place. To test this, weexperiment using three alternative interfaces, varying the level ofsupporting information provided.
In the first interface, we include 12 news headlines, like theoneshown in Figure 4 within the job instructions. This providestheworker with some news story context from the time of the queriesbeing labelled. The resulting interface is denotedHeadline.
For our second interface, we test the effect that the level ofdetailof information provided to our worker has on labelling quality. Inparticular, in addition to the headlines used in the above interface,for each of those headlines, we also included its associatednewsstory summary. This interface we denoteHeadline+Summary.
However, we are concerned that our workers might not readthe headlines provided in the instructions. So, for our third inter-face, instead of including the headlines within the instructions, wemoved them into the labelling interface for each query. An exampleof this interface is shown in Figure 5. Notably, the headlines willalways be onscreen at the time the worker makes each judgement,hence making it more likely that our workers will refer to theseheadlines when judging. We denote this interfaceHeadline_Inline.
As an alternative to providing news headlines, we examine theusefulness of incorporating Web search results. In particular, we
Figure 6: Examples of additional content added to the labellingcomponent of theLink-Supported interface.
propose to provide automatically generated search links tothe threetop search engines, i.e. Bing, Google and Yahoo!, for each queryand time. Each link initiates a search by the associated search en-gine. The query for each search constitutes the original user queryand the date that the query was submitted, e.g. ‘4th May 2006Moussaoui Verdict’. In this way, we hope that the Web search re-sults will be similar to those that might have been returned for theoriginal query at the time it was made. The modified labellingin-terface is shown in Figure 6. Note that we do not make the targetof the search link immediately clear by obscuring it behind a‘clickhere’ anchor. We do this on the suspicion that, should we showourworkers the search engines, then only the worker’s favouredenginewould be clicked. This interface is referred to asLink-Supported.
Interestingly, theLink-Supported interface also provided us withthe opportunity to gain additional feedback from our workers. Inparticular, as we are requesting our workers to inform theirdeci-sion based on Web search results, we can also gain useful feedbackfrom the search result that the worker based their decision on (ifany). Hence, for this interface we also ask our worker to providethe URL of the appropriate Web result. We hypothesise that thiscan later be used to validate the judgements through examinationof the supporting URLs. Indeed, we investigate this later inSec-tion 6.5.
5. EXPERIMENTAL SETUPIn this section, we detail the experimental setup for our crowd-
sourcing experiments. In particular, Section 5.1 defines the specificresearch questions that we address in our experiments, while inSection 5.2, we describe the settings we used for our crowdsourcingjobs. Lastly, Section 5.3 describes the evaluation measures used.
5.1 Research QuestionsIn Section 6, we investigate the following research questions:
1. How well do users agree on news query classification labelsusing our basic interface? (Section 6.1)
2. What effect does online validation of the worker labels haveon overall label quality? (Section 6.2)
3. Are any of the proposed alternative interfaces effectiveatcountering our workers’ lack of information with regard tothe main news-stories of the time? (Section 6.3)
Proceedings of the SIGIR 2010 Workshop on Crowdsourcing for Search Evaluation (CSE 2010) - July 23, 2010 35

Interface Time per query Total costBasic 5s $1.30
Headline 10s $4.39HeadlineInline 10s $4.59
Summary 15s $5.56Link-Supported 22s $8.78
Table 4: Mturk estimated worker time to spend per query andthe cost incurred over the 100 query testset.
4. Is the resulting news query classification dataset of goodqual-ity? (Section 6.4)
5. Is crowdsourcing useful for post labelling quality assurance?(Section 6.5)
5.2 Crowdsourcing SettingsWhen submitting a job, there are multiple variables which deter-
mine how it is handled by MTurk. Firstly, the crowdsourcer mustspecify the amount paid to each worker on a per job basis. In ourcase, we paid workers based on the estimated amount of time itwould take to judge each query at a rate of $2 per hour. The esti-mated time per query and the resulting cost paid on a per-interfacebasis for the testset queries are shown in Table 4. Secondly,thecrowdsourcer has the option to limit the worker pool based onge-ographical location. Since the MSN query log is predominantlyAmerican, we limited our worker pool to the USA only. To con-trol validation, we set the validation cutoff, i.e. the level at whicha worker is ejected from the evaluation, to 70% (should they getmore than 30% of the validation queries wrong they are ejectedfrom the evaluation without remuneration). Lastly, we set the levelof redundancy for judging our queries at three, whereby eachquerywill be judged by three unique workers. Note that we do not usethe four redundant judgements recommeded by Snowet al. [21], aswe wish to take a majority vote to determine the final label.
5.3 MeasuresIn this work, we measure the quality of our crowdsourced la-
bels in two distinct ways. Firstly, we measure our worker agree-ment, i.e. how often our workers assigned the same label to eachindividual query. Our intuition is that should our workers oftenagree about which queries are news-related, then our confidencein the labels produced increases. In particular, we employ twowell-known measures for evaluating agreement in user evaluations:Free-Marginal Multirater Kappa [20], denotedκfree; and FleissMultirater Kappa [11], denotedκfleiss. Notably, the two Kappaagreement measures differ in the way each calculates the prob-ability of agreement occurring by chance. Free-Marginal Multi-rater Kappa assumes that the chance of selecting a class is equalto one over the number of classes, i.e. 50%, while Fleiss Multi-rater Kappa takes into account the relative size of the classes, i.e.in our case that queries are more likely to belong to the non-news-related class. Indeed, recall that at best only 10% of queries mightbe news-related [5].
The second manner in which we evaluate the quality of our crowd-sourced labels is against labels manually generated by the primaryauthor of this paper. Our intuition is that the labels we gener-ate will have a higher probability of being correct due to a longertime spent, in addition to news article access from the time of thequeries. In short, we use the labels generated as an ‘expert’ground-truth. From this, we report standard classification measures, preci-sion and recall. To provide a combined measure, we also reportoverall classification accuracy.
It is worth noting that labelling was based upon knowledge ofthemainstream news stories of the time. However, there exist querieswhich refer to news events not reported in mainstream news, e.g.
a local football match, these are sometimes known as to as ‘tailevents’ [19]. However, we believe that such tail events may bemore difficult for assessors, leading to disagreement between ourground truth and the workers.
6. EXPERIMENTS AND RESULTSIn this section, we study the suitability of crowdsourcing as a
means to generate labels for our news query classification dataset.In particular, Section 6.1 investigates the initial level of agreementobserved between workers when labelling queries as news-relatedor not. Section 6.2 examines the effect of online validationofworker labelling quality. In Section 6.3, we investigate the alter-nate interfaces previously described in terms of labellingquality.In Section 6.4, we evaluate the quality in terms of agreementandaccuracy on our final news query classification dataset, whilst weperform an additional meta agreement study into our dataset’s qual-ity in Section 6.5.
6.1 Worker AgreementFollowing our methodology described earlier in Section 4, we
begin by examining the workers’ labelling agreement on the smallertestset. In particular, we wish to establish that crowdsourcing is in-deed suitable for labelling queries as news-related or not,beforecommitting to a labelling job over the fullset comprised of over1000 queries. To this end, we evaluate worker agreement whenla-belling the queries of the testset using theBasic interface describedin Section 4.3. A high level of agreement indicates that the re-sulting labels are of good quality, hence the labelling method issuitable. Importantly, there is no de facto standard for defining ac-ceptable or significant levels of agreement. However, Landis andKoch [15] state that Kappa values over 0.61 indicate substantiallevels of agreement, while values over 0.81 represent almost per-fect agreement.
Table 5 reports two Kappa agreement measures,κfree andκfleiss
for labelling the testset queries with ourBasic interface. As can beobserved from the table, labelling using our basic interface pro-vides a low level of agreement -κfleiss = 0.2647 - when workerpooling is restricted to the USA only2. This level of agreement ismarkedly lower than that which we would judge acceptable, hencein the following sections we examine methods to improve labellingquality in terms of agreement.
6.2 Importance of ValidationPrevious work into crowdsourcing with MTurk has highlighted
the importance of result validation [14], i.e the checking of workerinput against a ground truth to prevent random or malicious results.Hence, we examine the importance of validation for our news querylabelling job. In particular, the 9 validation queries are interspersedwith the 91 queries of the testset. Workers are examined in termsof the percentage of the validation queries that they correctly label.
The first two rows of Table 5 report labelling agreement for thetestset queries using our basic interface. We observe that bothagreement and accuracy markedly improved over our earlier base-line run which did not validate worker input. Not only does thisconfirm the need to validate worker input, but it highlights the scaleof the issue. In particular, 32% of queries judged during this jobwere rejected based on our validation. Such a high level of rejectedjudgements might be attributed to a lack of information provided toour workers, as no additional news content is provided at this stage.However, a large proportion of these judgements were also made2Note that we also examined pooling workers from all countries,however, performance was markedly lower, i.e.κfleiss = 0.0395.This likely results from the predominantly American centric natureof the MSN query log, in addition to possible malicious workerspamming from other countries.
Proceedings of the SIGIR 2010 Workshop on Crowdsourcing for Search Evaluation (CSE 2010) - July 23, 2010 36

Interface Query Set Validation Precision Recall Accuracy κfree κfleiss
Basic testset ✖ 0.5 0.5714 0.9263 0.5833 0.2647Basic testset ✔ 1.0 0.5714 0.9681 0.7373 0.3525Headline testset ✔ 0.5 0.5714 0.9263 0.8 0.5148Headline_Inline testset ✔ 1.0 0.2857 0.9474 0.7866 0.3018Headline+Summary testset ✔ 1.0 0.5714 0.9684 0.83 0.5327Link-Supported testset ✔ 1.0 0.5714 0.9684 0.8367 0.5341Link-Supported fullset ✔ 0.6761 1.0 0.9748 0.8358 0.7677
Table 5: Quality measures for news query classification on the approximately 100 query testset with varying interfaces,in additionto the over 1000 query fullset using theLink-Supported interface.
within the first minute of the job, at a rate far exceeding a human’slabelling ability. This indicates that there are auto-completing botsattempting jobs on MTurk, which need to be identified and filtered.
6.3 Supplementing Worker Information withNews Content
Recall that we identified the worker’s lack of knowledge aboutthe major newsworthy stories of the time around which the querieswere submitted as an important limitation on our workers. More-over, we proposed four alternative interfaces, which provide work-ers with addition news-related information in an attempt toaddressthis. In this section, we evaluate the quality of the labels producedusing these alternative interfaces. Our intuition is that the use ofthis additional evidence will allow our workers to make informeddecisions about the queries, thus improving the final label qualitymeasured in terms of worker agreement.
Once again, Table 5 presents our workers’ labelling performancein terms of agreement for the testset queries using the four inter-faces previously described in Section 4.3. As can be observedfrom the table, providing our workers with either news headlines(Headline), news summaries (Headline+Summary) or a ranking ofsearch results (Link-Supported) from the time of the query, we canmarkedly increase worker agreement. However, we also notedthatfor the Headline_Inline interface, placing news headlines promi-nently with each query instead of within the instructions decreasedagreement between our workers. We suspect that this resultsfromsome workers only matching the query against the provided head-lines, causing them to miss other newsworthy queries for which aheadline was not provided. Indeed, the low recall against our man-ually judged query set confirms this.
Overall, we observe that ourLink-Supported interface obtainedthe highest worker agreement, i.e.κfree = 0.8367 andκfleiss =
0.5341. Furthermore, the high overall labelling accuracy of 0.9684obtained for this interface, in addition to the strong levelof agree-ment shown, attests the suitability of crowdsourcing for labellingqueries as news-related or not. [21] noted that in crowdsourcingthere is a trade-off between the number of workers assigned to eachjob and the resulting quality. We note that theLink-Supported jobcost over 6 times that ofBasic. However, although we could con-ceivably have 6 times as many workers perform labelling using Ba-sic for the same cost asLink-Supported, we would not expect accu-racy with Basic to markedly increase as the information availableto each worker remains constant.
6.4 Evaluating our News Query ClassificationDataset
Having observed that crowdsourcing appears to be suitable forgenerating news query classification labels upon the 100 testsetqueries, we now build the our full news query classification datasetcomprised of the 1206 queries from the fullset in addition tothe61 queries in its associated validation set and evaluate thequalityof the resulting labels. The last row in Table 5 shows label qualityfor the fullset using ourLink-Supported interface with validation.We report precision, recall and accuracy over our manually judgedlabels, in addition to the agreement measuresκfree andκfleiss.
Figure 7: Number of judgements made by each worker whenlabelling the fullset queries using the Link-Supported interface.
As can be observed from Table 5, over the larger query set, theaccuracy of our crowdsourced labels is high, i.e. over 90%. Indeed,all of the queries judged by the author as being news-relatedwerealso labelled as such by the workers (100% recall). In comparisonto our results on the testset, this recall increase indicates that thetestset queries were more dificult. Reported precision on the other-hand is markedly lower than on the testset. This is to be expected,as was noted earlier, there likely exist news-related queries that re-fer to tail events. For these queries, the workers may be morelikelyto disagree with our ground truth labels. Additionally, agreementbetween our workers is also high, indeed higher than shown onthesmaller testset. This may have resulted from workers becomingmore proficient at the job as they judge more queries and moreoverpass a larger number of validation queries. Indeed, Figure 7showsthe number of judgements per worker. We observe that the major-ity (over 70%) of our judgements were completed by 3 workers,completing between 500 and 1200 queries each.
6.5 Crowdsourcing Additional AgreementIn the previous experiments, we used crowdsourcing as a means
to label queries as news-related or not for a specific time. How-ever, we also hypothesised that crowdsourcing could also beusedas a quality assurance tool. In this section, we further evaluate thequality of our news query classification dataset by crowdsourcingadditional agreement labels.
Intuitively, we could return the labels produced for our newsquery classification dataset to MTurk, asking a second groupofworkers to validate the quality of those labels under the same con-ditions as the original job. However, this is similar in effect to in-creasing the redundancy for the original job. Instead, we propose toleverage the URLs that each worker was asked to provide undertheLink-Supported interface when labelling a query as news-related.
In particular, we ask our workers to validate each of the queriesin the fullset which were judged news-related by our original work-ers, based upon the content of the linked Web page by that URL.Should the URL support the original worker’s label, then this in-creases confidence that the label is correct. Hence, the labellingquality of the query subset judged news-related can be determinedby the proportion of queries within that set that are supported bytheir linked Web page. In particular, we ask each worker to label
Proceedings of the SIGIR 2010 Workshop on Crowdsourcing for Search Evaluation (CSE 2010) - July 23, 2010 37

Figure 8: Percentage of URL’s that were labelled as either bro-ken, supporting the news-relatedness of the query or not sup-porting the news-relatedness of the query during the qualityassurance job.
the URL as either being broken, supporting the news-relatedness ofthe query or not supporting the news-relatedness of the query. No-tably, this can be seen as a form of meta agreement, as we measurehow well the new workers agree with the original workers based onevidence provided by those original workers.
Figure 8 reports the percentage of URLs that were placed ineach class. We observe that the vast majority (82%) of URLswere judged as supporting the query as being news-related. Thisis very promising, as it shows that not only were our originalwork-ers effective at finding news-related queries, but they weremakinginformed decisions based upon the Web search results provided.Moreover, these results further support the claim that our resultingnews query classification dataset is of good quality.
Overall, we conclude that crowdsourcing is indeed suitableforlabelling queries as news-related or not, as attested by thehigh lev-els of agreement between our workers, the high labelling accuracyupon manually judged labels and in terms of meta-agreement witha second set of workers. Moreover, from the experience that wegained from the creation of the resulting dataset, we suggest thefollowing best practices when crowdsourcing.
1. Be aware of geographical differences: Worker performancevaries from location to location. Consider from where yourworkers will be best able to complete your task.
2. Online worker validation is paramount : You need to eval-uate worker performance to detect bots and poor quality work-ers early within the evaluation.
3. Provide workers with as much information as possible:Workers are not experts at most jobs. Overcome this by pro-viding additional relevant information or external resourcesthat workers can quickly and easily refer to.
4. Workers can learn: Workers are real people and can learnto become better at a job over time. This is true not only overa single large job, but equally over all the jobs submitted.Indeed, we observed that there was a notable worker overlapbetween our runs using the testset.
5. Consider meta-agreement for additional validation: Tryto collect additional feedback from the workers. There maybe too much data to be evaluated by hand, but crowdsourcingcan be used for evaluation as well as data creation.
7. CONCLUSIONIn this paper, we investigated building a dataset for the news
query classification problem. In particular, we proposed the crowd-sourcing of labels from Amazon’s Mechanical Turk as a fasterandcheaper method than relying on specialist annotators. Using queriessampled from a real search engine query log we experimented todetermine the effect of worker validation, in addition to methodsfor mitigating the lack of information about the news stories fromthe time of the queries on the part of our workers.
We have shown that online validation of workers is paramount,and that by supplying workers with Web search rankings or re-lated news article content for the query, we could dramatically in-crease labelling quality. Moreover, we have shown the suitability
of crowdsourcing for the news query classification problem as wellas its application in practice. Indeed, we created a new datasetof sufficient quality, both in terms of inter-worker agreement andalso against a set of manually judged queries. Furthermore,wehave also examined the resulting dataset using a novel applicationof crowdsourcing as a quality assurance tool, showing that crowd-sourcing can be useful as a means to calculate addition agreementbetween users and also confirming the high level of quality shownby our dataset. Lastly, based upon the experience we have gainedfrom this study, we have provided a set of best practices to helpfuture researchers design robust crowdsourcing experiments.
8. REFERENCES[1] O. Alonso, D. E. Rose, and B. Stewart. Crowdsourcing for relevance
evaluation.SIGIR Forum, 42(2):9–15, 2008.[2] O. Alonso. Crowdsourcing for relevance evaluation.Tutorial at
ECIR’10, Milton Keynes, UK.[3] J. Arguello, F. Diaz, J. Callan, and J. F. Crespo. Sourcesof evidence
for vertical selection. InProceedings of SIGIR’09, Boston, MA,USA.
[4] J. Atwood. Is Amazon’s Mechanical Turk a failure?, 2007.http://www.codinghorror.com/blog/2007/04/is-amazons-mechanical-turk-a-failure.html,accessed on 02/06/2010.
[5] J. Bar-Ilan, Z. Zhu, and M. Levene. Topic-specific analysis of searchqueries. InProceedings of WSCD’09, Barcelona, Spain.
[6] C. Callison-Burch. Fast, cheap, and creative: Evaluating translationquality using Amazon’s Mechanical Turk. InProceedings ofEMNLP’09, Singapore.
[7] N. Craswell, R. Jones, G. Dupret and E. Viegas. InProceedings ofWSCD’09, Barcelona, Spain.
[8] F. Diaz. Integration of news content into Web results. InProceedingsof WSDM’09, Barcelona, Spain.
[9] R. Jones and F. Diaz. Temporal profiles of queries.ACM Trans. Inf.Syst., 25(3), 2007.
[10] J. Downs, M. Holbrook, S. Sheng, and L. Cranor. Are yourparticipants gaming the system? Screening Mechanical Turkworkers. InProceedings of CHI’10, Atlanta, GA, USA.
[11] J. L. Fleiss. Measuring nominal scale agreement among many raters.Psychological Bulletin, 76(5):378–382, 1971.
[12] S. Hansell. Google keeps tweaking its search engine, 2008.http://www.nytimes.com/2007/06/03/business/yourmoney/03google.html, accessed on 08/06/2010.
[13] J. Howe. The rise of Crowdsourcing, 2006.http://www.wired.com/wired/archive/14.06/crowds.html, accessed on02/06/2010.
[14] A. Kittur, E. H. Chi, and B. Suh. Crowdsourcing user studies withMechanical Turk. InProceeding of CHI’08, Florence, Italy.
[15] J. R. Landis and G. G. Koch. The measurement of observeragreement for categorical data.Biometrics, 33(1):159–174, 1977.
[16] R. McCreadie, C. Macdonald, and I. Ounis. Insights on the horizonsof news search. InProceedings of SSM’10, New York, NY, USA.
[17] H. C. Ozmutlu, A. Spink, and S. Ozmutlu. Analysis of large datalogs: an application of Poisson sampling on Excite Web queries.Information Processing & Management, 38(4):473–490, 2002.
[18] S. Ozmutlu, A. Spink, and H. C. Ozmutlu. A day in the life of websearching: an exploratory study.Information Processing &Management, 40(2):319–345, 2004.
[19] J. Pedersen. Keynote speech. InProceedings of SSM’10, New York,NY, USA.
[20] J. J. Randolph. Free-marginal Multirater Kappa (multirater K free):an alternative to Fleiss’ Fixed-marginal Multirater Kappa. InProceedings of JULIS’05, Joensuu, Finland.
[21] R. Snow, B. O’Connor, D. Jurafsky, and A. Y. Ng. Cheap andfast—but is it good?: Evaluating non-expert annotations for naturallanguage tasks. InProceedings of EMNLP’08, Honolulu, HI, USA.
[22] J. S. Vitter. Random sampling with a reservoir.ACM Trans. Math.Softw., 11(1):37–57, 1985.
[23] E. M. Voorhees. TREC: Continuing information retrieval’s traditionof experimentation.Commun. ACM, 50(11):51–54, 2007.
[24] E. M. Voorhees and D. M. Tice. Building a question answering testcollection. InProceedings of SIGIR’00, Athens, Greece.
Proceedings of the SIGIR 2010 Workshop on Crowdsourcing for Search Evaluation (CSE 2010) - July 23, 2010 38

Detecting Uninteresting Content in Text Streams Omar Alonso, Chad Carson, David Gerster, Xiang Ji, Shubha U. Nabar
Microsoft Corp. 1065 La Avenida, Mountain View, CA 94043
{omalonso, ccar, dgerster, xiangji, shubhan}@microsoft.com
ABSTRACT We study the problem of identifying uninteresting content in text
streams from micro-blogging services such as Twitter. Our
premise is that truly mundane content is not interesting in any
context, and thus can be quickly filtered using simple query-
independent features. Such a filter could be used for tiering
indexes in a micro-blog search engine, with the filtered
uninteresting content relegated to the less frequently accessed
tiers.
We believe that, due to the nature of textual streams, it should be
interesting to leverage the wisdom of the crowds in this particular
scenario. We use crowdsourcing to estimate the fraction of the
Twitter stream that is categorically not interesting, and derive a
single, highly effective feature that separates “uninteresting” from
“possibly interesting” tweets.
Categories and Subject Descriptors
H.3.4 [Information Storage and Retrieval]: Systems and
software — performance evaluation
General Terms
Experimentation, classification, relevance.
Keywords
Twitter, user study, crowdsourcing.
1. INTRODUCTION Micro-blogging platforms such as Twitter and Jaiku have recently
gained popularity as publishing mechanisms. Millions of users
post opinions, observations, ideas and links to articles of interest
in the form of status updates. Due to the decentralized and
instantaneous nature of publishing on such platforms, these posts
contain valuable real-time information. For the same reasons,
however, we face the difficult problem of separating the wheat
from the chaff. Much of what is published is trivial, of interest to
only the publisher and a handful of others. How do we quickly
filter out such content so that what remains is of potential interest
to a wide audience?
Our motivation for studying this problem arose while building a
“real-time” search engine that searches micro-blog updates for
real-time information on hot topics. On platforms such as Twitter,
users typically generate 50 million updates (tweets) a day on
average. The sheer volume of these updates necessitates a tiered
index approach wherein potentially interesting updates are
indexed in a smaller, more frequently accessed tier, with low-
quality, categorically uninteresting updates indexed in the larger
tiers. The question that arises then is: how do we identify, on the
fly, which tier an update belongs to?
From a content perspective, we would like to explore if the
updates appear to be relevant and if there is a class that we can
call interesting or appealing based on user judgments.
In this paper, we use crowdsourcing for this exploration. We
assign workers on the Amazon Mechanical Turk (AMT)1 platform
the task of labeling posts as “only interesting to author and
friends” or “possibly interesting to others”, with the premise that
no further context is needed for identifying the truly mundane. We
chose a crowdsourcing approach because it is cheap and
extremely fast for running these types of experiments.
Our studies bring to light certain interesting facts: 57% of the
Twitter stream is categorically not interesting, and of these 89%
do not contain hyperlinks. Moreover, we find that the simple
presence of a link correctly classifies a tweet as “not interesting”
or “possibly interesting” more than 80% of the time. This simple
rule comes at a price, however, since it incorrectly classifies many
tweets as not interesting simply because they do not contain a
link.
2. RELATED WORK Amazon Mechanical Turk has emerged as a viable platform for
conducting relevance experiments. Most of the research has been
on evaluating relevance assessments and comparing the
performance of Mechanical Turk workers versus experts.
Examples of this type of research are evaluating a subset of TREC
[1] and annotator performance in four different NLP tasks [10].
There have been several recent studies on micro-blogging
services. Much of the research has been focused on questions
related to the structure and nature of the Twitter community. For
example, the geographical and topological properties of the
Twitter network are studied in [5] and [6]. In [4] and [11], the
authors study motivations for using Twitter and argue that
activities on Twitter can be thought of as information seeking or
information sharing.
There has also been some work on semantic analysis of the textual
content of Twitter updates: The authors in [8] use a partially
supervised learning model to map tweets to dimensions that
correspond roughly to substance, style, status and social
1 www.mturk.com
Permission to make digital or hard copies of all or part of this work for
personal or classroom use is granted without fee provided that copies are
not made or distributed for profit or commercial advantage and that
copies bear this notice and the full citation on the first page. To copy
otherwise, or republish, to post on servers or to redistribute to lists,
requires prior specific permission and/or a fee.
SIGIR‟10, July 19-23, 2010, Geneva, Switzerland.
Copyright 2010 ACM 1-58113-000-0/00/0010…$10.00.
Proceedings of the SIGIR 2010 Workshop on Crowdsourcing for Search Evaluation (CSE 2010) - July 23, 2010 39

characteristics of the updates. In [3], the authors use Twitter to
track consumer sentiment towards certain brands.
The real-time nature of Twitter updates is studied and harnessed
in [2] and [9]. Dong et al. [2] uses Twitter signals for url
discovery and to improve the ranking of these newly discovered
urls in web search results. The authors in [9] used Twitter to build
an earthquake reporting system in Japan that outperforms the
Japan Meteorological Agency in speed of notification.
The work that comes closest to ours is [7], wherein the authors
propose several features for identifying interesting tweets; the
features are not, however, experimentally validated.
3. EXPERIMENTS We performed two experiments using two sets of tweets. For the
first experiment, using the Twitter public timeline API2 we
downloaded 100 tweets in the morning and another 100 in the
afternoon for five consecutive days (Monday through Friday).
After each batch of tweets was downloaded, it was immediately
uploaded to AMT, where workers were presented with a set of
tweets and asked if the content was “interesting” or “not
interesting.” Initially, we instructed workers to label tweets
“interesting” if the content mentioned “specific information that
people might care about” (e.g. “Another earthquake hits Haiti”).
We defined “not interesting” content to include “advertisements,
opinions, and trivial updates about daily life” (e.g. “Going for
lunch with a friend”). Each worker was asked to label multiple
tweets, and we collected five distinct judgments for each tweet.
No qualification test was used, although we selected only workers
having an approval rate (a reputation measure) of at least 97%.
The cost of generating labels for each 100-tweet batch was less
than $3.
While analyzing the data, we realized that our instructions were
unclear. We modified the instructions and defined the labels as
“only interesting to author and friends” and “possibly interesting
to others.” We resubmitted the batches of tweets and found that
the quality of the labels improved. Figure 1 shows a large increase
in scores of 0/5 or 5/5, which signify unanimous agreement
among workers, and a large decrease in scores of 2/5 or 3/5,
which signify disagreement.
Score
Initial
Labels
Revised
Labels Change
Unanimous agreement: 0/5
or 5/5 30% 53% +23%
Near-agreement: 1/5 or 4/5 32% 27% -5%
Disagreement: 2/5 or 3/5 38% 20% -19%
Total 100% 100%
Figure 1. Clearer Instructions Yield More Agreement Among
Workers (Experiment 1)
2 twitter.com/statuses/public_timeline.xml
For the second experiment, we sampled 1,791 tweets from our
internal data system, into which we had loaded a week’s worth of
status updates from the Twitter “firehose”. The agreement among
workers in this experiment (Figure 2) showed a similar
distribution to the first experiment (Figure 1).
Score # of Tweets % of Tweets
Unanimous agreement: 0/5 or
5/5 997 56%
Near-agreement: 1/5 or 4/5 483 27%
Disagreement: 2/5 or 3/5 311 17%
Total 1,791 100%
Figure 2. Agreement among Workers (Experiment 2)
4. DATA ANALYSIS For each tweet we created a single “interestingness” score,
calculated as the number of “possibly interesting to others” AMT
labels divided by the total number of labels for that tweet. Each
tweet received five labels from five different workers. We
observed that 1) 57% of tweets scored 0/5 or 1/5 and 2) within
each score band, there was a strong correlation between the
fraction of tweets containing a hyperlink and the score (Table 1).
Table 1. Distribution of Interestingness Scores and % of
Tweets with Links for each Score (Experiment 1)
Score
# of
Tweets
% of
Tweets
# of Tweets
with Links
% of Tweets
with Links
5/5 127 13% 120 94%
4/5 105 11% 82 78%
3/5 79 8% 45 57%
2/5 112 11% 50 45%
1/5 163 17% 41 25%
0/5 394 40% 17 4%
Total 980 100% 355 36%
Read: "78% of tweets having a score of 4/5 contained a link."
Next we defined a class of “uninteresting” tweets having a score
of 0/5 or 1/5 (shaded grey in Table 1), with the remainder
classified “possibly interesting.”
We created multiple textual features, including 1) presence of a
hyperlink, 2) average word length, 3) maximum word length, 4)
presence of first person parts of speech, 5) largest number of
consecutive words in capital letters, 6) whether the tweet is a
retweet, 7) number of topics as indicated by the “#” sign, 8)
number of usernames as indicated by the “@” sign, 9) whether the
link points to a social media domain (e.g twitpic.com), 10)
presence of emoticons and other sentiment indicators, 11)
presence of exclamation points, 12) percentage of words not
found in a dictionary, 13) presence of proper names as indicated
Proceedings of the SIGIR 2010 Workshop on Crowdsourcing for Search Evaluation (CSE 2010) - July 23, 2010 40

by words with a single initial capital letter and 14) percentage of
letters in the tweet that do not spell out words.
We attempted to train a decision tree classifier using the above
classes and features, but repeatedly found that the “has hyperlink”
feature dominated. We then created a simple classifier with a
single rule: if a tweet contains a hyperlink, classify it “possibly
interesting”; if not, classify it “not interesting.” We were surprised
to find that this single rule classified tweets with 81% accuracy
(Table 2).
Table 2. Confusion Matrix and Accuracy using Single "Has
Hyperlink" Rule (Experiment 1)
Confusion Matrix
Classified as → a b
a = Not Interesting 499 58
b = Possibly Interesting 126 297
Read: "126 tweets whose actual class was Possibly Interesting
were classified as Not Interesting."
Accuracy # %
Tweets correctly classified 796 81%
Tweets misclassified 184 19%
Total 980 100%
As the confusion matrix shows, most classification errors (126 out
of 184) were due to “possibly interesting” tweets being labeled
“not interesting” simply because they did not contain a link. This
raises the question of what features might be useful to correctly
classify such tweets. Visual inspection of these misclassified
tweets shows that many contain named entities (“State of the
Union”; “China”) and quantities (“$499”; “100K”).
We performed the same analyses on the second set of 1,791
tweets labeled using AMT. We were pleased to find that the
distribution of interestingness scores was similar to the first
experiment, demonstrating that the quality of judgments by AMT
workers is high enough to create reproducible results. We noted
that the accuracy of the single “has hyperlink” rule increased to
85%.
As with the first experiment, most misclassifications (149 out of
269) were due to tweets with no link being misclassified as not
interesting.
To reduce misclassified tweets, we began experimenting with new
textual features including the presence of named entities. We saw
two ways to generate such features: 1) algorithmic entity
extraction and 2) submitting tweets to AMT with instructions on
the entities we seek to identify (e.g. “Does this tweet contain the
name of a person, organization, or product?”).
Table 3. Distribution of Interestingness Scores and % of
Tweets with Links for each Score (Experiment 2)
Score
# of
Tweets
% of
Tweets
# of Tweets
with Links
% of Tweets
with Links
5/5 103 6% 99 96%
4/5 140 8% 122 87%
3/5 126 7% 87 69%
2/5 185 10% 97 53%
1/5 343 19% 86 25%
0/5 894 50% 34 4%
Total 980 100% 525 29%
Read: "87% of tweets having a score of 4/5 contained a link."
Table 4. Confusion Matrix and Accuracy using Single "Has
Hyperlink" Rule (Experiment 2)
Confusion Matrix
Classified as → a b
a = Not Interesting 1117 120
b = Possibly Interesting 149 405
Read: "149 tweets whose actual class was Possibly Interesting
were classified as Not Interesting."
Accuracy # %
Tweets correctly classified 1522 85%
Tweets misclassified 269 15%
Total 1791 100%
Focusing on the second approach, we submitted the 126
misclassified tweets from the first experiment back to AMT and
asked workers to judge what types of named entities each tweet
contained. Workers were presented with one tweet and asked to
judge named entities using the following categories:
People (John Doe, Mary Smith, joedoe, etc.)
Places (San Francisco, Germany, UK, etc.)
Brands or products (Windows 7, Python, iPhone, etc.)
Organizations (US Congress, Microsoft, etc.)
Other (State of the Union, US Patent #123456, etc.)
No. I don't see name(s).
To improve the quality of judgments, we intentionally included
the “No” category to avoid workers feeling compelled to find a
named entity even when one was not present. Each worker was
asked to recognize entities from a single tweet, and we collected
five distinct judgments for each tweet. No qualification test was
used and the approval rate was 97%. We paid two cents per task
for this experiment.
Table 5 shows the distribution of named entity types across these
126 tweets. (For simplicity, only the dominant entity type is
Proceedings of the SIGIR 2010 Workshop on Crowdsourcing for Search Evaluation (CSE 2010) - July 23, 2010 41
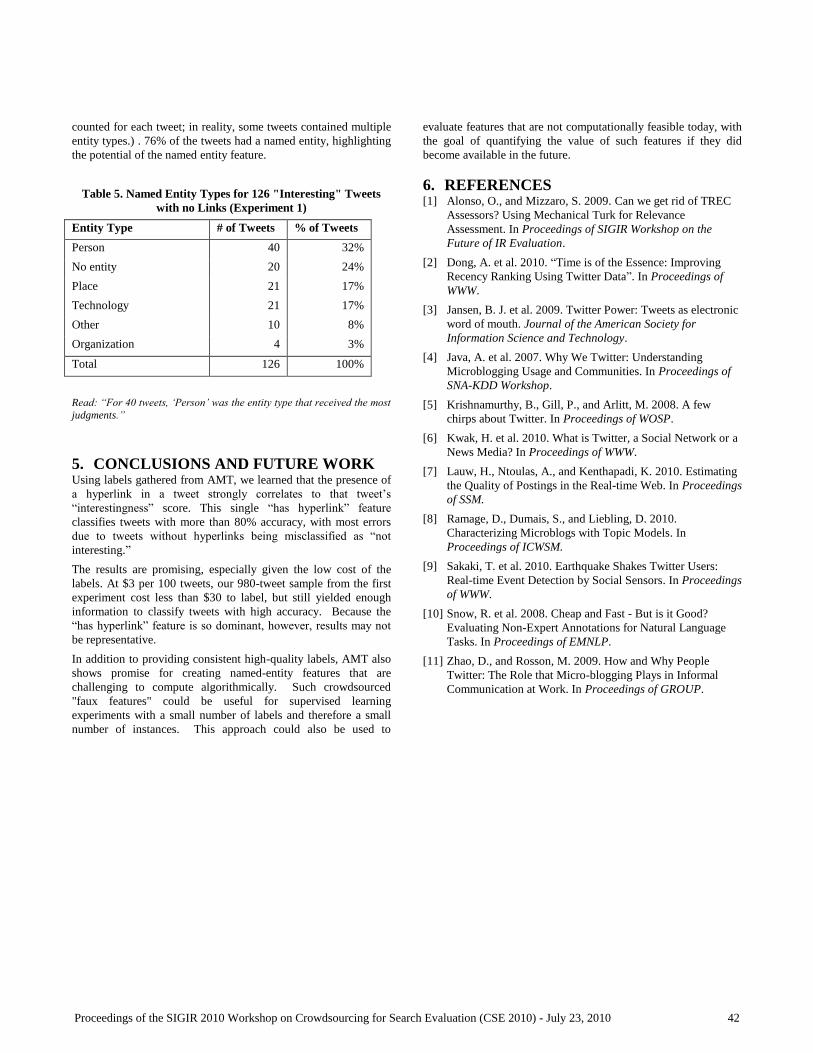
counted for each tweet; in reality, some tweets contained multiple
entity types.) . 76% of the tweets had a named entity, highlighting
the potential of the named entity feature.
Table 5. Named Entity Types for 126 "Interesting" Tweets
with no Links (Experiment 1)
Entity Type # of Tweets % of Tweets
Person 40 32%
No entity 20 24%
Place 21 17%
Technology 21 17%
Other 10 8%
Organization 4 3%
Total 126 100%
Read: “For 40 tweets, „Person‟ was the entity type that received the most
judgments.”
5. CONCLUSIONS AND FUTURE WORK Using labels gathered from AMT, we learned that the presence of
a hyperlink in a tweet strongly correlates to that tweet’s
“interestingness” score. This single “has hyperlink” feature
classifies tweets with more than 80% accuracy, with most errors
due to tweets without hyperlinks being misclassified as “not
interesting.”
The results are promising, especially given the low cost of the
labels. At $3 per 100 tweets, our 980-tweet sample from the first
experiment cost less than $30 to label, but still yielded enough
information to classify tweets with high accuracy. Because the
“has hyperlink” feature is so dominant, however, results may not
be representative.
In addition to providing consistent high-quality labels, AMT also
shows promise for creating named-entity features that are
challenging to compute algorithmically. Such crowdsourced
"faux features" could be useful for supervised learning
experiments with a small number of labels and therefore a small
number of instances. This approach could also be used to
evaluate features that are not computationally feasible today, with
the goal of quantifying the value of such features if they did
become available in the future.
6. REFERENCES [1] Alonso, O., and Mizzaro, S. 2009. Can we get rid of TREC
Assessors? Using Mechanical Turk for Relevance
Assessment. In Proceedings of SIGIR Workshop on the
Future of IR Evaluation.
[2] Dong, A. et al. 2010. “Time is of the Essence: Improving
Recency Ranking Using Twitter Data”. In Proceedings of
WWW.
[3] Jansen, B. J. et al. 2009. Twitter Power: Tweets as electronic
word of mouth. Journal of the American Society for
Information Science and Technology.
[4] Java, A. et al. 2007. Why We Twitter: Understanding
Microblogging Usage and Communities. In Proceedings of
SNA-KDD Workshop.
[5] Krishnamurthy, B., Gill, P., and Arlitt, M. 2008. A few
chirps about Twitter. In Proceedings of WOSP.
[6] Kwak, H. et al. 2010. What is Twitter, a Social Network or a
News Media? In Proceedings of WWW.
[7] Lauw, H., Ntoulas, A., and Kenthapadi, K. 2010. Estimating
the Quality of Postings in the Real-time Web. In Proceedings
of SSM.
[8] Ramage, D., Dumais, S., and Liebling, D. 2010.
Characterizing Microblogs with Topic Models. In
Proceedings of ICWSM.
[9] Sakaki, T. et al. 2010. Earthquake Shakes Twitter Users:
Real-time Event Detection by Social Sensors. In Proceedings
of WWW.
[10] Snow, R. et al. 2008. Cheap and Fast - But is it Good?
Evaluating Non-Expert Annotations for Natural Language
Tasks. In Proceedings of EMNLP.
[11] Zhao, D., and Rosson, M. 2009. How and Why People
Twitter: The Role that Micro-blogging Plays in Informal
Communication at Work. In Proceedings of GROUP.
Proceedings of the SIGIR 2010 Workshop on Crowdsourcing for Search Evaluation (CSE 2010) - July 23, 2010 42