crosstabs - harvard caps / harris poll · crosstabs monthly harvard-harris poll: november 2018 this...
TRANSCRIPT

CROSSTABS
Monthly Harvard-Harris Poll: November 2018
This survey was conducted online within the United States from November 25-26, 2018
among 1,407 registered voters by The Harris Poll.
The results reflect a nationally representative sample. Results were weighted for age within
gender, region, race/ethnicity, marital status, household size, income, employment, political
party, political ideology, and education where necessary to align them with their actual
proportions in the population. Propensity score weighting was also used to adjust for
respondents’ propensity to be online.

Base n=1407 Base n=1407
AGE* POLITICAL PARTY*
18-34 27% Democrat 37%
35-49 25% Republican 32%
50-64 27% Independent 29%
65+ 21% Other 2%
SEX* LOCALE
Male 49% Urban 28%
Female 51% Suburban 53%
EDUCATION* Rural 19%
Less than high school degree 8% POLITICAL IDEOLOGY*
High school degree to less than 4-year college degree 57% Liberal 27%
4-year college degree or more 34% Moderate 42%
RACE/ETHNICITY* Conservative 30%
White 67% Black/African American 12% Hispanic 15% Asian 5%
Other 2%

Page 1
Fielding Period: November 27 - 28, 2018
HCAPS (Filtered on Registered Voters)
Weighted To The U.S. General Adult Population
30 Nov 2018
Table 1
Q4007 What is your age?
Base: All Respondents
Presidential
Election Candidate
Gender Age Ethnicity Political Party Political Ideology Voted For Education Locale Income
_____________ ______________________ _______________________ ____________________ ____________________ _____________________ _____________ ________________ _________
Colle- Some
Cons- ge Gr- Colle- $75K Less
Hisp- Black Repub- Democ- Indep- Libe- Mode- erva- 3rd ad And ge Or Urb- Subu- Or Than
Total Male Female 18-34 35-49 50-64 65+ White anic /AA Other lican rat endent ral rate tive Clinton Trump Party Higher Less an rban Rural More $75K
______ _____ _______ _____ _____ _____ ____ _____ _____ _____ _____ ______ ______ ______ ______ ______ ______ ________ ______ _____ ______ ______ ____ _____ _____ ____ ____
Unweighted Base 1407 675 732 416 359 364 268 1049 104 173 25 437 526 382 437 549 421 537 505 113 543 864 388 719 300 548 846
Weighted Base 1407 687 720 383 345 382 297 938 208 169 26 450 521 408 385 593 429 547 532 108 481 926 395 742 270 679 704
18-34 383 178 205 383 - - - 226 86 48 2 117 139 118 120 180 82 144 120 31 108 275 139 181 63 156 225
27% 26% 28% 100% - - - 24% 41% 28% 8% 26% 27% 29% 31% 30% 19% 26% 23% 29% 22% 30% 35% 24% 23% 23% 32%
35-49 345 169 177 - 345 - - 199 70 48 7 116 117 106 103 141 101 139 140 24 121 225 92 188 65 184 158
25% 25% 25% - 100% - - 21% 33% 28% 29% 26% 22% 26% 27% 24% 24% 25% 26% 22% 25% 24% 23% 25% 24% 27% 22%
50-64 382 202 180 - - 382 - 279 37 38 13 131 136 104 81 159 142 131 161 34 126 255 101 188 93 196 174
27% 29% 25% - - 100% - 30% 18% 22% 49% 29% 26% 25% 21% 27% 33% 24% 30% 31% 26% 28% 26% 25% 34% 29% 25%
65+ 297 138 159 - - - 297 234 15 35 4 86 129 80 82 112 103 134 110 19 126 171 64 185 48 143 148
21% 20% 22% - - - 100% 25% 7% 21% 14% 19% 25% 20% 21% 19% 24% 24% 21% 17% 26% 18% 16% 25% 18% 21% 21%
Mean 47.8 48.3 47.2 26.7 41.8 56.8 70.2 49.9 39.4 46.9 52.4 48.1 48.5 46.8 46.1 46.6 50.9 48.2 49.2 47.7 50.4 46.4 44.4 49.3 48.6 48.7 46.5
Std. Dev. 16.70 16.27 17.09 4.83 4.65 4.05 4.31 16.72 14.80 15.97 12.31 16.35 16.85 16.89 17.09 16.71 15.90 16.58 16.18 16.13 16.30 16.75 16.49 16.9315.6916.2517.11
Std. Err. 0.45 0.63 0.63 0.24 0.25 0.21 0.26 0.52 1.45 1.21 2.46 0.78 0.73 0.86 0.82 0.71 0.78 0.72 0.72 1.52 0.70 0.57 0.84 0.63 0.91 0.69 0.59
Sigma 1407 687 720 383 345 382 297 938 208 169 26 450 521 408 385 593 429 547 532 108 481 926 395 742 270 679 704
100% 100% 100% 100% 100% 100% 100% 100% 100% 100% 100% 100% 100% 100% 100% 100% 100% 100% 100% 100% 100% 100% 100% 100% 100% 100% 100%

Page 2
Fielding Period: November 27 - 28, 2018
HCAPS (Filtered on Registered Voters)
Weighted To The U.S. General Adult Population
30 Nov 2018
Table 2
Q4005 What is your gender?
Base: All Respondents
Presidential
Election Candidate
Gender Age Ethnicity Political Party Political Ideology Voted For Education Locale Income
_____________ ______________________ _______________________ ____________________ ____________________ _____________________ _____________ ________________ _________
Colle- Some
Cons- ge Gr- Colle- $75K Less
Hisp- Black Repub- Democ- Indep- Libe- Mode- erva- 3rd ad And ge Or Urb- Subu- Or Than
Total Male Female 18-34 35-49 50-64 65+ White anic /AA Other lican rat endent ral rate tive Clinton Trump Party Higher Less an rban Rural More $75K
______ _____ _______ _____ _____ _____ ____ _____ _____ _____ _____ ______ ______ ______ ______ ______ ______ ________ ______ _____ ______ ______ ____ _____ _____ ____ ____
Unweighted Base 1407 675 732 416 359 364 268 1049 104 173 25 437 526 382 437 549 421 537 505 113 543 864 388 719 300 548 846
Weighted Base 1407 687 720 383 345 382 297 938 208 169 26 450 521 408 385 593 429 547 532 108 481 926 395 742 270 679 704
Male 687 687 - 178 169 202 138 478 92 71 13 248 204 224 177 269 240 257 292 62 299 388 203 377 108 405 274
49% 100% - 47% 49% 53% 46% 51% 44% 42% 49% 55% 39% 55% 46% 45% 56% 47% 55% 57% 62% 42% 51% 51% 40% 60% 39%
Female 720 - 720 205 177 180 159 461 116 98 13 202 317 185 208 324 188 290 239 46 183 538 193 365 163 275 431
51% - 100% 53% 51% 47% 54% 49% 56% 58% 51% 45% 61% 45% 54% 55% 44% 53% 45% 43% 38% 58% 49% 49% 60% 40% 61%
Sigma 1407 687 720 383 345 382 297 938 208 169 26 450 521 408 385 593 429 547 532 108 481 926 395 742 270 679 704
100% 100% 100% 100% 100% 100% 100% 100% 100% 100% 100% 100% 100% 100% 100% 100% 100% 100% 100% 100% 100% 100% 100% 100% 100% 100% 100%

Page 3
Fielding Period: November 27 - 28, 2018
HCAPS (Filtered on Registered Voters)
Weighted To The U.S. General Adult Population
30 Nov 2018
Table 3
Q2109 In what country or region do you currently reside?
Base: All Respondents
Presidential
Election Candidate
Gender Age Ethnicity Political Party Political Ideology Voted For Education Locale Income
_____________ ______________________ _______________________ ____________________ ____________________ _____________________ _____________ ________________ _________
Colle- Some
Cons- ge Gr- Colle- $75K Less
Hisp- Black Repub- Democ- Indep- Libe- Mode- erva- 3rd ad And ge Or Urb- Subu- Or Than
Total Male Female 18-34 35-49 50-64 65+ White anic /AA Other lican rat endent ral rate tive Clinton Trump Party Higher Less an rban Rural More $75K
______ _____ _______ _____ _____ _____ ____ _____ _____ _____ _____ ______ ______ ______ ______ ______ ______ ________ ______ _____ ______ ______ ____ _____ _____ ____ ____
Unweighted Base 1407 675 732 416 359 364 268 1049 104 173 25 437 526 382 437 549 421 537 505 113 543 864 388 719 300 548 846
Weighted Base 1407 687 720 383 345 382 297 938 208 169 26 450 521 408 385 593 429 547 532 108 481 926 395 742 270 679 704
United States 1407 687 720 383 345 382 297 938 208 169 26 450 521 408 385 593 429 547 532 108 481 926 395 742 270 679 704
100% 100% 100% 100% 100% 100% 100% 100% 100% 100% 100% 100% 100% 100% 100% 100% 100% 100% 100% 100% 100% 100% 100% 100% 100% 100% 100%
Sigma 1407 687 720 383 345 382 297 938 208 169 26 450 521 408 385 593 429 547 532 108 481 926 395 742 270 679 704
100% 100% 100% 100% 100% 100% 100% 100% 100% 100% 100% 100% 100% 100% 100% 100% 100% 100% 100% 100% 100% 100% 100% 100% 100% 100% 100%

Page 4
Fielding Period: November 27 - 28, 2018
HCAPS (Filtered on Registered Voters)
Weighted To The U.S. General Adult Population
30 Nov 2018
Table 4
S2 In which state do you reside?
Base: All Respondents
Presidential
Election Candidate
Gender Age Ethnicity Political Party Political Ideology Voted For Education Locale Income
_____________ ______________________ _______________________ ____________________ ____________________ _____________________ _____________ ________________ _________
Colle- Some
Cons- ge Gr- Colle- $75K Less
Hisp- Black Repub- Democ- Indep- Libe- Mode- erva- 3rd ad And ge Or Urb- Subu- Or Than
Total Male Female 18-34 35-49 50-64 65+ White anic /AA Other lican rat endent ral rate tive Clinton Trump Party Higher Less an rban Rural More $75K
______ _____ _______ _____ _____ _____ ____ _____ _____ _____ _____ ______ ______ ______ ______ ______ ______ ________ ______ _____ ______ ______ ____ _____ _____ ____ ____
Unweighted Base 1407 675 732 416 359 364 268 1049 104 173 25 437 526 382 437 549 421 537 505 113 543 864 388 719 300 548 846
Weighted Base 1407 687 720 383 345 382 297 938 208 169 26 450 521 408 385 593 429 547 532 108 481 926 395 742 270 679 704
Alabama 21 11 10 4 6 7 4 13 - 8 - 6 10 5 7 8 6 11 6 2 4 17 4 6 11 12 6
1% 2% 1% 1% 2% 2% 1% 1% - 5% - 1% 2% 1% 2% 1% 1% 2% 1% 1% 1% 2% 1% 1% 4% 2% 1%
Alaska 2 1 1 - - 1 1 2 - - - - - 2 1 - 1 - - 1 1 1 1 - 1 - 2
* * * - - * * * - - - - - * * - * - - 1% * * * - * - *
Arizona 34 14 20 7 5 8 13 24 4 1 3 16 14 4 13 6 15 16 15 1 9 24 11 16 7 10 23
2% 2% 3% 2% 1% 2% 4% 3% 2% 1% 13% 4% 3% 1% 3% 1% 3% 3% 3% 1% 2% 3% 3% 2% 3% 2% 3%
Arkansas 7 4 4 2 4 1 - 4 - 3 - 5 1 1 1 3 4 2 5 * 1 6 2 1 4 1 6
1% 1% 1% 1% 1% * - * - 2% - 1% * * * * 1% * 1% * * 1% * * 2% * 1%
California 183 96 87 50 45 51 37 98 44 17 2 47 77 52 58 77 48 67 62 27 62 121 64 95 24 101 83
13% 14% 12% 13% 13% 13% 12% 10% 21% 10% 8% 10% 15% 13% 15% 13% 11% 12% 12% 25% 13% 13% 16% 13% 9% 15% 12%
Colorado 17 9 8 4 4 3 6 8 7 1 - 6 2 8 1 8 8 8 6 * 4 13 9 7 1 5 12
1% 1% 1% 1% 1% 1% 2% 1% 3% 1% - 1% * 2% * 1% 2% 1% 1% * 1% 1% 2% 1% 1% 1% 2%
Connecticut 26 15 11 2 10 7 7 20 6 - - 5 8 12 6 16 4 13 8 1 5 21 6 16 4 16 9
2% 2% 2% 1% 3% 2% 2% 2% 3% - - 1% 2% 3% 2% 3% 1% 2% 1% 1% 1% 2% 2% 2% 2% 2% 1%
Delaware 2 1 1 - 1 - 1 1 1 - - - 2 - 2 - - 2 - - 1 1 - 1 1 1 1
* * * - * - * * 1% - - - * - * - - * - - * * - * * * *
District of Columbia 7 7 - - 1 5 * 3 - 4 - - 5 2 3 * 3 7 - - 1 6 7 - - 3 4
* 1% - - * 1% * * - 2% - - 1% * 1% * 1% 1% - - * 1% 2% - - * 1%
Florida 102 52 50 26 24 23 29 64 26 9 - 49 33 17 22 49 31 43 39 4 34 68 37 55 11 46 53
7% 8% 7% 7% 7% 6% 10% 7% 12% 6% - 11% 6% 4% 6% 8% 7% 8% 7% 4% 7% 7% 9% 7% 4% 7% 8%
Georgia 42 14 28 15 12 7 9 25 4 13 1 16 14 12 6 22 14 14 12 1 9 34 12 19 12 10 31
3% 2% 4% 4% 4% 2% 3% 3% 2% 8% 2% 4% 3% 3% 2% 4% 3% 3% 2% 1% 2% 4% 3% 3% 4% 1% 4%
Hawaii 6 2 4 * 3 1 2 3 - - - 3 1 2 4 * 2 2 3 - 4 2 - 3 3 4 2
* * 1% * 1% * 1% * - - - 1% * * 1% * 1% * 1% - 1% * - * 1% 1% *
Idaho 9 3 7 2 - 4 4 9 - - - 7 1 1 1 3 5 1 5 1 1 8 1 3 5 6 3
1% * 1% * - 1% 1% 1% - - - 1% * * * 1% 1% * 1% 1% * 1% * * 2% 1% *
Illinois 70 33 37 22 18 15 15 34 16 16 2 11 34 22 28 30 11 39 11 6 24 46 26 36 8 33 37
5% 5% 5% 6% 5% 4% 5% 4% 8% 9% 7% 2% 7% 5% 7% 5% 3% 7% 2% 5% 5% 5% 7% 5% 3% 5% 5%

Page 5
Fielding Period: November 27 - 28, 2018
HCAPS (Filtered on Registered Voters)
Weighted To The U.S. General Adult Population
30 Nov 2018
Table 4
S2 In which state do you reside?
Base: All Respondents
Presidential
Election Candidate
Gender Age Ethnicity Political Party Political Ideology Voted For Education Locale Income
_____________ ______________________ _______________________ ____________________ ____________________ _____________________ _____________ ________________ _________
Colle- Some
Cons- ge Gr- Colle- $75K Less
Hisp- Black Repub- Democ- Indep- Libe- Mode- erva- 3rd ad And ge Or Urb- Subu- Or Than
Total Male Female 18-34 35-49 50-64 65+ White anic /AA Other lican rat endent ral rate tive Clinton Trump Party Higher Less an rban Rural More $75K
______ _____ _______ _____ _____ _____ ____ _____ _____ _____ _____ ______ ______ ______ ______ ______ ______ ________ ______ _____ ______ ______ ____ _____ _____ ____ ____
Weighted Base 1407 687 720 383 345 382 297 938 208 169 26 450 521 408 385 593 429 547 532 108 481 926 395 742 270 679 704
Indiana 33 17 16 11 5 7 9 28 1 3 - 15 10 8 9 12 12 10 17 2 11 22 11 18 3 15 16
2% 2% 2% 3% 2% 2% 3% 3% * 2% - 3% 2% 2% 2% 2% 3% 2% 3% 2% 2% 2% 3% 2% 1% 2% 2%
Iowa 4 2 2 1 1 - 3 4 - - - 1 1 2 1 2 1 3 1 - 1 3 3 - 1 - 4
* * * * * - 1% * - - - * * * * * * * * - * * 1% - * - 1%
Kansas 5 2 3 * 1 3 - 2 - 2 1 1 3 * 1 3 1 2 2 - 2 3 1 2 2 2 3
* * * * * 1% - * - 1% 3% * 1% * * * * * * - * * * * 1% * *
Kentucky 12 4 8 5 1 5 2 10 1 1 - 6 3 3 2 3 6 2 7 1 3 9 * 9 3 6 6
1% 1% 1% 1% * 1% 1% 1% * * - 1% 1% 1% 1% 1% 1% * 1% 1% 1% 1% * 1% 1% 1% 1%
Louisiana 18 10 8 6 2 7 2 15 - 3 - 4 7 6 4 4 10 4 9 2 9 9 8 5 5 11 7
1% 1% 1% 2% 1% 2% 1% 2% - 2% - 1% 1% 2% 1% 1% 2% 1% 2% 2% 2% 1% 2% 1% 2% 2% 1%
Maine 9 5 4 3 4 2 * 7 - - 2 2 2 5 3 3 3 1 6 2 1 8 5 4 1 1 8
1% 1% 1% 1% 1% 1% * 1% - - 6% 1% * 1% 1% * 1% * 1% 2% * 1% 1% * * * 1%
Maryland 30 16 13 15 2 12 2 18 - 10 1 5 15 10 9 17 4 16 11 1 15 15 5 22 3 17 12
2% 2% 2% 4% * 3% 1% 2% - 6% 5% 1% 3% 2% 2% 3% 1% 3% 2% 1% 3% 2% 1% 3% 1% 3% 2%
Massachusetts 37 19 18 5 10 9 13 30 4 1 - 10 11 17 10 22 6 13 16 4 13 24 9 24 4 23 12
3% 3% 2% 1% 3% 2% 4% 3% 2% * - 2% 2% 4% 2% 4% 1% 2% 3% 3% 3% 3% 2% 3% 1% 3% 2%
Michigan 42 14 28 12 14 8 8 28 5 7 3 10 24 8 17 13 13 20 10 3 14 29 7 23 13 17 26
3% 2% 4% 3% 4% 2% 3% 3% 2% 4% 10% 2% 5% 2% 4% 2% 3% 4% 2% 3% 3% 3% 2% 3% 5% 2% 4%
Minnesota 35 24 11 6 9 12 9 34 - 1 - 14 9 12 8 8 18 10 11 5 7 28 3 24 8 15 17
2% 4% 2% 2% 2% 3% 3% 4% - * - 3% 2% 3% 2% 1% 4% 2% 2% 5% 1% 3% 1% 3% 3% 2% 2%
Mississippi 11 4 7 5 4 2 - 6 3 2 - 6 2 2 4 3 3 2 6 * 4 7 4 3 4 3 6
1% 1% 1% 1% 1% 1% - 1% 2% 1% - 1% * 1% 1% 1% 1% * 1% * 1% 1% 1% * 2% * 1%
Missouri 20 9 11 6 5 6 3 19 - 1 - 10 4 5 1 9 10 5 11 2 6 14 2 11 7 10 10
1% 1% 2% 2% 1% 1% 1% 2% - 1% - 2% 1% 1% * 2% 2% 1% 2% 2% 1% 2% * 2% 3% 1% 1%
Montana 2 2 * 1 1 - - 2 - - - 1 * - * * 1 1 1 - * 2 * 2 * * 2
* * * * * - - * - - - * * - * * * * * - * * * * * * *
Nebraska 4 3 1 1 1 2 1 4 - - - 1 1 2 - 2 2 1 2 - 1 3 3 - 1 2 2
* * * * * * * * - - - * * * - * * * * - * * 1% - * * *
Nevada 19 13 6 7 3 3 7 9 6 * 1 4 7 8 7 9 3 10 7 1 13 6 8 11 1 11 8
1% 2% 1% 2% 1% 1% 2% 1% 3% * 4% 1% 1% 2% 2% 2% 1% 2% 1% 1% 3% 1% 2% 1% * 2% 1%

Page 6
Fielding Period: November 27 - 28, 2018
HCAPS (Filtered on Registered Voters)
Weighted To The U.S. General Adult Population
30 Nov 2018
Table 4
S2 In which state do you reside?
Base: All Respondents
Presidential
Election Candidate
Gender Age Ethnicity Political Party Political Ideology Voted For Education Locale Income
_____________ ______________________ _______________________ ____________________ ____________________ _____________________ _____________ ________________ _________
Colle- Some
Cons- ge Gr- Colle- $75K Less
Hisp- Black Repub- Democ- Indep- Libe- Mode- erva- 3rd ad And ge Or Urb- Subu- Or Than
Total Male Female 18-34 35-49 50-64 65+ White anic /AA Other lican rat endent ral rate tive Clinton Trump Party Higher Less an rban Rural More $75K
______ _____ _______ _____ _____ _____ ____ _____ _____ _____ _____ ______ ______ ______ ______ ______ ______ ________ ______ _____ ______ ______ ____ _____ _____ ____ ____
Weighted Base 1407 687 720 383 345 382 297 938 208 169 26 450 521 408 385 593 429 547 532 108 481 926 395 742 270 679 704
New Hampshire 5 4 2 - 2 1 2 4 - * 1 - 3 2 2 2 1 3 1 - 2 4 * 4 1 2 2
* 1% * - 1% * 1% * - * 5% - 1% 1% * * * * * - * * * 1% 1% * *
New Jersey 36 22 14 7 12 15 1 29 3 1 - 12 14 9 6 18 12 13 15 6 17 19 5 27 3 26 10
3% 3% 2% 2% 4% 4% * 3% 1% 1% - 3% 3% 2% 2% 3% 3% 2% 3% 5% 3% 2% 1% 4% 1% 4% 1%
New Mexico 11 5 6 3 5 3 - 3 8 - - 4 4 2 * 8 3 3 5 2 5 6 4 5 2 3 8
1% 1% 1% 1% 1% 1% - * 4% - - 1% 1% * * 1% 1% * 1% 1% 1% 1% 1% 1% 1% * 1%
New York 79 47 32 17 12 30 21 50 10 10 3 19 38 21 21 38 20 32 25 11 44 36 33 40 6 45 32
6% 7% 4% 4% 3% 8% 7% 5% 5% 6% 13% 4% 7% 5% 5% 6% 5% 6% 5% 10% 9% 4% 8% 5% 2% 7% 4%
North Carolina 50 21 29 16 9 12 13 37 2 8 1 16 10 23 11 26 14 12 24 5 19 32 12 30 8 25 25
4% 3% 4% 4% 3% 3% 4% 4% 1% 5% 2% 4% 2% 6% 3% 4% 3% 2% 5% 5% 4% 3% 3% 4% 3% 4% 4%
North Dakota 2 2 - 1 - - 1 2 - - - - - 2 - 1 1 - - 2 - 2 - 2 - 1 1
* * - * - - * * - - - - - * - * * - - 2% - * - * - * *
Ohio 67 23 44 13 27 12 15 50 3 10 2 22 22 22 11 31 25 29 25 4 19 48 18 32 17 33 31
5% 3% 6% 3% 8% 3% 5% 5% 2% 6% 6% 5% 4% 5% 3% 5% 6% 5% 5% 3% 4% 5% 5% 4% 6% 5% 4%
Oklahoma 8 5 3 1 2 2 3 6 - 1 * 4 3 1 1 4 2 4 4 - 2 6 4 4 1 2 6
1% 1% * * 1% 1% 1% 1% - 1% 2% 1% 1% * * 1% 1% 1% 1% - * 1% 1% 1% * * 1%
Oregon 9 5 4 1 - 6 1 9 - - - 1 3 4 2 5 2 3 5 - 4 4 1 8 - 4 4
1% 1% 1% * - 2% * 1% - - - * 1% 1% * 1% * 1% 1% - 1% * * 1% - 1% 1%
Pennsylvania 57 29 28 13 18 19 6 41 8 6 - 17 26 14 19 19 19 22 21 5 21 36 11 34 12 24 32
4% 4% 4% 4% 5% 5% 2% 4% 4% 3% - 4% 5% 3% 5% 3% 4% 4% 4% 5% 4% 4% 3% 5% 4% 4% 4%
Rhode Island 5 3 2 2 3 - - 4 - 1 - - 1 4 1 3 1 2 1 1 4 1 - 5 - 3 2
* * * * 1% - - * - * - - * 1% * 1% * * * 1% 1% * - 1% - * *
South Carolina 18 7 11 6 5 3 4 13 1 4 - 7 7 5 4 8 6 5 10 1 9 9 2 11 6 7 12
1% 1% 2% 2% 1% 1% 1% 1% * 3% - 1% 1% 1% 1% 1% 1% 1% 2% 1% 2% 1% * 1% 2% 1% 2%
South Dakota 1 1 - 1 - * - 1 - - - 1 - - - - 1 - 1 - * 1 - - 1 - 1
* * - * - * - * - - - * - - - - * - * - * * - - * - *
Tennessee 32 16 15 6 10 8 8 28 - 3 1 10 11 10 11 10 11 12 12 - 10 22 8 12 12 14 18
2% 2% 2% 2% 3% 2% 3% 3% - 2% 3% 2% 2% 2% 3% 2% 3% 2% 2% - 2% 2% 2% 2% 5% 2% 3%
Texas 108 43 65 45 27 20 16 45 40 19 2 30 38 37 33 50 25 39 39 2 32 76 35 55 17 48 60
8% 6% 9% 12% 8% 5% 5% 5% 19% 11% 7% 7% 7% 9% 8% 8% 6% 7% 7% 2% 7% 8% 9% 7% 6% 7% 8%

Page 7
Fielding Period: November 27 - 28, 2018
HCAPS (Filtered on Registered Voters)
Weighted To The U.S. General Adult Population
30 Nov 2018
Table 4
S2 In which state do you reside?
Base: All Respondents
Presidential
Election Candidate
Gender Age Ethnicity Political Party Political Ideology Voted For Education Locale Income
_____________ ______________________ _______________________ ____________________ ____________________ _____________________ _____________ ________________ _________
Colle- Some
Cons- ge Gr- Colle- $75K Less
Hisp- Black Repub- Democ- Indep- Libe- Mode- erva- 3rd ad And ge Or Urb- Subu- Or Than
Total Male Female 18-34 35-49 50-64 65+ White anic /AA Other lican rat endent ral rate tive Clinton Trump Party Higher Less an rban Rural More $75K
______ _____ _______ _____ _____ _____ ____ _____ _____ _____ _____ ______ ______ ______ ______ ______ ______ ________ ______ _____ ______ ______ ____ _____ _____ ____ ____
Weighted Base 1407 687 720 383 345 382 297 938 208 169 26 450 521 408 385 593 429 547 532 108 481 926 395 742 270 679 704
Utah 4 2 2 1 2 * 1 4 - - - 2 1 2 - 3 1 1 2 - 2 2 - 4 1 2 3
* * * * * * * * - - - * * 1% - * * * * - * * - * * * *
Vermont 1 1 * - * 1 - 1 - - - - 1 * - * 1 - * * * 1 - * 1 - 1
* * * - * * - * - - - - * * - * * - * * * * - * * - *
Virginia 42 19 23 17 5 15 5 32 2 3 - 18 17 7 14 9 20 20 20 - 16 27 2 27 13 23 19
3% 3% 3% 4% 2% 4% 2% 3% 1% 2% - 4% 3% 2% 4% 1% 5% 4% 4% - 3% 3% 1% 4% 5% 3% 3%
Washington 28 12 16 3 6 7 12 24 3 - 1 12 8 7 11 9 8 10 16 * 4 23 4 15 9 18 10
2% 2% 2% 1% 2% 2% 4% 3% 2% - 3% 3% 2% 2% 3% 2% 2% 2% 3% * 1% 3% 1% 2% 3% 3% 1%
West Virginia 4 - 4 1 2 1 - 4 - - - 2 * 1 - 2 1 1 2 - 1 2 1 * 3 1 3
* - 1% * 1% * - * - - - * * * - * * * * - * * * * 1% * *
Wisconsin 29 14 14 8 4 14 1 28 - 1 - 11 10 7 9 13 6 13 10 1 10 19 11 11 7 16 13
2% 2% 2% 2% 1% 4% * 3% - 1% - 2% 2% 2% 2% 2% 1% 2% 2% 1% 2% 2% 3% 1% 3% 2% 2%
Wyoming 2 1 2 1 1 1 - 2 - - - 2 1 - 1 - 2 1 1 1 1 2 - 1 1 1 2
* * * * * * - * - - - * * - * - * * * * * * - * 1% * *
Sigma 1407 687 720 383 345 382 297 938 208 169 26 450 521 408 385 593 429 547 532 108 481 926 395 742 270 679 704
100% 100% 100% 100% 100% 100% 100% 100% 100% 100% 100% 100% 100% 100% 100% 100% 100% 100% 100% 100% 100% 100% 100% 100% 100% 100% 100%

Page 8
Fielding Period: November 27 - 28, 2018
HCAPS (Filtered on Registered Voters)
Weighted To The U.S. General Adult Population
30 Nov 2018
Table 5
S1 Are you at least 18 years of age and registered to vote?
Base: All Respondents
Presidential
Election Candidate
Gender Age Ethnicity Political Party Political Ideology Voted For Education Locale Income
_____________ ______________________ _______________________ ____________________ ____________________ _____________________ _____________ ________________ _________
Colle- Some
Cons- ge Gr- Colle- $75K Less
Hisp- Black Repub- Democ- Indep- Libe- Mode- erva- 3rd ad And ge Or Urb- Subu- Or Than
Total Male Female 18-34 35-49 50-64 65+ White anic /AA Other lican rat endent ral rate tive Clinton Trump Party Higher Less an rban Rural More $75K
______ _____ _______ _____ _____ _____ ____ _____ _____ _____ _____ ______ ______ ______ ______ ______ ______ ________ ______ _____ ______ ______ ____ _____ _____ ____ ____
Unweighted Base 1407 675 732 416 359 364 268 1049 104 173 25 437 526 382 437 549 421 537 505 113 543 864 388 719 300 548 846
Weighted Base 1407 687 720 383 345 382 297 938 208 169 26 450 521 408 385 593 429 547 532 108 481 926 395 742 270 679 704
Yes 1407 687 720 383 345 382 297 938 208 169 26 450 521 408 385 593 429 547 532 108 481 926 395 742 270 679 704
100% 100% 100% 100% 100% 100% 100% 100% 100% 100% 100% 100% 100% 100% 100% 100% 100% 100% 100% 100% 100% 100% 100% 100% 100% 100% 100%
No - - - - - - - - - - - - - - - - - - - - - - - - - - -
- - - - - - - - - - - - - - - - - - - - - - - - - - -
Sigma 1407 687 720 383 345 382 297 938 208 169 26 450 521 408 385 593 429 547 532 108 481 926 395 742 270 679 704
100% 100% 100% 100% 100% 100% 100% 100% 100% 100% 100% 100% 100% 100% 100% 100% 100% 100% 100% 100% 100% 100% 100% 100% 100% 100% 100%

Page 9
Fielding Period: November 27 - 28, 2018
HCAPS (Filtered on Registered Voters)
Weighted To The U.S. General Adult Population
30 Nov 2018
Table 6
M1 In general, do you think the country is on the right track or is it off on the wrong track?
Base: All Respondents
Presidential
Election Candidate
Gender Age Ethnicity Political Party Political Ideology Voted For Education Locale Income
_____________ ______________________ _______________________ ____________________ ____________________ _____________________ _____________ ________________ _________
Colle- Some
Cons- ge Gr- Colle- $75K Less
Hisp- Black Repub- Democ- Indep- Libe- Mode- erva- 3rd ad And ge Or Urb- Subu- Or Than
Total Male Female 18-34 35-49 50-64 65+ White anic /AA Other lican rat endent ral rate tive Clinton Trump Party Higher Less an rban Rural More $75K
______ _____ _______ _____ _____ _____ ____ _____ _____ _____ _____ ______ ______ ______ ______ ______ ______ ________ ______ _____ ______ ______ ____ _____ _____ ____ ____
Unweighted Base 1407 675 732 416 359 364 268 1049 104 173 25 437 526 382 437 549 421 537 505 113 543 864 388 719 300 548 846
Weighted Base 1407 687 720 383 345 382 297 938 208 169 26 450 521 408 385 593 429 547 532 108 481 926 395 742 270 679 704
Right track 564 298 266 152 153 146 114 436 69 35 4 333 68 160 75 206 284 65 407 27 179 386 152 293 119 278 275
40% 43% 37% 40% 44% 38% 38% 46% 33% 21% 17% 74% 13% 39% 19% 35% 66% 12% 77% 25% 37% 42% 39% 40% 44% 41% 39%
Wrong track 730 348 382 191 168 204 167 430 121 123 20 86 420 210 296 321 114 455 89 68 277 453 219 387 124 365 361
52% 51% 53% 50% 49% 54% 56% 46% 58% 73% 79% 19% 81% 51% 77% 54% 27% 83% 17% 63% 58% 49% 55% 52% 46% 54% 51%
Don't know / Unsure 112 40 72 39 25 32 17 73 18 11 1 31 33 38 15 67 31 27 36 13 26 87 24 61 27 36 68
8% 6% 10% 10% 7% 8% 6% 8% 9% 7% 4% 7% 6% 9% 4% 11% 7% 5% 7% 12% 5% 9% 6% 8% 10% 5% 10%
Sigma 1407 687 720 383 345 382 297 938 208 169 26 450 521 408 385 593 429 547 532 108 481 926 395 742 270 679 704
100% 100% 100% 100% 100% 100% 100% 100% 100% 100% 100% 100% 100% 100% 100% 100% 100% 100% 100% 100% 100% 100% 100% 100% 100% 100% 100%

Page 10
Fielding Period: November 27 - 28, 2018
HCAPS (Filtered on Registered Voters)
Weighted To The U.S. General Adult Population
30 Nov 2018
Table 7
M2 In general, do you think the American economy is on the right track or is it off on the wrong track?
Base: All Respondents
Presidential
Election Candidate
Gender Age Ethnicity Political Party Political Ideology Voted For Education Locale Income
_____________ ______________________ _______________________ ____________________ ____________________ _____________________ _____________ ________________ _________
Colle- Some
Cons- ge Gr- Colle- $75K Less
Hisp- Black Repub- Democ- Indep- Libe- Mode- erva- 3rd ad And ge Or Urb- Subu- Or Than
Total Male Female 18-34 35-49 50-64 65+ White anic /AA Other lican rat endent ral rate tive Clinton Trump Party Higher Less an rban Rural More $75K
______ _____ _______ _____ _____ _____ ____ _____ _____ _____ _____ ______ ______ ______ ______ ______ ______ ________ ______ _____ ______ ______ ____ _____ _____ ____ ____
Unweighted Base 1407 675 732 416 359 364 268 1049 104 173 25 437 526 382 437 549 421 537 505 113 543 864 388 719 300 548 846
Weighted Base 1407 687 720 383 345 382 297 938 208 169 26 450 521 408 385 593 429 547 532 108 481 926 395 742 270 679 704
Right track 668 371 297 175 153 182 158 512 75 42 9 360 111 191 100 241 327 124 430 38 235 433 172 363 133 329 326
47% 54% 41% 46% 44% 48% 53% 55% 36% 25% 34% 80% 21% 47% 26% 41% 76% 23% 81% 35% 49% 47% 44% 49% 49% 48% 46%
Wrong track 579 247 332 163 153 158 106 327 100 110 14 54 335 178 238 266 76 354 69 54 203 377 178 298 104 278 297
41% 36% 46% 43% 44% 41% 36% 35% 48% 65% 53% 12% 64% 44% 62% 45% 18% 65% 13% 50% 42% 41% 45% 40% 38% 41% 42%
Don't know / Unsure 159 68 91 45 39 42 34 99 33 17 3 36 75 39 48 86 26 69 33 16 44 116 45 81 33 73 81
11% 10% 13% 12% 11% 11% 11% 11% 16% 10% 12% 8% 14% 10% 12% 14% 6% 13% 6% 15% 9% 13% 11% 11% 12% 11% 12%
Sigma 1407 687 720 383 345 382 297 938 208 169 26 450 521 408 385 593 429 547 532 108 481 926 395 742 270 679 704
100% 100% 100% 100% 100% 100% 100% 100% 100% 100% 100% 100% 100% 100% 100% 100% 100% 100% 100% 100% 100% 100% 100% 100% 100% 100% 100%

Page 11
Fielding Period: November 27 - 28, 2018
HCAPS (Filtered on Registered Voters)
Weighted To The U.S. General Adult Population
30 Nov 2018
Table 8
I3 How strong do you think the U.S. economy is today?
Base: All Respondents
Presidential
Election Candidate
Gender Age Ethnicity Political Party Political Ideology Voted For Education Locale Income
_____________ ______________________ _______________________ ____________________ ____________________ _____________________ _____________ ________________ _________
Colle- Some
Cons- ge Gr- Colle- $75K Less
Hisp- Black Repub- Democ- Indep- Libe- Mode- erva- 3rd ad And ge Or Urb- Subu- Or Than
Total Male Female 18-34 35-49 50-64 65+ White anic /AA Other lican rat endent ral rate tive Clinton Trump Party Higher Less an rban Rural More $75K
______ _____ _______ _____ _____ _____ ____ _____ _____ _____ _____ ______ ______ ______ ______ ______ ______ ________ ______ _____ ______ ______ ____ _____ _____ ____ ____
Unweighted Base 1407 675 732 416 359 364 268 1049 104 173 25 437 526 382 437 549 421 537 505 113 543 864 388 719 300 548 846
Weighted Base 1407 687 720 383 345 382 297 938 208 169 26 450 521 408 385 593 429 547 532 108 481 926 395 742 270 679 704
Strong (Net) 991 526 465 269 230 271 221 713 126 98 11 399 291 290 221 404 367 326 472 64 362 629 279 523 189 497 474
70% 77% 65% 70% 67% 71% 74% 76% 61% 58% 44% 89% 56% 71% 57% 68% 86% 60% 89% 59% 75% 68% 71% 71% 70% 73% 67%
Very strong 259 155 104 78 55 72 53 210 26 15 1 158 43 57 45 66 147 38 186 10 89 170 67 141 51 148 108
18% 23% 14% 20% 16% 19% 18% 22% 12% 9% 3% 35% 8% 14% 12% 11% 34% 7% 35% 10% 18% 18% 17% 19% 19% 22% 15%
Somewhat strong 732 371 361 191 175 198 168 503 101 83 11 241 248 233 176 337 219 287 286 54 273 459 212 382 138 349 366
52% 54% 50% 50% 51% 52% 57% 54% 48% 49% 41% 53% 48% 57% 46% 57% 51% 53% 54% 50% 57% 50% 54% 52% 51% 51% 52%
Weak (Net) 416 161 255 114 115 111 76 225 82 71 15 51 229 118 164 189 62 221 60 44 119 297 116 219 81 182 230
30% 23% 35% 30% 33% 29% 26% 24% 39% 42% 56% 11% 44% 29% 43% 32% 14% 40% 11% 41% 25% 32% 29% 29% 30% 27% 33%
Somewhat weak 345 126 219 88 95 90 73 183 73 55 12 40 194 100 139 153 53 185 47 36 106 239 89 188 68 147 195
25% 18% 30% 23% 28% 24% 24% 20% 35% 33% 46% 9% 37% 24% 36% 26% 12% 34% 9% 33% 22% 26% 23% 25% 25% 22% 28%
Very weak 70 35 36 26 20 21 3 42 9 16 3 11 35 18 25 36 9 36 12 8 13 58 27 30 13 35 35
5% 5% 5% 7% 6% 5% 1% 4% 4% 9% 10% 2% 7% 4% 7% 6% 2% 7% 2% 8% 3% 6% 7% 4% 5% 5% 5%
Sigma 1407 687 720 383 345 382 297 938 208 169 26 450 521 408 385 593 429 547 532 108 481 926 395 742 270 679 704
100% 100% 100% 100% 100% 100% 100% 100% 100% 100% 100% 100% 100% 100% 100% 100% 100% 100% 100% 100% 100% 100% 100% 100% 100% 100% 100%

Page 12
Fielding Period: November 27 - 28, 2018
HCAPS (Filtered on Registered Voters)
Weighted To The U.S. General Adult Population
30 Nov 2018
Table 9
I4 Would you say that your personal financial situation is improving or getting worse?
Base: All Respondents
Presidential
Election Candidate
Gender Age Ethnicity Political Party Political Ideology Voted For Education Locale Income
_____________ ______________________ _______________________ ____________________ ____________________ _____________________ _____________ ________________ _________
Colle- Some
Cons- ge Gr- Colle- $75K Less
Hisp- Black Repub- Democ- Indep- Libe- Mode- erva- 3rd ad And ge Or Urb- Subu- Or Than
Total Male Female 18-34 35-49 50-64 65+ White anic /AA Other lican rat endent ral rate tive Clinton Trump Party Higher Less an rban Rural More $75K
______ _____ _______ _____ _____ _____ ____ _____ _____ _____ _____ ______ ______ ______ ______ ______ ______ ________ ______ _____ ______ ______ ____ _____ _____ ____ ____
Unweighted Base 1407 675 732 416 359 364 268 1049 104 173 25 437 526 382 437 549 421 537 505 113 543 864 388 719 300 548 846
Weighted Base 1407 687 720 383 345 382 297 938 208 169 26 450 521 408 385 593 429 547 532 108 481 926 395 742 270 679 704
Improving 451 249 202 131 130 110 80 315 59 49 8 221 110 118 109 139 203 113 268 21 169 282 135 226 90 242 204
32% 36% 28% 34% 38% 29% 27% 34% 28% 29% 31% 49% 21% 29% 28% 23% 47% 21% 50% 20% 35% 30% 34% 30% 33% 36% 29%
Getting worse 359 152 207 97 91 104 66 220 59 58 9 65 172 111 115 173 70 188 70 33 100 259 116 173 70 143 210
25% 22% 29% 25% 26% 27% 22% 23% 28% 34% 33% 14% 33% 27% 30% 29% 16% 34% 13% 30% 21% 28% 29% 23% 26% 21% 30%
Just as well off 509 255 254 132 99 139 141 363 62 47 8 145 201 159 139 226 144 214 180 43 195 314 113 305 92 267 237
36% 37% 35% 34% 29% 36% 47% 39% 30% 28% 32% 32% 39% 39% 36% 38% 34% 39% 34% 40% 41% 34% 29% 41% 34% 39% 34%
No opinion 89 31 58 23 25 30 11 41 28 15 1 20 38 20 22 55 12 32 14 11 18 71 31 38 19 27 53
6% 5% 8% 6% 7% 8% 4% 4% 13% 9% 4% 5% 7% 5% 6% 9% 3% 6% 3% 10% 4% 8% 8% 5% 7% 4% 8%
Sigma 1407 687 720 383 345 382 297 938 208 169 26 450 521 408 385 593 429 547 532 108 481 926 395 742 270 679 704
100% 100% 100% 100% 100% 100% 100% 100% 100% 100% 100% 100% 100% 100% 100% 100% 100% 100% 100% 100% 100% 100% 100% 100% 100% 100% 100%

Page 13
Fielding Period: November 27 - 28, 2018
HCAPS (Filtered on Registered Voters)
Weighted To The U.S. General Adult Population
30 Nov 2018
Table 10
M3 Do you approve or disapprove of the job Donald Trump is doing as President of the United States?
Base: All Respondents
Presidential
Election Candidate
Gender Age Ethnicity Political Party Political Ideology Voted For Education Locale Income
_____________ ______________________ _______________________ ____________________ ____________________ _____________________ _____________ ________________ _________
Colle- Some
Cons- ge Gr- Colle- $75K Less
Hisp- Black Repub- Democ- Indep- Libe- Mode- erva- 3rd ad And ge Or Urb- Subu- Or Than
Total Male Female 18-34 35-49 50-64 65+ White anic /AA Other lican rat endent ral rate tive Clinton Trump Party Higher Less an rban Rural More $75K
______ _____ _______ _____ _____ _____ ____ _____ _____ _____ _____ ______ ______ ______ ______ ______ ______ ________ ______ _____ ______ ______ ____ _____ _____ ____ ____
Unweighted Base 1407 675 732 416 359 364 268 1049 104 173 25 437 526 382 437 549 421 537 505 113 543 864 388 719 300 548 846
Weighted Base 1407 687 720 383 345 382 297 938 208 169 26 450 521 408 385 593 429 547 532 108 481 926 395 742 270 679 704
Approve (Net) 651 333 318 171 177 172 131 507 73 37 8 388 75 179 81 225 346 57 485 33 190 461 163 336 152 314 318
46% 48% 44% 45% 51% 45% 44% 54% 35% 22% 33% 86% 14% 44% 21% 38% 81% 10% 91% 31% 40% 50% 41% 45% 56% 46% 45%
Strongly approve 325 168 157 74 90 95 67 265 38 8 5 233 26 62 39 76 210 22 271 7 94 231 79 156 90 159 159
23% 24% 22% 19% 26% 25% 23% 28% 18% 5% 21% 52% 5% 15% 10% 13% 49% 4% 51% 7% 19% 25% 20% 21% 33% 23% 23%
Somewhat approve 326 165 161 97 87 78 64 242 35 29 3 155 49 117 41 148 136 35 214 26 97 229 84 180 62 155 160
23% 24% 22% 25% 25% 20% 21% 26% 17% 17% 11% 34% 9% 29% 11% 25% 32% 6% 40% 24% 20% 25% 21% 24% 23% 23% 23%
Disapprove (Net) 756 354 402 212 169 209 167 432 135 132 17 62 445 229 305 368 83 490 46 75 291 465 232 405 119 365 386
54% 52% 56% 55% 49% 55% 56% 46% 65% 78% 67% 14% 86% 56% 79% 62% 19% 90% 9% 69% 60% 50% 59% 55% 44% 54% 55%
Somewhat disapprove 228 91 137 83 61 56 28 142 41 26 4 42 85 93 42 145 42 97 32 33 81 147 69 129 31 101 125
16% 13% 19% 22% 18% 15% 10% 15% 19% 16% 15% 9% 16% 23% 11% 24% 10% 18% 6% 31% 17% 16% 17% 17% 11% 15% 18%
Strongly disapprove 528 263 265 129 107 154 138 290 95 106 14 20 360 136 263 223 41 393 14 42 210 318 164 277 87 264 260
38% 38% 37% 34% 31% 40% 46% 31% 45% 63% 53% 4% 69% 33% 68% 38% 10% 72% 3% 39% 44% 34% 41% 37% 32% 39% 37%
Sigma 1407 687 720 383 345 382 297 938 208 169 26 450 521 408 385 593 429 547 532 108 481 926 395 742 270 679 704
100% 100% 100% 100% 100% 100% 100% 100% 100% 100% 100% 100% 100% 100% 100% 100% 100% 100% 100% 100% 100% 100% 100% 100% 100% 100% 100%

Page 14
Fielding Period: November 27 - 28, 2018
HCAPS (Filtered on Registered Voters)
Weighted To The U.S. General Adult Population
30 Nov 2018
Table 11
M3A Do you approve or disapprove of the job President Trump is doing on ...?
Summary Of Approve
Base: All Respondents
Presidential
Election Candidate
Gender Age Ethnicity Political Party Political Ideology Voted For Education Locale Income
_____________ ______________________ _______________________ ____________________ ____________________ _____________________ _____________ ________________ _________
Colle- Some
Cons- ge Gr- Colle- $75K Less
Hisp- Black Repub- Democ- Indep- Libe- Mode- erva- 3rd ad And ge Or Urb- Subu- Or Than
Total Male Female 18-34 35-49 50-64 65+ White anic /AA Other lican rat endent ral rate tive Clinton Trump Party Higher Less an rban Rural More $75K
______ _____ _______ _____ _____ _____ ____ _____ _____ _____ _____ ______ ______ ______ ______ ______ ______ ________ ______ _____ ______ ______ ____ _____ _____ ____ ____
Unweighted Base 1407 675 732 416 359 364 268 1049 104 173 25 437 526 382 437 549 421 537 505 113 543 864 388 719 300 548 846
Weighted Base 1407 687 720 383 345 382 297 938 208 169 26 450 521 408 385 593 429 547 532 108 481 926 395 742 270 679 704
The economy 790 414 377 215 189 206 179 593 93 64 9 406 139 235 121 307 362 150 493 47 259 531 198 425 167 386 385
56% 60% 52% 56% 55% 54% 60% 63% 44% 38% 34% 90% 27% 58% 31% 52% 85% 27% 93% 43% 54% 57% 50% 57% 62% 57% 55%
Fighting terrorism 770 414 356 203 193 216 159 582 87 57 12 406 112 238 107 307 356 123 490 51 255 516 201 408 162 380 373
55% 60% 49% 53% 56% 57% 53% 62% 42% 34% 47% 90% 22% 58% 28% 52% 83% 22% 92% 47% 53% 56% 51% 55% 60% 56% 53%
Stimulating jobs 760 396 364 197 191 199 172 578 80 62 8 393 143 214 117 284 359 132 481 46 246 514 185 411 164 375 367
54% 58% 51% 52% 55% 52% 58% 62% 38% 37% 32% 87% 28% 52% 30% 48% 84% 24% 91% 42% 51% 56% 47% 55% 61% 55% 52%
Immigration 674 351 324 162 180 188 144 515 70 52 10 372 98 195 81 249 345 89 463 38 200 474 172 353 150 323 335
48% 51% 45% 42% 52% 49% 48% 55% 33% 31% 39% 83% 19% 48% 21% 42% 80% 16% 87% 35% 42% 51% 44% 48% 55% 48% 48%
Foreign affairs 605 322 282 151 162 166 125 481 55 36 9 360 80 158 81 197 326 56 447 30 181 423 148 320 136 298 289
43% 47% 39% 40% 47% 43% 42% 51% 26% 21% 34% 80% 15% 39% 21% 33% 76% 10% 84% 27% 38% 46% 38% 43% 50% 44% 41%
Administering the government 596 297 298 158 155 164 118 469 53 41 10 362 77 149 79 202 315 56 436 28 170 425 139 321 135 273 305
42% 43% 41% 41% 45% 43% 40% 50% 25% 24% 39% 80% 15% 36% 21% 34% 73% 10% 82% 26% 35% 46% 35% 43% 50% 40% 43%

Page 15
Fielding Period: November 27 - 28, 2018
HCAPS (Filtered on Registered Voters)
Weighted To The U.S. General Adult Population
30 Nov 2018
Table 12
M3A Do you approve or disapprove of the job President Trump is doing on ...?
Summary Of Disapprove
Base: All Respondents
Presidential
Election Candidate
Gender Age Ethnicity Political Party Political Ideology Voted For Education Locale Income
_____________ ______________________ _______________________ ____________________ ____________________ _____________________ _____________ ________________ _________
Colle- Some
Cons- ge Gr- Colle- $75K Less
Hisp- Black Repub- Democ- Indep- Libe- Mode- erva- 3rd ad And ge Or Urb- Subu- Or Than
Total Male Female 18-34 35-49 50-64 65+ White anic /AA Other lican rat endent ral rate tive Clinton Trump Party Higher Less an rban Rural More $75K
______ _____ _______ _____ _____ _____ ____ _____ _____ _____ _____ ______ ______ ______ ______ ______ ______ ________ ______ _____ ______ ______ ____ _____ _____ ____ ____
Unweighted Base 1407 675 732 416 359 364 268 1049 104 173 25 437 526 382 437 549 421 537 505 113 543 864 388 719 300 548 846
Weighted Base 1407 687 720 383 345 382 297 938 208 169 26 450 521 408 385 593 429 547 532 108 481 926 395 742 270 679 704
Administering the government 811 389 422 225 190 218 179 470 155 128 16 89 443 259 306 391 114 491 96 81 311 500 256 420 135 406 400
58% 57% 59% 59% 55% 57% 60% 50% 75% 76% 61% 20% 85% 64% 79% 66% 27% 90% 18% 74% 65% 54% 65% 57% 50% 60% 57%
Foreign affairs 802 364 438 231 183 216 172 457 153 133 17 91 440 250 305 396 102 491 84 79 300 503 247 421 134 382 415
57% 53% 61% 60% 53% 57% 58% 49% 74% 79% 66% 20% 85% 61% 79% 67% 24% 90% 16% 73% 62% 54% 62% 57% 50% 56% 59%
Immigration 733 336 397 220 165 193 154 424 139 117 16 79 422 213 304 344 84 458 69 70 281 451 223 389 120 356 369
52% 49% 55% 58% 48% 51% 52% 45% 67% 69% 61% 17% 81% 52% 79% 58% 20% 84% 13% 65% 58% 49% 56% 52% 45% 52% 52%
Stimulating jobs 647 291 356 185 154 182 125 361 129 107 18 57 377 194 269 309 69 415 50 62 235 412 210 330 107 304 337
46% 42% 49% 48% 45% 48% 42% 38% 62% 63% 68% 13% 72% 48% 70% 52% 16% 76% 9% 58% 49% 44% 53% 45% 39% 45% 48%
Fighting terrorism 637 272 364 180 153 165 139 356 121 112 14 44 408 170 278 286 72 424 41 57 227 410 194 334 109 299 331
45% 40% 51% 47% 44% 43% 47% 38% 58% 66% 53% 10% 78% 42% 72% 48% 17% 78% 8% 53% 47% 44% 49% 45% 40% 44% 47%
The economy 617 273 344 167 156 176 118 345 116 105 17 44 382 173 265 286 66 397 38 62 222 395 198 317 103 294 319
44% 40% 48% 44% 45% 46% 40% 37% 56% 62% 66% 10% 73% 42% 69% 48% 15% 73% 7% 57% 46% 43% 50% 43% 38% 43% 45%

Page 16
Fielding Period: November 27 - 28, 2018
HCAPS (Filtered on Registered Voters)
Weighted To The U.S. General Adult Population
30 Nov 2018
Table 13
M3A_1 Do you approve or disapprove of the job President Trump is doing on ...?
The economy
Base: All Respondents
Presidential
Election Candidate
Gender Age Ethnicity Political Party Political Ideology Voted For Education Locale Income
_____________ ______________________ _______________________ ____________________ ____________________ _____________________ _____________ ________________ _________
Colle- Some
Cons- ge Gr- Colle- $75K Less
Hisp- Black Repub- Democ- Indep- Libe- Mode- erva- 3rd ad And ge Or Urb- Subu- Or Than
Total Male Female 18-34 35-49 50-64 65+ White anic /AA Other lican rat endent ral rate tive Clinton Trump Party Higher Less an rban Rural More $75K
______ _____ _______ _____ _____ _____ ____ _____ _____ _____ _____ ______ ______ ______ ______ ______ ______ ________ ______ _____ ______ ______ ____ _____ _____ ____ ____
Unweighted Base 1407 675 732 416 359 364 268 1049 104 173 25 437 526 382 437 549 421 537 505 113 543 864 388 719 300 548 846
Weighted Base 1407 687 720 383 345 382 297 938 208 169 26 450 521 408 385 593 429 547 532 108 481 926 395 742 270 679 704
Approve (Net) 790 414 377 215 189 206 179 593 93 64 9 406 139 235 121 307 362 150 493 47 259 531 198 425 167 386 385
56% 60% 52% 56% 55% 54% 60% 63% 44% 38% 34% 90% 27% 58% 31% 52% 85% 27% 93% 43% 54% 57% 50% 57% 62% 57% 55%
Strongly approve 408 237 171 93 94 123 98 336 31 22 4 259 33 113 38 118 252 33 320 19 132 277 90 229 89 213 190
29% 35% 24% 24% 27% 32% 33% 36% 15% 13% 16% 57% 6% 28% 10% 20% 59% 6% 60% 18% 27% 30% 23% 31% 33% 31% 27%
Somewhat approve 382 176 206 122 96 83 81 257 61 42 5 147 106 122 83 189 110 117 173 27 127 255 108 196 78 173 195
27% 26% 29% 32% 28% 22% 27% 27% 29% 25% 19% 33% 20% 30% 21% 32% 26% 21% 32% 25% 26% 27% 27% 26% 29% 25% 28%
Disapprove (Net) 617 273 344 167 156 176 118 345 116 105 17 44 382 173 265 286 66 397 38 62 222 395 198 317 103 294 319
44% 40% 48% 44% 45% 46% 40% 37% 56% 62% 66% 10% 73% 42% 69% 48% 15% 73% 7% 57% 46% 43% 50% 43% 38% 43% 45%
Somewhat disapprove 253 109 145 86 69 58 40 148 46 33 6 31 142 72 90 129 35 142 28 25 81 172 80 132 42 125 128
18% 16% 20% 23% 20% 15% 13% 16% 22% 19% 22% 7% 27% 18% 23% 22% 8% 26% 5% 23% 17% 19% 20% 18% 15% 18% 18%
Strongly disapprove 363 165 199 81 87 117 78 197 70 72 11 13 239 101 175 157 32 255 10 36 141 222 118 184 61 169 191
26% 24% 28% 21% 25% 31% 26% 21% 34% 43% 44% 3% 46% 25% 45% 27% 7% 47% 2% 34% 29% 24% 30% 25% 23% 25% 27%
Sigma 1407 687 720 383 345 382 297 938 208 169 26 450 521 408 385 593 429 547 532 108 481 926 395 742 270 679 704
100% 100% 100% 100% 100% 100% 100% 100% 100% 100% 100% 100% 100% 100% 100% 100% 100% 100% 100% 100% 100% 100% 100% 100% 100% 100% 100%

Page 17
Fielding Period: November 27 - 28, 2018
HCAPS (Filtered on Registered Voters)
Weighted To The U.S. General Adult Population
30 Nov 2018
Table 14
M3A_2 Do you approve or disapprove of the job President Trump is doing on ...?
Foreign affairs
Base: All Respondents
Presidential
Election Candidate
Gender Age Ethnicity Political Party Political Ideology Voted For Education Locale Income
_____________ ______________________ _______________________ ____________________ ____________________ _____________________ _____________ ________________ _________
Colle- Some
Cons- ge Gr- Colle- $75K Less
Hisp- Black Repub- Democ- Indep- Libe- Mode- erva- 3rd ad And ge Or Urb- Subu- Or Than
Total Male Female 18-34 35-49 50-64 65+ White anic /AA Other lican rat endent ral rate tive Clinton Trump Party Higher Less an rban Rural More $75K
______ _____ _______ _____ _____ _____ ____ _____ _____ _____ _____ ______ ______ ______ ______ ______ ______ ________ ______ _____ ______ ______ ____ _____ _____ ____ ____
Unweighted Base 1407 675 732 416 359 364 268 1049 104 173 25 437 526 382 437 549 421 537 505 113 543 864 388 719 300 548 846
Weighted Base 1407 687 720 383 345 382 297 938 208 169 26 450 521 408 385 593 429 547 532 108 481 926 395 742 270 679 704
Approve (Net) 605 322 282 151 162 166 125 481 55 36 9 360 80 158 81 197 326 56 447 30 181 423 148 320 136 298 289
43% 47% 39% 40% 47% 43% 42% 51% 26% 21% 34% 80% 15% 39% 21% 33% 76% 10% 84% 27% 38% 46% 38% 43% 50% 44% 41%
Strongly approve 321 176 146 73 80 96 72 269 29 10 3 217 31 71 37 81 204 20 263 14 104 217 79 171 72 174 140
23% 26% 20% 19% 23% 25% 24% 29% 14% 6% 14% 48% 6% 17% 9% 14% 48% 4% 49% 13% 22% 23% 20% 23% 27% 26% 20%
Somewhat approve 283 147 136 79 82 69 53 213 25 26 5 143 49 87 44 116 122 37 184 16 77 206 70 150 64 124 149
20% 21% 19% 21% 24% 18% 18% 23% 12% 15% 21% 32% 9% 21% 11% 20% 29% 7% 35% 15% 16% 22% 18% 20% 24% 18% 21%
Disapprove (Net) 802 364 438 231 183 216 172 457 153 133 17 91 440 250 305 396 102 491 84 79 300 503 247 421 134 382 415
57% 53% 61% 60% 53% 57% 58% 49% 74% 79% 66% 20% 85% 61% 79% 67% 24% 90% 16% 73% 62% 54% 62% 57% 50% 56% 59%
Somewhat disapprove 263 104 159 102 58 62 40 159 54 30 3 64 98 91 51 156 55 106 62 31 79 184 74 135 54 113 150
19% 15% 22% 27% 17% 16% 14% 17% 26% 18% 13% 14% 19% 22% 13% 26% 13% 19% 12% 28% 16% 20% 19% 18% 20% 17% 21%
Strongly disapprove 540 261 279 129 125 154 132 298 100 103 14 27 342 160 253 240 47 384 23 48 221 319 173 287 81 269 266
38% 38% 39% 34% 36% 40% 44% 32% 48% 61% 53% 6% 66% 39% 66% 40% 11% 70% 4% 44% 46% 34% 44% 39% 30% 40% 38%
Sigma 1407 687 720 383 345 382 297 938 208 169 26 450 521 408 385 593 429 547 532 108 481 926 395 742 270 679 704
100% 100% 100% 100% 100% 100% 100% 100% 100% 100% 100% 100% 100% 100% 100% 100% 100% 100% 100% 100% 100% 100% 100% 100% 100% 100% 100%

Page 18
Fielding Period: November 27 - 28, 2018
HCAPS (Filtered on Registered Voters)
Weighted To The U.S. General Adult Population
30 Nov 2018
Table 15
M3A_3 Do you approve or disapprove of the job President Trump is doing on ...?
Fighting terrorism
Base: All Respondents
Presidential
Election Candidate
Gender Age Ethnicity Political Party Political Ideology Voted For Education Locale Income
_____________ ______________________ _______________________ ____________________ ____________________ _____________________ _____________ ________________ _________
Colle- Some
Cons- ge Gr- Colle- $75K Less
Hisp- Black Repub- Democ- Indep- Libe- Mode- erva- 3rd ad And ge Or Urb- Subu- Or Than
Total Male Female 18-34 35-49 50-64 65+ White anic /AA Other lican rat endent ral rate tive Clinton Trump Party Higher Less an rban Rural More $75K
______ _____ _______ _____ _____ _____ ____ _____ _____ _____ _____ ______ ______ ______ ______ ______ ______ ________ ______ _____ ______ ______ ____ _____ _____ ____ ____
Unweighted Base 1407 675 732 416 359 364 268 1049 104 173 25 437 526 382 437 549 421 537 505 113 543 864 388 719 300 548 846
Weighted Base 1407 687 720 383 345 382 297 938 208 169 26 450 521 408 385 593 429 547 532 108 481 926 395 742 270 679 704
Approve (Net) 770 414 356 203 193 216 159 582 87 57 12 406 112 238 107 307 356 123 490 51 255 516 201 408 162 380 373
55% 60% 49% 53% 56% 57% 53% 62% 42% 34% 47% 90% 22% 58% 28% 52% 83% 22% 92% 47% 53% 56% 51% 55% 60% 56% 53%
Strongly approve 401 224 177 86 93 119 104 335 32 16 3 255 39 105 44 117 240 29 319 16 127 274 86 219 96 201 191
29% 33% 25% 23% 27% 31% 35% 36% 15% 9% 12% 57% 7% 26% 11% 20% 56% 5% 60% 15% 26% 30% 22% 29% 36% 30% 27%
Somewhat approve 369 190 179 116 100 97 55 248 56 41 9 151 74 133 63 189 117 95 171 35 128 241 115 189 65 179 182
26% 28% 25% 30% 29% 26% 18% 26% 27% 25% 35% 34% 14% 33% 16% 32% 27% 17% 32% 32% 27% 26% 29% 26% 24% 26% 26%
Disapprove (Net) 637 272 364 180 153 165 139 356 121 112 14 44 408 170 278 286 72 424 41 57 227 410 194 334 109 299 331
45% 40% 51% 47% 44% 43% 47% 38% 58% 66% 53% 10% 78% 42% 72% 48% 17% 78% 8% 53% 47% 44% 49% 45% 40% 44% 47%
Somewhat disapprove 243 94 149 79 60 55 49 144 45 34 2 31 137 70 81 124 39 134 32 27 81 163 65 132 47 118 124
17% 14% 21% 21% 18% 14% 17% 15% 22% 20% 9% 7% 26% 17% 21% 21% 9% 24% 6% 25% 17% 18% 16% 18% 17% 17% 18%
Strongly disapprove 393 178 215 101 92 111 89 213 76 78 11 13 271 100 197 162 33 290 9 30 146 247 130 202 62 182 207
28% 26% 30% 26% 27% 29% 30% 23% 36% 46% 44% 3% 52% 25% 51% 27% 8% 53% 2% 28% 30% 27% 33% 27% 23% 27% 29%
Sigma 1407 687 720 383 345 382 297 938 208 169 26 450 521 408 385 593 429 547 532 108 481 926 395 742 270 679 704
100% 100% 100% 100% 100% 100% 100% 100% 100% 100% 100% 100% 100% 100% 100% 100% 100% 100% 100% 100% 100% 100% 100% 100% 100% 100% 100%
Page 19
Fielding Period: November 27 - 28, 2018
HCAPS (Filtered on Registered Voters)
Weighted To The U.S. General Adult Population
30 Nov 2018
Table 16
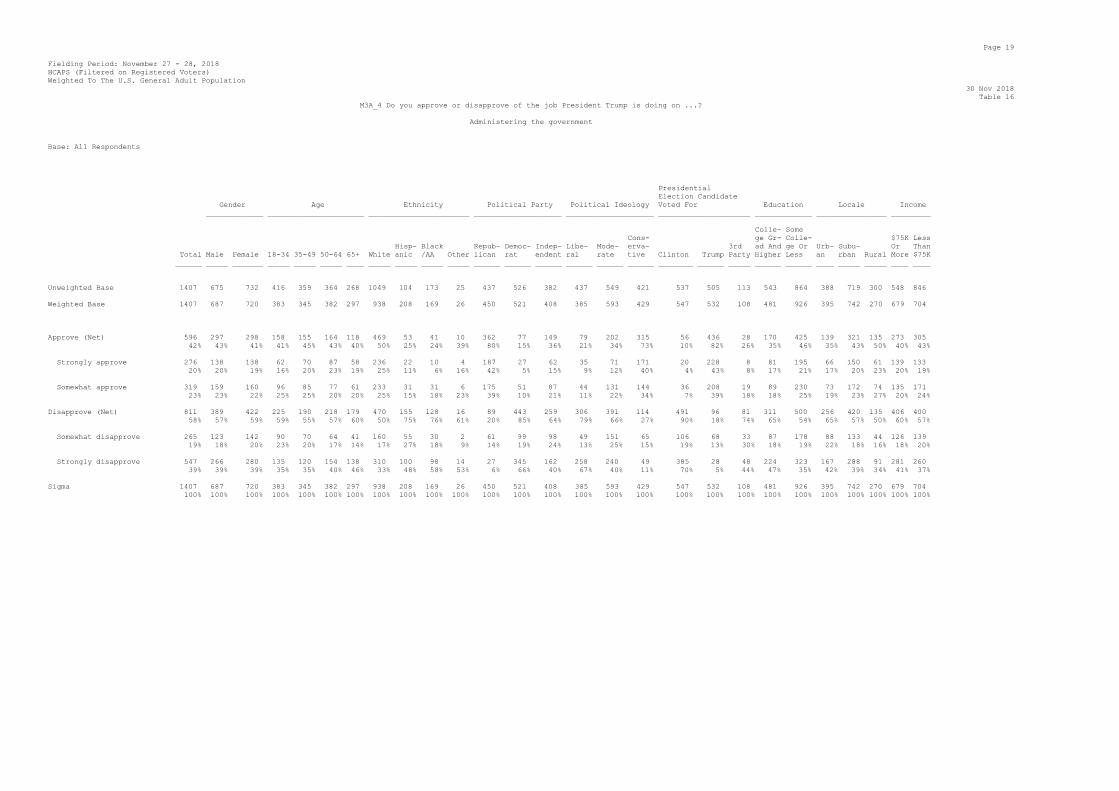
M3A_4 Do you approve or disapprove of the job President Trump is doing on ...?
Administering the government
Base: All Respondents
Presidential
Election Candidate
Gender Age Ethnicity Political Party Political Ideology Voted For Education Locale Income
_____________ ______________________ _______________________ ____________________ ____________________ _____________________ _____________ ________________ _________
Colle- Some
Cons- ge Gr- Colle- $75K Less
Hisp- Black Repub- Democ- Indep- Libe- Mode- erva- 3rd ad And ge Or Urb- Subu- Or Than
Total Male Female 18-34 35-49 50-64 65+ White anic /AA Other lican rat endent ral rate tive Clinton Trump Party Higher Less an rban Rural More $75K
______ _____ _______ _____ _____ _____ ____ _____ _____ _____ _____ ______ ______ ______ ______ ______ ______ ________ ______ _____ ______ ______ ____ _____ _____ ____ ____
Unweighted Base 1407 675 732 416 359 364 268 1049 104 173 25 437 526 382 437 549 421 537 505 113 543 864 388 719 300 548 846
Weighted Base 1407 687 720 383 345 382 297 938 208 169 26 450 521 408 385 593 429 547 532 108 481 926 395 742 270 679 704
Approve (Net) 596 297 298 158 155 164 118 469 53 41 10 362 77 149 79 202 315 56 436 28 170 425 139 321 135 273 305
42% 43% 41% 41% 45% 43% 40% 50% 25% 24% 39% 80% 15% 36% 21% 34% 73% 10% 82% 26% 35% 46% 35% 43% 50% 40% 43%
Strongly approve 276 138 138 62 70 87 58 236 22 10 4 187 27 62 35 71 171 20 228 8 81 195 66 150 61 139 133
20% 20% 19% 16% 20% 23% 19% 25% 11% 6% 16% 42% 5% 15% 9% 12% 40% 4% 43% 8% 17% 21% 17% 20% 23% 20% 19%
Somewhat approve 319 159 160 96 85 77 61 233 31 31 6 175 51 87 44 131 144 36 208 19 89 230 73 172 74 135 171
23% 23% 22% 25% 25% 20% 20% 25% 15% 18% 23% 39% 10% 21% 11% 22% 34% 7% 39% 18% 18% 25% 19% 23% 27% 20% 24%
Disapprove (Net) 811 389 422 225 190 218 179 470 155 128 16 89 443 259 306 391 114 491 96 81 311 500 256 420 135 406 400
58% 57% 59% 59% 55% 57% 60% 50% 75% 76% 61% 20% 85% 64% 79% 66% 27% 90% 18% 74% 65% 54% 65% 57% 50% 60% 57%
Somewhat disapprove 265 123 142 90 70 64 41 160 55 30 2 61 99 98 49 151 65 106 68 33 87 178 88 133 44 126 139
19% 18% 20% 23% 20% 17% 14% 17% 27% 18% 9% 14% 19% 24% 13% 25% 15% 19% 13% 30% 18% 19% 22% 18% 16% 18% 20%
Strongly disapprove 547 266 280 135 120 154 138 310 100 98 14 27 345 162 258 240 49 385 28 48 224 323 167 288 91 281 260
39% 39% 39% 35% 35% 40% 46% 33% 48% 58% 53% 6% 66% 40% 67% 40% 11% 70% 5% 44% 47% 35% 42% 39% 34% 41% 37%
Sigma 1407 687 720 383 345 382 297 938 208 169 26 450 521 408 385 593 429 547 532 108 481 926 395 742 270 679 704
100% 100% 100% 100% 100% 100% 100% 100% 100% 100% 100% 100% 100% 100% 100% 100% 100% 100% 100% 100% 100% 100% 100% 100% 100% 100% 100%

Page 20
Fielding Period: November 27 - 28, 2018
HCAPS (Filtered on Registered Voters)
Weighted To The U.S. General Adult Population
30 Nov 2018
Table 17
M3A_5 Do you approve or disapprove of the job President Trump is doing on ...?
Stimulating jobs
Base: All Respondents
Presidential
Election Candidate
Gender Age Ethnicity Political Party Political Ideology Voted For Education Locale Income
_____________ ______________________ _______________________ ____________________ ____________________ _____________________ _____________ ________________ _________
Colle- Some
Cons- ge Gr- Colle- $75K Less
Hisp- Black Repub- Democ- Indep- Libe- Mode- erva- 3rd ad And ge Or Urb- Subu- Or Than
Total Male Female 18-34 35-49 50-64 65+ White anic /AA Other lican rat endent ral rate tive Clinton Trump Party Higher Less an rban Rural More $75K
______ _____ _______ _____ _____ _____ ____ _____ _____ _____ _____ ______ ______ ______ ______ ______ ______ ________ ______ _____ ______ ______ ____ _____ _____ ____ ____
Unweighted Base 1407 675 732 416 359 364 268 1049 104 173 25 437 526 382 437 549 421 537 505 113 543 864 388 719 300 548 846
Weighted Base 1407 687 720 383 345 382 297 938 208 169 26 450 521 408 385 593 429 547 532 108 481 926 395 742 270 679 704
Approve (Net) 760 396 364 197 191 199 172 578 80 62 8 393 143 214 117 284 359 132 481 46 246 514 185 411 164 375 367
54% 58% 51% 52% 55% 52% 58% 62% 38% 37% 32% 87% 28% 52% 30% 48% 84% 24% 91% 42% 51% 56% 47% 55% 61% 55% 52%
Strongly approve 395 208 187 89 89 117 101 335 26 20 3 250 34 109 37 116 242 27 319 16 125 271 80 221 94 196 190
28% 30% 26% 23% 26% 31% 34% 36% 12% 12% 13% 56% 7% 27% 10% 20% 56% 5% 60% 15% 26% 29% 20% 30% 35% 29% 27%
Somewhat approve 365 188 177 109 103 82 71 242 54 42 5 143 109 105 80 168 117 105 162 30 122 243 105 190 69 179 178
26% 27% 25% 28% 30% 22% 24% 26% 26% 25% 18% 32% 21% 26% 21% 28% 27% 19% 30% 28% 25% 26% 27% 26% 26% 26% 25%
Disapprove (Net) 647 291 356 185 154 182 125 361 129 107 18 57 377 194 269 309 69 415 50 62 235 412 210 330 107 304 337
46% 42% 49% 48% 45% 48% 42% 38% 62% 63% 68% 13% 72% 48% 70% 52% 16% 76% 9% 58% 49% 44% 53% 45% 39% 45% 48%
Somewhat disapprove 298 140 158 101 80 74 44 183 59 32 8 49 132 108 91 165 42 165 45 28 100 198 102 144 52 143 154
21% 20% 22% 26% 23% 19% 15% 20% 28% 19% 29% 11% 25% 26% 24% 28% 10% 30% 8% 26% 21% 21% 26% 19% 19% 21% 22%
Strongly disapprove 349 150 199 84 74 109 82 178 69 75 10 8 246 87 178 144 27 250 5 34 135 214 108 187 54 161 183
25% 22% 28% 22% 22% 28% 27% 19% 33% 45% 39% 2% 47% 21% 46% 24% 6% 46% 1% 31% 28% 23% 27% 25% 20% 24% 26%
Sigma 1407 687 720 383 345 382 297 938 208 169 26 450 521 408 385 593 429 547 532 108 481 926 395 742 270 679 704
100% 100% 100% 100% 100% 100% 100% 100% 100% 100% 100% 100% 100% 100% 100% 100% 100% 100% 100% 100% 100% 100% 100% 100% 100% 100% 100%

Page 21
Fielding Period: November 27 - 28, 2018
HCAPS (Filtered on Registered Voters)
Weighted To The U.S. General Adult Population
30 Nov 2018
Table 18
M3A_6 Do you approve or disapprove of the job President Trump is doing on ...?
Immigration
Base: All Respondents
Presidential
Election Candidate
Gender Age Ethnicity Political Party Political Ideology Voted For Education Locale Income
_____________ ______________________ _______________________ ____________________ ____________________ _____________________ _____________ ________________ _________
Colle- Some
Cons- ge Gr- Colle- $75K Less
Hisp- Black Repub- Democ- Indep- Libe- Mode- erva- 3rd ad And ge Or Urb- Subu- Or Than
Total Male Female 18-34 35-49 50-64 65+ White anic /AA Other lican rat endent ral rate tive Clinton Trump Party Higher Less an rban Rural More $75K
______ _____ _______ _____ _____ _____ ____ _____ _____ _____ _____ ______ ______ ______ ______ ______ ______ ________ ______ _____ ______ ______ ____ _____ _____ ____ ____
Unweighted Base 1407 675 732 416 359 364 268 1049 104 173 25 437 526 382 437 549 421 537 505 113 543 864 388 719 300 548 846
Weighted Base 1407 687 720 383 345 382 297 938 208 169 26 450 521 408 385 593 429 547 532 108 481 926 395 742 270 679 704
Approve (Net) 674 351 324 162 180 188 144 515 70 52 10 372 98 195 81 249 345 89 463 38 200 474 172 353 150 323 335
48% 51% 45% 42% 52% 49% 48% 55% 33% 31% 39% 83% 19% 48% 21% 42% 80% 16% 87% 35% 42% 51% 44% 48% 55% 48% 48%
Strongly approve 409 216 193 74 116 114 105 332 43 15 4 262 41 103 41 119 250 31 328 14 118 292 88 218 104 197 204
29% 31% 27% 19% 33% 30% 35% 35% 20% 9% 15% 58% 8% 25% 11% 20% 58% 6% 62% 13% 24% 32% 22% 29% 38% 29% 29%
Somewhat approve 265 135 130 88 65 74 39 182 27 37 6 110 58 92 40 130 95 58 135 24 83 183 84 135 46 127 131
19% 20% 18% 23% 19% 19% 13% 19% 13% 22% 24% 24% 11% 22% 10% 22% 22% 11% 25% 22% 17% 20% 21% 18% 17% 19% 19%
Disapprove (Net) 733 336 397 220 165 193 154 424 139 117 16 79 422 213 304 344 84 458 69 70 281 451 223 389 120 356 369
52% 49% 55% 58% 48% 51% 52% 45% 67% 69% 61% 17% 81% 52% 79% 58% 20% 84% 13% 65% 58% 49% 56% 52% 45% 52% 52%
Somewhat disapprove 185 74 111 60 45 48 31 123 28 20 3 44 72 61 45 102 38 68 45 21 60 124 51 100 34 76 106
13% 11% 15% 16% 13% 13% 11% 13% 13% 12% 12% 10% 14% 15% 12% 17% 9% 12% 8% 19% 13% 13% 13% 14% 13% 11% 15%
Strongly disapprove 548 262 286 160 121 145 122 301 111 97 13 35 350 152 260 242 46 390 24 49 221 327 173 289 86 280 264
39% 38% 40% 42% 35% 38% 41% 32% 53% 57% 49% 8% 67% 37% 67% 41% 11% 71% 5% 45% 46% 35% 44% 39% 32% 41% 37%
Sigma 1407 687 720 383 345 382 297 938 208 169 26 450 521 408 385 593 429 547 532 108 481 926 395 742 270 679 704
100% 100% 100% 100% 100% 100% 100% 100% 100% 100% 100% 100% 100% 100% 100% 100% 100% 100% 100% 100% 100% 100% 100% 100% 100% 100% 100%

Page 22
Fielding Period: November 27 - 28, 2018
HCAPS (Filtered on Registered Voters)
Weighted To The U.S. General Adult Population
30 Nov 2018
Table 19
M4 Do you approve or disapprove of the way the Republican Party is handling its job?
Base: All Respondents
Presidential
Election Candidate
Gender Age Ethnicity Political Party Political Ideology Voted For Education Locale Income
_____________ ______________________ _______________________ ____________________ ____________________ _____________________ _____________ ________________ _________
Colle- Some
Cons- ge Gr- Colle- $75K Less
Hisp- Black Repub- Democ- Indep- Libe- Mode- erva- 3rd ad And ge Or Urb- Subu- Or Than
Total Male Female 18-34 35-49 50-64 65+ White anic /AA Other lican rat endent ral rate tive Clinton Trump Party Higher Less an rban Rural More $75K
______ _____ _______ _____ _____ _____ ____ _____ _____ _____ _____ ______ ______ ______ ______ ______ ______ ________ ______ _____ ______ ______ ____ _____ _____ ____ ____
Unweighted Base 1407 675 732 416 359 364 268 1049 104 173 25 437 526 382 437 549 421 537 505 113 543 864 388 719 300 548 846
Weighted Base 1407 687 720 383 345 382 297 938 208 169 26 450 521 408 385 593 429 547 532 108 481 926 395 742 270 679 704
Approve (Net) 608 303 306 181 163 159 105 455 82 37 6 362 84 155 85 214 309 90 408 31 174 435 156 311 141 278 314
43% 44% 42% 47% 47% 42% 35% 49% 39% 22% 24% 80% 16% 38% 22% 36% 72% 16% 77% 28% 36% 47% 39% 42% 52% 41% 45%
Strongly approve 186 95 91 64 59 41 21 139 33 5 1 140 24 22 36 56 94 19 148 3 50 136 58 80 48 87 93
13% 14% 13% 17% 17% 11% 7% 15% 16% 3% 2% 31% 5% 5% 9% 9% 22% 3% 28% 3% 10% 15% 15% 11% 18% 13% 13%
Somewhat approve 423 208 215 117 104 119 84 317 49 32 6 222 60 133 49 158 215 71 260 27 124 299 98 232 93 191 221
30% 30% 30% 30% 30% 31% 28% 34% 24% 19% 22% 49% 12% 33% 13% 27% 50% 13% 49% 25% 26% 32% 25% 31% 34% 28% 31%
Disapprove (Net) 799 384 415 202 183 222 192 483 126 132 20 88 436 253 301 379 119 457 124 78 308 491 239 430 129 401 390
57% 56% 58% 53% 53% 58% 65% 51% 61% 78% 76% 20% 84% 62% 78% 64% 28% 84% 23% 72% 64% 53% 61% 58% 48% 59% 55%
Somewhat disapprove 353 144 208 106 88 83 75 223 63 43 5 78 142 121 73 192 87 136 91 39 117 236 95 203 55 159 189
25% 21% 29% 28% 26% 22% 25% 24% 30% 25% 18% 17% 27% 30% 19% 32% 20% 25% 17% 36% 24% 25% 24% 27% 20% 23% 27%
Strongly disapprove 446 240 206 96 94 139 117 260 63 89 15 10 294 132 227 186 33 322 32 39 191 255 144 228 74 242 202
32% 35% 29% 25% 27% 36% 39% 28% 30% 53% 58% 2% 56% 32% 59% 31% 8% 59% 6% 36% 40% 28% 37% 31% 27% 36% 29%
Sigma 1407 687 720 383 345 382 297 938 208 169 26 450 521 408 385 593 429 547 532 108 481 926 395 742 270 679 704
100% 100% 100% 100% 100% 100% 100% 100% 100% 100% 100% 100% 100% 100% 100% 100% 100% 100% 100% 100% 100% 100% 100% 100% 100% 100% 100%

Page 23
Fielding Period: November 27 - 28, 2018
HCAPS (Filtered on Registered Voters)
Weighted To The U.S. General Adult Population
30 Nov 2018
Table 20
M5 Do you approve or disapprove of the way the Democratic Party is handling its job?
Base: All Respondents
Presidential
Election Candidate
Gender Age Ethnicity Political Party Political Ideology Voted For Education Locale Income
_____________ ______________________ _______________________ ____________________ ____________________ _____________________ _____________ ________________ _________
Colle- Some
Cons- ge Gr- Colle- $75K Less
Hisp- Black Repub- Democ- Indep- Libe- Mode- erva- 3rd ad And ge Or Urb- Subu- Or Than
Total Male Female 18-34 35-49 50-64 65+ White anic /AA Other lican rat endent ral rate tive Clinton Trump Party Higher Less an rban Rural More $75K
______ _____ _______ _____ _____ _____ ____ _____ _____ _____ _____ ______ ______ ______ ______ ______ ______ ________ ______ _____ ______ ______ ____ _____ _____ ____ ____
Unweighted Base 1407 675 732 416 359 364 268 1049 104 173 25 437 526 382 437 549 421 537 505 113 543 864 388 719 300 548 846
Weighted Base 1407 687 720 383 345 382 297 938 208 169 26 450 521 408 385 593 429 547 532 108 481 926 395 742 270 679 704
Approve (Net) 643 294 349 211 167 144 122 372 120 114 8 105 379 155 281 282 80 395 122 25 220 423 224 313 107 304 330
46% 43% 48% 55% 48% 38% 41% 40% 58% 68% 33% 23% 73% 38% 73% 48% 19% 72% 23% 23% 46% 46% 57% 42% 39% 45% 47%
Strongly approve 169 71 98 54 41 45 28 96 31 34 4 32 117 20 92 56 20 100 45 4 50 119 66 73 30 76 92
12% 10% 14% 14% 12% 12% 9% 10% 15% 20% 15% 7% 22% 5% 24% 10% 5% 18% 8% 4% 10% 13% 17% 10% 11% 11% 13%
Somewhat approve 474 223 251 156 126 99 94 275 89 81 5 73 262 135 188 226 60 294 77 21 170 304 158 239 77 227 238
34% 33% 35% 41% 36% 26% 31% 29% 43% 48% 18% 16% 50% 33% 49% 38% 14% 54% 14% 20% 35% 33% 40% 32% 28% 33% 34%
Disapprove (Net) 764 393 372 172 179 238 176 567 88 55 17 345 142 253 105 311 349 153 410 83 262 503 171 429 164 376 374
54% 57% 52% 45% 52% 62% 59% 60% 42% 32% 67% 77% 27% 62% 27% 52% 81% 28% 77% 77% 54% 54% 43% 58% 61% 55% 53%
Somewhat disapprove 380 176 204 112 93 105 70 244 62 38 5 131 110 125 85 189 106 123 134 46 126 254 106 204 70 172 208
27% 26% 28% 29% 27% 27% 23% 26% 30% 23% 20% 29% 21% 31% 22% 32% 25% 22% 25% 42% 26% 27% 27% 28% 26% 25% 30%
Strongly disapprove 384 217 167 60 86 133 106 323 26 17 12 214 32 127 20 122 242 30 276 37 135 249 65 225 94 204 166
27% 32% 23% 16% 25% 35% 36% 34% 13% 10% 47% 47% 6% 31% 5% 21% 57% 5% 52% 34% 28% 27% 16% 30% 35% 30% 24%
Sigma 1407 687 720 383 345 382 297 938 208 169 26 450 521 408 385 593 429 547 532 108 481 926 395 742 270 679 704
100% 100% 100% 100% 100% 100% 100% 100% 100% 100% 100% 100% 100% 100% 100% 100% 100% 100% 100% 100% 100% 100% 100% 100% 100% 100% 100%

Page 24
Fielding Period: November 27 - 28, 2018
HCAPS (Filtered on Registered Voters)
Weighted To The U.S. General Adult Population
30 Nov 2018
Table 21
ECON1001 Who do you think is most responsible for the current state of the economy today?
Base: All Respondents
Presidential
Election Candidate
Gender Age Ethnicity Political Party Political Ideology Voted For Education Locale Income
_____________ ______________________ _______________________ ____________________ ____________________ _____________________ _____________ ________________ _________
Colle- Some
Cons- ge Gr- Colle- $75K Less
Hisp- Black Repub- Democ- Indep- Libe- Mode- erva- 3rd ad And ge Or Urb- Subu- Or Than
Total Male Female 18-34 35-49 50-64 65+ White anic /AA Other lican rat endent ral rate tive Clinton Trump Party Higher Less an rban Rural More $75K
______ _____ _______ _____ _____ _____ ____ _____ _____ _____ _____ ______ ______ ______ ______ ______ ______ ________ ______ _____ ______ ______ ____ _____ _____ ____ ____
Unweighted Base 1407 675 732 416 359 364 268 1049 104 173 25 437 526 382 437 549 421 537 505 113 543 864 388 719 300 548 846
Weighted Base 1407 687 720 383 345 382 297 938 208 169 26 450 521 408 385 593 429 547 532 108 481 926 395 742 270 679 704
President Donald Trump 681 334 348 161 144 213 164 496 100 49 12 263 223 186 141 260 281 203 334 42 219 462 171 367 143 315 358
48% 49% 48% 42% 42% 56% 55% 53% 48% 29% 45% 58% 43% 46% 37% 44% 66% 37% 63% 39% 46% 50% 43% 50% 53% 46% 51%
Former President Barack 309 151 158 78 90 79 63 184 41 58 4 63 141 100 120 139 51 174 70 24 121 189 97 162 50 157 145
Obama 22% 22% 22% 20% 26% 21% 21% 20% 19% 34% 16% 14% 27% 25% 31% 23% 12% 32% 13% 22% 25% 20% 25% 22% 19% 23% 21%
Republicans in Congress 220 105 115 83 63 41 33 130 37 44 2 62 98 58 84 96 40 117 53 17 66 154 71 114 35 109 109
16% 15% 16% 22% 18% 11% 11% 14% 18% 26% 7% 14% 19% 14% 22% 16% 9% 21% 10% 15% 14% 17% 18% 15% 13% 16% 16%
Democrats in Congress 106 44 62 45 26 18 18 60 18 13 6 39 35 31 22 51 33 30 41 8 34 72 34 52 20 50 55
8% 6% 9% 12% 8% 5% 6% 6% 9% 8% 23% 9% 7% 8% 6% 9% 8% 5% 8% 8% 7% 8% 9% 7% 7% 7% 8%
Other 89 52 38 16 22 32 20 69 12 5 2 25 25 33 18 48 23 24 33 17 40 49 22 45 22 49 37
6% 8% 5% 4% 6% 8% 7% 7% 6% 3% 8% 6% 5% 8% 5% 8% 5% 4% 6% 16% 8% 5% 6% 6% 8% 7% 5%
Sigma 1407 687 720 383 345 382 297 938 208 169 26 450 521 408 385 593 429 547 532 108 481 926 395 742 270 679 704
100% 100% 100% 100% 100% 100% 100% 100% 100% 100% 100% 100% 100% 100% 100% 100% 100% 100% 100% 100% 100% 100% 100% 100% 100% 100% 100%

Page 25
Fielding Period: November 27 - 28, 2018
HCAPS (Filtered on Registered Voters)
Weighted To The U.S. General Adult Population
30 Nov 2018
Table 22
DT01 When you think of Donald Trump do you like or dislike him personally?
Base: All Respondents
Presidential
Election Candidate
Gender Age Ethnicity Political Party Political Ideology Voted For Education Locale Income
_____________ ______________________ _______________________ ____________________ ____________________ _____________________ _____________ ________________ _________
Colle- Some
Cons- ge Gr- Colle- $75K Less
Hisp- Black Repub- Democ- Indep- Libe- Mode- erva- 3rd ad And ge Or Urb- Subu- Or Than
Total Male Female 18-34 35-49 50-64 65+ White anic /AA Other lican rat endent ral rate tive Clinton Trump Party Higher Less an rban Rural More $75K
______ _____ _______ _____ _____ _____ ____ _____ _____ _____ _____ ______ ______ ______ ______ ______ ______ ________ ______ _____ ______ ______ ____ _____ _____ ____ ____
Unweighted Base 1407 675 732 416 359 364 268 1049 104 173 25 437 526 382 437 549 421 537 505 113 543 864 388 719 300 548 846
Weighted Base 1407 687 720 383 345 382 297 938 208 169 26 450 521 408 385 593 429 547 532 108 481 926 395 742 270 679 704
Like him personally 431 230 200 119 115 117 80 352 38 25 4 287 45 97 68 127 236 29 350 8 138 293 111 220 100 208 210
31% 34% 28% 31% 33% 31% 27% 37% 18% 15% 15% 64% 9% 24% 18% 21% 55% 5% 66% 7% 29% 32% 28% 30% 37% 31% 30%
Dislike him personally 808 382 426 221 182 217 188 477 144 127 19 116 443 233 306 369 133 485 108 85 307 502 246 438 124 412 391
57% 56% 59% 58% 53% 57% 63% 51% 69% 75% 74% 26% 85% 57% 79% 62% 31% 89% 20% 78% 64% 54% 62% 59% 46% 61% 56%
Unsure / Don't Know 168 75 93 42 48 48 29 110 27 17 3 47 33 78 12 97 60 34 74 16 37 131 38 84 46 60 103
12% 11% 13% 11% 14% 13% 10% 12% 13% 10% 11% 10% 6% 19% 3% 16% 14% 6% 14% 15% 8% 14% 10% 11% 17% 9% 15%
Sigma 1407 687 720 383 345 382 297 938 208 169 26 450 521 408 385 593 429 547 532 108 481 926 395 742 270 679 704
100% 100% 100% 100% 100% 100% 100% 100% 100% 100% 100% 100% 100% 100% 100% 100% 100% 100% 100% 100% 100% 100% 100% 100% 100% 100% 100%

Page 26
Fielding Period: November 27 - 28, 2018
HCAPS (Filtered on Registered Voters)
Weighted To The U.S. General Adult Population
30 Nov 2018
Table 23
MID1101 Did you vote in the Congressional midterm elections on November 6th, or did you not have the chance to?
Base: All Respondents
Presidential
Election Candidate
Gender Age Ethnicity Political Party Political Ideology Voted For Education Locale Income
_____________ ______________________ _______________________ ____________________ ____________________ _____________________ _____________ ________________ _________
Colle- Some
Cons- ge Gr- Colle- $75K Less
Hisp- Black Repub- Democ- Indep- Libe- Mode- erva- 3rd ad And ge Or Urb- Subu- Or Than
Total Male Female 18-34 35-49 50-64 65+ White anic /AA Other lican rat endent ral rate tive Clinton Trump Party Higher Less an rban Rural More $75K
______ _____ _______ _____ _____ _____ ____ _____ _____ _____ _____ ______ ______ ______ ______ ______ ______ ________ ______ _____ ______ ______ ____ _____ _____ ____ ____
Unweighted Base 1407 675 732 416 359 364 268 1049 104 173 25 437 526 382 437 549 421 537 505 113 543 864 388 719 300 548 846
Weighted Base 1407 687 720 383 345 382 297 938 208 169 26 450 521 408 385 593 429 547 532 108 481 926 395 742 270 679 704
I voted 1205 615 590 303 295 339 268 808 168 150 21 402 462 324 357 473 374 525 503 100 451 754 344 637 223 627 555
86% 90% 82% 79% 85% 89% 90% 86% 81% 89% 80% 89% 89% 80% 93% 80% 87% 96% 95% 92% 94% 81% 87% 86% 83% 92% 79%
I did not have the chance to 202 72 130 80 51 42 29 130 40 19 5 48 58 84 29 120 54 22 29 9 30 172 51 105 47 52 149
vote 14% 10% 18% 21% 15% 11% 10% 14% 19% 11% 20% 11% 11% 20% 7% 20% 13% 4% 5% 8% 6% 19% 13% 14% 17% 8% 21%
Sigma 1407 687 720 383 345 382 297 938 208 169 26 450 521 408 385 593 429 547 532 108 481 926 395 742 270 679 704
100% 100% 100% 100% 100% 100% 100% 100% 100% 100% 100% 100% 100% 100% 100% 100% 100% 100% 100% 100% 100% 100% 100% 100% 100% 100% 100%

Page 27
Fielding Period: November 27 - 28, 2018
HCAPS (Filtered on Registered Voters)
Weighted To The U.S. General Adult Population
30 Nov 2018
Table 24
MID1102 Did you vote for the Democratic or Republican candidate in your district?
Base: Voted
Presidential
Election Candidate
Gender Age Ethnicity Political Party Political Ideology Voted For Education Locale Income
_____________ ______________________ _______________________ ____________________ ____________________ _____________________ _____________ ________________ _________
Colle- Some
Cons- ge Gr- Colle- $75K Less
Hisp- Black Repub- Democ- Indep- Libe- Mode- erva- 3rd ad And ge Or Urb- Subu- Or Than
Total Male Female 18-34 35-49 50-64 65+ White anic /AA Other lican rat endent ral rate tive Clinton Trump Party Higher Less an rban Rural More $75K
______ _____ _______ _____ _____ _____ ____ _____ _____ _____ _____ ______ ______ ______ ______ ______ ______ ________ ______ _____ ______ ______ ____ _____ _____ ____ ____
Unweighted Base 1164 583 581 322 287 313 242 867 80 150 19 385 464 285 394 412 358 513 471 102 493 671 320 606 238 501 651
Weighted Base 1205 615 590 303 295 339 268 808 168 150 21 402 462 324 357 473 374 525 503 100 451 754 344 637 223 627 555
Democratic candidate 658 322 337 173 164 174 148 356 131 124 14 43 443 166 308 297 53 493 71 52 261 397 222 347 90 340 314
55% 52% 57% 57% 56% 51% 55% 44% 78% 83% 66% 11% 96% 51% 86% 63% 14% 94% 14% 52% 58% 53% 64% 55% 40% 54% 56%
Republican candidate 493 274 219 113 123 155 103 416 29 21 5 352 16 122 41 143 309 22 415 31 177 316 105 262 126 267 212
41% 45% 37% 37% 42% 46% 38% 51% 17% 14% 24% 88% 3% 38% 11% 30% 82% 4% 82% 31% 39% 42% 31% 41% 56% 43% 38%
Other 44 18 26 13 7 7 17 28 8 5 2 6 3 30 8 24 12 8 16 15 11 33 16 22 6 17 25
4% 3% 4% 4% 2% 2% 6% 3% 5% 4% 10% 1% 1% 9% 2% 5% 3% 2% 3% 15% 2% 4% 5% 3% 2% 3% 5%
Unsure 9 1 8 3 1 4 1 8 1 - - 1 1 7 - 9 * 1 1 2 2 8 2 6 2 3 4
1% * 1% 1% * 1% * 1% * - - * * 2% - 2% * * * 2% * 1% * 1% 1% * 1%
Sigma 1205 615 590 303 295 339 268 808 168 150 21 402 462 324 357 473 374 525 503 100 451 754 344 637 223 627 555
100% 100% 100% 100% 100% 100% 100% 100% 100% 100% 100% 100% 100% 100% 100% 100% 100% 100% 100% 100% 100% 100% 100% 100% 100% 100% 100%

Page 28
Fielding Period: November 27 - 28, 2018
HCAPS (Filtered on Registered Voters)
Weighted To The U.S. General Adult Population
30 Nov 2018
Table 25
MID1103 On election day, Democrats gained at least 38 seats in the House of Representatives and 7 governorships, while
Republicans retained control of the Senate and gained 2 seats there, leading to a split Congress.
Are you satisfied or not satisfied with the outcome of the election?
Base: All Respondents
Presidential
Election Candidate
Gender Age Ethnicity Political Party Political Ideology Voted For Education Locale Income
_____________ ______________________ _______________________ ____________________ ____________________ _____________________ _____________ ________________ _________
Colle- Some
Cons- ge Gr- Colle- $75K Less
Hisp- Black Repub- Democ- Indep- Libe- Mode- erva- 3rd ad And ge Or Urb- Subu- Or Than
Total Male Female 18-34 35-49 50-64 65+ White anic /AA Other lican rat endent ral rate tive Clinton Trump Party Higher Less an rban Rural More $75K
______ _____ _______ _____ _____ _____ ____ _____ _____ _____ _____ ______ ______ ______ ______ ______ ______ ________ ______ _____ ______ ______ ____ _____ _____ ____ ____
Unweighted Base 1407 675 732 416 359 364 268 1049 104 173 25 437 526 382 437 549 421 537 505 113 543 864 388 719 300 548 846
Weighted Base 1407 687 720 383 345 382 297 938 208 169 26 450 521 408 385 593 429 547 532 108 481 926 395 742 270 679 704
Very/Somewhat Satisfied 943 433 510 280 237 221 205 614 139 130 12 262 409 260 305 407 231 427 318 63 346 597 276 505 162 464 470
(Net) 67% 63% 71% 73% 69% 58% 69% 65% 67% 77% 46% 58% 79% 64% 79% 69% 54% 78% 60% 58% 72% 65% 70% 68% 60% 68% 67%
Very Satisfied 225 113 112 93 52 47 33 143 34 43 2 76 108 38 87 89 50 100 92 12 83 142 89 97 39 113 112
16% 16% 16% 24% 15% 12% 11% 15% 16% 26% 6% 17% 21% 9% 23% 15% 12% 18% 17% 11% 17% 15% 23% 13% 14% 17% 16%
Somewhat satisfied 718 320 398 187 185 174 171 471 105 87 10 185 301 222 218 319 181 327 226 51 262 455 186 408 124 351 358
51% 47% 55% 49% 53% 46% 58% 50% 50% 51% 40% 41% 58% 54% 57% 54% 42% 60% 43% 47% 54% 49% 47% 55% 46% 52% 51%
Very/Somewhat dissatisfied 464 254 210 102 108 161 93 325 69 39 14 189 111 148 80 186 198 120 213 45 136 328 120 237 108 216 234
(Net) 33% 37% 29% 27% 31% 42% 31% 35% 33% 23% 54% 42% 21% 36% 21% 31% 46% 22% 40% 42% 28% 35% 30% 32% 40% 32% 33%
Somewhat dissatisfied 333 181 152 84 75 107 67 225 58 29 9 128 80 118 58 146 130 93 143 35 97 237 92 168 73 156 168
24% 26% 21% 22% 22% 28% 22% 24% 28% 17% 35% 28% 15% 29% 15% 25% 30% 17% 27% 33% 20% 26% 23% 23% 27% 23% 24%
Very dissatisfied 131 73 58 18 33 54 26 100 11 9 5 61 31 30 23 40 68 27 71 10 39 92 27 69 34 60 66
9% 11% 8% 5% 10% 14% 9% 11% 5% 6% 19% 14% 6% 7% 6% 7% 16% 5% 13% 9% 8% 10% 7% 9% 13% 9% 9%
Sigma 1407 687 720 383 345 382 297 938 208 169 26 450 521 408 385 593 429 547 532 108 481 926 395 742 270 679 704
100% 100% 100% 100% 100% 100% 100% 100% 100% 100% 100% 100% 100% 100% 100% 100% 100% 100% 100% 100% 100% 100% 100% 100% 100% 100% 100%

Page 29
Fielding Period: November 27 - 28, 2018
HCAPS (Filtered on Registered Voters)
Weighted To The U.S. General Adult Population
30 Nov 2018
Table 26
MID1104 Which comes closest to your view about November's midterm elections?
Base: All Respondents
Presidential
Election Candidate
Gender Age Ethnicity Political Party Political Ideology Voted For Education Locale Income
_____________ ______________________ _______________________ ____________________ ____________________ _____________________ _____________ ________________ _________
Colle- Some
Cons- ge Gr- Colle- $75K Less
Hisp- Black Repub- Democ- Indep- Libe- Mode- erva- 3rd ad And ge Or Urb- Subu- Or Than
Total Male Female 18-34 35-49 50-64 65+ White anic /AA Other lican rat endent ral rate tive Clinton Trump Party Higher Less an rban Rural More $75K
______ _____ _______ _____ _____ _____ ____ _____ _____ _____ _____ ______ ______ ______ ______ ______ ______ ________ ______ _____ ______ ______ ____ _____ _____ ____ ____
Unweighted Base 1407 675 732 416 359 364 268 1049 104 173 25 437 526 382 437 549 421 537 505 113 543 864 388 719 300 548 846
Weighted Base 1407 687 720 383 345 382 297 938 208 169 26 450 521 408 385 593 429 547 532 108 481 926 395 742 270 679 704
The election was a clear win 603 314 289 167 142 168 126 357 99 99 10 96 348 151 252 266 86 372 132 36 245 358 192 319 93 303 292
for the Democratic Party 43% 46% 40% 44% 41% 44% 42% 38% 47% 59% 40% 21% 67% 37% 65% 45% 20% 68% 25% 34% 51% 39% 49% 43% 34% 45% 41%
The election was a clear win 239 107 131 100 70 40 29 166 40 23 4 147 34 55 41 99 99 32 145 15 63 176 83 107 49 103 133
for the Republican Party 17% 16% 18% 26% 20% 11% 10% 18% 19% 13% 14% 33% 7% 13% 11% 17% 23% 6% 27% 14% 13% 19% 21% 14% 18% 15% 19%
The election was a draw 565 265 300 116 134 173 142 415 70 47 12 207 138 203 92 229 244 144 255 57 173 392 120 316 128 273 280
40% 39% 42% 30% 39% 45% 48% 44% 34% 28% 47% 46% 27% 50% 24% 39% 57% 26% 48% 52% 36% 42% 30% 43% 47% 40% 40%
Sigma 1407 687 720 383 345 382 297 938 208 169 26 450 521 408 385 593 429 547 532 108 481 926 395 742 270 679 704
100% 100% 100% 100% 100% 100% 100% 100% 100% 100% 100% 100% 100% 100% 100% 100% 100% 100% 100% 100% 100% 100% 100% 100% 100% 100% 100%

Page 30
Fielding Period: November 27 - 28, 2018
HCAPS (Filtered on Registered Voters)
Weighted To The U.S. General Adult Population
30 Nov 2018
Table 27
MID1105 Do you think that Donald Trump performed better, worse, or about the same as past Presidents in the midterm elections?
Base: All Respondents
Presidential
Election Candidate
Gender Age Ethnicity Political Party Political Ideology Voted For Education Locale Income
_____________ ______________________ _______________________ ____________________ ____________________ _____________________ _____________ ________________ _________
Colle- Some
Cons- ge Gr- Colle- $75K Less
Hisp- Black Repub- Democ- Indep- Libe- Mode- erva- 3rd ad And ge Or Urb- Subu- Or Than
Total Male Female 18-34 35-49 50-64 65+ White anic /AA Other lican rat endent ral rate tive Clinton Trump Party Higher Less an rban Rural More $75K
______ _____ _______ _____ _____ _____ ____ _____ _____ _____ _____ ______ ______ ______ ______ ______ ______ ________ ______ _____ ______ ______ ____ _____ _____ ____ ____
Unweighted Base 1407 675 732 416 359 364 268 1049 104 173 25 437 526 382 437 549 421 537 505 113 543 864 388 719 300 548 846
Weighted Base 1407 687 720 383 345 382 297 938 208 169 26 450 521 408 385 593 429 547 532 108 481 926 395 742 270 679 704
Better 413 216 197 112 122 105 74 328 49 25 3 267 39 105 55 123 236 36 321 18 118 295 118 198 97 217 187
29% 31% 27% 29% 35% 27% 25% 35% 24% 15% 12% 59% 8% 26% 14% 21% 55% 7% 60% 16% 25% 32% 30% 27% 36% 32% 27%
Worse 610 271 338 169 118 179 144 350 111 108 12 62 368 165 262 274 74 405 48 51 212 398 182 327 101 292 314
43% 40% 47% 44% 34% 47% 48% 37% 53% 64% 48% 14% 71% 40% 68% 46% 17% 74% 9% 47% 44% 43% 46% 44% 37% 43% 45%
About the same 384 199 185 102 105 98 79 261 48 36 10 121 113 139 68 197 119 106 162 39 151 233 96 216 72 170 204
27% 29% 26% 27% 31% 26% 27% 28% 23% 21% 40% 27% 22% 34% 18% 33% 28% 19% 31% 36% 31% 25% 24% 29% 27% 25% 29%
Sigma 1407 687 720 383 345 382 297 938 208 169 26 450 521 408 385 593 429 547 532 108 481 926 395 742 270 679 704
100% 100% 100% 100% 100% 100% 100% 100% 100% 100% 100% 100% 100% 100% 100% 100% 100% 100% 100% 100% 100% 100% 100% 100% 100% 100% 100%

Page 31
Fielding Period: November 27 - 28, 2018
HCAPS (Filtered on Registered Voters)
Weighted To The U.S. General Adult Population
30 Nov 2018
Table 28
MID1106 Should Democrats in the House of Representatives re-elect Nancy Pelosi as the next Speaker of the House or is it time for a new leader?
Base: All Respondents
Presidential
Election Candidate
Gender Age Ethnicity Political Party Political Ideology Voted For Education Locale Income
_____________ ______________________ _______________________ ____________________ ____________________ _____________________ _____________ ________________ _________
Colle- Some
Cons- ge Gr- Colle- $75K Less
Hisp- Black Repub- Democ- Indep- Libe- Mode- erva- 3rd ad And ge Or Urb- Subu- Or Than
Total Male Female 18-34 35-49 50-64 65+ White anic /AA Other lican rat endent ral rate tive Clinton Trump Party Higher Less an rban Rural More $75K
______ _____ _______ _____ _____ _____ ____ _____ _____ _____ _____ ______ ______ ______ ______ ______ ______ ________ ______ _____ ______ ______ ____ _____ _____ ____ ____
Unweighted Base 1407 675 732 416 359 364 268 1049 104 173 25 437 526 382 437 549 421 537 505 113 543 864 388 719 300 548 846
Weighted Base 1407 687 720 383 345 382 297 938 208 169 26 450 521 408 385 593 429 547 532 108 481 926 395 742 270 679 704
Re-elect Nancy Pelosi 459 226 233 130 107 122 101 285 68 77 8 103 249 102 214 161 84 261 113 23 175 285 139 253 67 249 207
33% 33% 32% 34% 31% 32% 34% 30% 33% 46% 33% 23% 48% 25% 56% 27% 20% 48% 21% 21% 36% 31% 35% 34% 25% 37% 29%
Time for a new leader 948 460 488 253 239 260 196 654 140 92 17 348 271 306 171 432 345 286 418 86 307 641 256 488 204 431 497
67% 67% 68% 66% 69% 68% 66% 70% 67% 54% 67% 77% 52% 75% 44% 73% 80% 52% 79% 79% 64% 69% 65% 66% 75% 63% 71%
Sigma 1407 687 720 383 345 382 297 938 208 169 26 450 521 408 385 593 429 547 532 108 481 926 395 742 270 679 704
100% 100% 100% 100% 100% 100% 100% 100% 100% 100% 100% 100% 100% 100% 100% 100% 100% 100% 100% 100% 100% 100% 100% 100% 100% 100% 100%

Page 32
Fielding Period: November 27 - 28, 2018
HCAPS (Filtered on Registered Voters)
Weighted To The U.S. General Adult Population
30 Nov 2018
Table 29
CONGRESS1101 Do you believe that Congress today functions well and gets things done for the American people, or is Congress dysfunctional and very little gets done for the American people?
Base: All Respondents
Presidential
Election Candidate
Gender Age Ethnicity Political Party Political Ideology Voted For Education Locale Income
_____________ ______________________ _______________________ ____________________ ____________________ _____________________ _____________ ________________ _________
Colle- Some
Cons- ge Gr- Colle- $75K Less
Hisp- Black Repub- Democ- Indep- Libe- Mode- erva- 3rd ad And ge Or Urb- Subu- Or Than
Total Male Female 18-34 35-49 50-64 65+ White anic /AA Other lican rat endent ral rate tive Clinton Trump Party Higher Less an rban Rural More $75K
______ _____ _______ _____ _____ _____ ____ _____ _____ _____ _____ ______ ______ ______ ______ ______ ______ ________ ______ _____ ______ ______ ____ _____ _____ ____ ____
Unweighted Base 1407 675 732 416 359 364 268 1049 104 173 25 437 526 382 437 549 421 537 505 113 543 864 388 719 300 548 846
Weighted Base 1407 687 720 383 345 382 297 938 208 169 26 450 521 408 385 593 429 547 532 108 481 926 395 742 270 679 704
Congress functions well and 333 153 180 165 89 55 24 215 60 43 2 149 101 77 89 154 90 95 170 15 88 244 122 147 64 134 194
gets things done for the 24% 22% 25% 43% 26% 14% 8% 23% 29% 25% 6% 33% 19% 19% 23% 26% 21% 17% 32% 14% 18% 26% 31% 20% 24% 20% 28%
American people
Congress is dysfunctional 1074 534 540 218 257 327 273 723 148 126 24 301 419 331 297 439 339 452 362 93 393 681 273 595 207 546 510
and very little gets done 76% 78% 75% 57% 74% 86% 92% 77% 71% 75% 94% 67% 81% 81% 77% 74% 79% 83% 68% 86% 82% 74% 69% 80% 76% 80% 72%
for the American people
Sigma 1407 687 720 383 345 382 297 938 208 169 26 450 521 408 385 593 429 547 532 108 481 926 395 742 270 679 704
100% 100% 100% 100% 100% 100% 100% 100% 100% 100% 100% 100% 100% 100% 100% 100% 100% 100% 100% 100% 100% 100% 100% 100% 100% 100% 100%

Page 33
Fielding Period: November 27 - 28, 2018
HCAPS (Filtered on Registered Voters)
Weighted To The U.S. General Adult Population
30 Nov 2018
Table 30
CONGRESS1102 Do you think that the problems in Congress are mostly the fault of both parties' leaders or the rank-and-file members?
Base: All Respondents
Presidential
Election Candidate
Gender Age Ethnicity Political Party Political Ideology Voted For Education Locale Income
_____________ ______________________ _______________________ ____________________ ____________________ _____________________ _____________ ________________ _________
Colle- Some
Cons- ge Gr- Colle- $75K Less
Hisp- Black Repub- Democ- Indep- Libe- Mode- erva- 3rd ad And ge Or Urb- Subu- Or Than
Total Male Female 18-34 35-49 50-64 65+ White anic /AA Other lican rat endent ral rate tive Clinton Trump Party Higher Less an rban Rural More $75K
______ _____ _______ _____ _____ _____ ____ _____ _____ _____ _____ ______ ______ ______ ______ ______ ______ ________ ______ _____ ______ ______ ____ _____ _____ ____ ____
Unweighted Base 1407 675 732 416 359 364 268 1049 104 173 25 437 526 382 437 549 421 537 505 113 543 864 388 719 300 548 846
Weighted Base 1407 687 720 383 345 382 297 938 208 169 26 450 521 408 385 593 429 547 532 108 481 926 395 742 270 679 704
Party leaders 676 355 321 182 156 178 159 479 85 72 11 212 252 202 196 264 215 264 250 61 268 408 186 363 127 368 299
48% 52% 45% 48% 45% 47% 54% 51% 41% 43% 43% 47% 48% 50% 51% 45% 50% 48% 47% 56% 56% 44% 47% 49% 47% 54% 42%
Rank and file members 603 286 317 152 150 172 130 387 102 72 13 196 233 163 170 249 185 245 239 39 189 414 166 315 122 274 321
43% 42% 44% 40% 43% 45% 44% 41% 49% 43% 51% 43% 45% 40% 44% 42% 43% 45% 45% 36% 39% 45% 42% 43% 45% 40% 46%
No significant problems with 128 46 82 49 39 31 8 73 21 24 1 42 36 43 20 80 28 38 43 9 24 104 43 64 21 37 85
Congress 9% 7% 11% 13% 11% 8% 3% 8% 10% 14% 5% 9% 7% 10% 5% 14% 7% 7% 8% 8% 5% 11% 11% 9% 8% 6% 12%
Sigma 1407 687 720 383 345 382 297 938 208 169 26 450 521 408 385 593 429 547 532 108 481 926 395 742 270 679 704
100% 100% 100% 100% 100% 100% 100% 100% 100% 100% 100% 100% 100% 100% 100% 100% 100% 100% 100% 100% 100% 100% 100% 100% 100% 100% 100%

Page 34
Fielding Period: November 27 - 28, 2018
HCAPS (Filtered on Registered Voters)
Weighted To The U.S. General Adult Population
30 Nov 2018
Table 31
CONGRESS1103 Do you think that Democrats and Republicans in the next Congress should stick to their principles even if it means gridlock and lack of compromise, or work across party lines
to get things done even if it means that they need to compromise?
Base: All Respondents
Presidential
Election Candidate
Gender Age Ethnicity Political Party Political Ideology Voted For Education Locale Income
_____________ ______________________ _______________________ ____________________ ____________________ _____________________ _____________ ________________ _________
Colle- Some
Cons- ge Gr- Colle- $75K Less
Hisp- Black Repub- Democ- Indep- Libe- Mode- erva- 3rd ad And ge Or Urb- Subu- Or Than
Total Male Female 18-34 35-49 50-64 65+ White anic /AA Other lican rat endent ral rate tive Clinton Trump Party Higher Less an rban Rural More $75K
______ _____ _______ _____ _____ _____ ____ _____ _____ _____ _____ ______ ______ ______ ______ ______ ______ ________ ______ _____ ______ ______ ____ _____ _____ ____ ____
Unweighted Base 1407 675 732 416 359 364 268 1049 104 173 25 437 526 382 437 549 421 537 505 113 543 864 388 719 300 548 846
Weighted Base 1407 687 720 383 345 382 297 938 208 169 26 450 521 408 385 593 429 547 532 108 481 926 395 742 270 679 704
Stick to their principles 387 198 189 157 124 79 27 231 78 52 9 133 136 108 117 155 115 140 154 34 115 272 152 165 70 168 213
even if it means gridlock 28% 29% 26% 41% 36% 21% 9% 25% 38% 31% 35% 30% 26% 27% 30% 26% 27% 26% 29% 32% 24% 29% 38% 22% 26% 25% 30%
and lack of compromise
Work across party lines to 1020 489 531 226 221 303 270 707 130 117 17 317 384 300 268 438 314 407 378 74 366 654 243 577 200 512 491
get things done even if it 72% 71% 74% 59% 64% 79% 91% 75% 62% 69% 65% 70% 74% 73% 70% 74% 73% 74% 71% 68% 76% 71% 62% 78% 74% 75% 70%
means that they need to
compromise
Sigma 1407 687 720 383 345 382 297 938 208 169 26 450 521 408 385 593 429 547 532 108 481 926 395 742 270 679 704
100% 100% 100% 100% 100% 100% 100% 100% 100% 100% 100% 100% 100% 100% 100% 100% 100% 100% 100% 100% 100% 100% 100% 100% 100% 100% 100%

Page 35
Fielding Period: November 27 - 28, 2018
HCAPS (Filtered on Registered Voters)
Weighted To The U.S. General Adult Population
30 Nov 2018
Table 32
CONGRESS1105 Would you like to see the rules of Congress changed to allow bills with two-thirds bipartisan support to reach the floor of each chamber for a vote even when the majority of the
party in power rejects calling for a vote?
Base: All Respondents
Presidential
Election Candidate
Gender Age Ethnicity Political Party Political Ideology Voted For Education Locale Income
_____________ ______________________ _______________________ ____________________ ____________________ _____________________ _____________ ________________ _________
Colle- Some
Cons- ge Gr- Colle- $75K Less
Hisp- Black Repub- Democ- Indep- Libe- Mode- erva- 3rd ad And ge Or Urb- Subu- Or Than
Total Male Female 18-34 35-49 50-64 65+ White anic /AA Other lican rat endent ral rate tive Clinton Trump Party Higher Less an rban Rural More $75K
______ _____ _______ _____ _____ _____ ____ _____ _____ _____ _____ ______ ______ ______ ______ ______ ______ ________ ______ _____ ______ ______ ____ _____ _____ ____ ____
Unweighted Base 1407 675 732 416 359 364 268 1049 104 173 25 437 526 382 437 549 421 537 505 113 543 864 388 719 300 548 846
Weighted Base 1407 687 720 383 345 382 297 938 208 169 26 450 521 408 385 593 429 547 532 108 481 926 395 742 270 679 704
Yes 694 378 316 191 142 178 183 465 110 84 13 207 289 189 228 264 202 296 241 73 286 408 193 377 124 362 325
49% 55% 44% 50% 41% 47% 61% 50% 53% 50% 51% 46% 55% 46% 59% 44% 47% 54% 45% 67% 59% 44% 49% 51% 46% 53% 46%
No 258 138 120 99 68 59 32 167 43 28 3 103 78 71 54 120 84 87 126 10 81 178 82 135 41 135 122
18% 20% 17% 26% 20% 16% 11% 18% 20% 16% 12% 23% 15% 17% 14% 20% 20% 16% 24% 9% 17% 19% 21% 18% 15% 20% 17%
Not sure 455 171 284 92 136 144 83 306 56 57 10 140 154 147 104 209 142 165 164 25 115 340 120 230 105 182 258
32% 25% 39% 24% 39% 38% 28% 33% 27% 34% 37% 31% 30% 36% 27% 35% 33% 30% 31% 23% 24% 37% 30% 31% 39% 27% 37%
Sigma 1407 687 720 383 345 382 297 938 208 169 26 450 521 408 385 593 429 547 532 108 481 926 395 742 270 679 704
100% 100% 100% 100% 100% 100% 100% 100% 100% 100% 100% 100% 100% 100% 100% 100% 100% 100% 100% 100% 100% 100% 100% 100% 100% 100% 100%

Page 36
Fielding Period: November 27 - 28, 2018
HCAPS (Filtered on Registered Voters)
Weighted To The U.S. General Adult Population
30 Nov 2018
Table 33
CONGRESS1106 Would you like to see the rules of Congress changed to allow amendments to a bill to come to vote when they have significant bipartisan support?
Base: All Respondents
Presidential
Election Candidate
Gender Age Ethnicity Political Party Political Ideology Voted For Education Locale Income
_____________ ______________________ _______________________ ____________________ ____________________ _____________________ _____________ ________________ _________
Colle- Some
Cons- ge Gr- Colle- $75K Less
Hisp- Black Repub- Democ- Indep- Libe- Mode- erva- 3rd ad And ge Or Urb- Subu- Or Than
Total Male Female 18-34 35-49 50-64 65+ White anic /AA Other lican rat endent ral rate tive Clinton Trump Party Higher Less an rban Rural More $75K
______ _____ _______ _____ _____ _____ ____ _____ _____ _____ _____ ______ ______ ______ ______ ______ ______ ________ ______ _____ ______ ______ ____ _____ _____ ____ ____
Unweighted Base 1407 675 732 416 359 364 268 1049 104 173 25 437 526 382 437 549 421 537 505 113 543 864 388 719 300 548 846
Weighted Base 1407 687 720 383 345 382 297 938 208 169 26 450 521 408 385 593 429 547 532 108 481 926 395 742 270 679 704
Yes 785 443 342 204 175 217 189 526 104 102 16 240 315 221 257 313 214 350 287 76 314 471 231 425 128 419 363
56% 64% 47% 53% 51% 57% 63% 56% 50% 61% 61% 53% 61% 54% 67% 53% 50% 64% 54% 70% 65% 51% 59% 57% 47% 62% 52%
No 205 98 107 79 58 48 20 129 41 22 1 80 59 63 38 99 68 53 90 14 59 146 48 118 39 102 103
15% 14% 15% 21% 17% 13% 7% 14% 20% 13% 5% 18% 11% 16% 10% 17% 16% 10% 17% 13% 12% 16% 12% 16% 14% 15% 15%
Not sure 417 146 271 100 112 117 89 283 63 44 9 130 147 123 90 181 146 144 154 19 108 309 115 199 103 158 238
30% 21% 38% 26% 32% 31% 30% 30% 30% 26% 34% 29% 28% 30% 23% 30% 34% 26% 29% 17% 23% 33% 29% 27% 38% 23% 34%
Sigma 1407 687 720 383 345 382 297 938 208 169 26 450 521 408 385 593 429 547 532 108 481 926 395 742 270 679 704
100% 100% 100% 100% 100% 100% 100% 100% 100% 100% 100% 100% 100% 100% 100% 100% 100% 100% 100% 100% 100% 100% 100% 100% 100% 100% 100%

Page 37
Fielding Period: November 27 - 28, 2018
HCAPS (Filtered on Registered Voters)
Weighted To The U.S. General Adult Population
30 Nov 2018
Table 34
CONGRESS1107 Do you support or oppose your member of Congress withholding their vote for the next Speaker of the House until these rule changes are enacted by Congress?
Base: All Respondents
Presidential
Election Candidate
Gender Age Ethnicity Political Party Political Ideology Voted For Education Locale Income
_____________ ______________________ _______________________ ____________________ ____________________ _____________________ _____________ ________________ _________
Colle- Some
Cons- ge Gr- Colle- $75K Less
Hisp- Black Repub- Democ- Indep- Libe- Mode- erva- 3rd ad And ge Or Urb- Subu- Or Than
Total Male Female 18-34 35-49 50-64 65+ White anic /AA Other lican rat endent ral rate tive Clinton Trump Party Higher Less an rban Rural More $75K
______ _____ _______ _____ _____ _____ ____ _____ _____ _____ _____ ______ ______ ______ ______ ______ ______ ________ ______ _____ ______ ______ ____ _____ _____ ____ ____
Unweighted Base 1407 675 732 416 359 364 268 1049 104 173 25 437 526 382 437 549 421 537 505 113 543 864 388 719 300 548 846
Weighted Base 1407 687 720 383 345 382 297 938 208 169 26 450 521 408 385 593 429 547 532 108 481 926 395 742 270 679 704
Stronglysomewhat Support 443 239 204 165 101 97 80 281 82 53 7 162 158 120 147 170 126 169 190 35 170 274 156 210 77 207 230
(Net) 32% 35% 28% 43% 29% 25% 27% 30% 39% 31% 26% 36% 30% 29% 38% 29% 29% 31% 36% 33% 35% 30% 40% 28% 29% 31% 33%
Strongly support 146 83 63 51 38 28 29 97 28 15 1 58 44 44 51 50 44 52 78 8 59 87 64 65 17 75 70
10% 12% 9% 13% 11% 7% 10% 10% 13% 9% 3% 13% 8% 11% 13% 8% 10% 10% 15% 7% 12% 9% 16% 9% 6% 11% 10%
Somewhat support 297 157 141 115 64 68 51 185 54 39 6 104 114 77 96 120 82 117 112 27 111 187 92 145 60 133 160
21% 23% 20% 30% 18% 18% 17% 20% 26% 23% 23% 23% 22% 19% 25% 20% 19% 21% 21% 25% 23% 20% 23% 20% 22% 20% 23%
Not sure 629 273 356 159 155 187 128 423 102 70 8 167 250 196 165 291 173 258 189 47 177 452 157 341 131 272 346
45% 40% 49% 42% 45% 49% 43% 45% 49% 41% 32% 37% 48% 48% 43% 49% 40% 47% 36% 44% 37% 49% 40% 46% 49% 40% 49%
Strongly/Somewhat Oppose 335 174 160 59 89 98 89 234 24 46 11 122 112 92 73 132 130 121 152 25 135 200 82 191 62 201 127
(Net) 24% 25% 22% 15% 26% 26% 30% 25% 12% 27% 43% 27% 22% 23% 19% 22% 30% 22% 29% 23% 28% 22% 21% 26% 23% 30% 18%
Somewhat oppose 196 95 101 35 56 50 54 140 19 22 3 65 68 60 41 82 72 79 73 15 82 113 48 113 35 114 79
14% 14% 14% 9% 16% 13% 18% 15% 9% 13% 13% 15% 13% 15% 11% 14% 17% 14% 14% 14% 17% 12% 12% 15% 13% 17% 11%
Strongly oppose 139 79 59 24 33 47 35 95 5 25 8 57 45 32 32 50 57 42 79 10 52 86 34 78 27 86 48
10% 12% 8% 6% 10% 12% 12% 10% 3% 15% 30% 13% 9% 8% 8% 8% 13% 8% 15% 10% 11% 9% 8% 11% 10% 13% 7%
Sigma 1407 687 720 383 345 382 297 938 208 169 26 450 521 408 385 593 429 547 532 108 481 926 395 742 270 679 704
100% 100% 100% 100% 100% 100% 100% 100% 100% 100% 100% 100% 100% 100% 100% 100% 100% 100% 100% 100% 100% 100% 100% 100% 100% 100% 100%

Page 38
Fielding Period: November 27 - 28, 2018
HCAPS (Filtered on Registered Voters)
Weighted To The U.S. General Adult Population
30 Nov 2018
Table 35
CONGRESS1104 Which of the following issues would you like the new Congress to take up first in January 2019?
Please rank your top three issues. Next to the first-ranked issue, enter ''1'', next to the second-ranked issue, enter ''2''; next to the third-ranked issue, enter ''3.''
You may select up to three options.
Summary Of Rank 1
Base: All Respondents
Presidential
Election Candidate
Gender Age Ethnicity Political Party Political Ideology Voted For Education Locale Income
_____________ ______________________ _______________________ ____________________ ____________________ _____________________ _____________ ________________ _________
Colle- Some
Cons- ge Gr- Colle- $75K Less
Hisp- Black Repub- Democ- Indep- Libe- Mode- erva- 3rd ad And ge Or Urb- Subu- Or Than
Total Male Female 18-34 35-49 50-64 65+ White anic /AA Other lican rat endent ral rate tive Clinton Trump Party Higher Less an rban Rural More $75K
______ _____ _______ _____ _____ _____ ____ _____ _____ _____ _____ ______ ______ ______ ______ ______ ______ ________ ______ _____ ______ ______ ____ _____ _____ ____ ____
Unweighted Base 1407 675 732 416 359 364 268 1049 104 173 25 437 526 382 437 549 421 537 505 113 543 864 388 719 300 548 846
Weighted Base 1407 687 720 383 345 382 297 938 208 169 26 450 521 408 385 593 429 547 532 108 481 926 395 742 270 679 704
Increasing border security 143 71 72 24 28 58 32 120 12 4 3 93 12 34 7 38 98 9 113 5 38 105 34 83 26 74 66
10% 10% 10% 6% 8% 15% 11% 13% 6% 2% 12% 21% 2% 8% 2% 6% 23% 2% 21% 4% 8% 11% 9% 11% 10% 11% 9%
Boosting the economy and 124 58 66 39 44 28 12 79 14 21 5 36 34 50 15 71 38 38 52 11 30 94 36 61 27 45 79
jobs 9% 8% 9% 10% 13% 7% 4% 8% 7% 13% 18% 8% 7% 12% 4% 12% 9% 7% 10% 10% 6% 10% 9% 8% 10% 7% 11%
Protecting healthcare 115 52 63 14 18 43 41 72 23 13 3 31 57 26 36 49 30 53 28 7 37 78 34 56 25 48 64
coverage for pre-existing 8% 8% 9% 4% 5% 11% 14% 8% 11% 8% 11% 7% 11% 6% 9% 8% 7% 10% 5% 7% 8% 8% 9% 8% 9% 7% 9%
conditions
Protecting against gun 102 47 55 40 23 16 24 58 23 20 1 22 56 24 32 53 17 59 23 5 35 67 31 57 14 53 49
violence 7% 7% 8% 10% 7% 4% 8% 6% 11% 12% 4% 5% 11% 6% 8% 9% 4% 11% 4% 4% 7% 7% 8% 8% 5% 8% 7%
Pushing through healthcare 98 46 52 19 20 35 24 76 5 13 - 35 42 21 34 36 28 48 36 7 41 57 21 52 25 54 40
reform 7% 7% 7% 5% 6% 9% 8% 8% 3% 8% - 8% 8% 5% 9% 6% 7% 9% 7% 6% 9% 6% 5% 7% 9% 8% 6%
Protecting the Affordable 93 40 52 16 24 30 22 46 20 20 * 13 61 19 41 40 11 66 11 1 40 52 29 49 15 52 40
Care Act (also known as 7% 6% 7% 4% 7% 8% 7% 5% 10% 12% 1% 3% 12% 5% 11% 7% 3% 12% 2% 1% 8% 6% 7% 7% 5% 8% 6%
Obamacare)
Fighting the national debt 78 43 35 11 20 28 20 62 6 5 2 25 21 28 15 30 34 25 27 18 34 45 14 47 17 46 32
and federal budget deficits 6% 6% 5% 3% 6% 7% 7% 7% 3% 3% 7% 6% 4% 7% 4% 5% 8% 5% 5% 16% 7% 5% 4% 6% 6% 7% 5%
Pushing through immigration 77 48 29 9 22 20 25 61 3 5 4 38 14 23 9 26 42 13 55 2 36 41 7 49 21 38 33
reform 5% 7% 4% 2% 6% 5% 9% 7% 2% 3% 16% 8% 3% 6% 2% 4% 10% 2% 10% 2% 7% 4% 2% 7% 8% 6% 5%
Enhancing national security 72 35 37 19 13 19 21 58 3 7 2 29 15 27 13 25 35 14 43 5 26 45 17 38 17 34 38
(terrorism, cybersecurity, 5% 5% 5% 5% 4% 5% 7% 6% 1% 4% 7% 6% 3% 7% 3% 4% 8% 3% 8% 5% 5% 5% 4% 5% 6% 5% 5%
etc.)
Protecting the Special 69 43 27 13 9 27 19 47 8 9 1 4 42 23 37 23 9 49 5 10 32 37 30 31 9 46 21
Counsel's Russia 5% 6% 4% 4% 3% 7% 6% 5% 4% 6% 3% 1% 8% 6% 10% 4% 2% 9% 1% 9% 7% 4% 7% 4% 3% 7% 3%
investigation
Protecting the environment 63 31 32 27 19 8 9 41 12 6 - 14 22 25 26 29 8 35 16 3 24 40 21 37 5 29 34
4% 4% 4% 7% 6% 2% 3% 4% 6% 4% - 3% 4% 6% 7% 5% 2% 6% 3% 3% 5% 4% 5% 5% 2% 4% 5%
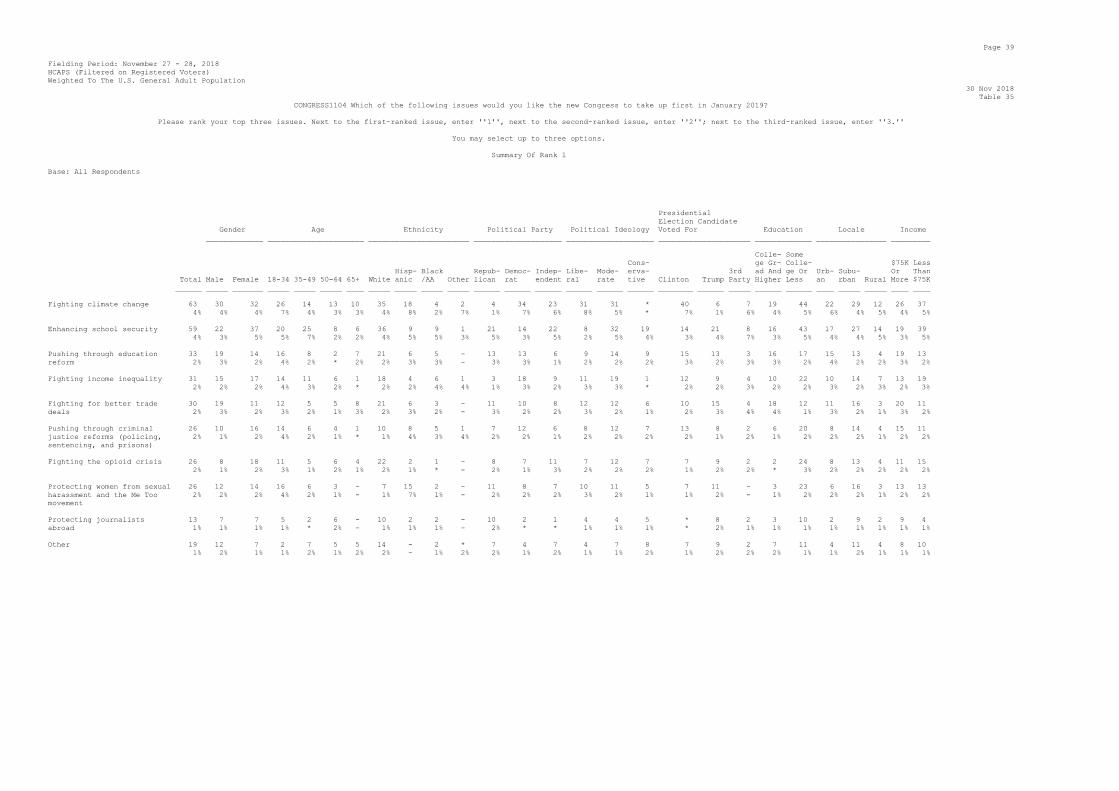
Page 39
Fielding Period: November 27 - 28, 2018
HCAPS (Filtered on Registered Voters)
Weighted To The U.S. General Adult Population
30 Nov 2018
Table 35
CONGRESS1104 Which of the following issues would you like the new Congress to take up first in January 2019?
Please rank your top three issues. Next to the first-ranked issue, enter ''1'', next to the second-ranked issue, enter ''2''; next to the third-ranked issue, enter ''3.''
You may select up to three options.
Summary Of Rank 1
Base: All Respondents
Presidential
Election Candidate
Gender Age Ethnicity Political Party Political Ideology Voted For Education Locale Income
_____________ ______________________ _______________________ ____________________ ____________________ _____________________ _____________ ________________ _________
Colle- Some
Cons- ge Gr- Colle- $75K Less
Hisp- Black Repub- Democ- Indep- Libe- Mode- erva- 3rd ad And ge Or Urb- Subu- Or Than
Total Male Female 18-34 35-49 50-64 65+ White anic /AA Other lican rat endent ral rate tive Clinton Trump Party Higher Less an rban Rural More $75K
______ _____ _______ _____ _____ _____ ____ _____ _____ _____ _____ ______ ______ ______ ______ ______ ______ ________ ______ _____ ______ ______ ____ _____ _____ ____ ____
Fighting climate change 63 30 32 26 14 13 10 35 18 4 2 4 34 23 31 31 * 40 6 7 19 44 22 29 12 26 37
4% 4% 4% 7% 4% 3% 3% 4% 8% 2% 7% 1% 7% 6% 8% 5% * 7% 1% 6% 4% 5% 6% 4% 5% 4% 5%
Enhancing school security 59 22 37 20 25 8 6 36 9 9 1 21 14 22 8 32 19 14 21 8 16 43 17 27 14 19 39
4% 3% 5% 5% 7% 2% 2% 4% 5% 5% 3% 5% 3% 5% 2% 5% 4% 3% 4% 7% 3% 5% 4% 4% 5% 3% 5%
Pushing through education 33 19 14 16 8 2 7 21 6 5 - 13 13 6 9 14 9 15 13 3 16 17 15 13 4 19 13
reform 2% 3% 2% 4% 2% * 2% 2% 3% 3% - 3% 3% 1% 2% 2% 2% 3% 2% 3% 3% 2% 4% 2% 2% 3% 2%
Fighting income inequality 31 15 17 14 11 6 1 18 4 6 1 3 18 9 11 19 1 12 9 4 10 22 10 14 7 13 19
2% 2% 2% 4% 3% 2% * 2% 2% 4% 4% 1% 3% 2% 3% 3% * 2% 2% 3% 2% 2% 3% 2% 3% 2% 3%
Fighting for better trade 30 19 11 12 5 5 8 21 6 3 - 11 10 8 12 12 6 10 15 4 18 12 11 16 3 20 11
deals 2% 3% 2% 3% 2% 1% 3% 2% 3% 2% - 3% 2% 2% 3% 2% 1% 2% 3% 4% 4% 1% 3% 2% 1% 3% 2%
Pushing through criminal 26 10 16 14 6 4 1 10 8 5 1 7 12 6 8 12 7 13 8 2 6 20 8 14 4 15 11
justice reforms (policing, 2% 1% 2% 4% 2% 1% * 1% 4% 3% 4% 2% 2% 1% 2% 2% 2% 2% 1% 2% 1% 2% 2% 2% 1% 2% 2%
sentencing, and prisons)
Fighting the opioid crisis 26 8 18 11 5 6 4 22 2 1 - 8 7 11 7 12 7 7 9 2 2 24 8 13 4 11 15
2% 1% 2% 3% 1% 2% 1% 2% 1% * - 2% 1% 3% 2% 2% 2% 1% 2% 2% * 3% 2% 2% 2% 2% 2%
Protecting women from sexual 26 12 14 16 6 3 - 7 15 2 - 11 8 7 10 11 5 7 11 - 3 23 6 16 3 13 13
harassment and the Me Too 2% 2% 2% 4% 2% 1% - 1% 7% 1% - 2% 2% 2% 3% 2% 1% 1% 2% - 1% 2% 2% 2% 1% 2% 2%
movement
Protecting journalists 13 7 7 5 2 6 - 10 2 2 - 10 2 1 4 4 5 * 8 2 3 10 2 9 2 9 4
abroad 1% 1% 1% 1% * 2% - 1% 1% 1% - 2% * * 1% 1% 1% * 2% 1% 1% 1% 1% 1% 1% 1% 1%
Other 19 12 7 2 7 5 5 14 - 2 * 7 4 7 4 7 8 7 9 2 7 11 4 11 4 8 10
1% 2% 1% 1% 2% 1% 2% 2% - 1% 2% 2% 1% 2% 1% 1% 2% 1% 2% 2% 2% 1% 1% 2% 1% 1% 1%

Page 40
Fielding Period: November 27 - 28, 2018
HCAPS (Filtered on Registered Voters)
Weighted To The U.S. General Adult Population
30 Nov 2018
Table 36
CONGRESS1104 Which of the following issues would you like the new Congress to take up first in January 2019?
Please rank your top three issues. Next to the first-ranked issue, enter ''1'', next to the second-ranked issue, enter ''2''; next to the third-ranked issue, enter ''3.''
You may select up to three options.
Summary Of Rank 2
Base: All Respondents
Presidential
Election Candidate
Gender Age Ethnicity Political Party Political Ideology Voted For Education Locale Income
_____________ ______________________ _______________________ ____________________ ____________________ _____________________ _____________ ________________ _________
Colle- Some
Cons- ge Gr- Colle- $75K Less
Hisp- Black Repub- Democ- Indep- Libe- Mode- erva- 3rd ad And ge Or Urb- Subu- Or Than
Total Male Female 18-34 35-49 50-64 65+ White anic /AA Other lican rat endent ral rate tive Clinton Trump Party Higher Less an rban Rural More $75K
______ _____ _______ _____ _____ _____ ____ _____ _____ _____ _____ ______ ______ ______ ______ ______ ______ ________ ______ _____ ______ ______ ____ _____ _____ ____ ____
Unweighted Base 1407 675 732 416 359 364 268 1049 104 173 25 437 526 382 437 549 421 537 505 113 543 864 388 719 300 548 846
Weighted Base 1407 687 720 383 345 382 297 938 208 169 26 450 521 408 385 593 429 547 532 108 481 926 395 742 270 679 704
Boosting the economy and 128 63 65 33 31 44 21 88 30 10 - 49 49 29 28 56 44 39 54 6 38 90 32 71 25 64 63
jobs 9% 9% 9% 9% 9% 11% 7% 9% 14% 6% - 11% 9% 7% 7% 10% 10% 7% 10% 6% 8% 10% 8% 10% 9% 9% 9%
Pushing through healthcare 105 50 55 22 21 34 28 76 14 7 2 37 24 41 17 51 37 32 41 11 41 64 35 58 12 45 59
reform 7% 7% 8% 6% 6% 9% 9% 8% 7% 4% 9% 8% 5% 10% 4% 9% 9% 6% 8% 10% 8% 7% 9% 8% 4% 7% 8%
Protecting against gun 102 46 56 27 27 24 24 62 11 23 1 12 59 29 35 53 14 63 19 8 36 66 32 53 17 50 51
violence 7% 7% 8% 7% 8% 6% 8% 7% 5% 14% 3% 3% 11% 7% 9% 9% 3% 11% 4% 7% 7% 7% 8% 7% 6% 7% 7%
Protecting healthcare 100 45 55 24 21 26 27 62 10 22 3 20 55 23 40 37 23 55 24 10 35 65 29 59 12 44 56
coverage for pre-existing 7% 7% 8% 6% 6% 7% 9% 7% 5% 13% 11% 5% 11% 6% 10% 6% 5% 10% 5% 9% 7% 7% 7% 8% 4% 6% 8%
conditions
Fighting the national debt 94 52 42 20 22 20 32 72 9 8 3 36 25 31 10 34 50 27 43 12 28 67 25 50 19 46 44
and federal budget deficits 7% 8% 6% 5% 6% 5% 11% 8% 4% 5% 11% 8% 5% 8% 3% 6% 12% 5% 8% 11% 6% 7% 6% 7% 7% 7% 6%
Increasing border security 94 52 42 16 16 32 30 73 9 6 4 58 11 25 8 36 51 8 74 2 29 65 22 49 24 42 48
7% 8% 6% 4% 5% 8% 10% 8% 5% 4% 14% 13% 2% 6% 2% 6% 12% 1% 14% 1% 6% 7% 6% 7% 9% 6% 7%
Pushing through immigration 92 41 51 18 23 26 25 63 19 4 1 44 19 27 17 27 48 21 54 1 37 54 23 46 23 46 44
reform 7% 6% 7% 5% 7% 7% 9% 7% 9% 2% 3% 10% 4% 7% 4% 5% 11% 4% 10% 1% 8% 6% 6% 6% 9% 7% 6%
Fighting climate change 91 46 45 35 19 23 15 60 19 2 3 14 49 28 43 38 10 61 17 4 33 58 20 52 20 48 40
6% 7% 6% 9% 5% 6% 5% 6% 9% 1% 13% 3% 9% 7% 11% 6% 2% 11% 3% 3% 7% 6% 5% 7% 7% 7% 6%
Enhancing national security 84 43 41 17 26 23 18 62 17 2 1 32 21 29 9 37 38 22 41 9 26 58 27 41 16 35 48
(terrorism, cybersecurity, 6% 6% 6% 4% 8% 6% 6% 7% 8% 1% 4% 7% 4% 7% 2% 6% 9% 4% 8% 8% 5% 6% 7% 6% 6% 5% 7%
etc.)
Protecting the environment 64 31 33 20 21 13 9 43 11 4 - 20 25 17 23 30 11 30 18 5 23 40 17 33 13 31 33
5% 4% 5% 5% 6% 3% 3% 5% 5% 3% - 4% 5% 4% 6% 5% 2% 5% 3% 4% 5% 4% 4% 4% 5% 4% 5%
Protecting the Affordable 61 30 32 14 13 25 10 38 6 15 1 8 41 11 37 18 7 40 10 6 23 39 16 31 14 31 30
Care Act (also known as 4% 4% 4% 4% 4% 7% 3% 4% 3% 9% 4% 2% 8% 3% 10% 3% 2% 7% 2% 5% 5% 4% 4% 4% 5% 5% 4%
Obamacare)

Page 41
Fielding Period: November 27 - 28, 2018
HCAPS (Filtered on Registered Voters)
Weighted To The U.S. General Adult Population
30 Nov 2018
Table 36
CONGRESS1104 Which of the following issues would you like the new Congress to take up first in January 2019?
Please rank your top three issues. Next to the first-ranked issue, enter ''1'', next to the second-ranked issue, enter ''2''; next to the third-ranked issue, enter ''3.''
You may select up to three options.
Summary Of Rank 2
Base: All Respondents
Presidential
Election Candidate
Gender Age Ethnicity Political Party Political Ideology Voted For Education Locale Income
_____________ ______________________ _______________________ ____________________ ____________________ _____________________ _____________ ________________ _________
Colle- Some
Cons- ge Gr- Colle- $75K Less
Hisp- Black Repub- Democ- Indep- Libe- Mode- erva- 3rd ad And ge Or Urb- Subu- Or Than
Total Male Female 18-34 35-49 50-64 65+ White anic /AA Other lican rat endent ral rate tive Clinton Trump Party Higher Less an rban Rural More $75K
______ _____ _______ _____ _____ _____ ____ _____ _____ _____ _____ ______ ______ ______ ______ ______ ______ ________ ______ _____ ______ ______ ____ _____ _____ ____ ____
Protecting the Special 48 28 20 5 16 16 12 30 5 6 2 8 30 10 28 15 5 35 8 2 27 21 13 28 7 31 15
Counsel's Russia 3% 4% 3% 1% 4% 4% 4% 3% 3% 3% 10% 2% 6% 2% 7% 3% 1% 6% 1% 2% 6% 2% 3% 4% 3% 5% 2%
investigation
Fighting income inequality 46 20 26 13 18 11 4 24 5 13 3 4 18 22 13 28 4 21 11 4 15 30 8 32 5 25 20
3% 3% 4% 3% 5% 3% 1% 3% 2% 8% 11% 1% 3% 5% 3% 5% 1% 4% 2% 4% 3% 3% 2% 4% 2% 4% 3%
Enhancing school security 41 13 28 15 8 10 8 22 8 7 - 17 16 7 11 18 12 10 17 2 16 26 18 11 12 13 28
3% 2% 4% 4% 2% 3% 3% 2% 4% 4% - 4% 3% 2% 3% 3% 3% 2% 3% 2% 3% 3% 4% 2% 5% 2% 4%
Fighting the opioid crisis 39 12 27 12 6 17 3 29 6 2 - 18 6 14 6 15 18 5 19 10 8 31 7 23 8 22 14
3% 2% 4% 3% 2% 5% 1% 3% 3% 1% - 4% 1% 3% 1% 2% 4% 1% 4% 9% 2% 3% 2% 3% 3% 3% 2%
Protecting women from sexual 37 16 21 18 8 3 9 23 5 6 1 5 15 16 18 17 3 19 7 4 11 27 21 10 6 15 22
harassment and the Me Too 3% 2% 3% 5% 2% 1% 3% 2% 2% 4% 4% 1% 3% 4% 5% 3% 1% 3% 1% 4% 2% 3% 5% 1% 2% 2% 3%
movement
Pushing through criminal 37 17 20 9 12 7 9 25 - 11 * 13 13 11 8 17 12 18 14 2 10 27 11 22 4 23 14
justice reforms (policing, 3% 2% 3% 2% 4% 2% 3% 3% - 7% 2% 3% 2% 3% 2% 3% 3% 3% 3% 2% 2% 3% 3% 3% 2% 3% 2%
sentencing, and prisons)
Fighting for better trade 37 29 8 8 11 11 6 24 6 3 - 23 4 8 1 14 21 2 26 4 16 21 4 24 9 26 11
deals 3% 4% 1% 2% 3% 3% 2% 3% 3% 2% - 5% 1% 2% * 2% 5% * 5% 4% 3% 2% 1% 3% 3% 4% 2%
Pushing through education 33 21 12 24 6 3 - 20 3 7 - 13 12 7 7 19 7 12 11 5 16 17 10 15 8 20 12
reform 2% 3% 2% 6% 2% 1% - 2% 1% 4% - 3% 2% 2% 2% 3% 2% 2% 2% 5% 3% 2% 2% 2% 3% 3% 2%
Protecting journalists 16 8 7 15 1 * - 8 4 3 1 2 7 6 6 9 - 8 5 - 3 12 8 6 2 8 8
abroad 1% 1% 1% 4% * * - 1% 2% 2% 3% * 1% 2% 2% 2% - 1% 1% - 1% 1% 2% 1% 1% 1% 1%
Other 7 4 3 1 1 3 3 7 - 1 - 2 2 3 2 2 4 3 3 1 4 4 * 5 2 4 4
1% 1% * * * 1% 1% 1% - * - 1% * 1% * * 1% 1% 1% 1% 1% * * 1% 1% 1% 1%

Page 42
Fielding Period: November 27 - 28, 2018
HCAPS (Filtered on Registered Voters)
Weighted To The U.S. General Adult Population
30 Nov 2018
Table 37
CONGRESS1104 Which of the following issues would you like the new Congress to take up first in January 2019?
Please rank your top three issues. Next to the first-ranked issue, enter ''1'', next to the second-ranked issue, enter ''2''; next to the third-ranked issue, enter ''3.''
You may select up to three options.
Summary Of Rank 3
Base: All Respondents
Presidential
Election Candidate
Gender Age Ethnicity Political Party Political Ideology Voted For Education Locale Income
_____________ ______________________ _______________________ ____________________ ____________________ _____________________ _____________ ________________ _________
Colle- Some
Cons- ge Gr- Colle- $75K Less
Hisp- Black Repub- Democ- Indep- Libe- Mode- erva- 3rd ad And ge Or Urb- Subu- Or Than
Total Male Female 18-34 35-49 50-64 65+ White anic /AA Other lican rat endent ral rate tive Clinton Trump Party Higher Less an rban Rural More $75K
______ _____ _______ _____ _____ _____ ____ _____ _____ _____ _____ ______ ______ ______ ______ ______ ______ ________ ______ _____ ______ ______ ____ _____ _____ ____ ____
Unweighted Base 1407 675 732 416 359 364 268 1049 104 173 25 437 526 382 437 549 421 537 505 113 543 864 388 719 300 548 846
Weighted Base 1407 687 720 383 345 382 297 938 208 169 26 450 521 408 385 593 429 547 532 108 481 926 395 742 270 679 704
Fighting the national debt 134 69 65 27 28 41 39 85 20 20 3 44 39 47 17 67 50 36 68 12 47 87 36 70 28 75 58
and federal budget deficits 10% 10% 9% 7% 8% 11% 13% 9% 10% 12% 10% 10% 7% 12% 4% 11% 12% 7% 13% 11% 10% 9% 9% 9% 10% 11% 8%
Boosting the economy and 124 66 59 45 30 29 21 86 16 18 * 50 37 36 26 49 49 44 51 8 45 80 40 62 22 60 60
jobs 9% 10% 8% 12% 9% 7% 7% 9% 8% 11% 1% 11% 7% 9% 7% 8% 12% 8% 10% 7% 9% 9% 10% 8% 8% 9% 8%
Protecting healthcare 88 39 49 10 19 35 25 69 3 14 * 34 33 21 17 39 32 29 37 12 24 64 20 49 19 39 45
coverage for pre-existing 6% 6% 7% 3% 5% 9% 8% 7% 2% 8% 1% 7% 6% 5% 4% 7% 7% 5% 7% 11% 5% 7% 5% 7% 7% 6% 6%
conditions
Pushing through healthcare 87 53 34 18 19 28 21 51 22 7 2 24 37 25 24 34 29 45 28 8 20 67 22 50 15 34 52
reform 6% 8% 5% 5% 6% 7% 7% 5% 11% 4% 8% 5% 7% 6% 6% 6% 7% 8% 5% 7% 4% 7% 6% 7% 6% 5% 7%
Protecting against gun 85 30 55 17 22 23 23 58 9 10 4 17 41 25 26 41 18 46 22 4 31 55 21 57 7 43 43
violence 6% 4% 8% 4% 7% 6% 8% 6% 4% 6% 14% 4% 8% 6% 7% 7% 4% 8% 4% 3% 6% 6% 5% 8% 3% 6% 6%
Enhancing national security 85 34 52 14 30 20 22 71 5 6 - 47 19 17 11 27 48 19 45 9 30 55 17 44 24 43 40
(terrorism, cybersecurity, 6% 5% 7% 4% 9% 5% 7% 8% 2% 3% - 11% 4% 4% 3% 5% 11% 3% 9% 8% 6% 6% 4% 6% 9% 6% 6%
etc.)
Increasing border security 82 37 45 17 30 20 15 55 11 7 2 42 15 23 8 34 40 8 56 9 30 52 16 44 22 36 45
6% 5% 6% 5% 9% 5% 5% 6% 5% 4% 8% 9% 3% 6% 2% 6% 9% 1% 11% 8% 6% 6% 4% 6% 8% 5% 6%
Protecting the environment 79 31 48 35 9 23 12 53 11 6 5 18 30 29 30 30 19 33 19 7 31 48 22 39 18 40 37
6% 4% 7% 9% 3% 6% 4% 6% 5% 3% 18% 4% 6% 7% 8% 5% 5% 6% 4% 7% 6% 5% 6% 5% 7% 6% 5%
Pushing through immigration 75 42 33 21 16 16 21 50 8 14 - 26 24 24 13 32 29 30 36 2 28 47 23 40 12 41 34
reform 5% 6% 5% 6% 5% 4% 7% 5% 4% 8% - 6% 5% 6% 3% 5% 7% 5% 7% 2% 6% 5% 6% 5% 4% 6% 5%
Protecting the Affordable 71 38 33 15 18 26 12 46 17 6 1 8 46 16 36 27 8 57 6 3 25 46 30 34 7 37 34
Care Act (also known as 5% 5% 5% 4% 5% 7% 4% 5% 8% 4% 3% 2% 9% 4% 9% 5% 2% 10% 1% 3% 5% 5% 8% 5% 2% 5% 5%
Obamacare)
Fighting climate change 64 29 35 17 11 19 17 43 11 7 1 3 44 16 35 21 8 39 10 1 30 34 16 35 13 40 23
5% 4% 5% 5% 3% 5% 6% 5% 5% 4% 5% 1% 8% 4% 9% 4% 2% 7% 2% 1% 6% 4% 4% 5% 5% 6% 3%

Page 43
Fielding Period: November 27 - 28, 2018
HCAPS (Filtered on Registered Voters)
Weighted To The U.S. General Adult Population
30 Nov 2018
Table 37
CONGRESS1104 Which of the following issues would you like the new Congress to take up first in January 2019?
Please rank your top three issues. Next to the first-ranked issue, enter ''1'', next to the second-ranked issue, enter ''2''; next to the third-ranked issue, enter ''3.''
You may select up to three options.
Summary Of Rank 3
Base: All Respondents
Presidential
Election Candidate
Gender Age Ethnicity Political Party Political Ideology Voted For Education Locale Income
_____________ ______________________ _______________________ ____________________ ____________________ _____________________ _____________ ________________ _________
Colle- Some
Cons- ge Gr- Colle- $75K Less
Hisp- Black Repub- Democ- Indep- Libe- Mode- erva- 3rd ad And ge Or Urb- Subu- Or Than
Total Male Female 18-34 35-49 50-64 65+ White anic /AA Other lican rat endent ral rate tive Clinton Trump Party Higher Less an rban Rural More $75K
______ _____ _______ _____ _____ _____ ____ _____ _____ _____ _____ ______ ______ ______ ______ ______ ______ ________ ______ _____ ______ ______ ____ _____ _____ ____ ____
Fighting income inequality 57 31 27 26 17 8 7 33 8 11 - 13 27 16 21 26 10 28 20 7 17 40 19 34 4 27 31
4% 4% 4% 7% 5% 2% 2% 4% 4% 6% - 3% 5% 4% 6% 4% 2% 5% 4% 7% 4% 4% 5% 5% 2% 4% 4%
Fighting for better trade 50 33 17 14 6 21 8 42 4 4 - 25 8 17 9 18 23 6 27 4 13 37 11 34 6 33 15
deals 4% 5% 2% 4% 2% 6% 3% 4% 2% 2% - 6% 2% 4% 2% 3% 5% 1% 5% 4% 3% 4% 3% 5% 2% 5% 2%
Protecting the Special 47 22 25 16 11 7 13 28 15 2 1 5 29 13 26 21 * 34 5 * 20 28 14 24 10 19 29
Counsel's Russia 3% 3% 4% 4% 3% 2% 4% 3% 7% 1% 4% 1% 5% 3% 7% 4% * 6% 1% * 4% 3% 4% 3% 4% 3% 4%
investigation
Enhancing school security 43 18 25 13 13 7 10 21 6 12 * 17 19 6 11 20 12 22 11 1 10 33 11 22 10 15 28
3% 3% 3% 3% 4% 2% 3% 2% 3% 7% 2% 4% 4% 1% 3% 3% 3% 4% 2% 1% 2% 4% 3% 3% 4% 2% 4%
Pushing through education 42 18 24 15 9 10 7 26 8 5 2 15 14 10 11 19 11 10 20 6 22 20 13 18 11 19 22
reform 3% 3% 3% 4% 3% 3% 2% 3% 4% 3% 9% 3% 3% 3% 3% 3% 3% 2% 4% 5% 5% 2% 3% 2% 4% 3% 3%
Pushing through criminal 37 19 18 13 9 10 5 21 6 8 1 15 11 10 10 17 9 9 18 4 16 21 15 16 6 16 21
justice reforms (policing, 3% 3% 2% 3% 3% 3% 2% 2% 3% 5% 3% 3% 2% 2% 3% 3% 2% 2% 3% 3% 3% 2% 4% 2% 2% 2% 3%
sentencing, and prisons)
Fighting the opioid crisis 32 17 15 13 6 7 6 26 2 2 1 13 11 7 9 14 9 12 11 2 11 22 9 16 7 16 16
2% 2% 2% 3% 2% 2% 2% 3% 1% 1% 3% 3% 2% 2% 2% 2% 2% 2% 2% 2% 2% 2% 2% 2% 3% 2% 2%
Protecting women from sexual 29 16 13 13 8 3 4 13 13 2 1 7 9 12 9 13 6 13 6 4 7 21 14 11 4 9 19
harassment and the Me Too 2% 2% 2% 3% 2% 1% 1% 1% 6% 1% 4% 1% 2% 3% 2% 2% 1% 2% 1% 3% 2% 2% 3% 1% 1% 1% 3%
movement
Protecting journalists 15 6 9 4 6 3 3 7 2 2 - 2 5 7 10 4 * 4 5 2 7 8 6 5 3 9 6
abroad 1% 1% 1% 1% 2% 1% 1% 1% 1% 1% - * 1% 2% 3% 1% * 1% 1% 2% 1% 1% 2% 1% 1% 1% 1%
Other 7 3 4 2 - 4 1 5 - - 2 2 1 2 1 3 3 2 3 2 2 5 * 4 2 3 4
* * 1% * - 1% * 1% - - 7% * * 1% * * 1% * 1% 2% * 1% * 1% 1% * 1%

Page 44
Fielding Period: November 27 - 28, 2018
HCAPS (Filtered on Registered Voters)
Weighted To The U.S. General Adult Population
30 Nov 2018
Table 38
CONGRESS1104 Which of the following issues would you like the new Congress to take up first in January 2019?
Please rank your top three issues. Next to the first-ranked issue, enter ''1'', next to the second-ranked issue, enter ''2''; next to the third-ranked issue, enter ''3.''
You may select up to three options.
Summary Of Rank 1,2,3
Base: All Respondents
Presidential
Election Candidate
Gender Age Ethnicity Political Party Political Ideology Voted For Education Locale Income
_____________ ______________________ _______________________ ____________________ ____________________ _____________________ _____________ ________________ _________
Colle- Some
Cons- ge Gr- Colle- $75K Less
Hisp- Black Repub- Democ- Indep- Libe- Mode- erva- 3rd ad And ge Or Urb- Subu- Or Than
Total Male Female 18-34 35-49 50-64 65+ White anic /AA Other lican rat endent ral rate tive Clinton Trump Party Higher Less an rban Rural More $75K
______ _____ _______ _____ _____ _____ ____ _____ _____ _____ _____ ______ ______ ______ ______ ______ ______ ________ ______ _____ ______ ______ ____ _____ _____ ____ ____
Unweighted Base 1407 675 732 416 359 364 268 1049 104 173 25 437 526 382 437 549 421 537 505 113 543 864 388 719 300 548 846
Weighted Base 1407 687 720 383 345 382 297 938 208 169 26 450 521 408 385 593 429 547 532 108 481 926 395 742 270 679 704
Boosting the economy and 376 187 190 116 105 101 54 253 60 49 5 134 120 115 70 176 131 120 158 26 113 264 108 194 74 169 202
jobs 27% 27% 26% 30% 30% 26% 18% 27% 29% 29% 19% 30% 23% 28% 18% 30% 31% 22% 30% 24% 23% 28% 27% 26% 27% 25% 29%
Increasing border security 319 160 159 57 74 110 78 247 33 17 9 193 38 83 23 107 188 25 243 15 97 222 73 175 71 152 159
23% 23% 22% 15% 22% 29% 26% 26% 16% 10% 33% 43% 7% 20% 6% 18% 44% 5% 46% 14% 20% 24% 18% 24% 26% 22% 23%
Fighting the national debt 307 164 143 58 70 89 90 220 35 33 7 106 85 106 41 131 134 88 138 42 109 198 75 167 65 167 135
and federal budget deficits 22% 24% 20% 15% 20% 23% 30% 23% 17% 20% 28% 24% 16% 26% 11% 22% 31% 16% 26% 38% 23% 21% 19% 23% 24% 25% 19%
Protecting healthcare 303 136 167 48 58 105 93 203 37 49 6 85 145 70 93 125 85 137 89 29 96 207 83 164 56 131 165
coverage for pre-existing 22% 20% 23% 12% 17% 28% 31% 22% 18% 29% 23% 19% 28% 17% 24% 21% 20% 25% 17% 27% 20% 22% 21% 22% 21% 19% 23%
conditions
Pushing through healthcare 290 149 141 60 60 97 73 203 42 27 4 96 103 87 75 121 94 124 105 25 102 188 78 160 52 133 151
reform 21% 22% 20% 16% 17% 25% 25% 22% 20% 16% 17% 21% 20% 21% 19% 20% 22% 23% 20% 24% 21% 20% 20% 22% 19% 20% 21%
Protecting against gun 289 123 166 84 72 62 71 178 43 53 5 51 156 78 92 147 49 168 64 16 102 187 84 167 38 146 143
violence 21% 18% 23% 22% 21% 16% 24% 19% 21% 32% 21% 11% 30% 19% 24% 25% 11% 31% 12% 15% 21% 20% 21% 23% 14% 22% 20%
Pushing through immigration 243 131 112 49 60 63 71 174 30 22 5 107 57 75 39 85 119 64 145 6 100 143 52 135 56 124 112
reform 17% 19% 16% 13% 17% 16% 24% 19% 15% 13% 19% 24% 11% 18% 10% 14% 28% 12% 27% 5% 21% 15% 13% 18% 21% 18% 16%
Enhancing national security 242 112 130 49 69 63 61 190 24 15 3 108 55 74 33 88 120 56 129 23 83 159 61 123 57 112 126
(terrorism, cybersecurity, 17% 16% 18% 13% 20% 16% 20% 20% 12% 9% 11% 24% 11% 18% 8% 15% 28% 10% 24% 21% 17% 17% 16% 17% 21% 16% 18%
etc.)
Protecting the Affordable 225 108 117 46 54 81 44 130 42 41 2 29 148 45 114 85 26 163 27 9 88 137 76 114 35 121 104
Care Act (also known as 16% 16% 16% 12% 16% 21% 15% 14% 20% 24% 8% 7% 28% 11% 29% 14% 6% 30% 5% 9% 18% 15% 19% 15% 13% 18% 15%
Obamacare)
Fighting climate change 218 106 113 78 44 55 42 138 48 13 6 22 127 67 109 91 18 140 33 11 82 136 57 116 46 114 100
16% 15% 16% 20% 13% 15% 14% 15% 23% 7% 25% 5% 24% 16% 28% 15% 4% 26% 6% 11% 17% 15% 14% 16% 17% 17% 14%
Protecting the environment 206 92 114 82 50 44 31 137 33 16 5 52 77 71 79 89 38 98 53 15 78 128 60 109 37 99 103
15% 13% 16% 21% 14% 11% 10% 15% 16% 9% 18% 11% 15% 17% 21% 15% 9% 18% 10% 14% 16% 14% 15% 15% 14% 15% 15%

Page 45
Fielding Period: November 27 - 28, 2018
HCAPS (Filtered on Registered Voters)
Weighted To The U.S. General Adult Population
30 Nov 2018
Table 38
CONGRESS1104 Which of the following issues would you like the new Congress to take up first in January 2019?
Please rank your top three issues. Next to the first-ranked issue, enter ''1'', next to the second-ranked issue, enter ''2''; next to the third-ranked issue, enter ''3.''
You may select up to three options.
Summary Of Rank 1,2,3
Base: All Respondents
Presidential
Election Candidate
Gender Age Ethnicity Political Party Political Ideology Voted For Education Locale Income
_____________ ______________________ _______________________ ____________________ ____________________ _____________________ _____________ ________________ _________
Colle- Some
Cons- ge Gr- Colle- $75K Less
Hisp- Black Repub- Democ- Indep- Libe- Mode- erva- 3rd ad And ge Or Urb- Subu- Or Than
Total Male Female 18-34 35-49 50-64 65+ White anic /AA Other lican rat endent ral rate tive Clinton Trump Party Higher Less an rban Rural More $75K
______ _____ _______ _____ _____ _____ ____ _____ _____ _____ _____ ______ ______ ______ ______ ______ ______ ________ ______ _____ ______ ______ ____ _____ _____ ____ ____
Protecting the Special 165 93 72 35 36 50 44 104 29 17 4 17 100 46 90 60 14 117 18 12 79 86 56 83 26 96 65
Counsel's Russia 12% 13% 10% 9% 10% 13% 15% 11% 14% 10% 16% 4% 19% 11% 23% 10% 3% 21% 3% 11% 16% 9% 14% 11% 9% 14% 9%
investigation
Enhancing school security 143 54 90 48 46 26 24 79 24 28 1 56 49 34 31 69 44 47 48 11 42 101 46 61 37 47 95
10% 8% 12% 12% 13% 7% 8% 8% 12% 17% 5% 12% 9% 8% 8% 12% 10% 9% 9% 10% 9% 11% 12% 8% 14% 7% 14%
Fighting income inequality 135 65 69 53 46 25 11 75 17 30 4 20 62 47 46 73 16 61 40 15 43 92 37 80 17 65 70
10% 10% 10% 14% 13% 7% 4% 8% 8% 18% 16% 4% 12% 12% 12% 12% 4% 11% 7% 14% 9% 10% 9% 11% 6% 10% 10%
Fighting for better trade 117 81 36 34 22 38 22 87 16 10 - 59 23 33 22 44 51 18 68 12 47 70 25 74 17 78 36
deals 8% 12% 5% 9% 6% 10% 8% 9% 8% 6% - 13% 4% 8% 6% 7% 12% 3% 13% 11% 10% 8% 6% 10% 6% 12% 5%
Pushing through education 107 58 49 55 23 15 15 67 16 17 2 41 39 23 28 53 27 38 44 14 53 54 38 46 23 59 48
reform 8% 8% 7% 14% 7% 4% 5% 7% 8% 10% 9% 9% 8% 6% 7% 9% 6% 7% 8% 13% 11% 6% 10% 6% 9% 9% 7%
Pushing through criminal 99 46 53 36 27 21 16 56 14 24 2 35 36 27 26 45 28 40 40 8 32 67 33 52 14 53 46
justice reforms (policing, 7% 7% 7% 9% 8% 5% 5% 6% 7% 14% 9% 8% 7% 6% 7% 8% 7% 7% 8% 7% 7% 7% 8% 7% 5% 8% 7%
sentencing, and prisons)
Fighting the opioid crisis 97 37 60 36 17 31 13 78 9 6 1 39 25 32 22 41 34 24 40 13 20 76 24 53 19 49 45
7% 5% 8% 10% 5% 8% 4% 8% 4% 3% 3% 9% 5% 8% 6% 7% 8% 4% 7% 12% 4% 8% 6% 7% 7% 7% 6%
Protecting women from sexual 92 43 48 47 23 9 13 43 33 11 2 22 33 34 37 41 14 39 24 8 21 71 41 37 14 37 54
harassment and the Me Too 7% 6% 7% 12% 7% 2% 4% 5% 16% 6% 8% 5% 6% 8% 10% 7% 3% 7% 5% 7% 4% 8% 10% 5% 5% 5% 8%
movement
Protecting journalists 43 21 22 23 8 9 3 25 8 7 1 14 14 15 21 17 6 13 19 4 13 30 16 20 7 25 18
abroad 3% 3% 3% 6% 2% 2% 1% 3% 4% 4% 3% 3% 3% 4% 5% 3% 1% 2% 4% 4% 3% 3% 4% 3% 2% 4% 3%
Other 33 19 14 5 7 13 8 26 - 3 2 11 7 12 6 12 14 12 15 5 13 20 5 20 8 14 18
2% 3% 2% 1% 2% 3% 3% 3% - 2% 9% 2% 1% 3% 2% 2% 3% 2% 3% 5% 3% 2% 1% 3% 3% 2% 3%

Page 46
Fielding Period: November 27 - 28, 2018
HCAPS (Filtered on Registered Voters)
Weighted To The U.S. General Adult Population
30 Nov 2018
Table 39
CONGRESS1104_1 Which of the following issues would you like the new Congress to take up first in January 2019?
Please rank your top three issues. Next to the first-ranked issue, enter ''1'', next to the second-ranked issue, enter ''2''; next to the third-ranked issue, enter ''3.''
You may select up to three options.
Boosting the economy and jobs
Base: All Respondents
Presidential
Election Candidate
Gender Age Ethnicity Political Party Political Ideology Voted For Education Locale Income
_____________ ______________________ _______________________ ____________________ ____________________ _____________________ _____________ ________________ _________
Colle- Some
Cons- ge Gr- Colle- $75K Less
Hisp- Black Repub- Democ- Indep- Libe- Mode- erva- 3rd ad And ge Or Urb- Subu- Or Than
Total Male Female 18-34 35-49 50-64 65+ White anic /AA Other lican rat endent ral rate tive Clinton Trump Party Higher Less an rban Rural More $75K
______ _____ _______ _____ _____ _____ ____ _____ _____ _____ _____ ______ ______ ______ ______ ______ ______ ________ ______ _____ ______ ______ ____ _____ _____ ____ ____
Unweighted Base 1407 675 732 416 359 364 268 1049 104 173 25 437 526 382 437 549 421 537 505 113 543 864 388 719 300 548 846
Weighted Base 1407 687 720 383 345 382 297 938 208 169 26 450 521 408 385 593 429 547 532 108 481 926 395 742 270 679 704
Rank 1 124 58 66 39 44 28 12 79 14 21 5 36 34 50 15 71 38 38 52 11 30 94 36 61 27 45 79
9% 8% 9% 10% 13% 7% 4% 8% 7% 13% 18% 8% 7% 12% 4% 12% 9% 7% 10% 10% 6% 10% 9% 8% 10% 7% 11%
Rank 2 128 63 65 33 31 44 21 88 30 10 - 49 49 29 28 56 44 39 54 6 38 90 32 71 25 64 63
9% 9% 9% 9% 9% 11% 7% 9% 14% 6% - 11% 9% 7% 7% 10% 10% 7% 10% 6% 8% 10% 8% 10% 9% 9% 9%
Rank 3 124 66 59 45 30 29 21 86 16 18 * 50 37 36 26 49 49 44 51 8 45 80 40 62 22 60 60
9% 10% 8% 12% 9% 7% 7% 9% 8% 11% 1% 11% 7% 9% 7% 8% 12% 8% 10% 7% 9% 9% 10% 8% 8% 9% 8%
Unsure / Don't Know 43 17 26 13 16 10 4 25 9 5 - 13 18 9 13 19 11 12 13 2 5 38 16 17 10 6 34
3% 2% 4% 3% 5% 3% 1% 3% 4% 3% - 3% 3% 2% 4% 3% 3% 2% 2% 2% 1% 4% 4% 2% 4% 1% 5%
No Answer 987 483 504 253 224 271 239 661 139 115 21 302 382 284 302 398 287 415 361 81 363 624 272 530 186 504 468
70% 70% 70% 66% 65% 71% 80% 70% 67% 68% 81% 67% 73% 70% 78% 67% 67% 76% 68% 75% 75% 67% 69% 71% 69% 74% 67%
Sigma 1407 687 720 383 345 382 297 938 208 169 26 450 521 408 385 593 429 547 532 108 481 926 395 742 270 679 704
100% 100% 100% 100% 100% 100% 100% 100% 100% 100% 100% 100% 100% 100% 100% 100% 100% 100% 100% 100% 100% 100% 100% 100% 100% 100% 100%

Page 47
Fielding Period: November 27 - 28, 2018
HCAPS (Filtered on Registered Voters)
Weighted To The U.S. General Adult Population
30 Nov 2018
Table 40
CONGRESS1104_2 Which of the following issues would you like the new Congress to take up first in January 2019?
Please rank your top three issues. Next to the first-ranked issue, enter ''1'', next to the second-ranked issue, enter ''2''; next to the third-ranked issue, enter ''3.''
You may select up to three options.
Fighting for better trade deals
Base: All Respondents
Presidential
Election Candidate
Gender Age Ethnicity Political Party Political Ideology Voted For Education Locale Income
_____________ ______________________ _______________________ ____________________ ____________________ _____________________ _____________ ________________ _________
Colle- Some
Cons- ge Gr- Colle- $75K Less
Hisp- Black Repub- Democ- Indep- Libe- Mode- erva- 3rd ad And ge Or Urb- Subu- Or Than
Total Male Female 18-34 35-49 50-64 65+ White anic /AA Other lican rat endent ral rate tive Clinton Trump Party Higher Less an rban Rural More $75K
______ _____ _______ _____ _____ _____ ____ _____ _____ _____ _____ ______ ______ ______ ______ ______ ______ ________ ______ _____ ______ ______ ____ _____ _____ ____ ____
Unweighted Base 1407 675 732 416 359 364 268 1049 104 173 25 437 526 382 437 549 421 537 505 113 543 864 388 719 300 548 846
Weighted Base 1407 687 720 383 345 382 297 938 208 169 26 450 521 408 385 593 429 547 532 108 481 926 395 742 270 679 704
Rank 1 30 19 11 12 5 5 8 21 6 3 - 11 10 8 12 12 6 10 15 4 18 12 11 16 3 20 11
2% 3% 2% 3% 2% 1% 3% 2% 3% 2% - 3% 2% 2% 3% 2% 1% 2% 3% 4% 4% 1% 3% 2% 1% 3% 2%
Rank 2 37 29 8 8 11 11 6 24 6 3 - 23 4 8 1 14 21 2 26 4 16 21 4 24 9 26 11
3% 4% 1% 2% 3% 3% 2% 3% 3% 2% - 5% 1% 2% * 2% 5% * 5% 4% 3% 2% 1% 3% 3% 4% 2%
Rank 3 50 33 17 14 6 21 8 42 4 4 - 25 8 17 9 18 23 6 27 4 13 37 11 34 6 33 15
4% 5% 2% 4% 2% 6% 3% 4% 2% 2% - 6% 2% 4% 2% 3% 5% 1% 5% 4% 3% 4% 3% 5% 2% 5% 2%
Unsure / Don't Know 43 17 26 13 16 10 4 25 9 5 - 13 18 9 13 19 11 12 13 2 5 38 16 17 10 6 34
3% 2% 4% 3% 5% 3% 1% 3% 4% 3% - 3% 3% 2% 4% 3% 3% 2% 2% 2% 1% 4% 4% 2% 4% 1% 5%
No Answer 1247 589 658 335 307 334 271 827 183 154 26 378 480 366 350 530 367 518 450 94 429 818 354 650 243 595 635
89% 86% 91% 88% 89% 88% 91% 88% 88% 91% 100% 84% 92% 90% 91% 89% 86% 95% 85% 87% 89% 88% 90% 88% 90% 88% 90%
Sigma 1407 687 720 383 345 382 297 938 208 169 26 450 521 408 385 593 429 547 532 108 481 926 395 742 270 679 704
100% 100% 100% 100% 100% 100% 100% 100% 100% 100% 100% 100% 100% 100% 100% 100% 100% 100% 100% 100% 100% 100% 100% 100% 100% 100% 100%
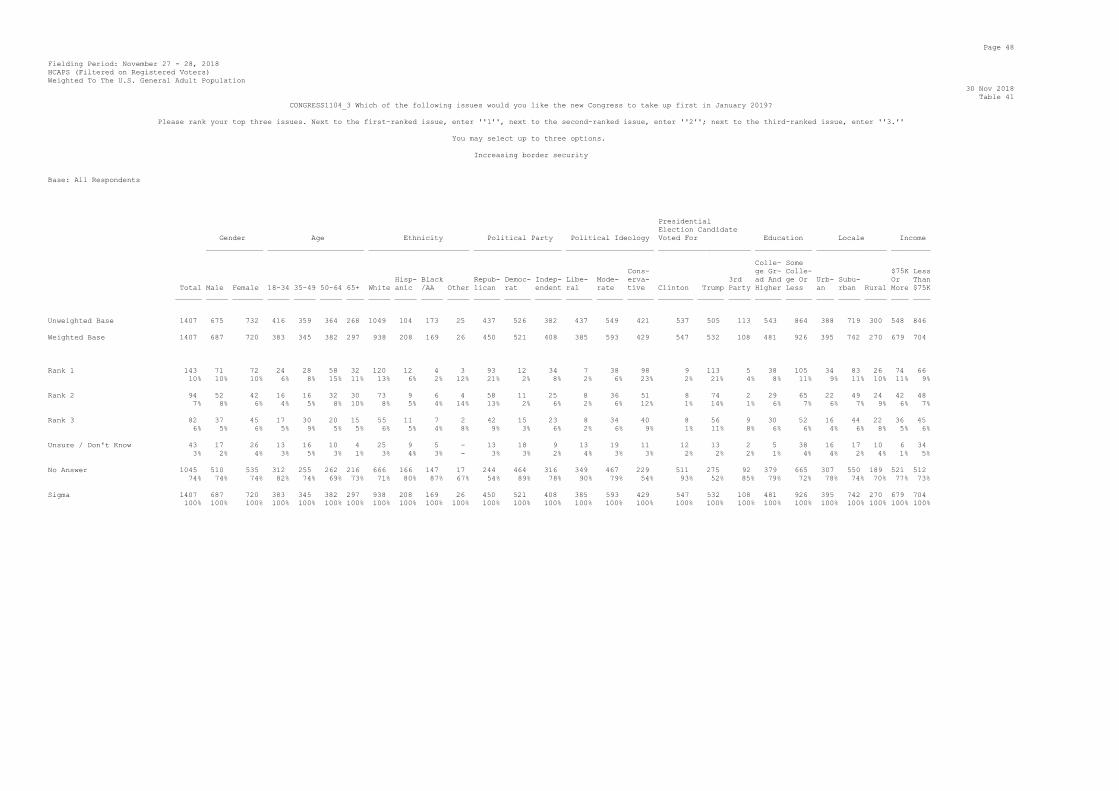
Page 48
Fielding Period: November 27 - 28, 2018
HCAPS (Filtered on Registered Voters)
Weighted To The U.S. General Adult Population
30 Nov 2018
Table 41
CONGRESS1104_3 Which of the following issues would you like the new Congress to take up first in January 2019?
Please rank your top three issues. Next to the first-ranked issue, enter ''1'', next to the second-ranked issue, enter ''2''; next to the third-ranked issue, enter ''3.''
You may select up to three options.
Increasing border security
Base: All Respondents
Presidential
Election Candidate
Gender Age Ethnicity Political Party Political Ideology Voted For Education Locale Income
_____________ ______________________ _______________________ ____________________ ____________________ _____________________ _____________ ________________ _________
Colle- Some
Cons- ge Gr- Colle- $75K Less
Hisp- Black Repub- Democ- Indep- Libe- Mode- erva- 3rd ad And ge Or Urb- Subu- Or Than
Total Male Female 18-34 35-49 50-64 65+ White anic /AA Other lican rat endent ral rate tive Clinton Trump Party Higher Less an rban Rural More $75K
______ _____ _______ _____ _____ _____ ____ _____ _____ _____ _____ ______ ______ ______ ______ ______ ______ ________ ______ _____ ______ ______ ____ _____ _____ ____ ____
Unweighted Base 1407 675 732 416 359 364 268 1049 104 173 25 437 526 382 437 549 421 537 505 113 543 864 388 719 300 548 846
Weighted Base 1407 687 720 383 345 382 297 938 208 169 26 450 521 408 385 593 429 547 532 108 481 926 395 742 270 679 704
Rank 1 143 71 72 24 28 58 32 120 12 4 3 93 12 34 7 38 98 9 113 5 38 105 34 83 26 74 66
10% 10% 10% 6% 8% 15% 11% 13% 6% 2% 12% 21% 2% 8% 2% 6% 23% 2% 21% 4% 8% 11% 9% 11% 10% 11% 9%
Rank 2 94 52 42 16 16 32 30 73 9 6 4 58 11 25 8 36 51 8 74 2 29 65 22 49 24 42 48
7% 8% 6% 4% 5% 8% 10% 8% 5% 4% 14% 13% 2% 6% 2% 6% 12% 1% 14% 1% 6% 7% 6% 7% 9% 6% 7%
Rank 3 82 37 45 17 30 20 15 55 11 7 2 42 15 23 8 34 40 8 56 9 30 52 16 44 22 36 45
6% 5% 6% 5% 9% 5% 5% 6% 5% 4% 8% 9% 3% 6% 2% 6% 9% 1% 11% 8% 6% 6% 4% 6% 8% 5% 6%
Unsure / Don't Know 43 17 26 13 16 10 4 25 9 5 - 13 18 9 13 19 11 12 13 2 5 38 16 17 10 6 34
3% 2% 4% 3% 5% 3% 1% 3% 4% 3% - 3% 3% 2% 4% 3% 3% 2% 2% 2% 1% 4% 4% 2% 4% 1% 5%
No Answer 1045 510 535 312 255 262 216 666 166 147 17 244 464 316 349 467 229 511 275 92 379 665 307 550 189 521 512
74% 74% 74% 82% 74% 69% 73% 71% 80% 87% 67% 54% 89% 78% 90% 79% 54% 93% 52% 85% 79% 72% 78% 74% 70% 77% 73%
Sigma 1407 687 720 383 345 382 297 938 208 169 26 450 521 408 385 593 429 547 532 108 481 926 395 742 270 679 704
100% 100% 100% 100% 100% 100% 100% 100% 100% 100% 100% 100% 100% 100% 100% 100% 100% 100% 100% 100% 100% 100% 100% 100% 100% 100% 100%

Page 49
Fielding Period: November 27 - 28, 2018
HCAPS (Filtered on Registered Voters)
Weighted To The U.S. General Adult Population
30 Nov 2018
Table 42
CONGRESS1104_4 Which of the following issues would you like the new Congress to take up first in January 2019?
Please rank your top three issues. Next to the first-ranked issue, enter ''1'', next to the second-ranked issue, enter ''2''; next to the third-ranked issue, enter ''3.''
You may select up to three options.
Pushing through immigration reform
Base: All Respondents
Presidential
Election Candidate
Gender Age Ethnicity Political Party Political Ideology Voted For Education Locale Income
_____________ ______________________ _______________________ ____________________ ____________________ _____________________ _____________ ________________ _________
Colle- Some
Cons- ge Gr- Colle- $75K Less
Hisp- Black Repub- Democ- Indep- Libe- Mode- erva- 3rd ad And ge Or Urb- Subu- Or Than
Total Male Female 18-34 35-49 50-64 65+ White anic /AA Other lican rat endent ral rate tive Clinton Trump Party Higher Less an rban Rural More $75K
______ _____ _______ _____ _____ _____ ____ _____ _____ _____ _____ ______ ______ ______ ______ ______ ______ ________ ______ _____ ______ ______ ____ _____ _____ ____ ____
Unweighted Base 1407 675 732 416 359 364 268 1049 104 173 25 437 526 382 437 549 421 537 505 113 543 864 388 719 300 548 846
Weighted Base 1407 687 720 383 345 382 297 938 208 169 26 450 521 408 385 593 429 547 532 108 481 926 395 742 270 679 704
Rank 1 77 48 29 9 22 20 25 61 3 5 4 38 14 23 9 26 42 13 55 2 36 41 7 49 21 38 33
5% 7% 4% 2% 6% 5% 9% 7% 2% 3% 16% 8% 3% 6% 2% 4% 10% 2% 10% 2% 7% 4% 2% 7% 8% 6% 5%
Rank 2 92 41 51 18 23 26 25 63 19 4 1 44 19 27 17 27 48 21 54 1 37 54 23 46 23 46 44
7% 6% 7% 5% 7% 7% 9% 7% 9% 2% 3% 10% 4% 7% 4% 5% 11% 4% 10% 1% 8% 6% 6% 6% 9% 7% 6%
Rank 3 75 42 33 21 16 16 21 50 8 14 - 26 24 24 13 32 29 30 36 2 28 47 23 40 12 41 34
5% 6% 5% 6% 5% 4% 7% 5% 4% 8% - 6% 5% 6% 3% 5% 7% 5% 7% 2% 6% 5% 6% 5% 4% 6% 5%
Unsure / Don't Know 43 17 26 13 16 10 4 25 9 5 - 13 18 9 13 19 11 12 13 2 5 38 16 17 10 6 34
3% 2% 4% 3% 5% 3% 1% 3% 4% 3% - 3% 3% 2% 4% 3% 3% 2% 2% 2% 1% 4% 4% 2% 4% 1% 5%
No Answer 1121 539 582 321 269 309 222 739 169 142 21 329 445 324 333 490 298 471 374 101 376 745 327 590 204 549 559
80% 79% 81% 84% 78% 81% 75% 79% 81% 84% 81% 73% 86% 79% 86% 83% 70% 86% 70% 93% 78% 80% 83% 80% 75% 81% 79%
Sigma 1407 687 720 383 345 382 297 938 208 169 26 450 521 408 385 593 429 547 532 108 481 926 395 742 270 679 704
100% 100% 100% 100% 100% 100% 100% 100% 100% 100% 100% 100% 100% 100% 100% 100% 100% 100% 100% 100% 100% 100% 100% 100% 100% 100% 100%

Page 50
Fielding Period: November 27 - 28, 2018
HCAPS (Filtered on Registered Voters)
Weighted To The U.S. General Adult Population
30 Nov 2018
Table 43
CONGRESS1104_5 Which of the following issues would you like the new Congress to take up first in January 2019?
Please rank your top three issues. Next to the first-ranked issue, enter ''1'', next to the second-ranked issue, enter ''2''; next to the third-ranked issue, enter ''3.''
You may select up to three options.
Pushing through healthcare reform
Base: All Respondents
Presidential
Election Candidate
Gender Age Ethnicity Political Party Political Ideology Voted For Education Locale Income
_____________ ______________________ _______________________ ____________________ ____________________ _____________________ _____________ ________________ _________
Colle- Some
Cons- ge Gr- Colle- $75K Less
Hisp- Black Repub- Democ- Indep- Libe- Mode- erva- 3rd ad And ge Or Urb- Subu- Or Than
Total Male Female 18-34 35-49 50-64 65+ White anic /AA Other lican rat endent ral rate tive Clinton Trump Party Higher Less an rban Rural More $75K
______ _____ _______ _____ _____ _____ ____ _____ _____ _____ _____ ______ ______ ______ ______ ______ ______ ________ ______ _____ ______ ______ ____ _____ _____ ____ ____
Unweighted Base 1407 675 732 416 359 364 268 1049 104 173 25 437 526 382 437 549 421 537 505 113 543 864 388 719 300 548 846
Weighted Base 1407 687 720 383 345 382 297 938 208 169 26 450 521 408 385 593 429 547 532 108 481 926 395 742 270 679 704
Rank 1 98 46 52 19 20 35 24 76 5 13 - 35 42 21 34 36 28 48 36 7 41 57 21 52 25 54 40
7% 7% 7% 5% 6% 9% 8% 8% 3% 8% - 8% 8% 5% 9% 6% 7% 9% 7% 6% 9% 6% 5% 7% 9% 8% 6%
Rank 2 105 50 55 22 21 34 28 76 14 7 2 37 24 41 17 51 37 32 41 11 41 64 35 58 12 45 59
7% 7% 8% 6% 6% 9% 9% 8% 7% 4% 9% 8% 5% 10% 4% 9% 9% 6% 8% 10% 8% 7% 9% 8% 4% 7% 8%
Rank 3 87 53 34 18 19 28 21 51 22 7 2 24 37 25 24 34 29 45 28 8 20 67 22 50 15 34 52
6% 8% 5% 5% 6% 7% 7% 5% 11% 4% 8% 5% 7% 6% 6% 6% 7% 8% 5% 7% 4% 7% 6% 7% 6% 5% 7%
Unsure / Don't Know 43 17 26 13 16 10 4 25 9 5 - 13 18 9 13 19 11 12 13 2 5 38 16 17 10 6 34
3% 2% 4% 3% 5% 3% 1% 3% 4% 3% - 3% 3% 2% 4% 3% 3% 2% 2% 2% 1% 4% 4% 2% 4% 1% 5%
No Answer 1074 521 553 310 269 275 220 711 157 138 21 340 400 312 297 454 324 411 413 81 374 700 302 565 208 541 520
76% 76% 77% 81% 78% 72% 74% 76% 75% 81% 83% 76% 77% 77% 77% 76% 76% 75% 78% 75% 78% 76% 76% 76% 77% 80% 74%
Sigma 1407 687 720 383 345 382 297 938 208 169 26 450 521 408 385 593 429 547 532 108 481 926 395 742 270 679 704
100% 100% 100% 100% 100% 100% 100% 100% 100% 100% 100% 100% 100% 100% 100% 100% 100% 100% 100% 100% 100% 100% 100% 100% 100% 100% 100%

Page 51
Fielding Period: November 27 - 28, 2018
HCAPS (Filtered on Registered Voters)
Weighted To The U.S. General Adult Population
30 Nov 2018
Table 44
CONGRESS1104_6 Which of the following issues would you like the new Congress to take up first in January 2019?
Please rank your top three issues. Next to the first-ranked issue, enter ''1'', next to the second-ranked issue, enter ''2''; next to the third-ranked issue, enter ''3.''
You may select up to three options.
Pushing through education reform
Base: All Respondents
Presidential
Election Candidate
Gender Age Ethnicity Political Party Political Ideology Voted For Education Locale Income
_____________ ______________________ _______________________ ____________________ ____________________ _____________________ _____________ ________________ _________
Colle- Some
Cons- ge Gr- Colle- $75K Less
Hisp- Black Repub- Democ- Indep- Libe- Mode- erva- 3rd ad And ge Or Urb- Subu- Or Than
Total Male Female 18-34 35-49 50-64 65+ White anic /AA Other lican rat endent ral rate tive Clinton Trump Party Higher Less an rban Rural More $75K
______ _____ _______ _____ _____ _____ ____ _____ _____ _____ _____ ______ ______ ______ ______ ______ ______ ________ ______ _____ ______ ______ ____ _____ _____ ____ ____
Unweighted Base 1407 675 732 416 359 364 268 1049 104 173 25 437 526 382 437 549 421 537 505 113 543 864 388 719 300 548 846
Weighted Base 1407 687 720 383 345 382 297 938 208 169 26 450 521 408 385 593 429 547 532 108 481 926 395 742 270 679 704
Rank 1 33 19 14 16 8 2 7 21 6 5 - 13 13 6 9 14 9 15 13 3 16 17 15 13 4 19 13
2% 3% 2% 4% 2% * 2% 2% 3% 3% - 3% 3% 1% 2% 2% 2% 3% 2% 3% 3% 2% 4% 2% 2% 3% 2%
Rank 2 33 21 12 24 6 3 - 20 3 7 - 13 12 7 7 19 7 12 11 5 16 17 10 15 8 20 12
2% 3% 2% 6% 2% 1% - 2% 1% 4% - 3% 2% 2% 2% 3% 2% 2% 2% 5% 3% 2% 2% 2% 3% 3% 2%
Rank 3 42 18 24 15 9 10 7 26 8 5 2 15 14 10 11 19 11 10 20 6 22 20 13 18 11 19 22
3% 3% 3% 4% 3% 3% 2% 3% 4% 3% 9% 3% 3% 3% 3% 3% 3% 2% 4% 5% 5% 2% 3% 2% 4% 3% 3%
Unsure / Don't Know 43 17 26 13 16 10 4 25 9 5 - 13 18 9 13 19 11 12 13 2 5 38 16 17 10 6 34
3% 2% 4% 3% 5% 3% 1% 3% 4% 3% - 3% 3% 2% 4% 3% 3% 2% 2% 2% 1% 4% 4% 2% 4% 1% 5%
No Answer 1257 612 644 315 307 356 279 846 183 148 24 395 463 376 344 522 391 498 475 93 423 834 342 678 237 614 623
89% 89% 89% 82% 89% 93% 94% 90% 88% 88% 91% 88% 89% 92% 89% 88% 91% 91% 89% 86% 88% 90% 86% 91% 88% 90% 88%
Sigma 1407 687 720 383 345 382 297 938 208 169 26 450 521 408 385 593 429 547 532 108 481 926 395 742 270 679 704
100% 100% 100% 100% 100% 100% 100% 100% 100% 100% 100% 100% 100% 100% 100% 100% 100% 100% 100% 100% 100% 100% 100% 100% 100% 100% 100%

Page 52
Fielding Period: November 27 - 28, 2018
HCAPS (Filtered on Registered Voters)
Weighted To The U.S. General Adult Population
30 Nov 2018
Table 45
CONGRESS1104_7 Which of the following issues would you like the new Congress to take up first in January 2019?
Please rank your top three issues. Next to the first-ranked issue, enter ''1'', next to the second-ranked issue, enter ''2''; next to the third-ranked issue, enter ''3.''
You may select up to three options.
Pushing through criminal justice reforms (policing, sentencing, and prisons)
Base: All Respondents
Presidential
Election Candidate
Gender Age Ethnicity Political Party Political Ideology Voted For Education Locale Income
_____________ ______________________ _______________________ ____________________ ____________________ _____________________ _____________ ________________ _________
Colle- Some
Cons- ge Gr- Colle- $75K Less
Hisp- Black Repub- Democ- Indep- Libe- Mode- erva- 3rd ad And ge Or Urb- Subu- Or Than
Total Male Female 18-34 35-49 50-64 65+ White anic /AA Other lican rat endent ral rate tive Clinton Trump Party Higher Less an rban Rural More $75K
______ _____ _______ _____ _____ _____ ____ _____ _____ _____ _____ ______ ______ ______ ______ ______ ______ ________ ______ _____ ______ ______ ____ _____ _____ ____ ____
Unweighted Base 1407 675 732 416 359 364 268 1049 104 173 25 437 526 382 437 549 421 537 505 113 543 864 388 719 300 548 846
Weighted Base 1407 687 720 383 345 382 297 938 208 169 26 450 521 408 385 593 429 547 532 108 481 926 395 742 270 679 704
Rank 1 26 10 16 14 6 4 1 10 8 5 1 7 12 6 8 12 7 13 8 2 6 20 8 14 4 15 11
2% 1% 2% 4% 2% 1% * 1% 4% 3% 4% 2% 2% 1% 2% 2% 2% 2% 1% 2% 1% 2% 2% 2% 1% 2% 2%
Rank 2 37 17 20 9 12 7 9 25 - 11 * 13 13 11 8 17 12 18 14 2 10 27 11 22 4 23 14
3% 2% 3% 2% 4% 2% 3% 3% - 7% 2% 3% 2% 3% 2% 3% 3% 3% 3% 2% 2% 3% 3% 3% 2% 3% 2%
Rank 3 37 19 18 13 9 10 5 21 6 8 1 15 11 10 10 17 9 9 18 4 16 21 15 16 6 16 21
3% 3% 2% 3% 3% 3% 2% 2% 3% 5% 3% 3% 2% 2% 3% 3% 2% 2% 3% 3% 3% 2% 4% 2% 2% 2% 3%
Unsure / Don't Know 43 17 26 13 16 10 4 25 9 5 - 13 18 9 13 19 11 12 13 2 5 38 16 17 10 6 34
3% 2% 4% 3% 5% 3% 1% 3% 4% 3% - 3% 3% 2% 4% 3% 3% 2% 2% 2% 1% 4% 4% 2% 4% 1% 5%
No Answer 1265 624 641 334 302 351 278 857 185 140 24 402 467 372 346 529 390 496 478 99 444 820 346 672 246 620 625
90% 91% 89% 87% 88% 92% 93% 91% 89% 83% 91% 89% 90% 91% 90% 89% 91% 91% 90% 91% 92% 89% 88% 91% 91% 91% 89%
Sigma 1407 687 720 383 345 382 297 938 208 169 26 450 521 408 385 593 429 547 532 108 481 926 395 742 270 679 704
100% 100% 100% 100% 100% 100% 100% 100% 100% 100% 100% 100% 100% 100% 100% 100% 100% 100% 100% 100% 100% 100% 100% 100% 100% 100% 100%

Page 53
Fielding Period: November 27 - 28, 2018
HCAPS (Filtered on Registered Voters)
Weighted To The U.S. General Adult Population
30 Nov 2018
Table 46
CONGRESS1104_8 Which of the following issues would you like the new Congress to take up first in January 2019?
Please rank your top three issues. Next to the first-ranked issue, enter ''1'', next to the second-ranked issue, enter ''2''; next to the third-ranked issue, enter ''3.''
You may select up to three options.
Fighting the national debt and federal budget deficits
Base: All Respondents
Presidential
Election Candidate
Gender Age Ethnicity Political Party Political Ideology Voted For Education Locale Income
_____________ ______________________ _______________________ ____________________ ____________________ _____________________ _____________ ________________ _________
Colle- Some
Cons- ge Gr- Colle- $75K Less
Hisp- Black Repub- Democ- Indep- Libe- Mode- erva- 3rd ad And ge Or Urb- Subu- Or Than
Total Male Female 18-34 35-49 50-64 65+ White anic /AA Other lican rat endent ral rate tive Clinton Trump Party Higher Less an rban Rural More $75K
______ _____ _______ _____ _____ _____ ____ _____ _____ _____ _____ ______ ______ ______ ______ ______ ______ ________ ______ _____ ______ ______ ____ _____ _____ ____ ____
Unweighted Base 1407 675 732 416 359 364 268 1049 104 173 25 437 526 382 437 549 421 537 505 113 543 864 388 719 300 548 846
Weighted Base 1407 687 720 383 345 382 297 938 208 169 26 450 521 408 385 593 429 547 532 108 481 926 395 742 270 679 704
Rank 1 78 43 35 11 20 28 20 62 6 5 2 25 21 28 15 30 34 25 27 18 34 45 14 47 17 46 32
6% 6% 5% 3% 6% 7% 7% 7% 3% 3% 7% 6% 4% 7% 4% 5% 8% 5% 5% 16% 7% 5% 4% 6% 6% 7% 5%
Rank 2 94 52 42 20 22 20 32 72 9 8 3 36 25 31 10 34 50 27 43 12 28 67 25 50 19 46 44
7% 8% 6% 5% 6% 5% 11% 8% 4% 5% 11% 8% 5% 8% 3% 6% 12% 5% 8% 11% 6% 7% 6% 7% 7% 7% 6%
Rank 3 134 69 65 27 28 41 39 85 20 20 3 44 39 47 17 67 50 36 68 12 47 87 36 70 28 75 58
10% 10% 9% 7% 8% 11% 13% 9% 10% 12% 10% 10% 7% 12% 4% 11% 12% 7% 13% 11% 10% 9% 9% 9% 10% 11% 8%
Unsure / Don't Know 43 17 26 13 16 10 4 25 9 5 - 13 18 9 13 19 11 12 13 2 5 38 16 17 10 6 34
3% 2% 4% 3% 5% 3% 1% 3% 4% 3% - 3% 3% 2% 4% 3% 3% 2% 2% 2% 1% 4% 4% 2% 4% 1% 5%
No Answer 1057 506 551 312 259 283 203 694 164 131 19 331 417 293 331 443 283 448 380 65 368 689 304 557 195 506 536
75% 74% 76% 81% 75% 74% 68% 74% 79% 78% 72% 74% 80% 72% 86% 75% 66% 82% 72% 60% 76% 74% 77% 75% 72% 74% 76%
Sigma 1407 687 720 383 345 382 297 938 208 169 26 450 521 408 385 593 429 547 532 108 481 926 395 742 270 679 704
100% 100% 100% 100% 100% 100% 100% 100% 100% 100% 100% 100% 100% 100% 100% 100% 100% 100% 100% 100% 100% 100% 100% 100% 100% 100% 100%

Page 54
Fielding Period: November 27 - 28, 2018
HCAPS (Filtered on Registered Voters)
Weighted To The U.S. General Adult Population
30 Nov 2018
Table 47
CONGRESS1104_9 Which of the following issues would you like the new Congress to take up first in January 2019?
Please rank your top three issues. Next to the first-ranked issue, enter ''1'', next to the second-ranked issue, enter ''2''; next to the third-ranked issue, enter ''3.''
You may select up to three options.
Fighting income inequality
Base: All Respondents
Presidential
Election Candidate
Gender Age Ethnicity Political Party Political Ideology Voted For Education Locale Income
_____________ ______________________ _______________________ ____________________ ____________________ _____________________ _____________ ________________ _________
Colle- Some
Cons- ge Gr- Colle- $75K Less
Hisp- Black Repub- Democ- Indep- Libe- Mode- erva- 3rd ad And ge Or Urb- Subu- Or Than
Total Male Female 18-34 35-49 50-64 65+ White anic /AA Other lican rat endent ral rate tive Clinton Trump Party Higher Less an rban Rural More $75K
______ _____ _______ _____ _____ _____ ____ _____ _____ _____ _____ ______ ______ ______ ______ ______ ______ ________ ______ _____ ______ ______ ____ _____ _____ ____ ____
Unweighted Base 1407 675 732 416 359 364 268 1049 104 173 25 437 526 382 437 549 421 537 505 113 543 864 388 719 300 548 846
Weighted Base 1407 687 720 383 345 382 297 938 208 169 26 450 521 408 385 593 429 547 532 108 481 926 395 742 270 679 704
Rank 1 31 15 17 14 11 6 1 18 4 6 1 3 18 9 11 19 1 12 9 4 10 22 10 14 7 13 19
2% 2% 2% 4% 3% 2% * 2% 2% 4% 4% 1% 3% 2% 3% 3% * 2% 2% 3% 2% 2% 3% 2% 3% 2% 3%
Rank 2 46 20 26 13 18 11 4 24 5 13 3 4 18 22 13 28 4 21 11 4 15 30 8 32 5 25 20
3% 3% 4% 3% 5% 3% 1% 3% 2% 8% 11% 1% 3% 5% 3% 5% 1% 4% 2% 4% 3% 3% 2% 4% 2% 4% 3%
Rank 3 57 31 27 26 17 8 7 33 8 11 - 13 27 16 21 26 10 28 20 7 17 40 19 34 4 27 31
4% 4% 4% 7% 5% 2% 2% 4% 4% 6% - 3% 5% 4% 6% 4% 2% 5% 4% 7% 4% 4% 5% 5% 2% 4% 4%
Unsure / Don't Know 43 17 26 13 16 10 4 25 9 5 - 13 18 9 13 19 11 12 13 2 5 38 16 17 10 6 34
3% 2% 4% 3% 5% 3% 1% 3% 4% 3% - 3% 3% 2% 4% 3% 3% 2% 2% 2% 1% 4% 4% 2% 4% 1% 5%
No Answer 1229 605 624 316 284 346 283 838 182 135 22 417 441 352 326 501 402 475 479 92 434 795 342 644 243 608 601
87% 88% 87% 83% 82% 91% 95% 89% 87% 80% 84% 93% 85% 86% 85% 84% 94% 87% 90% 85% 90% 86% 87% 87% 90% 90% 85%
Sigma 1407 687 720 383 345 382 297 938 208 169 26 450 521 408 385 593 429 547 532 108 481 926 395 742 270 679 704
100% 100% 100% 100% 100% 100% 100% 100% 100% 100% 100% 100% 100% 100% 100% 100% 100% 100% 100% 100% 100% 100% 100% 100% 100% 100% 100%

Page 55
Fielding Period: November 27 - 28, 2018
HCAPS (Filtered on Registered Voters)
Weighted To The U.S. General Adult Population
30 Nov 2018
Table 48
CONGRESS1104_10 Which of the following issues would you like the new Congress to take up first in January 2019?
Please rank your top three issues. Next to the first-ranked issue, enter ''1'', next to the second-ranked issue, enter ''2''; next to the third-ranked issue, enter ''3.''
You may select up to three options.
Fighting climate change
Base: All Respondents
Presidential
Election Candidate
Gender Age Ethnicity Political Party Political Ideology Voted For Education Locale Income
_____________ ______________________ _______________________ ____________________ ____________________ _____________________ _____________ ________________ _________
Colle- Some
Cons- ge Gr- Colle- $75K Less
Hisp- Black Repub- Democ- Indep- Libe- Mode- erva- 3rd ad And ge Or Urb- Subu- Or Than
Total Male Female 18-34 35-49 50-64 65+ White anic /AA Other lican rat endent ral rate tive Clinton Trump Party Higher Less an rban Rural More $75K
______ _____ _______ _____ _____ _____ ____ _____ _____ _____ _____ ______ ______ ______ ______ ______ ______ ________ ______ _____ ______ ______ ____ _____ _____ ____ ____
Unweighted Base 1407 675 732 416 359 364 268 1049 104 173 25 437 526 382 437 549 421 537 505 113 543 864 388 719 300 548 846
Weighted Base 1407 687 720 383 345 382 297 938 208 169 26 450 521 408 385 593 429 547 532 108 481 926 395 742 270 679 704
Rank 1 63 30 32 26 14 13 10 35 18 4 2 4 34 23 31 31 * 40 6 7 19 44 22 29 12 26 37
4% 4% 4% 7% 4% 3% 3% 4% 8% 2% 7% 1% 7% 6% 8% 5% * 7% 1% 6% 4% 5% 6% 4% 5% 4% 5%
Rank 2 91 46 45 35 19 23 15 60 19 2 3 14 49 28 43 38 10 61 17 4 33 58 20 52 20 48 40
6% 7% 6% 9% 5% 6% 5% 6% 9% 1% 13% 3% 9% 7% 11% 6% 2% 11% 3% 3% 7% 6% 5% 7% 7% 7% 6%
Rank 3 64 29 35 17 11 19 17 43 11 7 1 3 44 16 35 21 8 39 10 1 30 34 16 35 13 40 23
5% 4% 5% 5% 3% 5% 6% 5% 5% 4% 5% 1% 8% 4% 9% 4% 2% 7% 2% 1% 6% 4% 4% 5% 5% 6% 3%
Unsure / Don't Know 43 17 26 13 16 10 4 25 9 5 - 13 18 9 13 19 11 12 13 2 5 38 16 17 10 6 34
3% 2% 4% 3% 5% 3% 1% 3% 4% 3% - 3% 3% 2% 4% 3% 3% 2% 2% 2% 1% 4% 4% 2% 4% 1% 5%
No Answer 1146 564 581 292 286 316 252 775 151 152 19 415 375 332 263 483 399 396 485 95 394 752 322 609 214 559 570
81% 82% 81% 76% 83% 83% 85% 83% 73% 90% 75% 92% 72% 81% 68% 81% 93% 72% 91% 88% 82% 81% 82% 82% 79% 82% 81%
Sigma 1407 687 720 383 345 382 297 938 208 169 26 450 521 408 385 593 429 547 532 108 481 926 395 742 270 679 704
100% 100% 100% 100% 100% 100% 100% 100% 100% 100% 100% 100% 100% 100% 100% 100% 100% 100% 100% 100% 100% 100% 100% 100% 100% 100% 100%

Page 56
Fielding Period: November 27 - 28, 2018
HCAPS (Filtered on Registered Voters)
Weighted To The U.S. General Adult Population
30 Nov 2018
Table 49
CONGRESS1104_11 Which of the following issues would you like the new Congress to take up first in January 2019?
Please rank your top three issues. Next to the first-ranked issue, enter ''1'', next to the second-ranked issue, enter ''2''; next to the third-ranked issue, enter ''3.''
You may select up to three options.
Fighting the opioid crisis
Base: All Respondents
Presidential
Election Candidate
Gender Age Ethnicity Political Party Political Ideology Voted For Education Locale Income
_____________ ______________________ _______________________ ____________________ ____________________ _____________________ _____________ ________________ _________
Colle- Some
Cons- ge Gr- Colle- $75K Less
Hisp- Black Repub- Democ- Indep- Libe- Mode- erva- 3rd ad And ge Or Urb- Subu- Or Than
Total Male Female 18-34 35-49 50-64 65+ White anic /AA Other lican rat endent ral rate tive Clinton Trump Party Higher Less an rban Rural More $75K
______ _____ _______ _____ _____ _____ ____ _____ _____ _____ _____ ______ ______ ______ ______ ______ ______ ________ ______ _____ ______ ______ ____ _____ _____ ____ ____
Unweighted Base 1407 675 732 416 359 364 268 1049 104 173 25 437 526 382 437 549 421 537 505 113 543 864 388 719 300 548 846
Weighted Base 1407 687 720 383 345 382 297 938 208 169 26 450 521 408 385 593 429 547 532 108 481 926 395 742 270 679 704
Rank 1 26 8 18 11 5 6 4 22 2 1 - 8 7 11 7 12 7 7 9 2 2 24 8 13 4 11 15
2% 1% 2% 3% 1% 2% 1% 2% 1% * - 2% 1% 3% 2% 2% 2% 1% 2% 2% * 3% 2% 2% 2% 2% 2%
Rank 2 39 12 27 12 6 17 3 29 6 2 - 18 6 14 6 15 18 5 19 10 8 31 7 23 8 22 14
3% 2% 4% 3% 2% 5% 1% 3% 3% 1% - 4% 1% 3% 1% 2% 4% 1% 4% 9% 2% 3% 2% 3% 3% 3% 2%
Rank 3 32 17 15 13 6 7 6 26 2 2 1 13 11 7 9 14 9 12 11 2 11 22 9 16 7 16 16
2% 2% 2% 3% 2% 2% 2% 3% 1% 1% 3% 3% 2% 2% 2% 2% 2% 2% 2% 2% 2% 2% 2% 2% 3% 2% 2%
Unsure / Don't Know 43 17 26 13 16 10 4 25 9 5 - 13 18 9 13 19 11 12 13 2 5 38 16 17 10 6 34
3% 2% 4% 3% 5% 3% 1% 3% 4% 3% - 3% 3% 2% 4% 3% 3% 2% 2% 2% 1% 4% 4% 2% 4% 1% 5%
No Answer 1267 633 634 333 312 341 281 836 190 159 25 398 478 367 350 534 383 512 479 93 456 811 355 671 240 624 625
90% 92% 88% 87% 90% 89% 94% 89% 91% 94% 97% 88% 92% 90% 91% 90% 89% 93% 90% 86% 95% 88% 90% 91% 89% 92% 89%
Sigma 1407 687 720 383 345 382 297 938 208 169 26 450 521 408 385 593 429 547 532 108 481 926 395 742 270 679 704
100% 100% 100% 100% 100% 100% 100% 100% 100% 100% 100% 100% 100% 100% 100% 100% 100% 100% 100% 100% 100% 100% 100% 100% 100% 100% 100%

Page 57
Fielding Period: November 27 - 28, 2018
HCAPS (Filtered on Registered Voters)
Weighted To The U.S. General Adult Population
30 Nov 2018
Table 50
CONGRESS1104_12 Which of the following issues would you like the new Congress to take up first in January 2019?
Please rank your top three issues. Next to the first-ranked issue, enter ''1'', next to the second-ranked issue, enter ''2''; next to the third-ranked issue, enter ''3.''
You may select up to three options.
Enhancing school security
Base: All Respondents
Presidential
Election Candidate
Gender Age Ethnicity Political Party Political Ideology Voted For Education Locale Income
_____________ ______________________ _______________________ ____________________ ____________________ _____________________ _____________ ________________ _________
Colle- Some
Cons- ge Gr- Colle- $75K Less
Hisp- Black Repub- Democ- Indep- Libe- Mode- erva- 3rd ad And ge Or Urb- Subu- Or Than
Total Male Female 18-34 35-49 50-64 65+ White anic /AA Other lican rat endent ral rate tive Clinton Trump Party Higher Less an rban Rural More $75K
______ _____ _______ _____ _____ _____ ____ _____ _____ _____ _____ ______ ______ ______ ______ ______ ______ ________ ______ _____ ______ ______ ____ _____ _____ ____ ____
Unweighted Base 1407 675 732 416 359 364 268 1049 104 173 25 437 526 382 437 549 421 537 505 113 543 864 388 719 300 548 846
Weighted Base 1407 687 720 383 345 382 297 938 208 169 26 450 521 408 385 593 429 547 532 108 481 926 395 742 270 679 704
Rank 1 59 22 37 20 25 8 6 36 9 9 1 21 14 22 8 32 19 14 21 8 16 43 17 27 14 19 39
4% 3% 5% 5% 7% 2% 2% 4% 5% 5% 3% 5% 3% 5% 2% 5% 4% 3% 4% 7% 3% 5% 4% 4% 5% 3% 5%
Rank 2 41 13 28 15 8 10 8 22 8 7 - 17 16 7 11 18 12 10 17 2 16 26 18 11 12 13 28
3% 2% 4% 4% 2% 3% 3% 2% 4% 4% - 4% 3% 2% 3% 3% 3% 2% 3% 2% 3% 3% 4% 2% 5% 2% 4%
Rank 3 43 18 25 13 13 7 10 21 6 12 * 17 19 6 11 20 12 22 11 1 10 33 11 22 10 15 28
3% 3% 3% 3% 4% 2% 3% 2% 3% 7% 2% 4% 4% 1% 3% 3% 3% 4% 2% 1% 2% 4% 3% 3% 4% 2% 4%
Unsure / Don't Know 43 17 26 13 16 10 4 25 9 5 - 13 18 9 13 19 11 12 13 2 5 38 16 17 10 6 34
3% 2% 4% 3% 5% 3% 1% 3% 4% 3% - 3% 3% 2% 4% 3% 3% 2% 2% 2% 1% 4% 4% 2% 4% 1% 5%
No Answer 1220 616 604 322 283 346 269 835 175 136 25 381 453 365 341 505 374 489 470 96 434 786 333 664 223 626 575
87% 90% 84% 84% 82% 91% 91% 89% 84% 81% 95% 85% 87% 89% 89% 85% 87% 89% 88% 89% 90% 85% 84% 89% 83% 92% 82%
Sigma 1407 687 720 383 345 382 297 938 208 169 26 450 521 408 385 593 429 547 532 108 481 926 395 742 270 679 704
100% 100% 100% 100% 100% 100% 100% 100% 100% 100% 100% 100% 100% 100% 100% 100% 100% 100% 100% 100% 100% 100% 100% 100% 100% 100% 100%

Page 58
Fielding Period: November 27 - 28, 2018
HCAPS (Filtered on Registered Voters)
Weighted To The U.S. General Adult Population
30 Nov 2018
Table 51
CONGRESS1104_13 Which of the following issues would you like the new Congress to take up first in January 2019?
Please rank your top three issues. Next to the first-ranked issue, enter ''1'', next to the second-ranked issue, enter ''2''; next to the third-ranked issue, enter ''3.''
You may select up to three options.
Enhancing national security (terrorism, cybersecurity, etc.)
Base: All Respondents
Presidential
Election Candidate
Gender Age Ethnicity Political Party Political Ideology Voted For Education Locale Income
_____________ ______________________ _______________________ ____________________ ____________________ _____________________ _____________ ________________ _________
Colle- Some
Cons- ge Gr- Colle- $75K Less
Hisp- Black Repub- Democ- Indep- Libe- Mode- erva- 3rd ad And ge Or Urb- Subu- Or Than
Total Male Female 18-34 35-49 50-64 65+ White anic /AA Other lican rat endent ral rate tive Clinton Trump Party Higher Less an rban Rural More $75K
______ _____ _______ _____ _____ _____ ____ _____ _____ _____ _____ ______ ______ ______ ______ ______ ______ ________ ______ _____ ______ ______ ____ _____ _____ ____ ____
Unweighted Base 1407 675 732 416 359 364 268 1049 104 173 25 437 526 382 437 549 421 537 505 113 543 864 388 719 300 548 846
Weighted Base 1407 687 720 383 345 382 297 938 208 169 26 450 521 408 385 593 429 547 532 108 481 926 395 742 270 679 704
Rank 1 72 35 37 19 13 19 21 58 3 7 2 29 15 27 13 25 35 14 43 5 26 45 17 38 17 34 38
5% 5% 5% 5% 4% 5% 7% 6% 1% 4% 7% 6% 3% 7% 3% 4% 8% 3% 8% 5% 5% 5% 4% 5% 6% 5% 5%
Rank 2 84 43 41 17 26 23 18 62 17 2 1 32 21 29 9 37 38 22 41 9 26 58 27 41 16 35 48
6% 6% 6% 4% 8% 6% 6% 7% 8% 1% 4% 7% 4% 7% 2% 6% 9% 4% 8% 8% 5% 6% 7% 6% 6% 5% 7%
Rank 3 85 34 52 14 30 20 22 71 5 6 - 47 19 17 11 27 48 19 45 9 30 55 17 44 24 43 40
6% 5% 7% 4% 9% 5% 7% 8% 2% 3% - 11% 4% 4% 3% 5% 11% 3% 9% 8% 6% 6% 4% 6% 9% 6% 6%
Unsure / Don't Know 43 17 26 13 16 10 4 25 9 5 - 13 18 9 13 19 11 12 13 2 5 38 16 17 10 6 34
3% 2% 4% 3% 5% 3% 1% 3% 4% 3% - 3% 3% 2% 4% 3% 3% 2% 2% 2% 1% 4% 4% 2% 4% 1% 5%
No Answer 1122 558 564 320 261 309 233 723 175 149 23 329 447 325 339 486 297 480 389 84 394 729 318 602 203 562 544
80% 81% 78% 84% 75% 81% 78% 77% 84% 88% 89% 73% 86% 80% 88% 82% 69% 88% 73% 77% 82% 79% 80% 81% 75% 83% 77%
Sigma 1407 687 720 383 345 382 297 938 208 169 26 450 521 408 385 593 429 547 532 108 481 926 395 742 270 679 704
100% 100% 100% 100% 100% 100% 100% 100% 100% 100% 100% 100% 100% 100% 100% 100% 100% 100% 100% 100% 100% 100% 100% 100% 100% 100% 100%

Page 59
Fielding Period: November 27 - 28, 2018
HCAPS (Filtered on Registered Voters)
Weighted To The U.S. General Adult Population
30 Nov 2018
Table 52
CONGRESS1104_14 Which of the following issues would you like the new Congress to take up first in January 2019?
Please rank your top three issues. Next to the first-ranked issue, enter ''1'', next to the second-ranked issue, enter ''2''; next to the third-ranked issue, enter ''3.''
You may select up to three options.
Protecting against gun violence
Base: All Respondents
Presidential
Election Candidate
Gender Age Ethnicity Political Party Political Ideology Voted For Education Locale Income
_____________ ______________________ _______________________ ____________________ ____________________ _____________________ _____________ ________________ _________
Colle- Some
Cons- ge Gr- Colle- $75K Less
Hisp- Black Repub- Democ- Indep- Libe- Mode- erva- 3rd ad And ge Or Urb- Subu- Or Than
Total Male Female 18-34 35-49 50-64 65+ White anic /AA Other lican rat endent ral rate tive Clinton Trump Party Higher Less an rban Rural More $75K
______ _____ _______ _____ _____ _____ ____ _____ _____ _____ _____ ______ ______ ______ ______ ______ ______ ________ ______ _____ ______ ______ ____ _____ _____ ____ ____
Unweighted Base 1407 675 732 416 359 364 268 1049 104 173 25 437 526 382 437 549 421 537 505 113 543 864 388 719 300 548 846
Weighted Base 1407 687 720 383 345 382 297 938 208 169 26 450 521 408 385 593 429 547 532 108 481 926 395 742 270 679 704
Rank 1 102 47 55 40 23 16 24 58 23 20 1 22 56 24 32 53 17 59 23 5 35 67 31 57 14 53 49
7% 7% 8% 10% 7% 4% 8% 6% 11% 12% 4% 5% 11% 6% 8% 9% 4% 11% 4% 4% 7% 7% 8% 8% 5% 8% 7%
Rank 2 102 46 56 27 27 24 24 62 11 23 1 12 59 29 35 53 14 63 19 8 36 66 32 53 17 50 51
7% 7% 8% 7% 8% 6% 8% 7% 5% 14% 3% 3% 11% 7% 9% 9% 3% 11% 4% 7% 7% 7% 8% 7% 6% 7% 7%
Rank 3 85 30 55 17 22 23 23 58 9 10 4 17 41 25 26 41 18 46 22 4 31 55 21 57 7 43 43
6% 4% 8% 4% 7% 6% 8% 6% 4% 6% 14% 4% 8% 6% 7% 7% 4% 8% 4% 3% 6% 6% 5% 8% 3% 6% 6%
Unsure / Don't Know 43 17 26 13 16 10 4 25 9 5 - 13 18 9 13 19 11 12 13 2 5 38 16 17 10 6 34
3% 2% 4% 3% 5% 3% 1% 3% 4% 3% - 3% 3% 2% 4% 3% 3% 2% 2% 2% 1% 4% 4% 2% 4% 1% 5%
No Answer 1075 547 528 285 257 309 223 736 156 111 20 386 347 321 279 427 368 368 454 90 374 701 296 557 222 527 528
76% 80% 73% 75% 74% 81% 75% 78% 75% 66% 79% 86% 67% 79% 73% 72% 86% 67% 85% 83% 78% 76% 75% 75% 82% 78% 75%
Sigma 1407 687 720 383 345 382 297 938 208 169 26 450 521 408 385 593 429 547 532 108 481 926 395 742 270 679 704
100% 100% 100% 100% 100% 100% 100% 100% 100% 100% 100% 100% 100% 100% 100% 100% 100% 100% 100% 100% 100% 100% 100% 100% 100% 100% 100%

Page 60
Fielding Period: November 27 - 28, 2018
HCAPS (Filtered on Registered Voters)
Weighted To The U.S. General Adult Population
30 Nov 2018
Table 53
CONGRESS1104_15 Which of the following issues would you like the new Congress to take up first in January 2019?
Please rank your top three issues. Next to the first-ranked issue, enter ''1'', next to the second-ranked issue, enter ''2''; next to the third-ranked issue, enter ''3.''
You may select up to three options.
Protecting the environment
Base: All Respondents
Presidential
Election Candidate
Gender Age Ethnicity Political Party Political Ideology Voted For Education Locale Income
_____________ ______________________ _______________________ ____________________ ____________________ _____________________ _____________ ________________ _________
Colle- Some
Cons- ge Gr- Colle- $75K Less
Hisp- Black Repub- Democ- Indep- Libe- Mode- erva- 3rd ad And ge Or Urb- Subu- Or Than
Total Male Female 18-34 35-49 50-64 65+ White anic /AA Other lican rat endent ral rate tive Clinton Trump Party Higher Less an rban Rural More $75K
______ _____ _______ _____ _____ _____ ____ _____ _____ _____ _____ ______ ______ ______ ______ ______ ______ ________ ______ _____ ______ ______ ____ _____ _____ ____ ____
Unweighted Base 1407 675 732 416 359 364 268 1049 104 173 25 437 526 382 437 549 421 537 505 113 543 864 388 719 300 548 846
Weighted Base 1407 687 720 383 345 382 297 938 208 169 26 450 521 408 385 593 429 547 532 108 481 926 395 742 270 679 704
Rank 1 63 31 32 27 19 8 9 41 12 6 - 14 22 25 26 29 8 35 16 3 24 40 21 37 5 29 34
4% 4% 4% 7% 6% 2% 3% 4% 6% 4% - 3% 4% 6% 7% 5% 2% 6% 3% 3% 5% 4% 5% 5% 2% 4% 5%
Rank 2 64 31 33 20 21 13 9 43 11 4 - 20 25 17 23 30 11 30 18 5 23 40 17 33 13 31 33
5% 4% 5% 5% 6% 3% 3% 5% 5% 3% - 4% 5% 4% 6% 5% 2% 5% 3% 4% 5% 4% 4% 4% 5% 4% 5%
Rank 3 79 31 48 35 9 23 12 53 11 6 5 18 30 29 30 30 19 33 19 7 31 48 22 39 18 40 37
6% 4% 7% 9% 3% 6% 4% 6% 5% 3% 18% 4% 6% 7% 8% 5% 5% 6% 4% 7% 6% 5% 6% 5% 7% 6% 5%
Unsure / Don't Know 43 17 26 13 16 10 4 25 9 5 - 13 18 9 13 19 11 12 13 2 5 38 16 17 10 6 34
3% 2% 4% 3% 5% 3% 1% 3% 4% 3% - 3% 3% 2% 4% 3% 3% 2% 2% 2% 1% 4% 4% 2% 4% 1% 5%
No Answer 1158 578 580 287 280 328 263 776 166 148 21 385 425 328 293 486 380 438 465 92 398 760 320 615 223 574 567
82% 84% 81% 75% 81% 86% 88% 83% 80% 88% 82% 86% 82% 80% 76% 82% 89% 80% 88% 85% 83% 82% 81% 83% 83% 84% 81%
Sigma 1407 687 720 383 345 382 297 938 208 169 26 450 521 408 385 593 429 547 532 108 481 926 395 742 270 679 704
100% 100% 100% 100% 100% 100% 100% 100% 100% 100% 100% 100% 100% 100% 100% 100% 100% 100% 100% 100% 100% 100% 100% 100% 100% 100% 100%

Page 61
Fielding Period: November 27 - 28, 2018
HCAPS (Filtered on Registered Voters)
Weighted To The U.S. General Adult Population
30 Nov 2018
Table 54
CONGRESS1104_16 Which of the following issues would you like the new Congress to take up first in January 2019?
Please rank your top three issues. Next to the first-ranked issue, enter ''1'', next to the second-ranked issue, enter ''2''; next to the third-ranked issue, enter ''3.''
You may select up to three options.
Protecting the Affordable Care Act (also known as Obamacare)
Base: All Respondents
Presidential
Election Candidate
Gender Age Ethnicity Political Party Political Ideology Voted For Education Locale Income
_____________ ______________________ _______________________ ____________________ ____________________ _____________________ _____________ ________________ _________
Colle- Some
Cons- ge Gr- Colle- $75K Less
Hisp- Black Repub- Democ- Indep- Libe- Mode- erva- 3rd ad And ge Or Urb- Subu- Or Than
Total Male Female 18-34 35-49 50-64 65+ White anic /AA Other lican rat endent ral rate tive Clinton Trump Party Higher Less an rban Rural More $75K
______ _____ _______ _____ _____ _____ ____ _____ _____ _____ _____ ______ ______ ______ ______ ______ ______ ________ ______ _____ ______ ______ ____ _____ _____ ____ ____
Unweighted Base 1407 675 732 416 359 364 268 1049 104 173 25 437 526 382 437 549 421 537 505 113 543 864 388 719 300 548 846
Weighted Base 1407 687 720 383 345 382 297 938 208 169 26 450 521 408 385 593 429 547 532 108 481 926 395 742 270 679 704
Rank 1 93 40 52 16 24 30 22 46 20 20 * 13 61 19 41 40 11 66 11 1 40 52 29 49 15 52 40
7% 6% 7% 4% 7% 8% 7% 5% 10% 12% 1% 3% 12% 5% 11% 7% 3% 12% 2% 1% 8% 6% 7% 7% 5% 8% 6%
Rank 2 61 30 32 14 13 25 10 38 6 15 1 8 41 11 37 18 7 40 10 6 23 39 16 31 14 31 30
4% 4% 4% 4% 4% 7% 3% 4% 3% 9% 4% 2% 8% 3% 10% 3% 2% 7% 2% 5% 5% 4% 4% 4% 5% 5% 4%
Rank 3 71 38 33 15 18 26 12 46 17 6 1 8 46 16 36 27 8 57 6 3 25 46 30 34 7 37 34
5% 5% 5% 4% 5% 7% 4% 5% 8% 4% 3% 2% 9% 4% 9% 5% 2% 10% 1% 3% 5% 5% 8% 5% 2% 5% 5%
Unsure / Don't Know 43 17 26 13 16 10 4 25 9 5 - 13 18 9 13 19 11 12 13 2 5 38 16 17 10 6 34
3% 2% 4% 3% 5% 3% 1% 3% 4% 3% - 3% 3% 2% 4% 3% 3% 2% 2% 2% 1% 4% 4% 2% 4% 1% 5%
No Answer 1139 562 576 324 275 291 249 783 157 123 24 407 355 354 258 489 392 372 492 97 388 750 304 611 225 552 567
81% 82% 80% 85% 80% 76% 84% 83% 75% 73% 92% 90% 68% 87% 67% 82% 91% 68% 93% 90% 81% 81% 77% 82% 83% 81% 80%
Sigma 1407 687 720 383 345 382 297 938 208 169 26 450 521 408 385 593 429 547 532 108 481 926 395 742 270 679 704
100% 100% 100% 100% 100% 100% 100% 100% 100% 100% 100% 100% 100% 100% 100% 100% 100% 100% 100% 100% 100% 100% 100% 100% 100% 100% 100%

Page 62
Fielding Period: November 27 - 28, 2018
HCAPS (Filtered on Registered Voters)
Weighted To The U.S. General Adult Population
30 Nov 2018
Table 55
CONGRESS1104_17 Which of the following issues would you like the new Congress to take up first in January 2019?
Please rank your top three issues. Next to the first-ranked issue, enter ''1'', next to the second-ranked issue, enter ''2''; next to the third-ranked issue, enter ''3.''
You may select up to three options.
Protecting healthcare coverage for pre-existing conditions
Base: All Respondents
Presidential
Election Candidate
Gender Age Ethnicity Political Party Political Ideology Voted For Education Locale Income
_____________ ______________________ _______________________ ____________________ ____________________ _____________________ _____________ ________________ _________
Colle- Some
Cons- ge Gr- Colle- $75K Less
Hisp- Black Repub- Democ- Indep- Libe- Mode- erva- 3rd ad And ge Or Urb- Subu- Or Than
Total Male Female 18-34 35-49 50-64 65+ White anic /AA Other lican rat endent ral rate tive Clinton Trump Party Higher Less an rban Rural More $75K
______ _____ _______ _____ _____ _____ ____ _____ _____ _____ _____ ______ ______ ______ ______ ______ ______ ________ ______ _____ ______ ______ ____ _____ _____ ____ ____
Unweighted Base 1407 675 732 416 359 364 268 1049 104 173 25 437 526 382 437 549 421 537 505 113 543 864 388 719 300 548 846
Weighted Base 1407 687 720 383 345 382 297 938 208 169 26 450 521 408 385 593 429 547 532 108 481 926 395 742 270 679 704
Rank 1 115 52 63 14 18 43 41 72 23 13 3 31 57 26 36 49 30 53 28 7 37 78 34 56 25 48 64
8% 8% 9% 4% 5% 11% 14% 8% 11% 8% 11% 7% 11% 6% 9% 8% 7% 10% 5% 7% 8% 8% 9% 8% 9% 7% 9%
Rank 2 100 45 55 24 21 26 27 62 10 22 3 20 55 23 40 37 23 55 24 10 35 65 29 59 12 44 56
7% 7% 8% 6% 6% 7% 9% 7% 5% 13% 11% 5% 11% 6% 10% 6% 5% 10% 5% 9% 7% 7% 7% 8% 4% 6% 8%
Rank 3 88 39 49 10 19 35 25 69 3 14 * 34 33 21 17 39 32 29 37 12 24 64 20 49 19 39 45
6% 6% 7% 3% 5% 9% 8% 7% 2% 8% 1% 7% 6% 5% 4% 7% 7% 5% 7% 11% 5% 7% 5% 7% 7% 6% 6%
Unsure / Don't Know 43 17 26 13 16 10 4 25 9 5 - 13 18 9 13 19 11 12 13 2 5 38 16 17 10 6 34
3% 2% 4% 3% 5% 3% 1% 3% 4% 3% - 3% 3% 2% 4% 3% 3% 2% 2% 2% 1% 4% 4% 2% 4% 1% 5%
No Answer 1061 534 527 322 271 267 201 710 162 116 20 352 358 329 279 449 333 398 429 78 380 681 296 561 204 542 506
75% 78% 73% 84% 79% 70% 67% 76% 78% 68% 77% 78% 69% 81% 72% 76% 78% 73% 81% 72% 79% 74% 75% 76% 75% 80% 72%
Sigma 1407 687 720 383 345 382 297 938 208 169 26 450 521 408 385 593 429 547 532 108 481 926 395 742 270 679 704
100% 100% 100% 100% 100% 100% 100% 100% 100% 100% 100% 100% 100% 100% 100% 100% 100% 100% 100% 100% 100% 100% 100% 100% 100% 100% 100%

Page 63
Fielding Period: November 27 - 28, 2018
HCAPS (Filtered on Registered Voters)
Weighted To The U.S. General Adult Population
30 Nov 2018
Table 56
CONGRESS1104_18 Which of the following issues would you like the new Congress to take up first in January 2019?
Please rank your top three issues. Next to the first-ranked issue, enter ''1'', next to the second-ranked issue, enter ''2''; next to the third-ranked issue, enter ''3.''
You may select up to three options.
Protecting journalists abroad
Base: All Respondents
Presidential
Election Candidate
Gender Age Ethnicity Political Party Political Ideology Voted For Education Locale Income
_____________ ______________________ _______________________ ____________________ ____________________ _____________________ _____________ ________________ _________
Colle- Some
Cons- ge Gr- Colle- $75K Less
Hisp- Black Repub- Democ- Indep- Libe- Mode- erva- 3rd ad And ge Or Urb- Subu- Or Than
Total Male Female 18-34 35-49 50-64 65+ White anic /AA Other lican rat endent ral rate tive Clinton Trump Party Higher Less an rban Rural More $75K
______ _____ _______ _____ _____ _____ ____ _____ _____ _____ _____ ______ ______ ______ ______ ______ ______ ________ ______ _____ ______ ______ ____ _____ _____ ____ ____
Unweighted Base 1407 675 732 416 359 364 268 1049 104 173 25 437 526 382 437 549 421 537 505 113 543 864 388 719 300 548 846
Weighted Base 1407 687 720 383 345 382 297 938 208 169 26 450 521 408 385 593 429 547 532 108 481 926 395 742 270 679 704
Rank 1 13 7 7 5 2 6 - 10 2 2 - 10 2 1 4 4 5 * 8 2 3 10 2 9 2 9 4
1% 1% 1% 1% * 2% - 1% 1% 1% - 2% * * 1% 1% 1% * 2% 1% 1% 1% 1% 1% 1% 1% 1%
Rank 2 16 8 7 15 1 * - 8 4 3 1 2 7 6 6 9 - 8 5 - 3 12 8 6 2 8 8
1% 1% 1% 4% * * - 1% 2% 2% 3% * 1% 2% 2% 2% - 1% 1% - 1% 1% 2% 1% 1% 1% 1%
Rank 3 15 6 9 4 6 3 3 7 2 2 - 2 5 7 10 4 * 4 5 2 7 8 6 5 3 9 6
1% 1% 1% 1% 2% 1% 1% 1% 1% 1% - * 1% 2% 3% 1% * 1% 1% 2% 1% 1% 2% 1% 1% 1% 1%
Unsure / Don't Know 43 17 26 13 16 10 4 25 9 5 - 13 18 9 13 19 11 12 13 2 5 38 16 17 10 6 34
3% 2% 4% 3% 5% 3% 1% 3% 4% 3% - 3% 3% 2% 4% 3% 3% 2% 2% 2% 1% 4% 4% 2% 4% 1% 5%
No Answer 1320 649 672 346 321 362 291 889 191 157 25 423 488 384 351 557 412 523 499 102 463 857 363 704 253 648 653
94% 94% 93% 90% 93% 95% 98% 95% 92% 93% 97% 94% 94% 94% 91% 94% 96% 96% 94% 95% 96% 93% 92% 95% 94% 95% 93%
Sigma 1407 687 720 383 345 382 297 938 208 169 26 450 521 408 385 593 429 547 532 108 481 926 395 742 270 679 704
100% 100% 100% 100% 100% 100% 100% 100% 100% 100% 100% 100% 100% 100% 100% 100% 100% 100% 100% 100% 100% 100% 100% 100% 100% 100% 100%

Page 64
Fielding Period: November 27 - 28, 2018
HCAPS (Filtered on Registered Voters)
Weighted To The U.S. General Adult Population
30 Nov 2018
Table 57
CONGRESS1104_19 Which of the following issues would you like the new Congress to take up first in January 2019?
Please rank your top three issues. Next to the first-ranked issue, enter ''1'', next to the second-ranked issue, enter ''2''; next to the third-ranked issue, enter ''3.''
You may select up to three options.
Protecting women from sexual harassment and the Me Too movement
Base: All Respondents
Presidential
Election Candidate
Gender Age Ethnicity Political Party Political Ideology Voted For Education Locale Income
_____________ ______________________ _______________________ ____________________ ____________________ _____________________ _____________ ________________ _________
Colle- Some
Cons- ge Gr- Colle- $75K Less
Hisp- Black Repub- Democ- Indep- Libe- Mode- erva- 3rd ad And ge Or Urb- Subu- Or Than
Total Male Female 18-34 35-49 50-64 65+ White anic /AA Other lican rat endent ral rate tive Clinton Trump Party Higher Less an rban Rural More $75K
______ _____ _______ _____ _____ _____ ____ _____ _____ _____ _____ ______ ______ ______ ______ ______ ______ ________ ______ _____ ______ ______ ____ _____ _____ ____ ____
Unweighted Base 1407 675 732 416 359 364 268 1049 104 173 25 437 526 382 437 549 421 537 505 113 543 864 388 719 300 548 846
Weighted Base 1407 687 720 383 345 382 297 938 208 169 26 450 521 408 385 593 429 547 532 108 481 926 395 742 270 679 704
Rank 1 26 12 14 16 6 3 - 7 15 2 - 11 8 7 10 11 5 7 11 - 3 23 6 16 3 13 13
2% 2% 2% 4% 2% 1% - 1% 7% 1% - 2% 2% 2% 3% 2% 1% 1% 2% - 1% 2% 2% 2% 1% 2% 2%
Rank 2 37 16 21 18 8 3 9 23 5 6 1 5 15 16 18 17 3 19 7 4 11 27 21 10 6 15 22
3% 2% 3% 5% 2% 1% 3% 2% 2% 4% 4% 1% 3% 4% 5% 3% 1% 3% 1% 4% 2% 3% 5% 1% 2% 2% 3%
Rank 3 29 16 13 13 8 3 4 13 13 2 1 7 9 12 9 13 6 13 6 4 7 21 14 11 4 9 19
2% 2% 2% 3% 2% 1% 1% 1% 6% 1% 4% 1% 2% 3% 2% 2% 1% 2% 1% 3% 2% 2% 3% 1% 1% 1% 3%
Unsure / Don't Know 43 17 26 13 16 10 4 25 9 5 - 13 18 9 13 19 11 12 13 2 5 38 16 17 10 6 34
3% 2% 4% 3% 5% 3% 1% 3% 4% 3% - 3% 3% 2% 4% 3% 3% 2% 2% 2% 1% 4% 4% 2% 4% 1% 5%
No Answer 1272 627 645 322 307 363 280 870 166 154 24 414 470 365 335 533 403 496 494 99 455 817 338 687 246 636 616
90% 91% 90% 84% 89% 95% 94% 93% 80% 91% 92% 92% 90% 89% 87% 90% 94% 91% 93% 91% 95% 88% 86% 93% 91% 94% 88%
Sigma 1407 687 720 383 345 382 297 938 208 169 26 450 521 408 385 593 429 547 532 108 481 926 395 742 270 679 704
100% 100% 100% 100% 100% 100% 100% 100% 100% 100% 100% 100% 100% 100% 100% 100% 100% 100% 100% 100% 100% 100% 100% 100% 100% 100% 100%

Page 65
Fielding Period: November 27 - 28, 2018
HCAPS (Filtered on Registered Voters)
Weighted To The U.S. General Adult Population
30 Nov 2018
Table 58
CONGRESS1104_20 Which of the following issues would you like the new Congress to take up first in January 2019?
Please rank your top three issues. Next to the first-ranked issue, enter ''1'', next to the second-ranked issue, enter ''2''; next to the third-ranked issue, enter ''3.''
You may select up to three options.
Protecting the Special Counsel's Russia investigation
Base: All Respondents
Presidential
Election Candidate
Gender Age Ethnicity Political Party Political Ideology Voted For Education Locale Income
_____________ ______________________ _______________________ ____________________ ____________________ _____________________ _____________ ________________ _________
Colle- Some
Cons- ge Gr- Colle- $75K Less
Hisp- Black Repub- Democ- Indep- Libe- Mode- erva- 3rd ad And ge Or Urb- Subu- Or Than
Total Male Female 18-34 35-49 50-64 65+ White anic /AA Other lican rat endent ral rate tive Clinton Trump Party Higher Less an rban Rural More $75K
______ _____ _______ _____ _____ _____ ____ _____ _____ _____ _____ ______ ______ ______ ______ ______ ______ ________ ______ _____ ______ ______ ____ _____ _____ ____ ____
Unweighted Base 1407 675 732 416 359 364 268 1049 104 173 25 437 526 382 437 549 421 537 505 113 543 864 388 719 300 548 846
Weighted Base 1407 687 720 383 345 382 297 938 208 169 26 450 521 408 385 593 429 547 532 108 481 926 395 742 270 679 704
Rank 1 69 43 27 13 9 27 19 47 8 9 1 4 42 23 37 23 9 49 5 10 32 37 30 31 9 46 21
5% 6% 4% 4% 3% 7% 6% 5% 4% 6% 3% 1% 8% 6% 10% 4% 2% 9% 1% 9% 7% 4% 7% 4% 3% 7% 3%
Rank 2 48 28 20 5 16 16 12 30 5 6 2 8 30 10 28 15 5 35 8 2 27 21 13 28 7 31 15
3% 4% 3% 1% 4% 4% 4% 3% 3% 3% 10% 2% 6% 2% 7% 3% 1% 6% 1% 2% 6% 2% 3% 4% 3% 5% 2%
Rank 3 47 22 25 16 11 7 13 28 15 2 1 5 29 13 26 21 * 34 5 * 20 28 14 24 10 19 29
3% 3% 4% 4% 3% 2% 4% 3% 7% 1% 4% 1% 5% 3% 7% 4% * 6% 1% * 4% 3% 4% 3% 4% 3% 4%
Unsure / Don't Know 43 17 26 13 16 10 4 25 9 5 - 13 18 9 13 19 11 12 13 2 5 38 16 17 10 6 34
3% 2% 4% 3% 5% 3% 1% 3% 4% 3% - 3% 3% 2% 4% 3% 3% 2% 2% 2% 1% 4% 4% 2% 4% 1% 5%
No Answer 1199 577 622 335 293 322 249 809 170 147 22 420 402 353 282 514 403 418 500 95 397 802 323 642 234 577 606
85% 84% 86% 88% 85% 84% 84% 86% 82% 87% 84% 93% 77% 87% 73% 87% 94% 76% 94% 87% 83% 87% 82% 87% 87% 85% 86%
Sigma 1407 687 720 383 345 382 297 938 208 169 26 450 521 408 385 593 429 547 532 108 481 926 395 742 270 679 704
100% 100% 100% 100% 100% 100% 100% 100% 100% 100% 100% 100% 100% 100% 100% 100% 100% 100% 100% 100% 100% 100% 100% 100% 100% 100% 100%

Page 66
Fielding Period: November 27 - 28, 2018
HCAPS (Filtered on Registered Voters)
Weighted To The U.S. General Adult Population
30 Nov 2018
Table 59
CONGRESS1104_98 Which of the following issues would you like the new Congress to take up first in January 2019?
Please rank your top three issues. Next to the first-ranked issue, enter ''1'', next to the second-ranked issue, enter ''2''; next to the third-ranked issue, enter ''3.''
You may select up to three options.
Other
Base: All Respondents
Presidential
Election Candidate
Gender Age Ethnicity Political Party Political Ideology Voted For Education Locale Income
_____________ ______________________ _______________________ ____________________ ____________________ _____________________ _____________ ________________ _________
Colle- Some
Cons- ge Gr- Colle- $75K Less
Hisp- Black Repub- Democ- Indep- Libe- Mode- erva- 3rd ad And ge Or Urb- Subu- Or Than
Total Male Female 18-34 35-49 50-64 65+ White anic /AA Other lican rat endent ral rate tive Clinton Trump Party Higher Less an rban Rural More $75K
______ _____ _______ _____ _____ _____ ____ _____ _____ _____ _____ ______ ______ ______ ______ ______ ______ ________ ______ _____ ______ ______ ____ _____ _____ ____ ____
Unweighted Base 1407 675 732 416 359 364 268 1049 104 173 25 437 526 382 437 549 421 537 505 113 543 864 388 719 300 548 846
Weighted Base 1407 687 720 383 345 382 297 938 208 169 26 450 521 408 385 593 429 547 532 108 481 926 395 742 270 679 704
Rank 1 19 12 7 2 7 5 5 14 - 2 * 7 4 7 4 7 8 7 9 2 7 11 4 11 4 8 10
1% 2% 1% 1% 2% 1% 2% 2% - 1% 2% 2% 1% 2% 1% 1% 2% 1% 2% 2% 2% 1% 1% 2% 1% 1% 1%
Rank 2 7 4 3 1 1 3 3 7 - 1 - 2 2 3 2 2 4 3 3 1 4 4 * 5 2 4 4
1% 1% * * * 1% 1% 1% - * - 1% * 1% * * 1% 1% 1% 1% 1% * * 1% 1% 1% 1%
Rank 3 7 3 4 2 - 4 1 5 - - 2 2 1 2 1 3 3 2 3 2 2 5 * 4 2 3 4
* * 1% * - 1% * 1% - - 7% * * 1% * * 1% * 1% 2% * 1% * 1% 1% * 1%
Unsure / Don't Know 43 17 26 13 16 10 4 25 9 5 - 13 18 9 13 19 11 12 13 2 5 38 16 17 10 6 34
3% 2% 4% 3% 5% 3% 1% 3% 4% 3% - 3% 3% 2% 4% 3% 3% 2% 2% 2% 1% 4% 4% 2% 4% 1% 5%
No Answer 1331 651 680 365 322 359 285 888 199 161 24 426 496 387 366 562 403 524 503 101 463 867 375 704 252 659 653
95% 95% 94% 95% 93% 94% 96% 95% 96% 96% 91% 95% 95% 95% 95% 95% 94% 96% 95% 94% 96% 94% 95% 95% 93% 97% 93%
Sigma 1407 687 720 383 345 382 297 938 208 169 26 450 521 408 385 593 429 547 532 108 481 926 395 742 270 679 704
100% 100% 100% 100% 100% 100% 100% 100% 100% 100% 100% 100% 100% 100% 100% 100% 100% 100% 100% 100% 100% 100% 100% 100% 100% 100% 100%

Page 67
Fielding Period: November 27 - 28, 2018
HCAPS (Filtered on Registered Voters)
Weighted To The U.S. General Adult Population
30 Nov 2018
Table 60
IMM1101 Would you favor or oppose the new Congress reaching a deal that gives undocumented immigrants brought here by their parents work permits and a path to citizenship in exchange for
increasing merit preference over preference for relatives, eliminating the diversity visa lottery, and funding barrier security on the U.S.-Mexico border?
Base: All Respondents
Presidential
Election Candidate
Gender Age Ethnicity Political Party Political Ideology Voted For Education Locale Income
_____________ ______________________ _______________________ ____________________ ____________________ _____________________ _____________ ________________ _________
Colle- Some
Cons- ge Gr- Colle- $75K Less
Hisp- Black Repub- Democ- Indep- Libe- Mode- erva- 3rd ad And ge Or Urb- Subu- Or Than
Total Male Female 18-34 35-49 50-64 65+ White anic /AA Other lican rat endent ral rate tive Clinton Trump Party Higher Less an rban Rural More $75K
______ _____ _______ _____ _____ _____ ____ _____ _____ _____ _____ ______ ______ ______ ______ ______ ______ ________ ______ _____ ______ ______ ____ _____ _____ ____ ____
Unweighted Base 1407 675 732 416 359 364 268 1049 104 173 25 437 526 382 437 549 421 537 505 113 543 864 388 719 300 548 846
Weighted Base 1407 687 720 383 345 382 297 938 208 169 26 450 521 408 385 593 429 547 532 108 481 926 395 742 270 679 704
Favor 887 450 436 262 201 222 201 589 147 101 13 281 358 234 279 356 252 385 301 64 317 570 252 476 158 448 432
63% 66% 61% 68% 58% 58% 68% 63% 71% 60% 49% 63% 69% 57% 72% 60% 59% 70% 57% 59% 66% 62% 64% 64% 59% 66% 61%
Oppose 520 236 284 121 144 159 96 350 61 68 13 169 163 174 106 237 177 162 231 44 165 356 143 266 112 232 272
37% 34% 39% 32% 42% 42% 32% 37% 29% 40% 51% 37% 31% 43% 28% 40% 41% 30% 43% 41% 34% 38% 36% 36% 41% 34% 39%
Sigma 1407 687 720 383 345 382 297 938 208 169 26 450 521 408 385 593 429 547 532 108 481 926 395 742 270 679 704
100% 100% 100% 100% 100% 100% 100% 100% 100% 100% 100% 100% 100% 100% 100% 100% 100% 100% 100% 100% 100% 100% 100% 100% 100% 100% 100%

Page 68
Fielding Period: November 27 - 28, 2018
HCAPS (Filtered on Registered Voters)
Weighted To The U.S. General Adult Population
30 Nov 2018
Table 61
TRADE1101 Should the new Congress support or oppose the President's tariffs and trade policies if they are aimed at reducing U.S. trade deficits, protecting American intellectual property, and
keeping jobs at home?
Base: All Respondents
Presidential
Election Candidate
Gender Age Ethnicity Political Party Political Ideology Voted For Education Locale Income
_____________ ______________________ _______________________ ____________________ ____________________ _____________________ _____________ ________________ _________
Colle- Some
Cons- ge Gr- Colle- $75K Less
Hisp- Black Repub- Democ- Indep- Libe- Mode- erva- 3rd ad And ge Or Urb- Subu- Or Than
Total Male Female 18-34 35-49 50-64 65+ White anic /AA Other lican rat endent ral rate tive Clinton Trump Party Higher Less an rban Rural More $75K
______ _____ _______ _____ _____ _____ ____ _____ _____ _____ _____ ______ ______ ______ ______ ______ ______ ________ ______ _____ ______ ______ ____ _____ _____ ____ ____
Unweighted Base 1407 675 732 416 359 364 268 1049 104 173 25 437 526 382 437 549 421 537 505 113 543 864 388 719 300 548 846
Weighted Base 1407 687 720 383 345 382 297 938 208 169 26 450 521 408 385 593 429 547 532 108 481 926 395 742 270 679 704
Support 908 433 475 254 233 230 191 648 122 91 16 383 229 284 157 384 368 224 485 64 292 616 248 474 187 428 465
65% 63% 66% 66% 67% 60% 64% 69% 59% 54% 63% 85% 44% 70% 41% 65% 86% 41% 91% 59% 61% 67% 63% 64% 69% 63% 66%
Oppose 499 254 245 129 113 151 106 291 86 77 10 67 291 124 229 209 61 323 46 44 189 310 147 268 83 252 240
35% 37% 34% 34% 33% 40% 36% 31% 41% 46% 37% 15% 56% 30% 59% 35% 14% 59% 9% 41% 39% 33% 37% 36% 31% 37% 34%
Sigma 1407 687 720 383 345 382 297 938 208 169 26 450 521 408 385 593 429 547 532 108 481 926 395 742 270 679 704
100% 100% 100% 100% 100% 100% 100% 100% 100% 100% 100% 100% 100% 100% 100% 100% 100% 100% 100% 100% 100% 100% 100% 100% 100% 100% 100%

Page 69
Fielding Period: November 27 - 28, 2018
HCAPS (Filtered on Registered Voters)
Weighted To The U.S. General Adult Population
30 Nov 2018
Table 62
TRADE1102 Should the new Congress support or oppose the President's tariffs and trade policies if they are aimed at reducing U.S. trade deficits and keeping jobs at home but lead to higher
consumer prices and take time to come about?
Base: All Respondents
Presidential
Election Candidate
Gender Age Ethnicity Political Party Political Ideology Voted For Education Locale Income
_____________ ______________________ _______________________ ____________________ ____________________ _____________________ _____________ ________________ _________
Colle- Some
Cons- ge Gr- Colle- $75K Less
Hisp- Black Repub- Democ- Indep- Libe- Mode- erva- 3rd ad And ge Or Urb- Subu- Or Than
Total Male Female 18-34 35-49 50-64 65+ White anic /AA Other lican rat endent ral rate tive Clinton Trump Party Higher Less an rban Rural More $75K
______ _____ _______ _____ _____ _____ ____ _____ _____ _____ _____ ______ ______ ______ ______ ______ ______ ________ ______ _____ ______ ______ ____ _____ _____ ____ ____
Unweighted Base 1407 675 732 416 359 364 268 1049 104 173 25 437 526 382 437 549 421 537 505 113 543 864 388 719 300 548 846
Weighted Base 1407 687 720 383 345 382 297 938 208 169 26 450 521 408 385 593 429 547 532 108 481 926 395 742 270 679 704
Support 749 374 375 208 197 197 147 549 101 66 8 363 150 224 112 312 324 148 439 52 225 524 211 393 144 365 367
53% 54% 52% 54% 57% 52% 50% 59% 49% 39% 32% 81% 29% 55% 29% 53% 76% 27% 83% 48% 47% 57% 53% 53% 53% 54% 52%
Oppose 658 313 345 175 149 185 150 389 107 103 17 87 370 184 274 281 104 399 92 56 256 402 184 349 126 314 337
47% 46% 48% 46% 43% 48% 50% 41% 51% 61% 68% 19% 71% 45% 71% 47% 24% 73% 17% 52% 53% 43% 47% 47% 47% 46% 48%
Sigma 1407 687 720 383 345 382 297 938 208 169 26 450 521 408 385 593 429 547 532 108 481 926 395 742 270 679 704
100% 100% 100% 100% 100% 100% 100% 100% 100% 100% 100% 100% 100% 100% 100% 100% 100% 100% 100% 100% 100% 100% 100% 100% 100% 100% 100%

Page 70
Fielding Period: November 27 - 28, 2018
HCAPS (Filtered on Registered Voters)
Weighted To The U.S. General Adult Population
30 Nov 2018
Table 63
SPEND1101 Should the new Congress take steps to rein in government spending and control the federal deficit even if it results in slower economic growth?
Base: All Respondents
Presidential
Election Candidate
Gender Age Ethnicity Political Party Political Ideology Voted For Education Locale Income
_____________ ______________________ _______________________ ____________________ ____________________ _____________________ _____________ ________________ _________
Colle- Some
Cons- ge Gr- Colle- $75K Less
Hisp- Black Repub- Democ- Indep- Libe- Mode- erva- 3rd ad And ge Or Urb- Subu- Or Than
Total Male Female 18-34 35-49 50-64 65+ White anic /AA Other lican rat endent ral rate tive Clinton Trump Party Higher Less an rban Rural More $75K
______ _____ _______ _____ _____ _____ ____ _____ _____ _____ _____ ______ ______ ______ ______ ______ ______ ________ ______ _____ ______ ______ ____ _____ _____ ____ ____
Unweighted Base 1407 675 732 416 359 364 268 1049 104 173 25 437 526 382 437 549 421 537 505 113 543 864 388 719 300 548 846
Weighted Base 1407 687 720 383 345 382 297 938 208 169 26 450 521 408 385 593 429 547 532 108 481 926 395 742 270 679 704
Yes 1026 522 504 265 237 286 238 724 126 114 19 337 365 308 295 406 326 425 394 83 404 623 279 540 207 531 478
73% 76% 70% 69% 69% 75% 80% 77% 60% 68% 73% 75% 70% 76% 76% 68% 76% 78% 74% 77% 84% 67% 71% 73% 77% 78% 68%
No 381 164 217 118 108 96 59 215 82 54 7 113 156 100 91 187 103 122 138 25 78 303 116 202 63 148 227
27% 24% 30% 31% 31% 25% 20% 23% 40% 32% 27% 25% 30% 24% 24% 32% 24% 22% 26% 23% 16% 33% 29% 27% 23% 22% 32%
Sigma 1407 687 720 383 345 382 297 938 208 169 26 450 521 408 385 593 429 547 532 108 481 926 395 742 270 679 704
100% 100% 100% 100% 100% 100% 100% 100% 100% 100% 100% 100% 100% 100% 100% 100% 100% 100% 100% 100% 100% 100% 100% 100% 100% 100% 100%

Page 71
Fielding Period: November 27 - 28, 2018
HCAPS (Filtered on Registered Voters)
Weighted To The U.S. General Adult Population
30 Nov 2018
Table 64
GUNS1101 Should the new Congress pass legislation to raise the minimum age for purchasing guns from 18 to 21 years old?
Base: All Respondents
Presidential
Election Candidate
Gender Age Ethnicity Political Party Political Ideology Voted For Education Locale Income
_____________ ______________________ _______________________ ____________________ ____________________ _____________________ _____________ ________________ _________
Colle- Some
Cons- ge Gr- Colle- $75K Less
Hisp- Black Repub- Democ- Indep- Libe- Mode- erva- 3rd ad And ge Or Urb- Subu- Or Than
Total Male Female 18-34 35-49 50-64 65+ White anic /AA Other lican rat endent ral rate tive Clinton Trump Party Higher Less an rban Rural More $75K
______ _____ _______ _____ _____ _____ ____ _____ _____ _____ _____ ______ ______ ______ ______ ______ ______ ________ ______ _____ ______ ______ ____ _____ _____ ____ ____
Unweighted Base 1407 675 732 416 359 364 268 1049 104 173 25 437 526 382 437 549 421 537 505 113 543 864 388 719 300 548 846
Weighted Base 1407 687 720 383 345 382 297 938 208 169 26 450 521 408 385 593 429 547 532 108 481 926 395 742 270 679 704
Yes 1070 494 575 273 255 294 248 699 159 145 21 298 465 294 346 452 272 489 362 75 378 691 293 572 205 528 530
76% 72% 80% 71% 74% 77% 83% 74% 76% 86% 80% 66% 89% 72% 90% 76% 63% 89% 68% 69% 79% 75% 74% 77% 76% 78% 75%
No 337 192 145 110 91 87 49 240 49 24 5 152 56 114 39 141 157 58 169 33 103 234 102 170 65 151 174
24% 28% 20% 29% 26% 23% 17% 26% 24% 14% 20% 34% 11% 28% 10% 24% 37% 11% 32% 31% 21% 25% 26% 23% 24% 22% 25%
Sigma 1407 687 720 383 345 382 297 938 208 169 26 450 521 408 385 593 429 547 532 108 481 926 395 742 270 679 704
100% 100% 100% 100% 100% 100% 100% 100% 100% 100% 100% 100% 100% 100% 100% 100% 100% 100% 100% 100% 100% 100% 100% 100% 100% 100% 100%

Page 72
Fielding Period: November 27 - 28, 2018
HCAPS (Filtered on Registered Voters)
Weighted To The U.S. General Adult Population
30 Nov 2018
Table 65
MID606 Is your current representative to Congress a Democrat or a Republican?
Base: All Respondents
Presidential
Election Candidate
Gender Age Ethnicity Political Party Political Ideology Voted For Education Locale Income
_____________ ______________________ _______________________ ____________________ ____________________ _____________________ _____________ ________________ _________
Colle- Some
Cons- ge Gr- Colle- $75K Less
Hisp- Black Repub- Democ- Indep- Libe- Mode- erva- 3rd ad And ge Or Urb- Subu- Or Than
Total Male Female 18-34 35-49 50-64 65+ White anic /AA Other lican rat endent ral rate tive Clinton Trump Party Higher Less an rban Rural More $75K
______ _____ _______ _____ _____ _____ ____ _____ _____ _____ _____ ______ ______ ______ ______ ______ ______ ________ ______ _____ ______ ______ ____ _____ _____ ____ ____
Unweighted Base 1407 675 732 416 359 364 268 1049 104 173 25 437 526 382 437 549 421 537 505 113 543 864 388 719 300 548 846
Weighted Base 1407 687 720 383 345 382 297 938 208 169 26 450 521 408 385 593 429 547 532 108 481 926 395 742 270 679 704
Democrat 687 357 330 188 147 189 164 416 115 103 13 138 361 183 242 291 155 361 202 52 254 433 237 363 87 352 327
49% 52% 46% 49% 43% 49% 55% 44% 55% 61% 49% 31% 69% 45% 63% 49% 36% 66% 38% 48% 53% 47% 60% 49% 32% 52% 46%
Republican 507 256 251 132 133 138 105 385 63 41 6 273 97 133 110 172 225 135 274 38 189 318 109 260 138 256 242
36% 37% 35% 34% 38% 36% 35% 41% 30% 24% 24% 61% 19% 33% 29% 29% 52% 25% 51% 36% 39% 34% 28% 35% 51% 38% 34%
Not sure 213 74 138 63 65 55 29 137 31 24 7 40 62 92 33 130 49 52 56 18 38 174 49 119 45 72 136
15% 11% 19% 17% 19% 14% 10% 15% 15% 14% 27% 9% 12% 23% 9% 22% 12% 10% 11% 17% 8% 19% 12% 16% 17% 11% 19%
Sigma 1407 687 720 383 345 382 297 938 208 169 26 450 521 408 385 593 429 547 532 108 481 926 395 742 270 679 704
100% 100% 100% 100% 100% 100% 100% 100% 100% 100% 100% 100% 100% 100% 100% 100% 100% 100% 100% 100% 100% 100% 100% 100% 100% 100% 100%

Page 73
Fielding Period: November 27 - 28, 2018
HCAPS (Filtered on Registered Voters)
Weighted To The U.S. General Adult Population
30 Nov 2018
Table 66
Q1903 Regardless of how you may vote, what do you usually consider yourself?
Base: All Respondents
Presidential
Election Candidate
Gender Age Ethnicity Political Party Political Ideology Voted For Education Locale Income
_____________ ______________________ _______________________ ____________________ ____________________ _____________________ _____________ ________________ _________
Colle- Some
Cons- ge Gr- Colle- $75K Less
Hisp- Black Repub- Democ- Indep- Libe- Mode- erva- 3rd ad And ge Or Urb- Subu- Or Than
Total Male Female 18-34 35-49 50-64 65+ White anic /AA Other lican rat endent ral rate tive Clinton Trump Party Higher Less an rban Rural More $75K
______ _____ _______ _____ _____ _____ ____ _____ _____ _____ _____ ______ ______ ______ ______ ______ ______ ________ ______ _____ ______ ______ ____ _____ _____ ____ ____
Unweighted Base 1407 675 732 416 359 364 268 1049 104 173 25 437 526 382 437 549 421 537 505 113 543 864 388 719 300 548 846
Weighted Base 1407 687 720 383 345 382 297 938 208 169 26 450 521 408 385 593 429 547 532 108 481 926 395 742 270 679 704
Republican 450 248 202 117 116 131 86 369 53 14 1 450 - - 41 108 301 27 354 26 152 298 109 226 115 244 195
32% 36% 28% 31% 34% 34% 29% 39% 26% 8% 5% 100% - - 11% 18% 70% 5% 67% 24% 32% 32% 28% 30% 43% 36% 28%
Democrat 521 204 317 139 117 136 129 269 101 113 13 - 521 - 280 194 47 397 33 25 180 340 169 268 83 242 277
37% 30% 44% 36% 34% 36% 43% 29% 48% 67% 50% - 100% - 73% 33% 11% 73% 6% 23% 37% 37% 43% 36% 31% 36% 39%
Independent 408 224 185 118 106 104 80 284 51 40 8 - - 408 61 269 78 119 142 51 147 261 113 229 66 182 215
29% 33% 26% 31% 31% 27% 27% 30% 24% 24% 32% - - 100% 16% 45% 18% 22% 27% 47% 31% 28% 29% 31% 25% 27% 30%
Other 28 12 17 9 6 12 1 17 3 2 3 - - - 3 22 3 4 4 7 2 26 4 19 5 11 17
2% 2% 2% 2% 2% 3% * 2% 2% 1% 14% - - - 1% 4% 1% 1% 1% 6% * 3% 1% 3% 2% 2% 2%
Sigma 1407 687 720 383 345 382 297 938 208 169 26 450 521 408 385 593 429 547 532 108 481 926 395 742 270 679 704
100% 100% 100% 100% 100% 100% 100% 100% 100% 100% 100% 100% 100% 100% 100% 100% 100% 100% 100% 100% 100% 100% 100% 100% 100% 100% 100%

Page 74
Fielding Period: November 27 - 28, 2018
HCAPS (Filtered on Registered Voters)
Weighted To The U.S. General Adult Population
30 Nov 2018
Table 67
Q1905 Would you call yourself a strong Republican or a not-so-strong Republican?
Base: Republican
Presidential
Election Candidate
Gender Age Ethnicity Political Party Political Ideology Voted For Education Locale Income
_____________ ______________________ _______________________ ____________________ ____________________ _____________________ _____________ ________________ _________
Colle- Some
Cons- ge Gr- Colle- $75K Less
Hisp- Black Repub- Democ- Indep- Libe- Mode- erva- 3rd ad And ge Or Urb- Subu- Or Than
Total Male Female 18-34 35-49 50-64 65+ White anic /AA Other lican rat endent ral rate tive Clinton Trump Party Higher Less an rban Rural More $75K
______ _____ _______ _____ _____ _____ ____ _____ _____ _____ _____ ______ ______ ______ ______ ______ ______ ________ ______ _____ ______ ______ ____ _____ _____ ____ ____
Unweighted Base 437 232 205 127 115 118 77 387 24 13 2 437 - - 53 96 288 23 336 30 172 265 101 218 118 197 234
Weighted Base 450 248 202 117 116 131 86 369 53 14 1 450 - - 41 108 301 27 354 26 152 298 109 226 115 244 195
Strong Republican 287 158 129 76 77 78 56 239 33 8 1 287 - - 29 47 211 12 236 13 88 199 71 139 76 155 126
64% 64% 64% 65% 66% 60% 65% 65% 62% 59% 39% 64% - - 70% 44% 70% 43% 67% 50% 58% 67% 65% 62% 66% 63% 65%
Not-so-strong Republican 163 90 73 41 39 53 30 130 20 6 1 163 - - 13 61 90 15 118 13 64 99 38 86 39 89 69
36% 36% 36% 35% 34% 40% 35% 35% 38% 41% 61% 36% - - 30% 56% 30% 57% 33% 50% 42% 33% 35% 38% 34% 37% 35%
Sigma 450 248 202 117 116 131 86 369 53 14 1 450 - - 41 108 301 27 354 26 152 298 109 226 115 244 195
100% 100% 100% 100% 100% 100% 100% 100% 100% 100% 100% 100% - - 100% 100% 100% 100% 100% 100% 100% 100% 100% 100% 100% 100% 100%

Page 75
Fielding Period: November 27 - 28, 2018
HCAPS (Filtered on Registered Voters)
Weighted To The U.S. General Adult Population
30 Nov 2018
Table 68
Q1910 Would you call yourself a strong Democrat or a not-so-strong Democrat?
Base: Democrat
Presidential
Election Candidate
Gender Age Ethnicity Political Party Political Ideology Voted For Education Locale Income
_____________ ______________________ _______________________ ____________________ ____________________ _____________________ _____________ ________________ _________
Colle- Some
Cons- ge Gr- Colle- $75K Less
Hisp- Black Repub- Democ- Indep- Libe- Mode- erva- 3rd ad And ge Or Urb- Subu- Or Than
Total Male Female 18-34 35-49 50-64 65+ White anic /AA Other lican rat endent ral rate tive Clinton Trump Party Higher Less an rban Rural More $75K
______ _____ _______ _____ _____ _____ ____ _____ _____ _____ _____ ______ ______ ______ ______ ______ ______ ________ ______ _____ ______ ______ ____ _____ _____ ____ ____
Unweighted Base 526 211 315 148 131 133 114 324 52 119 11 - 526 - 298 185 43 397 36 25 213 313 183 255 88 202 323
Weighted Base 521 204 317 139 117 136 129 269 101 113 13 - 521 - 280 194 47 397 33 25 180 340 169 268 83 242 277
Strong Democrat 326 123 203 85 71 88 83 167 59 78 7 - 326 - 195 108 23 264 15 14 108 218 110 167 49 165 160
63% 61% 64% 61% 61% 64% 64% 62% 58% 68% 55% - 63% - 70% 56% 48% 67% 47% 55% 60% 64% 65% 62% 59% 68% 58%
Not-so-strong Democrat 194 80 114 54 46 48 47 102 42 36 6 - 194 - 85 85 24 132 17 11 73 122 59 102 34 78 117
37% 39% 36% 39% 39% 36% 36% 38% 42% 32% 45% - 37% - 30% 44% 52% 33% 53% 45% 40% 36% 35% 38% 41% 32% 42%
Sigma 521 204 317 139 117 136 129 269 101 113 13 - 521 - 280 194 47 397 33 25 180 340 169 268 83 242 277
100% 100% 100% 100% 100% 100% 100% 100% 100% 100% 100% - 100% - 100% 100% 100% 100% 100% 100% 100% 100% 100% 100% 100% 100% 100%

Page 76
Fielding Period: November 27 - 28, 2018
HCAPS (Filtered on Registered Voters)
Weighted To The U.S. General Adult Population
30 Nov 2018
Table 69
Q1912 Insert text assignment
Base: Independent/Other
Presidential
Election Candidate
Gender Age Ethnicity Political Party Political Ideology Voted For Education Locale Income
_____________ ______________________ _______________________ ____________________ ____________________ _____________________ _____________ ________________ _________
Colle- Some
Cons- ge Gr- Colle- $75K Less
Hisp- Black Repub- Democ- Indep- Libe- Mode- erva- 3rd ad And ge Or Urb- Subu- Or Than
Total Male Female 18-34 35-49 50-64 65+ White anic /AA Other lican rat endent ral rate tive Clinton Trump Party Higher Less an rban Rural More $75K
______ _____ _______ _____ _____ _____ ____ _____ _____ _____ _____ ______ ______ ______ ______ ______ ______ ________ ______ _____ ______ ______ ____ _____ _____ ____ ____
Unweighted Base 444 232 212 141 113 113 77 338 28 41 12 - - 382 86 268 90 117 133 58 158 286 104 246 94 149 289
Weighted Base 436 235 201 127 112 115 82 300 54 42 12 - - 408 64 291 81 123 145 57 149 287 117 248 71 193 232
Republican/Democratic 209 112 97 63 44 63 38 149 27 18 5 - - 196 29 143 37 51 75 29 72 136 61 107 41 88 113
48% 47% 48% 49% 39% 55% 47% 49% 50% 44% 41% - - 48% 45% 49% 46% 41% 52% 51% 49% 47% 52% 43% 58% 46% 49%
Democratic/Republican 228 123 104 64 68 52 43 152 27 24 7 - - 212 35 149 44 72 70 28 77 151 57 141 30 105 119
52% 53% 52% 51% 61% 45% 53% 51% 50% 56% 59% - - 52% 55% 51% 54% 59% 48% 49% 51% 53% 48% 57% 42% 54% 51%
Sigma 436 235 201 127 112 115 82 300 54 42 12 - - 408 64 291 81 123 145 57 149 287 117 248 71 193 232
100% 100% 100% 100% 100% 100% 100% 100% 100% 100% 100% - - 100% 100% 100% 100% 100% 100% 100% 100% 100% 100% 100% 100% 100% 100%

Page 77
Fielding Period: November 27 - 28, 2018
HCAPS (Filtered on Registered Voters)
Weighted To The U.S. General Adult Population
30 Nov 2018
Table 70
Q1915 Do you lean more toward the Republican Party or toward the Democratic Party/the Democratic Party or toward the Republican Party?
Base: Independent/Other
Presidential
Election Candidate
Gender Age Ethnicity Political Party Political Ideology Voted For Education Locale Income
_____________ ______________________ _______________________ ____________________ ____________________ _____________________ _____________ ________________ _________
Colle- Some
Cons- ge Gr- Colle- $75K Less
Hisp- Black Repub- Democ- Indep- Libe- Mode- erva- 3rd ad And ge Or Urb- Subu- Or Than
Total Male Female 18-34 35-49 50-64 65+ White anic /AA Other lican rat endent ral rate tive Clinton Trump Party Higher Less an rban Rural More $75K
______ _____ _______ _____ _____ _____ ____ _____ _____ _____ _____ ______ ______ ______ ______ ______ ______ ________ ______ _____ ______ ______ ____ _____ _____ ____ ____
Unweighted Base 442 231 211 140 113 112 77 337 28 40 12 - - 381 85 268 89 116 133 58 158 284 104 245 93 149 287
Weighted Base 435 234 201 127 112 114 82 299 54 41 12 - - 407 63 291 81 122 145 57 149 286 117 247 70 193 230
Lean Republican 109 57 52 22 28 35 23 86 8 8 3 - - 104 5 56 47 7 71 10 27 82 22 69 18 54 51
25% 24% 26% 18% 25% 31% 28% 29% 15% 19% 23% - - 26% 8% 19% 58% 6% 49% 18% 18% 29% 19% 28% 25% 28% 22%
Lean Democrat 129 75 54 50 37 24 18 74 24 22 2 - - 127 46 79 4 84 7 11 49 80 52 69 8 61 68
30% 32% 27% 39% 33% 21% 22% 25% 44% 53% 18% - - 31% 72% 27% 5% 68% 5% 20% 33% 28% 44% 28% 12% 32% 29%
Do not lean either way 197 102 95 54 46 55 41 139 22 12 7 - - 176 12 155 29 32 67 36 73 124 43 110 44 78 111
45% 43% 47% 43% 41% 49% 50% 46% 41% 28% 59% - - 43% 19% 53% 36% 26% 46% 62% 49% 43% 37% 44% 63% 40% 48%
Sigma 435 234 201 127 112 114 82 299 54 41 12 - - 407 63 291 81 122 145 57 149 286 117 247 70 193 230
100% 100% 100% 100% 100% 100% 100% 100% 100% 100% 100% - - 100% 100% 100% 100% 100% 100% 100% 100% 100% 100% 100% 100% 100% 100%
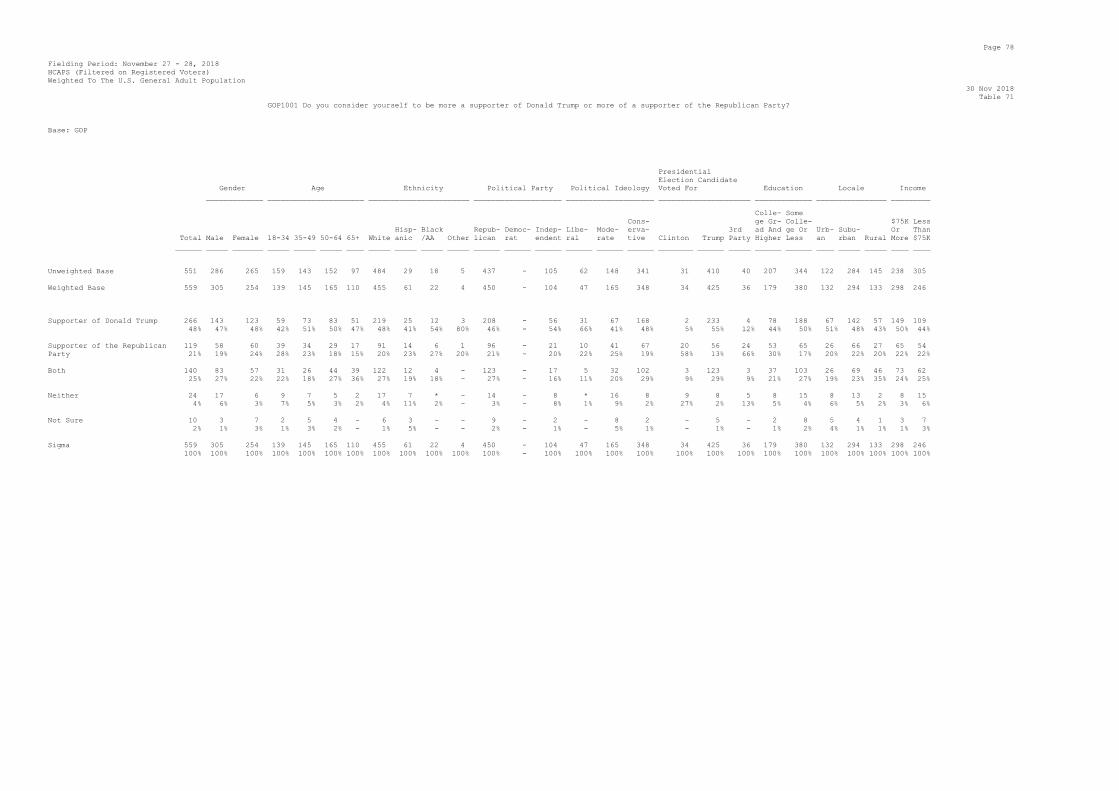
Page 78
Fielding Period: November 27 - 28, 2018
HCAPS (Filtered on Registered Voters)
Weighted To The U.S. General Adult Population
30 Nov 2018
Table 71
GOP1001 Do you consider yourself to be more a supporter of Donald Trump or more of a supporter of the Republican Party?
Base: GOP
Presidential
Election Candidate
Gender Age Ethnicity Political Party Political Ideology Voted For Education Locale Income
_____________ ______________________ _______________________ ____________________ ____________________ _____________________ _____________ ________________ _________
Colle- Some
Cons- ge Gr- Colle- $75K Less
Hisp- Black Repub- Democ- Indep- Libe- Mode- erva- 3rd ad And ge Or Urb- Subu- Or Than
Total Male Female 18-34 35-49 50-64 65+ White anic /AA Other lican rat endent ral rate tive Clinton Trump Party Higher Less an rban Rural More $75K
______ _____ _______ _____ _____ _____ ____ _____ _____ _____ _____ ______ ______ ______ ______ ______ ______ ________ ______ _____ ______ ______ ____ _____ _____ ____ ____
Unweighted Base 551 286 265 159 143 152 97 484 29 18 5 437 - 105 62 148 341 31 410 40 207 344 122 284 145 238 305
Weighted Base 559 305 254 139 145 165 110 455 61 22 4 450 - 104 47 165 348 34 425 36 179 380 132 294 133 298 246
Supporter of Donald Trump 266 143 123 59 73 83 51 219 25 12 3 208 - 56 31 67 168 2 233 4 78 188 67 142 57 149 109
48% 47% 48% 42% 51% 50% 47% 48% 41% 54% 80% 46% - 54% 66% 41% 48% 5% 55% 12% 44% 50% 51% 48% 43% 50% 44%
Supporter of the Republican 119 58 60 39 34 29 17 91 14 6 1 96 - 21 10 41 67 20 56 24 53 65 26 66 27 65 54
Party 21% 19% 24% 28% 23% 18% 15% 20% 23% 27% 20% 21% - 20% 22% 25% 19% 58% 13% 66% 30% 17% 20% 22% 20% 22% 22%
Both 140 83 57 31 26 44 39 122 12 4 - 123 - 17 5 32 102 3 123 3 37 103 26 69 46 73 62
25% 27% 22% 22% 18% 27% 36% 27% 19% 18% - 27% - 16% 11% 20% 29% 9% 29% 9% 21% 27% 19% 23% 35% 24% 25%
Neither 24 17 6 9 7 5 2 17 7 * - 14 - 8 * 16 8 9 8 5 8 15 8 13 2 8 15
4% 6% 3% 7% 5% 3% 2% 4% 11% 2% - 3% - 8% 1% 9% 2% 27% 2% 13% 5% 4% 6% 5% 2% 3% 6%
Not Sure 10 3 7 2 5 4 - 6 3 - - 9 - 2 - 8 2 - 5 - 2 8 5 4 1 3 7
2% 1% 3% 1% 3% 2% - 1% 5% - - 2% - 1% - 5% 1% - 1% - 1% 2% 4% 1% 1% 1% 3%
Sigma 559 305 254 139 145 165 110 455 61 22 4 450 - 104 47 165 348 34 425 36 179 380 132 294 133 298 246
100% 100% 100% 100% 100% 100% 100% 100% 100% 100% 100% 100% - 100% 100% 100% 100% 100% 100% 100% 100% 100% 100% 100% 100% 100% 100%

Page 79
Fielding Period: November 27 - 28, 2018
HCAPS (Filtered on Registered Voters)
Weighted To The U.S. General Adult Population
30 Nov 2018
Table 72
LABEL1101R Which of the following labels do you most identify with as a Republican?
Please rank your top three labels. Next to the first-ranked labels, enter ''1'', next to the second-ranked label, enter ''2''; next to the third-ranked label, enter ''3.''
You may select up to three options.
Summary Of Rank 1
Base: GOP
Presidential
Election Candidate
Gender Age Ethnicity Political Party Political Ideology Voted For Education Locale Income
_____________ ______________________ _______________________ ____________________ ____________________ _____________________ _____________ ________________ _________
Colle- Some
Cons- ge Gr- Colle- $75K Less
Hisp- Black Repub- Democ- Indep- Libe- Mode- erva- 3rd ad And ge Or Urb- Subu- Or Than
Total Male Female 18-34 35-49 50-64 65+ White anic /AA Other lican rat endent ral rate tive Clinton Trump Party Higher Less an rban Rural More $75K
______ _____ _______ _____ _____ _____ ____ _____ _____ _____ _____ ______ ______ ______ ______ ______ ______ ________ ______ _____ ______ ______ ____ _____ _____ ____ ____
Unweighted Base 437 232 205 127 115 118 77 387 24 13 2 437 - - 53 96 288 23 336 30 172 265 101 218 118 197 234
Weighted Base 450 248 202 117 116 131 86 369 53 14 1 450 - - 41 108 301 27 354 26 152 298 109 226 115 244 195
Conservative Republican 87 44 43 14 20 33 20 77 9 1 - 87 - - 5 10 72 1 78 1 26 62 8 59 21 49 38
19% 18% 21% 12% 17% 26% 23% 21% 17% 10% - 19% - - 11% 10% 24% 5% 22% 2% 17% 21% 7% 26% 18% 20% 20%
Trump Republican 72 38 34 25 17 16 15 62 5 3 1 72 - - 5 19 47 2 60 2 20 52 19 36 18 33 40
16% 15% 17% 21% 15% 12% 18% 17% 9% 19% 39% 16% - - 13% 18% 16% 6% 17% 9% 13% 18% 17% 16% 16% 13% 20%
Christian Conservative 59 20 39 14 14 13 18 54 2 2 - 59 - - 2 9 48 1 50 3 20 39 11 29 20 25 31
13% 8% 19% 12% 12% 10% 21% 14% 3% 15% - 13% - - 5% 9% 16% 5% 14% 11% 13% 13% 10% 13% 17% 10% 16%
Fiscal Conservative 45 37 8 4 12 21 9 39 5 1 - 45 - - - 9 36 1 34 7 26 19 5 27 13 34 11
10% 15% 4% 3% 10% 16% 10% 11% 9% 10% - 10% - - - 8% 12% 5% 10% 29% 17% 6% 5% 12% 11% 14% 5%
Reagan Republican 42 28 14 5 17 14 7 34 3 2 - 42 - - 2 12 29 5 29 3 15 27 9 20 14 25 15
9% 11% 7% 4% 14% 10% 8% 9% 6% 13% - 9% - - 4% 11% 10% 19% 8% 13% 10% 9% 8% 9% 12% 10% 8%
Moderate Republican 38 24 14 10 9 12 7 28 4 3 - 38 - - 4 18 16 4 26 3 10 27 10 23 5 26 11
8% 10% 7% 9% 8% 9% 8% 8% 8% 25% - 8% - - 9% 17% 5% 14% 7% 12% 7% 9% 9% 10% 4% 11% 5%
Nationalist 18 14 5 7 5 2 4 11 7 - - 18 - - 4 1 12 - 16 1 7 11 14 3 1 15 3
4% 5% 2% 6% 5% 1% 4% 3% 14% - - 4% - - 11% 1% 4% - 5% 3% 4% 4% 13% 1% 1% 6% 2%
Compassionate Conservative 11 6 5 7 2 3 - 6 5 - - 11 - - - 5 6 5 6 1 3 8 6 4 2 4 7
2% 3% 2% 6% 2% 2% - 2% 10% - - 2% - - - 5% 2% 19% 2% 2% 2% 3% 5% 2% 1% 2% 4%
Social Conservative 11 8 3 2 4 3 3 8 3 - - 11 - - * 3 8 3 9 - 7 5 1 4 6 6 6
2% 3% 2% 2% 3% 2% 3% 2% 5% - - 2% - - 1% 3% 3% 10% 2% - 4% 2% 1% 2% 5% 2% 3%
Liberal Republican 9 3 6 3 4 * 3 8 - * 1 9 - - 5 1 4 1 7 1 2 7 1 5 3 5 4
2% 1% 3% 2% 3% * 3% 2% - 2% 61% 2% - - 11% 1% 1% 3% 2% 4% 2% 2% 1% 2% 2% 2% 2%
Heartland Republican 7 6 1 5 2 1 - 4 3 - - 7 - - 1 4 2 - 7 - 1 6 5 - 2 6 2
2% 2% * 4% 1% 1% - 1% 6% - - 2% - - 3% 4% 1% - 2% - 1% 2% 5% - 1% 2% 1%
Bush Republican 5 2 3 2 3 1 - 4 - - - 5 - - 2 3 1 1 3 1 3 2 5 - * 1 5
1% 1% 2% 2% 2% * - 1% - - - 1% - - 4% 3% * 2% 1% 2% 2% 1% 5% - * * 2%

Page 80
Fielding Period: November 27 - 28, 2018
HCAPS (Filtered on Registered Voters)
Weighted To The U.S. General Adult Population
30 Nov 2018
Table 72
LABEL1101R Which of the following labels do you most identify with as a Republican?
Please rank your top three labels. Next to the first-ranked labels, enter ''1'', next to the second-ranked label, enter ''2''; next to the third-ranked label, enter ''3.''
You may select up to three options.
Summary Of Rank 1
Base: GOP
Presidential
Election Candidate
Gender Age Ethnicity Political Party Political Ideology Voted For Education Locale Income
_____________ ______________________ _______________________ ____________________ ____________________ _____________________ _____________ ________________ _________
Colle- Some
Cons- ge Gr- Colle- $75K Less
Hisp- Black Repub- Democ- Indep- Libe- Mode- erva- 3rd ad And ge Or Urb- Subu- Or Than
Total Male Female 18-34 35-49 50-64 65+ White anic /AA Other lican rat endent ral rate tive Clinton Trump Party Higher Less an rban Rural More $75K
______ _____ _______ _____ _____ _____ ____ _____ _____ _____ _____ ______ ______ ______ ______ ______ ______ ________ ______ _____ ______ ______ ____ _____ _____ ____ ____
Alt-Right 5 4 2 3 2 1 - 5 - - - 5 - - 4 1 * 1 3 - 1 4 4 - 2 5 *
1% 1% 1% 2% 1% 1% - 1% - - - 1% - - 9% 1% * 3% 1% - 1% 1% 3% - 2% 2% *
Libertarian 5 2 3 3 - 1 - 3 2 - - 5 - - 2 1 1 - 4 * 1 4 - 5 - 3 2
1% 1% 1% 3% - 1% - 1% 3% - - 1% - - 5% 1% * - 1% 1% 1% 1% - 2% - 1% 1%
Populist 3 2 1 2 1 - - 2 1 - - 3 - - 2 1 1 1 1 1 1 3 1 1 1 1 3
1% 1% 1% 2% 1% - - 1% 2% - - 1% - - 4% 1% * 3% * 4% * 1% 1% * 1% * 1%
Other 3 2 1 2 - 1 - 3 - - - 3 - - - - 3 - 3 - 1 2 1 1 1 - 2
1% 1% * 2% - 1% - 1% - - - 1% - - - - 1% - 1% - 1% 1% 1% * 1% - 1%

Page 81
Fielding Period: November 27 - 28, 2018
HCAPS (Filtered on Registered Voters)
Weighted To The U.S. General Adult Population
30 Nov 2018
Table 73
LABEL1101R Which of the following labels do you most identify with as a Republican?
Please rank your top three labels. Next to the first-ranked labels, enter ''1'', next to the second-ranked label, enter ''2''; next to the third-ranked label, enter ''3.''
You may select up to three options.
Summary Of Rank 2
Base: GOP
Presidential
Election Candidate
Gender Age Ethnicity Political Party Political Ideology Voted For Education Locale Income
_____________ ______________________ _______________________ ____________________ ____________________ _____________________ _____________ ________________ _________
Colle- Some
Cons- ge Gr- Colle- $75K Less
Hisp- Black Repub- Democ- Indep- Libe- Mode- erva- 3rd ad And ge Or Urb- Subu- Or Than
Total Male Female 18-34 35-49 50-64 65+ White anic /AA Other lican rat endent ral rate tive Clinton Trump Party Higher Less an rban Rural More $75K
______ _____ _______ _____ _____ _____ ____ _____ _____ _____ _____ ______ ______ ______ ______ ______ ______ ________ ______ _____ ______ ______ ____ _____ _____ ____ ____
Unweighted Base 437 232 205 127 115 118 77 387 24 13 2 437 - - 53 96 288 23 336 30 172 265 101 218 118 197 234
Weighted Base 450 248 202 117 116 131 86 369 53 14 1 450 - - 41 108 301 27 354 26 152 298 109 226 115 244 195
Conservative Republican 59 26 33 9 22 11 17 51 2 3 1 59 - - 1 9 49 4 41 3 17 42 11 26 22 27 30
13% 11% 16% 8% 19% 9% 19% 14% 3% 20% 61% 13% - - 3% 8% 16% 16% 12% 13% 11% 14% 10% 11% 19% 11% 15%
Reagan Republican 49 34 15 9 9 21 10 44 5 1 - 49 - - 4 10 35 - 41 3 19 30 11 29 10 29 21
11% 14% 7% 8% 7% 16% 12% 12% 9% 8% - 11% - - 10% 9% 12% - 12% 12% 13% 10% 10% 13% 8% 12% 11%
Trump Republican 45 29 16 12 11 18 4 41 3 1 - 45 - - 3 9 33 * 42 2 13 32 12 22 11 20 25
10% 11% 8% 10% 9% 14% 5% 11% 5% 9% - 10% - - 7% 8% 11% 1% 12% 7% 8% 11% 11% 10% 9% 8% 13%
Christian Conservative 38 18 21 13 9 10 5 30 8 - - 38 - - 1 15 22 6 28 1 7 31 12 13 13 14 24
9% 7% 10% 11% 8% 8% 6% 8% 15% - - 9% - - 2% 14% 7% 23% 8% 3% 5% 10% 11% 6% 11% 6% 12%
Fiscal Conservative 36 24 12 4 8 13 12 28 7 - - 36 - - 2 4 30 3 28 4 25 11 1 26 9 29 7
8% 9% 6% 3% 7% 10% 13% 8% 13% - - 8% - - 4% 4% 10% 11% 8% 14% 16% 4% 1% 11% 8% 12% 4%
Compassionate Conservative 31 13 18 8 5 9 8 27 2 1 - 31 - - 3 5 23 1 25 3 5 26 6 18 7 19 12
7% 5% 9% 7% 4% 7% 10% 7% 4% 5% - 7% - - 6% 5% 8% 3% 7% 10% 4% 9% 5% 8% 6% 8% 6%
Moderate Republican 31 17 13 10 4 9 9 26 5 - - 31 - - 1 7 23 2 20 5 14 17 8 14 8 21 9
7% 7% 7% 8% 3% 7% 10% 7% 10% - - 7% - - 3% 6% 8% 6% 6% 20% 9% 6% 8% 6% 7% 9% 5%
Social Conservative 27 18 9 8 11 6 3 21 5 * - 27 - - 4 4 19 1 21 2 9 18 6 15 6 18 9
6% 7% 5% 7% 9% 4% 4% 6% 9% 2% - 6% - - 11% 4% 6% 3% 6% 8% 6% 6% 6% 7% 5% 7% 5%
Bush Republican 25 12 13 5 10 8 2 22 2 - - 25 - - 3 9 13 3 21 - 6 19 6 10 8 15 7
6% 5% 6% 5% 9% 6% 2% 6% 3% - - 6% - - 7% 8% 4% 10% 6% - 4% 6% 6% 5% 7% 6% 4%
Nationalist 22 15 7 5 4 5 8 22 - - - 22 - - 1 8 13 - 22 * 9 13 9 11 2 15 7
5% 6% 3% 4% 4% 4% 9% 6% - - - 5% - - 3% 7% 4% - 6% 2% 6% 4% 8% 5% 2% 6% 4%
Liberal Republican 19 11 7 6 8 3 1 8 6 5 - 19 - - 4 7 8 2 15 - 2 16 8 10 * 13 5
4% 5% 4% 5% 7% 2% 1% 2% 10% 36% - 4% - - 9% 6% 3% 6% 4% - 1% 6% 8% 4% * 5% 3%
Libertarian 13 10 3 8 3 1 1 10 1 1 - 13 - - 5 1 6 2 10 1 9 4 5 5 3 8 3
3% 4% 2% 7% 3% 1% 1% 3% 3% 6% - 3% - - 12% 1% 2% 8% 3% 3% 6% 1% 4% 2% 2% 3% 2%
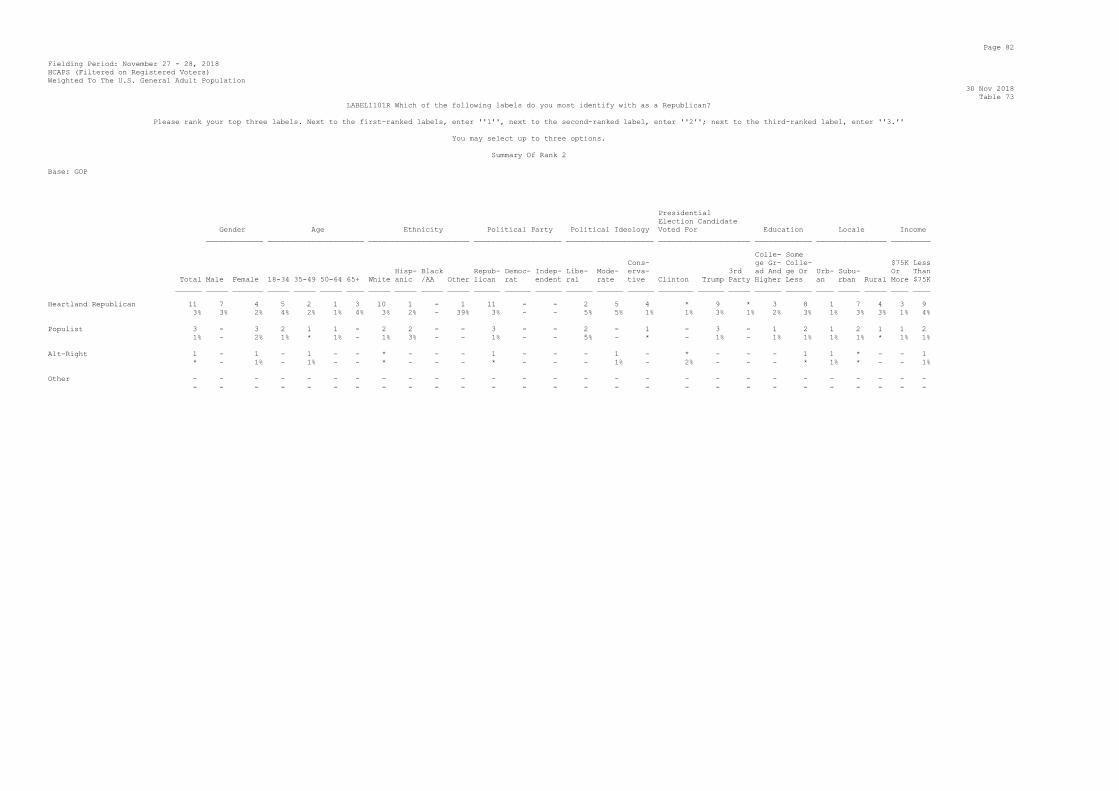
Page 82
Fielding Period: November 27 - 28, 2018
HCAPS (Filtered on Registered Voters)
Weighted To The U.S. General Adult Population
30 Nov 2018
Table 73
LABEL1101R Which of the following labels do you most identify with as a Republican?
Please rank your top three labels. Next to the first-ranked labels, enter ''1'', next to the second-ranked label, enter ''2''; next to the third-ranked label, enter ''3.''
You may select up to three options.
Summary Of Rank 2
Base: GOP
Presidential
Election Candidate
Gender Age Ethnicity Political Party Political Ideology Voted For Education Locale Income
_____________ ______________________ _______________________ ____________________ ____________________ _____________________ _____________ ________________ _________
Colle- Some
Cons- ge Gr- Colle- $75K Less
Hisp- Black Repub- Democ- Indep- Libe- Mode- erva- 3rd ad And ge Or Urb- Subu- Or Than
Total Male Female 18-34 35-49 50-64 65+ White anic /AA Other lican rat endent ral rate tive Clinton Trump Party Higher Less an rban Rural More $75K
______ _____ _______ _____ _____ _____ ____ _____ _____ _____ _____ ______ ______ ______ ______ ______ ______ ________ ______ _____ ______ ______ ____ _____ _____ ____ ____
Heartland Republican 11 7 4 5 2 1 3 10 1 - 1 11 - - 2 5 4 * 9 * 3 8 1 7 4 3 9
3% 3% 2% 4% 2% 1% 4% 3% 2% - 39% 3% - - 5% 5% 1% 1% 3% 1% 2% 3% 1% 3% 3% 1% 4%
Populist 3 - 3 2 1 1 - 2 2 - - 3 - - 2 - 1 - 3 - 1 2 1 2 1 1 2
1% - 2% 1% * 1% - 1% 3% - - 1% - - 5% - * - 1% - 1% 1% 1% 1% * 1% 1%
Alt-Right 1 - 1 - 1 - - * - - - 1 - - - 1 - * - - - 1 1 * - - 1
* - 1% - 1% - - * - - - * - - - 1% - 2% - - - * 1% * - - 1%
Other - - - - - - - - - - - - - - - - - - - - - - - - - - -
- - - - - - - - - - - - - - - - - - - - - - - - - - -
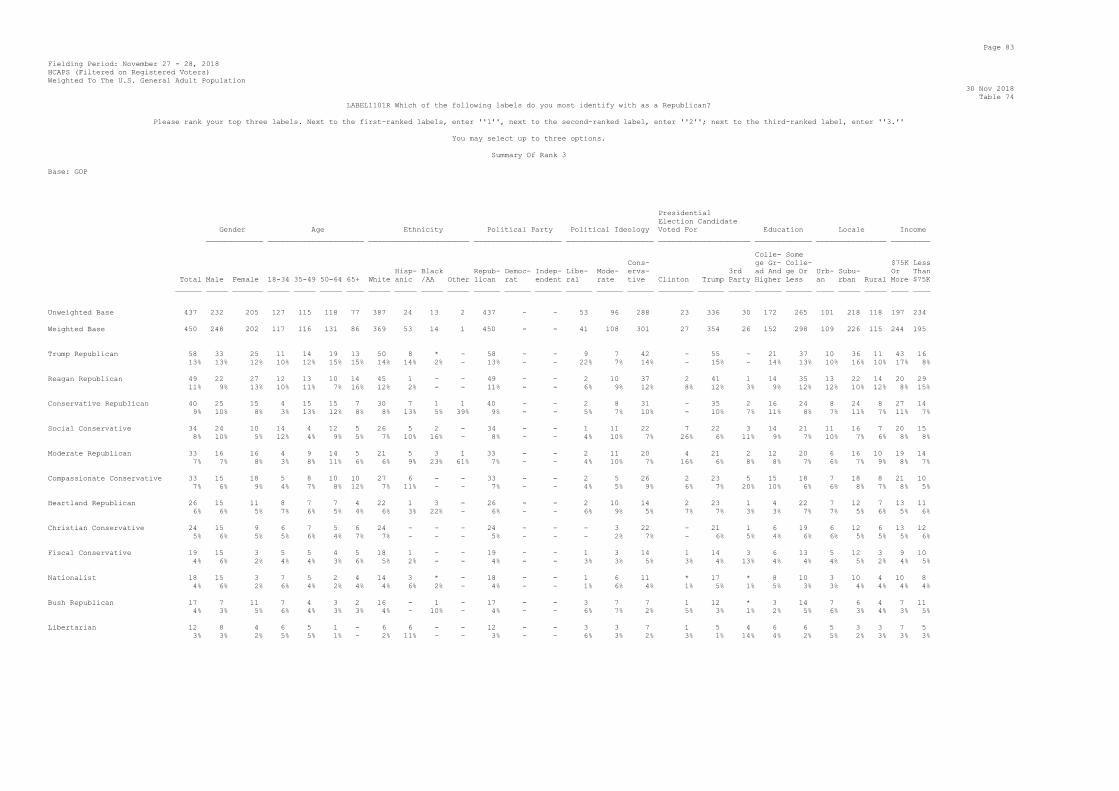
Page 83
Fielding Period: November 27 - 28, 2018
HCAPS (Filtered on Registered Voters)
Weighted To The U.S. General Adult Population
30 Nov 2018
Table 74
LABEL1101R Which of the following labels do you most identify with as a Republican?
Please rank your top three labels. Next to the first-ranked labels, enter ''1'', next to the second-ranked label, enter ''2''; next to the third-ranked label, enter ''3.''
You may select up to three options.
Summary Of Rank 3
Base: GOP
Presidential
Election Candidate
Gender Age Ethnicity Political Party Political Ideology Voted For Education Locale Income
_____________ ______________________ _______________________ ____________________ ____________________ _____________________ _____________ ________________ _________
Colle- Some
Cons- ge Gr- Colle- $75K Less
Hisp- Black Repub- Democ- Indep- Libe- Mode- erva- 3rd ad And ge Or Urb- Subu- Or Than
Total Male Female 18-34 35-49 50-64 65+ White anic /AA Other lican rat endent ral rate tive Clinton Trump Party Higher Less an rban Rural More $75K
______ _____ _______ _____ _____ _____ ____ _____ _____ _____ _____ ______ ______ ______ ______ ______ ______ ________ ______ _____ ______ ______ ____ _____ _____ ____ ____
Unweighted Base 437 232 205 127 115 118 77 387 24 13 2 437 - - 53 96 288 23 336 30 172 265 101 218 118 197 234
Weighted Base 450 248 202 117 116 131 86 369 53 14 1 450 - - 41 108 301 27 354 26 152 298 109 226 115 244 195
Trump Republican 58 33 25 11 14 19 13 50 8 * - 58 - - 9 7 42 - 55 - 21 37 10 36 11 43 16
13% 13% 12% 10% 12% 15% 15% 14% 14% 2% - 13% - - 22% 7% 14% - 15% - 14% 13% 10% 16% 10% 17% 8%
Reagan Republican 49 22 27 12 13 10 14 45 1 - - 49 - - 2 10 37 2 41 1 14 35 13 22 14 20 29
11% 9% 13% 10% 11% 7% 16% 12% 2% - - 11% - - 6% 9% 12% 8% 12% 3% 9% 12% 12% 10% 12% 8% 15%
Conservative Republican 40 25 15 4 15 15 7 30 7 1 1 40 - - 2 8 31 - 35 2 16 24 8 24 8 27 14
9% 10% 8% 3% 13% 12% 8% 8% 13% 5% 39% 9% - - 5% 7% 10% - 10% 7% 11% 8% 7% 11% 7% 11% 7%
Social Conservative 34 24 10 14 4 12 5 26 5 2 - 34 - - 1 11 22 7 22 3 14 21 11 16 7 20 15
8% 10% 5% 12% 4% 9% 5% 7% 10% 16% - 8% - - 4% 10% 7% 26% 6% 11% 9% 7% 10% 7% 6% 8% 8%
Moderate Republican 33 16 16 4 9 14 5 21 5 3 1 33 - - 2 11 20 4 21 2 12 20 6 16 10 19 14
7% 7% 8% 3% 8% 11% 6% 6% 9% 23% 61% 7% - - 4% 10% 7% 16% 6% 8% 8% 7% 6% 7% 9% 8% 7%
Compassionate Conservative 33 15 18 5 8 10 10 27 6 - - 33 - - 2 5 26 2 23 5 15 18 7 18 8 21 10
7% 6% 9% 4% 7% 8% 12% 7% 11% - - 7% - - 4% 5% 9% 6% 7% 20% 10% 6% 6% 8% 7% 8% 5%
Heartland Republican 26 15 11 8 7 7 4 22 1 3 - 26 - - 2 10 14 2 23 1 4 22 7 12 7 13 11
6% 6% 5% 7% 6% 5% 4% 6% 3% 22% - 6% - - 6% 9% 5% 7% 7% 3% 3% 7% 7% 5% 6% 5% 6%
Christian Conservative 24 15 9 6 7 5 6 24 - - - 24 - - - 3 22 - 21 1 6 19 6 12 6 13 12
5% 6% 5% 5% 6% 4% 7% 7% - - - 5% - - - 2% 7% - 6% 5% 4% 6% 6% 5% 5% 5% 6%
Fiscal Conservative 19 15 3 5 5 4 5 18 1 - - 19 - - 1 3 14 1 14 3 6 13 5 12 3 9 10
4% 6% 2% 4% 4% 3% 6% 5% 2% - - 4% - - 3% 3% 5% 3% 4% 13% 4% 4% 4% 5% 2% 4% 5%
Nationalist 18 15 3 7 5 2 4 14 3 * - 18 - - 1 6 11 * 17 * 8 10 3 10 4 10 8
4% 6% 2% 6% 4% 2% 4% 4% 6% 2% - 4% - - 1% 6% 4% 1% 5% 1% 5% 3% 3% 4% 4% 4% 4%
Bush Republican 17 7 11 7 4 3 2 16 - 1 - 17 - - 3 7 7 1 12 * 3 14 7 6 4 7 11
4% 3% 5% 6% 4% 3% 3% 4% - 10% - 4% - - 6% 7% 2% 5% 3% 1% 2% 5% 6% 3% 4% 3% 5%
Libertarian 12 8 4 6 5 1 - 6 6 - - 12 - - 3 3 7 1 5 4 6 6 5 3 3 7 5
3% 3% 2% 5% 5% 1% - 2% 11% - - 3% - - 6% 3% 2% 3% 1% 14% 4% 2% 5% 2% 3% 3% 3%

Page 84
Fielding Period: November 27 - 28, 2018
HCAPS (Filtered on Registered Voters)
Weighted To The U.S. General Adult Population
30 Nov 2018
Table 74
LABEL1101R Which of the following labels do you most identify with as a Republican?
Please rank your top three labels. Next to the first-ranked labels, enter ''1'', next to the second-ranked label, enter ''2''; next to the third-ranked label, enter ''3.''
You may select up to three options.
Summary Of Rank 3
Base: GOP
Presidential
Election Candidate
Gender Age Ethnicity Political Party Political Ideology Voted For Education Locale Income
_____________ ______________________ _______________________ ____________________ ____________________ _____________________ _____________ ________________ _________
Colle- Some
Cons- ge Gr- Colle- $75K Less
Hisp- Black Repub- Democ- Indep- Libe- Mode- erva- 3rd ad And ge Or Urb- Subu- Or Than
Total Male Female 18-34 35-49 50-64 65+ White anic /AA Other lican rat endent ral rate tive Clinton Trump Party Higher Less an rban Rural More $75K
______ _____ _______ _____ _____ _____ ____ _____ _____ _____ _____ ______ ______ ______ ______ ______ ______ ________ ______ _____ ______ ______ ____ _____ _____ ____ ____
Alt-Right 9 4 5 6 1 1 * 7 2 - - 9 - - 3 3 3 * 6 - 2 6 1 5 3 2 6
2% 1% 2% 5% 1% 1% 1% 2% 3% - - 2% - - 6% 3% 1% 1% 2% - 1% 2% 1% 2% 2% 1% 3%
Liberal Republican 8 1 6 2 2 4 - 5 - 1 - 8 - - 1 2 5 1 5 1 2 6 2 1 4 5 3
2% 1% 3% 2% 2% 3% - 1% - 6% - 2% - - 3% 2% 2% 3% 1% 6% 1% 2% 2% 1% 4% 2% 2%
Populist 1 1 - 1 - - - 1 - - - 1 - - 1 - * - 1 - 1 - 1 * - 1 *
* * - 1% - - - * - - - * - - 2% - * - * - 1% - 1% * - * *
Other - - - - - - - - - - - - - - - - - - - - - - - - - - -
- - - - - - - - - - - - - - - - - - - - - - - - - - -

Page 85
Fielding Period: November 27 - 28, 2018
HCAPS (Filtered on Registered Voters)
Weighted To The U.S. General Adult Population
30 Nov 2018
Table 75
LABEL1101R Which of the following labels do you most identify with as a Republican?
Please rank your top three labels. Next to the first-ranked labels, enter ''1'', next to the second-ranked label, enter ''2''; next to the third-ranked label, enter ''3.''
You may select up to three options.
Summary Of Rank 1,2,3
Base: GOP
Presidential
Election Candidate
Gender Age Ethnicity Political Party Political Ideology Voted For Education Locale Income
_____________ ______________________ _______________________ ____________________ ____________________ _____________________ _____________ ________________ _________
Colle- Some
Cons- ge Gr- Colle- $75K Less
Hisp- Black Repub- Democ- Indep- Libe- Mode- erva- 3rd ad And ge Or Urb- Subu- Or Than
Total Male Female 18-34 35-49 50-64 65+ White anic /AA Other lican rat endent ral rate tive Clinton Trump Party Higher Less an rban Rural More $75K
______ _____ _______ _____ _____ _____ ____ _____ _____ _____ _____ ______ ______ ______ ______ ______ ______ ________ ______ _____ ______ ______ ____ _____ _____ ____ ____
Unweighted Base 437 232 205 127 115 118 77 387 24 13 2 437 - - 53 96 288 23 336 30 172 265 101 218 118 197 234
Weighted Base 450 248 202 117 116 131 86 369 53 14 1 450 - - 41 108 301 27 354 26 152 298 109 226 115 244 195
Conservative Republican 187 96 91 27 57 60 43 159 18 5 1 187 - - 8 27 152 6 155 6 59 128 27 109 51 102 82
42% 39% 45% 23% 49% 46% 50% 43% 33% 35% 100% 42% - - 19% 25% 50% 21% 44% 22% 39% 43% 25% 48% 44% 42% 42%
Trump Republican 175 100 75 48 42 53 32 153 15 4 1 175 - - 18 36 122 2 156 4 53 122 41 94 41 95 80
39% 40% 37% 41% 36% 40% 37% 42% 28% 30% 39% 39% - - 43% 33% 41% 8% 44% 17% 35% 41% 37% 42% 35% 39% 41%
Reagan Republican 140 84 56 26 38 45 31 123 9 3 - 140 - - 8 31 101 7 112 7 48 92 32 70 37 73 64
31% 34% 28% 22% 32% 34% 36% 33% 17% 20% - 31% - - 20% 29% 33% 27% 32% 28% 32% 31% 30% 31% 32% 30% 33%
Christian Conservative 122 53 69 33 31 28 30 108 10 2 - 122 - - 3 27 92 8 98 5 33 88 29 54 39 52 67
27% 21% 34% 28% 26% 22% 34% 29% 19% 15% - 27% - - 7% 25% 30% 28% 28% 18% 22% 30% 26% 24% 34% 21% 34%
Moderate Republican 101 58 43 24 22 35 21 75 14 7 1 101 - - 7 35 59 10 67 10 37 65 25 53 24 66 34
22% 23% 22% 20% 19% 27% 24% 20% 26% 49% 61% 22% - - 17% 33% 20% 36% 19% 39% 24% 22% 23% 23% 20% 27% 17%
Fiscal Conservative 100 76 24 12 25 37 25 84 13 1 - 100 - - 3 16 81 5 76 14 58 42 11 65 24 72 28
22% 30% 12% 11% 22% 28% 29% 23% 24% 10% - 22% - - 7% 14% 27% 19% 22% 56% 38% 14% 10% 29% 21% 29% 14%
Compassionate Conservative 75 35 40 20 15 22 18 59 13 1 - 75 - - 4 15 55 7 53 8 24 51 19 40 17 43 30
17% 14% 20% 17% 13% 17% 21% 16% 25% 5% - 17% - - 11% 14% 18% 27% 15% 32% 16% 17% 17% 18% 14% 18% 15%
Social Conservative 73 50 23 23 19 20 10 56 13 2 - 73 - - 6 18 48 10 51 5 30 43 19 35 19 43 29
16% 20% 11% 20% 16% 16% 12% 15% 24% 18% - 16% - - 15% 17% 16% 38% 14% 19% 20% 14% 17% 16% 16% 18% 15%
Nationalist 58 43 15 19 14 9 15 47 10 * - 58 - - 6 15 37 * 54 1 24 33 27 23 8 39 19
13% 17% 7% 17% 12% 7% 18% 13% 19% 2% - 13% - - 16% 14% 12% 1% 15% 5% 16% 11% 24% 10% 7% 16% 10%
Bush Republican 48 21 27 15 17 12 4 42 2 1 - 48 - - 7 20 21 5 36 1 12 35 18 16 13 22 23
11% 8% 13% 13% 15% 9% 5% 11% 3% 10% - 11% - - 17% 18% 7% 17% 10% 4% 8% 12% 17% 7% 11% 9% 12%
Heartland Republican 45 29 16 18 11 9 7 36 6 3 1 45 - - 6 19 20 2 40 1 9 36 14 19 12 21 21
10% 12% 8% 15% 9% 7% 8% 10% 11% 22% 39% 10% - - 14% 17% 7% 8% 11% 4% 6% 12% 12% 8% 11% 9% 11%
Liberal Republican 36 16 20 10 14 7 4 22 6 6 1 36 - - 10 10 16 3 27 3 7 29 12 16 7 23 12
8% 6% 10% 9% 12% 5% 5% 6% 10% 43% 61% 8% - - 24% 9% 5% 12% 8% 10% 4% 10% 11% 7% 6% 10% 6%

Page 86
Fielding Period: November 27 - 28, 2018
HCAPS (Filtered on Registered Voters)
Weighted To The U.S. General Adult Population
30 Nov 2018
Table 75
LABEL1101R Which of the following labels do you most identify with as a Republican?
Please rank your top three labels. Next to the first-ranked labels, enter ''1'', next to the second-ranked label, enter ''2''; next to the third-ranked label, enter ''3.''
You may select up to three options.
Summary Of Rank 1,2,3
Base: GOP
Presidential
Election Candidate
Gender Age Ethnicity Political Party Political Ideology Voted For Education Locale Income
_____________ ______________________ _______________________ ____________________ ____________________ _____________________ _____________ ________________ _________
Colle- Some
Cons- ge Gr- Colle- $75K Less
Hisp- Black Repub- Democ- Indep- Libe- Mode- erva- 3rd ad And ge Or Urb- Subu- Or Than
Total Male Female 18-34 35-49 50-64 65+ White anic /AA Other lican rat endent ral rate tive Clinton Trump Party Higher Less an rban Rural More $75K
______ _____ _______ _____ _____ _____ ____ _____ _____ _____ _____ ______ ______ ______ ______ ______ ______ ________ ______ _____ ______ ______ ____ _____ _____ ____ ____
Libertarian 29 19 10 17 8 3 1 20 9 1 - 29 - - 10 5 14 3 19 5 16 14 10 14 6 17 11
7% 8% 5% 14% 7% 3% 1% 5% 16% 6% - 7% - - 23% 5% 5% 11% 5% 19% 10% 5% 9% 6% 5% 7% 6%
Alt-Right 15 7 8 9 4 2 * 13 2 - - 15 - - 6 6 3 2 10 - 4 11 5 6 4 7 8
3% 3% 4% 7% 3% 2% 1% 3% 3% - - 3% - - 16% 5% 1% 6% 3% - 2% 4% 4% 3% 4% 3% 4%
Populist 8 3 5 4 2 1 - 5 3 - - 8 - - 5 1 2 1 5 1 3 5 3 3 2 3 5
2% 1% 2% 4% 2% 1% - 1% 5% - - 2% - - 11% 1% 1% 3% 1% 4% 2% 2% 3% 1% 2% 1% 3%
Other 3 2 1 2 - 1 - 3 - - - 3 - - - - 3 - 3 - 1 2 1 1 1 - 2
1% 1% * 2% - 1% - 1% - - - 1% - - - - 1% - 1% - 1% 1% 1% * 1% - 1%

Page 87
Fielding Period: November 27 - 28, 2018
HCAPS (Filtered on Registered Voters)
Weighted To The U.S. General Adult Population
30 Nov 2018
Table 76
LABEL1101R_1 Which of the following labels do you most identify with as a Republican?
Please rank your top three labels. Next to the first-ranked labels, enter ''1'', next to the second-ranked label, enter ''2''; next to the third-ranked label, enter ''3.''
You may select up to three options.
Compassionate Conservative
Base: GOP
Presidential
Election Candidate
Gender Age Ethnicity Political Party Political Ideology Voted For Education Locale Income
_____________ ______________________ _______________________ ____________________ ____________________ _____________________ _____________ ________________ _________
Colle- Some
Cons- ge Gr- Colle- $75K Less
Hisp- Black Repub- Democ- Indep- Libe- Mode- erva- 3rd ad And ge Or Urb- Subu- Or Than
Total Male Female 18-34 35-49 50-64 65+ White anic /AA Other lican rat endent ral rate tive Clinton Trump Party Higher Less an rban Rural More $75K
______ _____ _______ _____ _____ _____ ____ _____ _____ _____ _____ ______ ______ ______ ______ ______ ______ ________ ______ _____ ______ ______ ____ _____ _____ ____ ____
Unweighted Base 437 232 205 127 115 118 77 387 24 13 2 437 - - 53 96 288 23 336 30 172 265 101 218 118 197 234
Weighted Base 450 248 202 117 116 131 86 369 53 14 1 450 - - 41 108 301 27 354 26 152 298 109 226 115 244 195
Rank 1 11 6 5 7 2 3 - 6 5 - - 11 - - - 5 6 5 6 1 3 8 6 4 2 4 7
2% 3% 2% 6% 2% 2% - 2% 10% - - 2% - - - 5% 2% 19% 2% 2% 2% 3% 5% 2% 1% 2% 4%
Rank 2 31 13 18 8 5 9 8 27 2 1 - 31 - - 3 5 23 1 25 3 5 26 6 18 7 19 12
7% 5% 9% 7% 4% 7% 10% 7% 4% 5% - 7% - - 6% 5% 8% 3% 7% 10% 4% 9% 5% 8% 6% 8% 6%
Rank 3 33 15 18 5 8 10 10 27 6 - - 33 - - 2 5 26 2 23 5 15 18 7 18 8 21 10
7% 6% 9% 4% 7% 8% 12% 7% 11% - - 7% - - 4% 5% 9% 6% 7% 20% 10% 6% 6% 8% 7% 8% 5%
None of these 27 6 21 10 5 11 2 19 5 1 - 27 - - 3 10 14 2 18 2 6 21 9 11 8 8 15
6% 3% 10% 8% 5% 8% 2% 5% 9% 7% - 6% - - 7% 9% 5% 6% 5% 7% 4% 7% 8% 5% 7% 3% 8%
No Answer 348 207 141 87 96 98 66 291 35 12 1 348 - - 34 83 231 18 283 16 122 226 82 175 91 192 150
77% 83% 70% 75% 83% 75% 77% 79% 66% 87% 100% 77% - - 82% 77% 77% 67% 80% 61% 80% 76% 75% 77% 79% 79% 77%
Sigma 450 248 202 117 116 131 86 369 53 14 1 450 - - 41 108 301 27 354 26 152 298 109 226 115 244 195
100% 100% 100% 100% 100% 100% 100% 100% 100% 100% 100% 100% - - 100% 100% 100% 100% 100% 100% 100% 100% 100% 100% 100% 100% 100%

Page 88
Fielding Period: November 27 - 28, 2018
HCAPS (Filtered on Registered Voters)
Weighted To The U.S. General Adult Population
30 Nov 2018
Table 77
LABEL1101R_2 Which of the following labels do you most identify with as a Republican?
Please rank your top three labels. Next to the first-ranked labels, enter ''1'', next to the second-ranked label, enter ''2''; next to the third-ranked label, enter ''3.''
You may select up to three options.
Christian Conservative
Base: GOP
Presidential
Election Candidate
Gender Age Ethnicity Political Party Political Ideology Voted For Education Locale Income
_____________ ______________________ _______________________ ____________________ ____________________ _____________________ _____________ ________________ _________
Colle- Some
Cons- ge Gr- Colle- $75K Less
Hisp- Black Repub- Democ- Indep- Libe- Mode- erva- 3rd ad And ge Or Urb- Subu- Or Than
Total Male Female 18-34 35-49 50-64 65+ White anic /AA Other lican rat endent ral rate tive Clinton Trump Party Higher Less an rban Rural More $75K
______ _____ _______ _____ _____ _____ ____ _____ _____ _____ _____ ______ ______ ______ ______ ______ ______ ________ ______ _____ ______ ______ ____ _____ _____ ____ ____
Unweighted Base 437 232 205 127 115 118 77 387 24 13 2 437 - - 53 96 288 23 336 30 172 265 101 218 118 197 234
Weighted Base 450 248 202 117 116 131 86 369 53 14 1 450 - - 41 108 301 27 354 26 152 298 109 226 115 244 195
Rank 1 59 20 39 14 14 13 18 54 2 2 - 59 - - 2 9 48 1 50 3 20 39 11 29 20 25 31
13% 8% 19% 12% 12% 10% 21% 14% 3% 15% - 13% - - 5% 9% 16% 5% 14% 11% 13% 13% 10% 13% 17% 10% 16%
Rank 2 38 18 21 13 9 10 5 30 8 - - 38 - - 1 15 22 6 28 1 7 31 12 13 13 14 24
9% 7% 10% 11% 8% 8% 6% 8% 15% - - 9% - - 2% 14% 7% 23% 8% 3% 5% 10% 11% 6% 11% 6% 12%
Rank 3 24 15 9 6 7 5 6 24 - - - 24 - - - 3 22 - 21 1 6 19 6 12 6 13 12
5% 6% 5% 5% 6% 4% 7% 7% - - - 5% - - - 2% 7% - 6% 5% 4% 6% 6% 5% 5% 5% 6%
None of these 27 6 21 10 5 11 2 19 5 1 - 27 - - 3 10 14 2 18 2 6 21 9 11 8 8 15
6% 3% 10% 8% 5% 8% 2% 5% 9% 7% - 6% - - 7% 9% 5% 6% 5% 7% 4% 7% 8% 5% 7% 3% 8%
No Answer 302 189 113 74 80 92 55 243 39 11 1 302 - - 35 71 195 18 238 19 113 189 72 160 69 184 113
67% 76% 56% 64% 69% 70% 64% 66% 72% 78% 100% 67% - - 86% 66% 65% 66% 67% 75% 74% 63% 66% 71% 60% 75% 58%
Sigma 450 248 202 117 116 131 86 369 53 14 1 450 - - 41 108 301 27 354 26 152 298 109 226 115 244 195
100% 100% 100% 100% 100% 100% 100% 100% 100% 100% 100% 100% - - 100% 100% 100% 100% 100% 100% 100% 100% 100% 100% 100% 100% 100%

Page 89
Fielding Period: November 27 - 28, 2018
HCAPS (Filtered on Registered Voters)
Weighted To The U.S. General Adult Population
30 Nov 2018
Table 78
LABEL1101R_3 Which of the following labels do you most identify with as a Republican?
Please rank your top three labels. Next to the first-ranked labels, enter ''1'', next to the second-ranked label, enter ''2''; next to the third-ranked label, enter ''3.''
You may select up to three options.
Social Conservative
Base: GOP
Presidential
Election Candidate
Gender Age Ethnicity Political Party Political Ideology Voted For Education Locale Income
_____________ ______________________ _______________________ ____________________ ____________________ _____________________ _____________ ________________ _________
Colle- Some
Cons- ge Gr- Colle- $75K Less
Hisp- Black Repub- Democ- Indep- Libe- Mode- erva- 3rd ad And ge Or Urb- Subu- Or Than
Total Male Female 18-34 35-49 50-64 65+ White anic /AA Other lican rat endent ral rate tive Clinton Trump Party Higher Less an rban Rural More $75K
______ _____ _______ _____ _____ _____ ____ _____ _____ _____ _____ ______ ______ ______ ______ ______ ______ ________ ______ _____ ______ ______ ____ _____ _____ ____ ____
Unweighted Base 437 232 205 127 115 118 77 387 24 13 2 437 - - 53 96 288 23 336 30 172 265 101 218 118 197 234
Weighted Base 450 248 202 117 116 131 86 369 53 14 1 450 - - 41 108 301 27 354 26 152 298 109 226 115 244 195
Rank 1 11 8 3 2 4 3 3 8 3 - - 11 - - * 3 8 3 9 - 7 5 1 4 6 6 6
2% 3% 2% 2% 3% 2% 3% 2% 5% - - 2% - - 1% 3% 3% 10% 2% - 4% 2% 1% 2% 5% 2% 3%
Rank 2 27 18 9 8 11 6 3 21 5 * - 27 - - 4 4 19 1 21 2 9 18 6 15 6 18 9
6% 7% 5% 7% 9% 4% 4% 6% 9% 2% - 6% - - 11% 4% 6% 3% 6% 8% 6% 6% 6% 7% 5% 7% 5%
Rank 3 34 24 10 14 4 12 5 26 5 2 - 34 - - 1 11 22 7 22 3 14 21 11 16 7 20 15
8% 10% 5% 12% 4% 9% 5% 7% 10% 16% - 8% - - 4% 10% 7% 26% 6% 11% 9% 7% 10% 7% 6% 8% 8%
None of these 27 6 21 10 5 11 2 19 5 1 - 27 - - 3 10 14 2 18 2 6 21 9 11 8 8 15
6% 3% 10% 8% 5% 8% 2% 5% 9% 7% - 6% - - 7% 9% 5% 6% 5% 7% 4% 7% 8% 5% 7% 3% 8%
No Answer 350 192 159 84 92 100 74 295 36 10 1 350 - - 32 80 238 15 285 19 116 234 82 179 89 192 150
78% 77% 79% 72% 79% 76% 86% 80% 67% 75% 100% 78% - - 77% 74% 79% 56% 81% 74% 76% 78% 75% 79% 77% 79% 77%
Sigma 450 248 202 117 116 131 86 369 53 14 1 450 - - 41 108 301 27 354 26 152 298 109 226 115 244 195
100% 100% 100% 100% 100% 100% 100% 100% 100% 100% 100% 100% - - 100% 100% 100% 100% 100% 100% 100% 100% 100% 100% 100% 100% 100%

Page 90
Fielding Period: November 27 - 28, 2018
HCAPS (Filtered on Registered Voters)
Weighted To The U.S. General Adult Population
30 Nov 2018
Table 79
LABEL1101R_4 Which of the following labels do you most identify with as a Republican?
Please rank your top three labels. Next to the first-ranked labels, enter ''1'', next to the second-ranked label, enter ''2''; next to the third-ranked label, enter ''3.''
You may select up to three options.
Fiscal Conservative
Base: GOP
Presidential
Election Candidate
Gender Age Ethnicity Political Party Political Ideology Voted For Education Locale Income
_____________ ______________________ _______________________ ____________________ ____________________ _____________________ _____________ ________________ _________
Colle- Some
Cons- ge Gr- Colle- $75K Less
Hisp- Black Repub- Democ- Indep- Libe- Mode- erva- 3rd ad And ge Or Urb- Subu- Or Than
Total Male Female 18-34 35-49 50-64 65+ White anic /AA Other lican rat endent ral rate tive Clinton Trump Party Higher Less an rban Rural More $75K
______ _____ _______ _____ _____ _____ ____ _____ _____ _____ _____ ______ ______ ______ ______ ______ ______ ________ ______ _____ ______ ______ ____ _____ _____ ____ ____
Unweighted Base 437 232 205 127 115 118 77 387 24 13 2 437 - - 53 96 288 23 336 30 172 265 101 218 118 197 234
Weighted Base 450 248 202 117 116 131 86 369 53 14 1 450 - - 41 108 301 27 354 26 152 298 109 226 115 244 195
Rank 1 45 37 8 4 12 21 9 39 5 1 - 45 - - - 9 36 1 34 7 26 19 5 27 13 34 11
10% 15% 4% 3% 10% 16% 10% 11% 9% 10% - 10% - - - 8% 12% 5% 10% 29% 17% 6% 5% 12% 11% 14% 5%
Rank 2 36 24 12 4 8 13 12 28 7 - - 36 - - 2 4 30 3 28 4 25 11 1 26 9 29 7
8% 9% 6% 3% 7% 10% 13% 8% 13% - - 8% - - 4% 4% 10% 11% 8% 14% 16% 4% 1% 11% 8% 12% 4%
Rank 3 19 15 3 5 5 4 5 18 1 - - 19 - - 1 3 14 1 14 3 6 13 5 12 3 9 10
4% 6% 2% 4% 4% 3% 6% 5% 2% - - 4% - - 3% 3% 5% 3% 4% 13% 4% 4% 4% 5% 2% 4% 5%
None of these 27 6 21 10 5 11 2 19 5 1 - 27 - - 3 10 14 2 18 2 6 21 9 11 8 8 15
6% 3% 10% 8% 5% 8% 2% 5% 9% 7% - 6% - - 7% 9% 5% 6% 5% 7% 4% 7% 8% 5% 7% 3% 8%
No Answer 323 166 157 95 86 83 60 266 36 11 1 323 - - 35 83 205 20 260 10 88 235 90 150 84 164 152
72% 67% 78% 81% 74% 64% 69% 72% 67% 83% 100% 72% - - 86% 77% 68% 75% 74% 37% 58% 79% 82% 66% 73% 67% 78%
Sigma 450 248 202 117 116 131 86 369 53 14 1 450 - - 41 108 301 27 354 26 152 298 109 226 115 244 195
100% 100% 100% 100% 100% 100% 100% 100% 100% 100% 100% 100% - - 100% 100% 100% 100% 100% 100% 100% 100% 100% 100% 100% 100% 100%

Page 91
Fielding Period: November 27 - 28, 2018
HCAPS (Filtered on Registered Voters)
Weighted To The U.S. General Adult Population
30 Nov 2018
Table 80
LABEL1101R_5 Which of the following labels do you most identify with as a Republican?
Please rank your top three labels. Next to the first-ranked labels, enter ''1'', next to the second-ranked label, enter ''2''; next to the third-ranked label, enter ''3.''
You may select up to three options.
Reagan Republican
Base: GOP
Presidential
Election Candidate
Gender Age Ethnicity Political Party Political Ideology Voted For Education Locale Income
_____________ ______________________ _______________________ ____________________ ____________________ _____________________ _____________ ________________ _________
Colle- Some
Cons- ge Gr- Colle- $75K Less
Hisp- Black Repub- Democ- Indep- Libe- Mode- erva- 3rd ad And ge Or Urb- Subu- Or Than
Total Male Female 18-34 35-49 50-64 65+ White anic /AA Other lican rat endent ral rate tive Clinton Trump Party Higher Less an rban Rural More $75K
______ _____ _______ _____ _____ _____ ____ _____ _____ _____ _____ ______ ______ ______ ______ ______ ______ ________ ______ _____ ______ ______ ____ _____ _____ ____ ____
Unweighted Base 437 232 205 127 115 118 77 387 24 13 2 437 - - 53 96 288 23 336 30 172 265 101 218 118 197 234
Weighted Base 450 248 202 117 116 131 86 369 53 14 1 450 - - 41 108 301 27 354 26 152 298 109 226 115 244 195
Rank 1 42 28 14 5 17 14 7 34 3 2 - 42 - - 2 12 29 5 29 3 15 27 9 20 14 25 15
9% 11% 7% 4% 14% 10% 8% 9% 6% 13% - 9% - - 4% 11% 10% 19% 8% 13% 10% 9% 8% 9% 12% 10% 8%
Rank 2 49 34 15 9 9 21 10 44 5 1 - 49 - - 4 10 35 - 41 3 19 30 11 29 10 29 21
11% 14% 7% 8% 7% 16% 12% 12% 9% 8% - 11% - - 10% 9% 12% - 12% 12% 13% 10% 10% 13% 8% 12% 11%
Rank 3 49 22 27 12 13 10 14 45 1 - - 49 - - 2 10 37 2 41 1 14 35 13 22 14 20 29
11% 9% 13% 10% 11% 7% 16% 12% 2% - - 11% - - 6% 9% 12% 8% 12% 3% 9% 12% 12% 10% 12% 8% 15%
None of these 27 6 21 10 5 11 2 19 5 1 - 27 - - 3 10 14 2 18 2 6 21 9 11 8 8 15
6% 3% 10% 8% 5% 8% 2% 5% 9% 7% - 6% - - 7% 9% 5% 6% 5% 7% 4% 7% 8% 5% 7% 3% 8%
No Answer 283 158 125 81 73 75 53 228 39 10 1 283 - - 30 67 186 18 224 17 98 185 68 144 71 162 116
63% 64% 62% 69% 63% 58% 62% 62% 74% 73% 100% 63% - - 73% 62% 62% 67% 63% 65% 64% 62% 63% 64% 61% 66% 59%
Sigma 450 248 202 117 116 131 86 369 53 14 1 450 - - 41 108 301 27 354 26 152 298 109 226 115 244 195
100% 100% 100% 100% 100% 100% 100% 100% 100% 100% 100% 100% - - 100% 100% 100% 100% 100% 100% 100% 100% 100% 100% 100% 100% 100%

Page 92
Fielding Period: November 27 - 28, 2018
HCAPS (Filtered on Registered Voters)
Weighted To The U.S. General Adult Population
30 Nov 2018
Table 81
LABEL1101R_6 Which of the following labels do you most identify with as a Republican?
Please rank your top three labels. Next to the first-ranked labels, enter ''1'', next to the second-ranked label, enter ''2''; next to the third-ranked label, enter ''3.''
You may select up to three options.
Bush Republican
Base: GOP
Presidential
Election Candidate
Gender Age Ethnicity Political Party Political Ideology Voted For Education Locale Income
_____________ ______________________ _______________________ ____________________ ____________________ _____________________ _____________ ________________ _________
Colle- Some
Cons- ge Gr- Colle- $75K Less
Hisp- Black Repub- Democ- Indep- Libe- Mode- erva- 3rd ad And ge Or Urb- Subu- Or Than
Total Male Female 18-34 35-49 50-64 65+ White anic /AA Other lican rat endent ral rate tive Clinton Trump Party Higher Less an rban Rural More $75K
______ _____ _______ _____ _____ _____ ____ _____ _____ _____ _____ ______ ______ ______ ______ ______ ______ ________ ______ _____ ______ ______ ____ _____ _____ ____ ____
Unweighted Base 437 232 205 127 115 118 77 387 24 13 2 437 - - 53 96 288 23 336 30 172 265 101 218 118 197 234
Weighted Base 450 248 202 117 116 131 86 369 53 14 1 450 - - 41 108 301 27 354 26 152 298 109 226 115 244 195
Rank 1 5 2 3 2 3 1 - 4 - - - 5 - - 2 3 1 1 3 1 3 2 5 - * 1 5
1% 1% 2% 2% 2% * - 1% - - - 1% - - 4% 3% * 2% 1% 2% 2% 1% 5% - * * 2%
Rank 2 25 12 13 5 10 8 2 22 2 - - 25 - - 3 9 13 3 21 - 6 19 6 10 8 15 7
6% 5% 6% 5% 9% 6% 2% 6% 3% - - 6% - - 7% 8% 4% 10% 6% - 4% 6% 6% 5% 7% 6% 4%
Rank 3 17 7 11 7 4 3 2 16 - 1 - 17 - - 3 7 7 1 12 * 3 14 7 6 4 7 11
4% 3% 5% 6% 4% 3% 3% 4% - 10% - 4% - - 6% 7% 2% 5% 3% 1% 2% 5% 6% 3% 4% 3% 5%
None of these 27 6 21 10 5 11 2 19 5 1 - 27 - - 3 10 14 2 18 2 6 21 9 11 8 8 15
6% 3% 10% 8% 5% 8% 2% 5% 9% 7% - 6% - - 7% 9% 5% 6% 5% 7% 4% 7% 8% 5% 7% 3% 8%
No Answer 376 221 155 93 94 108 81 309 47 11 1 376 - - 31 79 266 21 300 23 133 242 82 198 95 213 157
83% 89% 77% 79% 81% 83% 93% 84% 88% 83% 100% 83% - - 75% 73% 88% 77% 85% 89% 88% 81% 76% 88% 82% 87% 81%
Sigma 450 248 202 117 116 131 86 369 53 14 1 450 - - 41 108 301 27 354 26 152 298 109 226 115 244 195
100% 100% 100% 100% 100% 100% 100% 100% 100% 100% 100% 100% - - 100% 100% 100% 100% 100% 100% 100% 100% 100% 100% 100% 100% 100%

Page 93
Fielding Period: November 27 - 28, 2018
HCAPS (Filtered on Registered Voters)
Weighted To The U.S. General Adult Population
30 Nov 2018
Table 82
LABEL1101R_7 Which of the following labels do you most identify with as a Republican?
Please rank your top three labels. Next to the first-ranked labels, enter ''1'', next to the second-ranked label, enter ''2''; next to the third-ranked label, enter ''3.''
You may select up to three options.
Trump Republican
Base: GOP
Presidential
Election Candidate
Gender Age Ethnicity Political Party Political Ideology Voted For Education Locale Income
_____________ ______________________ _______________________ ____________________ ____________________ _____________________ _____________ ________________ _________
Colle- Some
Cons- ge Gr- Colle- $75K Less
Hisp- Black Repub- Democ- Indep- Libe- Mode- erva- 3rd ad And ge Or Urb- Subu- Or Than
Total Male Female 18-34 35-49 50-64 65+ White anic /AA Other lican rat endent ral rate tive Clinton Trump Party Higher Less an rban Rural More $75K
______ _____ _______ _____ _____ _____ ____ _____ _____ _____ _____ ______ ______ ______ ______ ______ ______ ________ ______ _____ ______ ______ ____ _____ _____ ____ ____
Unweighted Base 437 232 205 127 115 118 77 387 24 13 2 437 - - 53 96 288 23 336 30 172 265 101 218 118 197 234
Weighted Base 450 248 202 117 116 131 86 369 53 14 1 450 - - 41 108 301 27 354 26 152 298 109 226 115 244 195
Rank 1 72 38 34 25 17 16 15 62 5 3 1 72 - - 5 19 47 2 60 2 20 52 19 36 18 33 40
16% 15% 17% 21% 15% 12% 18% 17% 9% 19% 39% 16% - - 13% 18% 16% 6% 17% 9% 13% 18% 17% 16% 16% 13% 20%
Rank 2 45 29 16 12 11 18 4 41 3 1 - 45 - - 3 9 33 * 42 2 13 32 12 22 11 20 25
10% 11% 8% 10% 9% 14% 5% 11% 5% 9% - 10% - - 7% 8% 11% 1% 12% 7% 8% 11% 11% 10% 9% 8% 13%
Rank 3 58 33 25 11 14 19 13 50 8 * - 58 - - 9 7 42 - 55 - 21 37 10 36 11 43 16
13% 13% 12% 10% 12% 15% 15% 14% 14% 2% - 13% - - 22% 7% 14% - 15% - 14% 13% 10% 16% 10% 17% 8%
None of these 27 6 21 10 5 11 2 19 5 1 - 27 - - 3 10 14 2 18 2 6 21 9 11 8 8 15
6% 3% 10% 8% 5% 8% 2% 5% 9% 7% - 6% - - 7% 9% 5% 6% 5% 7% 4% 7% 8% 5% 7% 3% 8%
No Answer 248 142 106 59 69 67 53 197 33 9 1 248 - - 21 63 164 23 180 20 92 155 60 121 67 140 100
55% 57% 53% 51% 59% 51% 61% 53% 63% 63% 61% 55% - - 50% 58% 55% 87% 51% 76% 61% 52% 55% 53% 58% 58% 51%
Sigma 450 248 202 117 116 131 86 369 53 14 1 450 - - 41 108 301 27 354 26 152 298 109 226 115 244 195
100% 100% 100% 100% 100% 100% 100% 100% 100% 100% 100% 100% - - 100% 100% 100% 100% 100% 100% 100% 100% 100% 100% 100% 100% 100%

Page 94
Fielding Period: November 27 - 28, 2018
HCAPS (Filtered on Registered Voters)
Weighted To The U.S. General Adult Population
30 Nov 2018
Table 83
LABEL1101R_8 Which of the following labels do you most identify with as a Republican?
Please rank your top three labels. Next to the first-ranked labels, enter ''1'', next to the second-ranked label, enter ''2''; next to the third-ranked label, enter ''3.''
You may select up to three options.
Heartland Republican
Base: GOP
Presidential
Election Candidate
Gender Age Ethnicity Political Party Political Ideology Voted For Education Locale Income
_____________ ______________________ _______________________ ____________________ ____________________ _____________________ _____________ ________________ _________
Colle- Some
Cons- ge Gr- Colle- $75K Less
Hisp- Black Repub- Democ- Indep- Libe- Mode- erva- 3rd ad And ge Or Urb- Subu- Or Than
Total Male Female 18-34 35-49 50-64 65+ White anic /AA Other lican rat endent ral rate tive Clinton Trump Party Higher Less an rban Rural More $75K
______ _____ _______ _____ _____ _____ ____ _____ _____ _____ _____ ______ ______ ______ ______ ______ ______ ________ ______ _____ ______ ______ ____ _____ _____ ____ ____
Unweighted Base 437 232 205 127 115 118 77 387 24 13 2 437 - - 53 96 288 23 336 30 172 265 101 218 118 197 234
Weighted Base 450 248 202 117 116 131 86 369 53 14 1 450 - - 41 108 301 27 354 26 152 298 109 226 115 244 195
Rank 1 7 6 1 5 2 1 - 4 3 - - 7 - - 1 4 2 - 7 - 1 6 5 - 2 6 2
2% 2% * 4% 1% 1% - 1% 6% - - 2% - - 3% 4% 1% - 2% - 1% 2% 5% - 1% 2% 1%
Rank 2 11 7 4 5 2 1 3 10 1 - 1 11 - - 2 5 4 * 9 * 3 8 1 7 4 3 9
3% 3% 2% 4% 2% 1% 4% 3% 2% - 39% 3% - - 5% 5% 1% 1% 3% 1% 2% 3% 1% 3% 3% 1% 4%
Rank 3 26 15 11 8 7 7 4 22 1 3 - 26 - - 2 10 14 2 23 1 4 22 7 12 7 13 11
6% 6% 5% 7% 6% 5% 4% 6% 3% 22% - 6% - - 6% 9% 5% 7% 7% 3% 3% 7% 7% 5% 6% 5% 6%
None of these 27 6 21 10 5 11 2 19 5 1 - 27 - - 3 10 14 2 18 2 6 21 9 11 8 8 15
6% 3% 10% 8% 5% 8% 2% 5% 9% 7% - 6% - - 7% 9% 5% 6% 5% 7% 4% 7% 8% 5% 7% 3% 8%
No Answer 378 213 165 89 100 111 78 315 43 10 1 378 - - 33 80 266 23 296 23 137 242 87 196 96 214 159
84% 86% 82% 77% 86% 85% 90% 85% 80% 71% 61% 84% - - 79% 74% 89% 87% 84% 89% 90% 81% 80% 87% 83% 88% 81%
Sigma 450 248 202 117 116 131 86 369 53 14 1 450 - - 41 108 301 27 354 26 152 298 109 226 115 244 195
100% 100% 100% 100% 100% 100% 100% 100% 100% 100% 100% 100% - - 100% 100% 100% 100% 100% 100% 100% 100% 100% 100% 100% 100% 100%

Page 95
Fielding Period: November 27 - 28, 2018
HCAPS (Filtered on Registered Voters)
Weighted To The U.S. General Adult Population
30 Nov 2018
Table 84
LABEL1101R_9 Which of the following labels do you most identify with as a Republican?
Please rank your top three labels. Next to the first-ranked labels, enter ''1'', next to the second-ranked label, enter ''2''; next to the third-ranked label, enter ''3.''
You may select up to three options.
Liberal Republican
Base: GOP
Presidential
Election Candidate
Gender Age Ethnicity Political Party Political Ideology Voted For Education Locale Income
_____________ ______________________ _______________________ ____________________ ____________________ _____________________ _____________ ________________ _________
Colle- Some
Cons- ge Gr- Colle- $75K Less
Hisp- Black Repub- Democ- Indep- Libe- Mode- erva- 3rd ad And ge Or Urb- Subu- Or Than
Total Male Female 18-34 35-49 50-64 65+ White anic /AA Other lican rat endent ral rate tive Clinton Trump Party Higher Less an rban Rural More $75K
______ _____ _______ _____ _____ _____ ____ _____ _____ _____ _____ ______ ______ ______ ______ ______ ______ ________ ______ _____ ______ ______ ____ _____ _____ ____ ____
Unweighted Base 437 232 205 127 115 118 77 387 24 13 2 437 - - 53 96 288 23 336 30 172 265 101 218 118 197 234
Weighted Base 450 248 202 117 116 131 86 369 53 14 1 450 - - 41 108 301 27 354 26 152 298 109 226 115 244 195
Rank 1 9 3 6 3 4 * 3 8 - * 1 9 - - 5 1 4 1 7 1 2 7 1 5 3 5 4
2% 1% 3% 2% 3% * 3% 2% - 2% 61% 2% - - 11% 1% 1% 3% 2% 4% 2% 2% 1% 2% 2% 2% 2%
Rank 2 19 11 7 6 8 3 1 8 6 5 - 19 - - 4 7 8 2 15 - 2 16 8 10 * 13 5
4% 5% 4% 5% 7% 2% 1% 2% 10% 36% - 4% - - 9% 6% 3% 6% 4% - 1% 6% 8% 4% * 5% 3%
Rank 3 8 1 6 2 2 4 - 5 - 1 - 8 - - 1 2 5 1 5 1 2 6 2 1 4 5 3
2% 1% 3% 2% 2% 3% - 1% - 6% - 2% - - 3% 2% 2% 3% 1% 6% 1% 2% 2% 1% 4% 2% 2%
None of these 27 6 21 10 5 11 2 19 5 1 - 27 - - 3 10 14 2 18 2 6 21 9 11 8 8 15
6% 3% 10% 8% 5% 8% 2% 5% 9% 7% - 6% - - 7% 9% 5% 6% 5% 7% 4% 7% 8% 5% 7% 3% 8%
No Answer 388 226 162 97 97 113 81 329 43 7 1 388 - - 28 89 270 22 309 21 139 248 89 198 101 212 168
86% 91% 80% 83% 83% 86% 94% 89% 81% 50% 39% 86% - - 69% 82% 90% 82% 87% 83% 92% 83% 81% 88% 87% 87% 86%
Sigma 450 248 202 117 116 131 86 369 53 14 1 450 - - 41 108 301 27 354 26 152 298 109 226 115 244 195
100% 100% 100% 100% 100% 100% 100% 100% 100% 100% 100% 100% - - 100% 100% 100% 100% 100% 100% 100% 100% 100% 100% 100% 100% 100%

Page 96
Fielding Period: November 27 - 28, 2018
HCAPS (Filtered on Registered Voters)
Weighted To The U.S. General Adult Population
30 Nov 2018
Table 85
LABEL1101R_10 Which of the following labels do you most identify with as a Republican?
Please rank your top three labels. Next to the first-ranked labels, enter ''1'', next to the second-ranked label, enter ''2''; next to the third-ranked label, enter ''3.''
You may select up to three options.
Moderate Republican
Base: GOP
Presidential
Election Candidate
Gender Age Ethnicity Political Party Political Ideology Voted For Education Locale Income
_____________ ______________________ _______________________ ____________________ ____________________ _____________________ _____________ ________________ _________
Colle- Some
Cons- ge Gr- Colle- $75K Less
Hisp- Black Repub- Democ- Indep- Libe- Mode- erva- 3rd ad And ge Or Urb- Subu- Or Than
Total Male Female 18-34 35-49 50-64 65+ White anic /AA Other lican rat endent ral rate tive Clinton Trump Party Higher Less an rban Rural More $75K
______ _____ _______ _____ _____ _____ ____ _____ _____ _____ _____ ______ ______ ______ ______ ______ ______ ________ ______ _____ ______ ______ ____ _____ _____ ____ ____
Unweighted Base 437 232 205 127 115 118 77 387 24 13 2 437 - - 53 96 288 23 336 30 172 265 101 218 118 197 234
Weighted Base 450 248 202 117 116 131 86 369 53 14 1 450 - - 41 108 301 27 354 26 152 298 109 226 115 244 195
Rank 1 38 24 14 10 9 12 7 28 4 3 - 38 - - 4 18 16 4 26 3 10 27 10 23 5 26 11
8% 10% 7% 9% 8% 9% 8% 8% 8% 25% - 8% - - 9% 17% 5% 14% 7% 12% 7% 9% 9% 10% 4% 11% 5%
Rank 2 31 17 13 10 4 9 9 26 5 - - 31 - - 1 7 23 2 20 5 14 17 8 14 8 21 9
7% 7% 7% 8% 3% 7% 10% 7% 10% - - 7% - - 3% 6% 8% 6% 6% 20% 9% 6% 8% 6% 7% 9% 5%
Rank 3 33 16 16 4 9 14 5 21 5 3 1 33 - - 2 11 20 4 21 2 12 20 6 16 10 19 14
7% 7% 8% 3% 8% 11% 6% 6% 9% 23% 61% 7% - - 4% 10% 7% 16% 6% 8% 8% 7% 6% 7% 9% 8% 7%
None of these 27 6 21 10 5 11 2 19 5 1 - 27 - - 3 10 14 2 18 2 6 21 9 11 8 8 15
6% 3% 10% 8% 5% 8% 2% 5% 9% 7% - 6% - - 7% 9% 5% 6% 5% 7% 4% 7% 8% 5% 7% 3% 8%
No Answer 322 184 138 83 89 85 64 276 34 6 1 322 - - 31 63 228 16 269 14 109 213 76 162 84 169 146
71% 74% 68% 71% 77% 65% 74% 75% 65% 44% 39% 71% - - 76% 58% 76% 58% 76% 54% 72% 71% 70% 72% 73% 69% 75%
Sigma 450 248 202 117 116 131 86 369 53 14 1 450 - - 41 108 301 27 354 26 152 298 109 226 115 244 195
100% 100% 100% 100% 100% 100% 100% 100% 100% 100% 100% 100% - - 100% 100% 100% 100% 100% 100% 100% 100% 100% 100% 100% 100% 100%

Page 97
Fielding Period: November 27 - 28, 2018
HCAPS (Filtered on Registered Voters)
Weighted To The U.S. General Adult Population
30 Nov 2018
Table 86
LABEL1101R_11 Which of the following labels do you most identify with as a Republican?
Please rank your top three labels. Next to the first-ranked labels, enter ''1'', next to the second-ranked label, enter ''2''; next to the third-ranked label, enter ''3.''
You may select up to three options.
Conservative Republican
Base: GOP
Presidential
Election Candidate
Gender Age Ethnicity Political Party Political Ideology Voted For Education Locale Income
_____________ ______________________ _______________________ ____________________ ____________________ _____________________ _____________ ________________ _________
Colle- Some
Cons- ge Gr- Colle- $75K Less
Hisp- Black Repub- Democ- Indep- Libe- Mode- erva- 3rd ad And ge Or Urb- Subu- Or Than
Total Male Female 18-34 35-49 50-64 65+ White anic /AA Other lican rat endent ral rate tive Clinton Trump Party Higher Less an rban Rural More $75K
______ _____ _______ _____ _____ _____ ____ _____ _____ _____ _____ ______ ______ ______ ______ ______ ______ ________ ______ _____ ______ ______ ____ _____ _____ ____ ____
Unweighted Base 437 232 205 127 115 118 77 387 24 13 2 437 - - 53 96 288 23 336 30 172 265 101 218 118 197 234
Weighted Base 450 248 202 117 116 131 86 369 53 14 1 450 - - 41 108 301 27 354 26 152 298 109 226 115 244 195
Rank 1 87 44 43 14 20 33 20 77 9 1 - 87 - - 5 10 72 1 78 1 26 62 8 59 21 49 38
19% 18% 21% 12% 17% 26% 23% 21% 17% 10% - 19% - - 11% 10% 24% 5% 22% 2% 17% 21% 7% 26% 18% 20% 20%
Rank 2 59 26 33 9 22 11 17 51 2 3 1 59 - - 1 9 49 4 41 3 17 42 11 26 22 27 30
13% 11% 16% 8% 19% 9% 19% 14% 3% 20% 61% 13% - - 3% 8% 16% 16% 12% 13% 11% 14% 10% 11% 19% 11% 15%
Rank 3 40 25 15 4 15 15 7 30 7 1 1 40 - - 2 8 31 - 35 2 16 24 8 24 8 27 14
9% 10% 8% 3% 13% 12% 8% 8% 13% 5% 39% 9% - - 5% 7% 10% - 10% 7% 11% 8% 7% 11% 7% 11% 7%
None of these 27 6 21 10 5 11 2 19 5 1 - 27 - - 3 10 14 2 18 2 6 21 9 11 8 8 15
6% 3% 10% 8% 5% 8% 2% 5% 9% 7% - 6% - - 7% 9% 5% 6% 5% 7% 4% 7% 8% 5% 7% 3% 8%
No Answer 236 146 90 80 54 60 42 192 31 8 - 236 - - 30 71 135 20 182 18 87 149 74 106 57 133 98
52% 59% 45% 69% 47% 46% 48% 52% 58% 58% - 52% - - 73% 66% 45% 73% 51% 71% 57% 50% 67% 47% 49% 55% 50%
Sigma 450 248 202 117 116 131 86 369 53 14 1 450 - - 41 108 301 27 354 26 152 298 109 226 115 244 195
100% 100% 100% 100% 100% 100% 100% 100% 100% 100% 100% 100% - - 100% 100% 100% 100% 100% 100% 100% 100% 100% 100% 100% 100% 100%

Page 98
Fielding Period: November 27 - 28, 2018
HCAPS (Filtered on Registered Voters)
Weighted To The U.S. General Adult Population
30 Nov 2018
Table 87
LABEL1101R_12 Which of the following labels do you most identify with as a Republican?
Please rank your top three labels. Next to the first-ranked labels, enter ''1'', next to the second-ranked label, enter ''2''; next to the third-ranked label, enter ''3.''
You may select up to three options.
Nationalist
Base: GOP
Presidential
Election Candidate
Gender Age Ethnicity Political Party Political Ideology Voted For Education Locale Income
_____________ ______________________ _______________________ ____________________ ____________________ _____________________ _____________ ________________ _________
Colle- Some
Cons- ge Gr- Colle- $75K Less
Hisp- Black Repub- Democ- Indep- Libe- Mode- erva- 3rd ad And ge Or Urb- Subu- Or Than
Total Male Female 18-34 35-49 50-64 65+ White anic /AA Other lican rat endent ral rate tive Clinton Trump Party Higher Less an rban Rural More $75K
______ _____ _______ _____ _____ _____ ____ _____ _____ _____ _____ ______ ______ ______ ______ ______ ______ ________ ______ _____ ______ ______ ____ _____ _____ ____ ____
Unweighted Base 437 232 205 127 115 118 77 387 24 13 2 437 - - 53 96 288 23 336 30 172 265 101 218 118 197 234
Weighted Base 450 248 202 117 116 131 86 369 53 14 1 450 - - 41 108 301 27 354 26 152 298 109 226 115 244 195
Rank 1 18 14 5 7 5 2 4 11 7 - - 18 - - 4 1 12 - 16 1 7 11 14 3 1 15 3
4% 5% 2% 6% 5% 1% 4% 3% 14% - - 4% - - 11% 1% 4% - 5% 3% 4% 4% 13% 1% 1% 6% 2%
Rank 2 22 15 7 5 4 5 8 22 - - - 22 - - 1 8 13 - 22 * 9 13 9 11 2 15 7
5% 6% 3% 4% 4% 4% 9% 6% - - - 5% - - 3% 7% 4% - 6% 2% 6% 4% 8% 5% 2% 6% 4%
Rank 3 18 15 3 7 5 2 4 14 3 * - 18 - - 1 6 11 * 17 * 8 10 3 10 4 10 8
4% 6% 2% 6% 4% 2% 4% 4% 6% 2% - 4% - - 1% 6% 4% 1% 5% 1% 5% 3% 3% 4% 4% 4% 4%
None of these 27 6 21 10 5 11 2 19 5 1 - 27 - - 3 10 14 2 18 2 6 21 9 11 8 8 15
6% 3% 10% 8% 5% 8% 2% 5% 9% 7% - 6% - - 7% 9% 5% 6% 5% 7% 4% 7% 8% 5% 7% 3% 8%
No Answer 365 199 167 88 97 111 70 303 38 12 1 365 - - 32 84 250 25 282 23 121 244 74 191 100 197 161
81% 80% 82% 75% 83% 85% 81% 82% 72% 91% 100% 81% - - 77% 77% 83% 93% 80% 88% 80% 82% 68% 85% 87% 81% 82%
Sigma 450 248 202 117 116 131 86 369 53 14 1 450 - - 41 108 301 27 354 26 152 298 109 226 115 244 195
100% 100% 100% 100% 100% 100% 100% 100% 100% 100% 100% 100% - - 100% 100% 100% 100% 100% 100% 100% 100% 100% 100% 100% 100% 100%

Page 99
Fielding Period: November 27 - 28, 2018
HCAPS (Filtered on Registered Voters)
Weighted To The U.S. General Adult Population
30 Nov 2018
Table 88
LABEL1101R_13 Which of the following labels do you most identify with as a Republican?
Please rank your top three labels. Next to the first-ranked labels, enter ''1'', next to the second-ranked label, enter ''2''; next to the third-ranked label, enter ''3.''
You may select up to three options.
Populist
Base: GOP
Presidential
Election Candidate
Gender Age Ethnicity Political Party Political Ideology Voted For Education Locale Income
_____________ ______________________ _______________________ ____________________ ____________________ _____________________ _____________ ________________ _________
Colle- Some
Cons- ge Gr- Colle- $75K Less
Hisp- Black Repub- Democ- Indep- Libe- Mode- erva- 3rd ad And ge Or Urb- Subu- Or Than
Total Male Female 18-34 35-49 50-64 65+ White anic /AA Other lican rat endent ral rate tive Clinton Trump Party Higher Less an rban Rural More $75K
______ _____ _______ _____ _____ _____ ____ _____ _____ _____ _____ ______ ______ ______ ______ ______ ______ ________ ______ _____ ______ ______ ____ _____ _____ ____ ____
Unweighted Base 437 232 205 127 115 118 77 387 24 13 2 437 - - 53 96 288 23 336 30 172 265 101 218 118 197 234
Weighted Base 450 248 202 117 116 131 86 369 53 14 1 450 - - 41 108 301 27 354 26 152 298 109 226 115 244 195
Rank 1 3 2 1 2 1 - - 2 1 - - 3 - - 2 1 1 1 1 1 1 3 1 1 1 1 3
1% 1% 1% 2% 1% - - 1% 2% - - 1% - - 4% 1% * 3% * 4% * 1% 1% * 1% * 1%
Rank 2 3 - 3 2 1 1 - 2 2 - - 3 - - 2 - 1 - 3 - 1 2 1 2 1 1 2
1% - 2% 1% * 1% - 1% 3% - - 1% - - 5% - * - 1% - 1% 1% 1% 1% * 1% 1%
Rank 3 1 1 - 1 - - - 1 - - - 1 - - 1 - * - 1 - 1 - 1 * - 1 *
* * - 1% - - - * - - - * - - 2% - * - * - 1% - 1% * - * *
None of these 27 6 21 10 5 11 2 19 5 1 - 27 - - 3 10 14 2 18 2 6 21 9 11 8 8 15
6% 3% 10% 8% 5% 8% 2% 5% 9% 7% - 6% - - 7% 9% 5% 6% 5% 7% 4% 7% 8% 5% 7% 3% 8%
No Answer 415 239 176 103 109 119 85 345 46 13 1 415 - - 34 98 284 25 331 23 143 273 98 212 106 233 175
92% 96% 87% 88% 94% 91% 98% 94% 86% 93% 100% 92% - - 82% 90% 94% 92% 94% 89% 94% 91% 90% 94% 92% 95% 90%
Sigma 450 248 202 117 116 131 86 369 53 14 1 450 - - 41 108 301 27 354 26 152 298 109 226 115 244 195
100% 100% 100% 100% 100% 100% 100% 100% 100% 100% 100% 100% - - 100% 100% 100% 100% 100% 100% 100% 100% 100% 100% 100% 100% 100%

Page 100
Fielding Period: November 27 - 28, 2018
HCAPS (Filtered on Registered Voters)
Weighted To The U.S. General Adult Population
30 Nov 2018
Table 89
LABEL1101R_14 Which of the following labels do you most identify with as a Republican?
Please rank your top three labels. Next to the first-ranked labels, enter ''1'', next to the second-ranked label, enter ''2''; next to the third-ranked label, enter ''3.''
You may select up to three options.
Libertarian
Base: GOP
Presidential
Election Candidate
Gender Age Ethnicity Political Party Political Ideology Voted For Education Locale Income
_____________ ______________________ _______________________ ____________________ ____________________ _____________________ _____________ ________________ _________
Colle- Some
Cons- ge Gr- Colle- $75K Less
Hisp- Black Repub- Democ- Indep- Libe- Mode- erva- 3rd ad And ge Or Urb- Subu- Or Than
Total Male Female 18-34 35-49 50-64 65+ White anic /AA Other lican rat endent ral rate tive Clinton Trump Party Higher Less an rban Rural More $75K
______ _____ _______ _____ _____ _____ ____ _____ _____ _____ _____ ______ ______ ______ ______ ______ ______ ________ ______ _____ ______ ______ ____ _____ _____ ____ ____
Unweighted Base 437 232 205 127 115 118 77 387 24 13 2 437 - - 53 96 288 23 336 30 172 265 101 218 118 197 234
Weighted Base 450 248 202 117 116 131 86 369 53 14 1 450 - - 41 108 301 27 354 26 152 298 109 226 115 244 195
Rank 1 5 2 3 3 - 1 - 3 2 - - 5 - - 2 1 1 - 4 * 1 4 - 5 - 3 2
1% 1% 1% 3% - 1% - 1% 3% - - 1% - - 5% 1% * - 1% 1% 1% 1% - 2% - 1% 1%
Rank 2 13 10 3 8 3 1 1 10 1 1 - 13 - - 5 1 6 2 10 1 9 4 5 5 3 8 3
3% 4% 2% 7% 3% 1% 1% 3% 3% 6% - 3% - - 12% 1% 2% 8% 3% 3% 6% 1% 4% 2% 2% 3% 2%
Rank 3 12 8 4 6 5 1 - 6 6 - - 12 - - 3 3 7 1 5 4 6 6 5 3 3 7 5
3% 3% 2% 5% 5% 1% - 2% 11% - - 3% - - 6% 3% 2% 3% 1% 14% 4% 2% 5% 2% 3% 3% 3%
None of these 27 6 21 10 5 11 2 19 5 1 - 27 - - 3 10 14 2 18 2 6 21 9 11 8 8 15
6% 3% 10% 8% 5% 8% 2% 5% 9% 7% - 6% - - 7% 9% 5% 6% 5% 7% 4% 7% 8% 5% 7% 3% 8%
No Answer 394 222 171 90 103 117 84 330 40 12 1 394 - - 29 93 272 22 317 19 130 264 91 201 102 218 169
87% 90% 85% 77% 88% 89% 97% 90% 75% 87% 100% 87% - - 70% 86% 90% 84% 90% 74% 86% 88% 83% 89% 88% 89% 87%
Sigma 450 248 202 117 116 131 86 369 53 14 1 450 - - 41 108 301 27 354 26 152 298 109 226 115 244 195
100% 100% 100% 100% 100% 100% 100% 100% 100% 100% 100% 100% - - 100% 100% 100% 100% 100% 100% 100% 100% 100% 100% 100% 100% 100%

Page 101
Fielding Period: November 27 - 28, 2018
HCAPS (Filtered on Registered Voters)
Weighted To The U.S. General Adult Population
30 Nov 2018
Table 90
LABEL1101R_15 Which of the following labels do you most identify with as a Republican?
Please rank your top three labels. Next to the first-ranked labels, enter ''1'', next to the second-ranked label, enter ''2''; next to the third-ranked label, enter ''3.''
You may select up to three options.
Alt-Right
Base: GOP
Presidential
Election Candidate
Gender Age Ethnicity Political Party Political Ideology Voted For Education Locale Income
_____________ ______________________ _______________________ ____________________ ____________________ _____________________ _____________ ________________ _________
Colle- Some
Cons- ge Gr- Colle- $75K Less
Hisp- Black Repub- Democ- Indep- Libe- Mode- erva- 3rd ad And ge Or Urb- Subu- Or Than
Total Male Female 18-34 35-49 50-64 65+ White anic /AA Other lican rat endent ral rate tive Clinton Trump Party Higher Less an rban Rural More $75K
______ _____ _______ _____ _____ _____ ____ _____ _____ _____ _____ ______ ______ ______ ______ ______ ______ ________ ______ _____ ______ ______ ____ _____ _____ ____ ____
Unweighted Base 437 232 205 127 115 118 77 387 24 13 2 437 - - 53 96 288 23 336 30 172 265 101 218 118 197 234
Weighted Base 450 248 202 117 116 131 86 369 53 14 1 450 - - 41 108 301 27 354 26 152 298 109 226 115 244 195
Rank 1 5 4 2 3 2 1 - 5 - - - 5 - - 4 1 * 1 3 - 1 4 4 - 2 5 *
1% 1% 1% 2% 1% 1% - 1% - - - 1% - - 9% 1% * 3% 1% - 1% 1% 3% - 2% 2% *
Rank 2 1 - 1 - 1 - - * - - - 1 - - - 1 - * - - - 1 1 * - - 1
* - 1% - 1% - - * - - - * - - - 1% - 2% - - - * 1% * - - 1%
Rank 3 9 4 5 6 1 1 * 7 2 - - 9 - - 3 3 3 * 6 - 2 6 1 5 3 2 6
2% 1% 2% 5% 1% 1% 1% 2% 3% - - 2% - - 6% 3% 1% 1% 2% - 1% 2% 1% 2% 2% 1% 3%
None of these 27 6 21 10 5 11 2 19 5 1 - 27 - - 3 10 14 2 18 2 6 21 9 11 8 8 15
6% 3% 10% 8% 5% 8% 2% 5% 9% 7% - 6% - - 7% 9% 5% 6% 5% 7% 4% 7% 8% 5% 7% 3% 8%
No Answer 408 235 174 99 107 118 84 338 47 13 1 408 - - 32 93 284 24 327 24 142 266 96 209 104 228 172
91% 95% 86% 84% 92% 90% 98% 91% 88% 93% 100% 91% - - 77% 86% 94% 89% 92% 93% 94% 89% 88% 93% 90% 94% 88%
Sigma 450 248 202 117 116 131 86 369 53 14 1 450 - - 41 108 301 27 354 26 152 298 109 226 115 244 195
100% 100% 100% 100% 100% 100% 100% 100% 100% 100% 100% 100% - - 100% 100% 100% 100% 100% 100% 100% 100% 100% 100% 100% 100% 100%

Page 102
Fielding Period: November 27 - 28, 2018
HCAPS (Filtered on Registered Voters)
Weighted To The U.S. General Adult Population
30 Nov 2018
Table 91
LABEL1101R_98 Which of the following labels do you most identify with as a Republican?
Please rank your top three labels. Next to the first-ranked labels, enter ''1'', next to the second-ranked label, enter ''2''; next to the third-ranked label, enter ''3.''
You may select up to three options.
Other
Base: GOP
Presidential
Election Candidate
Gender Age Ethnicity Political Party Political Ideology Voted For Education Locale Income
_____________ ______________________ _______________________ ____________________ ____________________ _____________________ _____________ ________________ _________
Colle- Some
Cons- ge Gr- Colle- $75K Less
Hisp- Black Repub- Democ- Indep- Libe- Mode- erva- 3rd ad And ge Or Urb- Subu- Or Than
Total Male Female 18-34 35-49 50-64 65+ White anic /AA Other lican rat endent ral rate tive Clinton Trump Party Higher Less an rban Rural More $75K
______ _____ _______ _____ _____ _____ ____ _____ _____ _____ _____ ______ ______ ______ ______ ______ ______ ________ ______ _____ ______ ______ ____ _____ _____ ____ ____
Unweighted Base 437 232 205 127 115 118 77 387 24 13 2 437 - - 53 96 288 23 336 30 172 265 101 218 118 197 234
Weighted Base 450 248 202 117 116 131 86 369 53 14 1 450 - - 41 108 301 27 354 26 152 298 109 226 115 244 195
Rank 1 3 2 1 2 - 1 - 3 - - - 3 - - - - 3 - 3 - 1 2 1 1 1 - 2
1% 1% * 2% - 1% - 1% - - - 1% - - - - 1% - 1% - 1% 1% 1% * 1% - 1%
Rank 2 - - - - - - - - - - - - - - - - - - - - - - - - - - -
- - - - - - - - - - - - - - - - - - - - - - - - - - -
Rank 3 - - - - - - - - - - - - - - - - - - - - - - - - - - -
- - - - - - - - - - - - - - - - - - - - - - - - - - -
None of these 27 6 21 10 5 11 2 19 5 1 - 27 - - 3 10 14 2 18 2 6 21 9 11 8 8 15
6% 3% 10% 8% 5% 8% 2% 5% 9% 7% - 6% - - 7% 9% 5% 6% 5% 7% 4% 7% 8% 5% 7% 3% 8%
No Answer 420 240 181 105 111 119 85 347 48 13 1 420 - - 38 98 284 25 333 24 145 276 99 213 107 235 178
93% 97% 89% 90% 95% 91% 98% 94% 91% 93% 100% 93% - - 93% 91% 94% 94% 94% 93% 95% 92% 91% 95% 93% 97% 91%
Sigma 450 248 202 117 116 131 86 369 53 14 1 450 - - 41 108 301 27 354 26 152 298 109 226 115 244 195
100% 100% 100% 100% 100% 100% 100% 100% 100% 100% 100% 100% - - 100% 100% 100% 100% 100% 100% 100% 100% 100% 100% 100% 100% 100%

Page 103
Fielding Period: November 27 - 28, 2018
HCAPS (Filtered on Registered Voters)
Weighted To The U.S. General Adult Population
30 Nov 2018
Table 92
LABEL1102D Which of the following labels do you most identify with as a Democrat?
Please rank your top three labels. Next to the first-ranked labels, enter ''1'', next to the second-ranked label, enter ''2''; next to the third-ranked label, enter ''3.''
You may select up to three options.
Summary Of Rank 1
Base: GOP
Presidential
Election Candidate
Gender Age Ethnicity Political Party Political Ideology Voted For Education Locale Income
_____________ ______________________ _______________________ ____________________ ____________________ _____________________ _____________ ________________ _________
Colle- Some
Cons- ge Gr- Colle- $75K Less
Hisp- Black Repub- Democ- Indep- Libe- Mode- erva- 3rd ad And ge Or Urb- Subu- Or Than
Total Male Female 18-34 35-49 50-64 65+ White anic /AA Other lican rat endent ral rate tive Clinton Trump Party Higher Less an rban Rural More $75K
______ _____ _______ _____ _____ _____ ____ _____ _____ _____ _____ ______ ______ ______ ______ ______ ______ ________ ______ _____ ______ ______ ____ _____ _____ ____ ____
Unweighted Base 526 211 315 148 131 133 114 324 52 119 11 - 526 - 298 185 43 397 36 25 213 313 183 255 88 202 323
Weighted Base 521 204 317 139 117 136 129 269 101 113 13 - 521 - 280 194 47 397 33 25 180 340 169 268 83 242 277
Liberal Democrat 104 37 67 24 19 27 34 56 24 16 4 - 104 - 96 9 - 89 3 1 36 69 36 57 11 64 41
20% 18% 21% 18% 16% 20% 26% 21% 24% 14% 30% - 20% - 34% 4% - 22% 9% 3% 20% 20% 21% 21% 14% 26% 15%
Obama Democrat 102 36 65 34 23 25 19 41 20 37 1 - 102 - 53 40 8 85 1 1 30 71 32 50 20 42 60
20% 18% 21% 24% 20% 19% 15% 15% 20% 32% 5% - 20% - 19% 21% 18% 21% 4% 4% 17% 21% 19% 18% 24% 17% 22%
Moderate Democrat 73 29 44 9 15 21 27 44 2 22 4 - 73 - 21 51 1 61 1 6 33 40 25 40 8 38 35
14% 14% 14% 7% 13% 16% 21% 16% 2% 19% 29% - 14% - 8% 26% 2% 15% 4% 23% 18% 12% 15% 15% 9% 16% 13%
Conservative Democrat 33 10 23 15 3 6 9 19 4 10 - - 33 - 3 13 17 23 3 1 9 24 9 15 9 5 27
6% 5% 7% 11% 3% 4% 7% 7% 4% 9% - - 6% - 1% 7% 36% 6% 8% 4% 5% 7% 5% 6% 10% 2% 10%
Clinton Democrat 30 11 20 8 8 11 3 10 10 6 - - 30 - 12 14 4 23 7 - 9 22 15 13 3 12 19
6% 5% 6% 6% 7% 8% 2% 4% 9% 6% - - 6% - 4% 7% 9% 6% 21% - 5% 6% 9% 5% 3% 5% 7%
Democratic Socialist 26 14 13 5 7 9 4 17 8 1 - - 26 - 22 4 * 22 1 2 12 14 9 16 2 14 12
5% 7% 4% 4% 6% 7% 3% 6% 8% 1% - - 5% - 8% 2% 1% 6% 3% 9% 7% 4% 5% 6% 2% 6% 4%
Environmentalist 26 11 15 9 7 8 3 15 2 2 3 - 26 - 13 9 4 23 - * 12 14 5 16 5 13 13
5% 6% 5% 6% 6% 6% 2% 6% 2% 2% 23% - 5% - 5% 5% 8% 6% - 2% 6% 4% 3% 6% 6% 6% 5%
Fiscally Conservative 26 16 10 2 5 4 14 16 9 2 - - 26 - 13 12 1 17 2 2 10 16 8 14 4 15 11
Democrat 5% 8% 3% 2% 5% 3% 11% 6% 8% 1% - - 5% - 5% 6% 2% 4% 8% 6% 6% 5% 5% 5% 5% 6% 4%
Socially Conservative 19 10 9 8 7 3 2 9 3 6 - - 19 - 6 11 2 13 5 - 9 10 10 7 3 11 8
Democrat 4% 5% 3% 5% 6% 2% 2% 3% 3% 5% - - 4% - 2% 6% 5% 3% 15% - 5% 3% 6% 2% 3% 5% 3%
Socialist 7 1 6 4 2 - 1 4 1 1 - - 7 - 5 2 - 6 1 * 1 6 3 3 1 3 4
1% 1% 2% 3% 2% - 1% 1% 1% 1% - - 1% - 2% 1% - 1% 2% 1% 1% 2% 2% 1% 1% 1% 1%
Libertarian 6 2 5 2 2 2 1 3 2 1 1 - 6 - 1 5 1 1 2 2 3 3 1 4 1 4 3
1% 1% 1% 1% 1% 2% 1% 1% 2% 1% 6% - 1% - * 2% 2% * 5% 9% 2% 1% * 2% 2% 1% 1%
Trump Democrat 6 4 2 2 * 2 1 5 - 1 - - 6 - 4 2 - 2 2 - 2 3 - 5 1 4 2
1% 2% 1% 2% * 2% 1% 2% - * - - 1% - 1% 1% - 1% 6% - 1% 1% - 2% 2% 1% 1%

Page 104
Fielding Period: November 27 - 28, 2018
HCAPS (Filtered on Registered Voters)
Weighted To The U.S. General Adult Population
30 Nov 2018
Table 92
LABEL1102D Which of the following labels do you most identify with as a Democrat?
Please rank your top three labels. Next to the first-ranked labels, enter ''1'', next to the second-ranked label, enter ''2''; next to the third-ranked label, enter ''3.''
You may select up to three options.
Summary Of Rank 1
Base: GOP
Presidential
Election Candidate
Gender Age Ethnicity Political Party Political Ideology Voted For Education Locale Income
_____________ ______________________ _______________________ ____________________ ____________________ _____________________ _____________ ________________ _________
Colle- Some
Cons- ge Gr- Colle- $75K Less
Hisp- Black Repub- Democ- Indep- Libe- Mode- erva- 3rd ad And ge Or Urb- Subu- Or Than
Total Male Female 18-34 35-49 50-64 65+ White anic /AA Other lican rat endent ral rate tive Clinton Trump Party Higher Less an rban Rural More $75K
______ _____ _______ _____ _____ _____ ____ _____ _____ _____ _____ ______ ______ ______ ______ ______ ______ ________ ______ _____ ______ ______ ____ _____ _____ ____ ____
Communist 5 * 4 4 * - - 1 2 1 - - 5 - 3 1 1 2 1 1 1 3 2 3 - 1 4
1% * 1% 3% * - - * 2% 1% - - 1% - 1% * 2% 1% 4% 2% 1% 1% 1% 1% - * 1%
Nationalist 3 1 2 - 1 * 1 2 1 - - - 3 - - 3 - 2 - - - 3 * 1 1 1 2
1% 1% 1% - 1% * 1% 1% 1% - - - 1% - - 2% - * - - - 1% * 1% 2% 1% 1%
Populist 3 1 2 2 * 1 - 1 1 1 - - 3 - 1 2 * * 1 - - 3 - 2 1 - 3
1% 1% * 1% * * - * 1% 1% - - 1% - * 1% 1% * 2% - - 1% - 1% 1% - 1%
Antifa 3 2 1 2 1 1 - 1 - 1 - - 3 - 3 - - 2 1 - 1 2 - 2 1 1 2
1% 1% * 1% * * - * - 1% - - 1% - 1% - - * 3% - 1% * - 1% 1% * 1%
Other 1 - 1 * 1 - - 1 - - - - 1 - * 1 - 1 - 1 1 - 1 1 - 1 1
* - * * 1% - - 1% - - - - * - * 1% - * - 2% 1% - 1% * - * *

Page 105
Fielding Period: November 27 - 28, 2018
HCAPS (Filtered on Registered Voters)
Weighted To The U.S. General Adult Population
30 Nov 2018
Table 93
LABEL1102D Which of the following labels do you most identify with as a Democrat?
Please rank your top three labels. Next to the first-ranked labels, enter ''1'', next to the second-ranked label, enter ''2''; next to the third-ranked label, enter ''3.''
You may select up to three options.
Summary Of Rank 2
Base: GOP
Presidential
Election Candidate
Gender Age Ethnicity Political Party Political Ideology Voted For Education Locale Income
_____________ ______________________ _______________________ ____________________ ____________________ _____________________ _____________ ________________ _________
Colle- Some
Cons- ge Gr- Colle- $75K Less
Hisp- Black Repub- Democ- Indep- Libe- Mode- erva- 3rd ad And ge Or Urb- Subu- Or Than
Total Male Female 18-34 35-49 50-64 65+ White anic /AA Other lican rat endent ral rate tive Clinton Trump Party Higher Less an rban Rural More $75K
______ _____ _______ _____ _____ _____ ____ _____ _____ _____ _____ ______ ______ ______ ______ ______ ______ ________ ______ _____ ______ ______ ____ _____ _____ ____ ____
Unweighted Base 526 211 315 148 131 133 114 324 52 119 11 - 526 - 298 185 43 397 36 25 213 313 183 255 88 202 323
Weighted Base 521 204 317 139 117 136 129 269 101 113 13 - 521 - 280 194 47 397 33 25 180 340 169 268 83 242 277
Obama Democrat 87 40 46 10 18 30 28 40 15 24 2 - 87 - 48 32 6 84 1 * 28 59 36 40 12 48 39
17% 20% 15% 7% 15% 22% 22% 15% 15% 22% 12% - 17% - 17% 17% 14% 21% 3% 2% 15% 17% 21% 15% 14% 20% 14%
Environmentalist 71 29 41 25 9 17 20 37 18 8 3 - 71 - 42 24 5 54 6 - 26 45 19 42 9 32 39
14% 14% 13% 18% 7% 13% 15% 14% 17% 7% 23% - 14% - 15% 12% 10% 14% 19% - 14% 13% 12% 16% 11% 13% 14%
Liberal Democrat 52 19 33 13 17 10 12 28 11 9 - - 52 - 40 10 3 48 3 - 21 32 15 32 5 24 28
10% 9% 10% 10% 15% 7% 9% 10% 11% 8% - - 10% - 14% 5% 5% 12% 8% - 11% 9% 9% 12% 6% 10% 10%
Moderate Democrat 47 21 26 14 11 11 11 28 8 11 - - 47 - 22 21 5 39 3 3 23 24 18 24 5 19 28
9% 10% 8% 10% 10% 8% 8% 10% 8% 10% - - 9% - 8% 11% 10% 10% 9% 12% 13% 7% 11% 9% 5% 8% 10%
Clinton Democrat 42 13 30 11 12 10 10 19 8 15 - - 42 - 13 27 2 34 - - 18 25 12 14 16 19 24
8% 6% 9% 8% 10% 7% 8% 7% 8% 14% - - 8% - 5% 14% 4% 9% - - 10% 7% 7% 5% 19% 8% 9%
Conservative Democrat 36 9 27 17 6 3 9 13 10 11 1 - 36 - 10 23 3 17 6 2 8 28 9 20 6 17 19
7% 4% 8% 13% 5% 3% 7% 5% 10% 10% 11% - 7% - 4% 12% 6% 4% 17% 6% 4% 8% 6% 8% 7% 7% 7%
Democratic Socialist 21 12 8 8 5 6 2 14 - 6 - - 21 - 15 4 2 17 - 1 6 14 4 12 4 11 10
4% 6% 3% 6% 4% 4% 2% 5% - 5% - - 4% - 5% 2% 4% 4% - 4% 3% 4% 2% 5% 5% 4% 4%
Fiscally Conservative 20 7 13 5 4 2 9 13 1 4 - - 20 - 12 6 2 16 1 1 12 8 8 10 2 11 9
Democrat 4% 3% 4% 4% 3% 2% 7% 5% 1% 4% - - 4% - 4% 3% 5% 4% 3% 6% 7% 2% 5% 4% 3% 5% 3%
Socially Conservative 19 4 16 9 6 2 2 10 5 3 * - 19 - 6 10 4 10 4 - 4 15 8 9 3 5 14
Democrat 4% 2% 5% 6% 5% 2% 2% 4% 5% 3% 3% - 4% - 2% 5% 8% 3% 14% - 2% 5% 5% 3% 3% 2% 5%
Socialist 14 5 9 5 5 5 - 5 4 2 3 - 14 - 9 2 3 14 1 - 3 11 2 10 2 5 9
3% 3% 3% 4% 4% 3% - 2% 4% 2% 23% - 3% - 3% 1% 6% 3% 3% - 2% 3% 1% 4% 3% 2% 3%
Trump Democrat 8 5 3 1 2 2 3 5 3 - - - 8 - 1 5 2 1 3 3 3 4 1 6 1 5 3
2% 2% 1% 1% 1% 2% 2% 2% 3% - - - 2% - 1% 2% 4% * 9% 14% 2% 1% 1% 2% 1% 2% 1%
Nationalist 8 5 2 4 * 3 - 2 - 5 - - 8 - 4 * 3 6 - 1 1 6 5 3 * 3 5
1% 3% 1% 3% * 3% - 1% - 4% - - 1% - 1% * 7% 2% - 2% 1% 2% 3% 1% * 1% 2%

Page 106
Fielding Period: November 27 - 28, 2018
HCAPS (Filtered on Registered Voters)
Weighted To The U.S. General Adult Population
30 Nov 2018
Table 93
LABEL1102D Which of the following labels do you most identify with as a Democrat?
Please rank your top three labels. Next to the first-ranked labels, enter ''1'', next to the second-ranked label, enter ''2''; next to the third-ranked label, enter ''3.''
You may select up to three options.
Summary Of Rank 2
Base: GOP
Presidential
Election Candidate
Gender Age Ethnicity Political Party Political Ideology Voted For Education Locale Income
_____________ ______________________ _______________________ ____________________ ____________________ _____________________ _____________ ________________ _________
Colle- Some
Cons- ge Gr- Colle- $75K Less
Hisp- Black Repub- Democ- Indep- Libe- Mode- erva- 3rd ad And ge Or Urb- Subu- Or Than
Total Male Female 18-34 35-49 50-64 65+ White anic /AA Other lican rat endent ral rate tive Clinton Trump Party Higher Less an rban Rural More $75K
______ _____ _______ _____ _____ _____ ____ _____ _____ _____ _____ ______ ______ ______ ______ ______ ______ ________ ______ _____ ______ ______ ____ _____ _____ ____ ____
Populist 7 4 3 * * 2 5 6 - 1 - - 7 - 7 - - 5 - 1 3 5 3 3 1 5 2
1% 2% 1% * * 1% 4% 2% - 1% - - 1% - 3% - - 1% - 3% 1% 1% 2% 1% 1% 2% 1%
Libertarian 4 3 1 2 1 1 - 1 2 1 - - 4 - 2 2 - * * 3 1 2 1 1 2 1 3
1% 1% * 2% 1% * - * 2% 1% - - 1% - 1% 1% - * 1% 11% 1% 1% * * 3% * 1%
Antifa 1 1 * * 1 - - 1 - - - - 1 - 1 - - 1 - - - 1 - 1 - 1 *
* * * * 1% - - * - - - - * - * - - * - - - * - * - * *
Communist 1 - 1 * * - - 1 - - - - 1 - - 1 - 1 - - - 1 1 - - * *
* - * * * - - * - - - - * - - * - * - - - * * - - * *
Other - - - - - - - - - - - - - - - - - - - - - - - - - - -
- - - - - - - - - - - - - - - - - - - - - - - - - - -

Page 107
Fielding Period: November 27 - 28, 2018
HCAPS (Filtered on Registered Voters)
Weighted To The U.S. General Adult Population
30 Nov 2018
Table 94
LABEL1102D Which of the following labels do you most identify with as a Democrat?
Please rank your top three labels. Next to the first-ranked labels, enter ''1'', next to the second-ranked label, enter ''2''; next to the third-ranked label, enter ''3.''
You may select up to three options.
Summary Of Rank 3
Base: GOP
Presidential
Election Candidate
Gender Age Ethnicity Political Party Political Ideology Voted For Education Locale Income
_____________ ______________________ _______________________ ____________________ ____________________ _____________________ _____________ ________________ _________
Colle- Some
Cons- ge Gr- Colle- $75K Less
Hisp- Black Repub- Democ- Indep- Libe- Mode- erva- 3rd ad And ge Or Urb- Subu- Or Than
Total Male Female 18-34 35-49 50-64 65+ White anic /AA Other lican rat endent ral rate tive Clinton Trump Party Higher Less an rban Rural More $75K
______ _____ _______ _____ _____ _____ ____ _____ _____ _____ _____ ______ ______ ______ ______ ______ ______ ________ ______ _____ ______ ______ ____ _____ _____ ____ ____
Unweighted Base 526 211 315 148 131 133 114 324 52 119 11 - 526 - 298 185 43 397 36 25 213 313 183 255 88 202 323
Weighted Base 521 204 317 139 117 136 129 269 101 113 13 - 521 - 280 194 47 397 33 25 180 340 169 268 83 242 277
Clinton Democrat 51 27 25 14 13 10 14 22 19 9 1 - 51 - 32 16 3 40 2 3 14 37 17 30 4 22 30
10% 13% 8% 10% 11% 8% 11% 8% 18% 8% 5% - 10% - 11% 9% 6% 10% 5% 11% 8% 11% 10% 11% 5% 9% 11%
Environmentalist 50 28 22 14 10 8 18 33 3 13 * - 50 - 36 11 3 47 3 - 23 27 15 30 5 36 14
10% 14% 7% 10% 9% 6% 14% 12% 3% 11% 3% - 10% - 13% 6% 7% 12% 8% - 13% 8% 9% 11% 5% 15% 5%
Moderate Democrat 48 14 33 5 9 15 18 24 6 17 - - 48 - 21 22 4 36 7 - 14 33 18 20 9 24 23
9% 7% 11% 4% 8% 11% 14% 9% 6% 15% - - 9% - 8% 11% 8% 9% 22% - 8% 10% 11% 7% 11% 10% 8%
Obama Democrat 43 16 27 15 13 5 10 21 9 10 - - 43 - 25 14 4 31 4 - 22 21 20 18 5 20 23
8% 8% 8% 11% 11% 4% 7% 8% 9% 9% - - 8% - 9% 7% 10% 8% 13% - 12% 6% 12% 7% 6% 8% 8%
Liberal Democrat 38 15 23 7 13 13 5 19 6 9 1 - 38 - 26 10 2 31 2 2 16 23 14 17 8 18 20
7% 7% 7% 5% 11% 10% 4% 7% 6% 8% 6% - 7% - 9% 5% 4% 8% 5% 6% 9% 7% 8% 6% 9% 8% 7%
Socially Conservative 28 8 20 13 8 8 - 8 12 8 - - 28 - 6 14 9 25 - 2 8 20 11 11 6 6 22
Democrat 5% 4% 6% 9% 6% 6% - 3% 11% 7% - - 5% - 2% 7% 19% 6% - 8% 5% 6% 7% 4% 7% 3% 8%
Democratic Socialist 28 11 17 10 2 9 6 14 5 7 1 - 28 - 18 9 * 27 - - 6 22 8 16 4 5 22
5% 5% 5% 8% 2% 7% 5% 5% 5% 6% 9% - 5% - 7% 5% 1% 7% - - 3% 6% 5% 6% 5% 2% 8%
Fiscally Conservative 25 13 12 3 2 8 12 17 4 4 - - 25 - 8 17 1 23 1 - 11 14 9 16 1 14 11
Democrat 5% 6% 4% 2% 2% 6% 9% 6% 4% 4% - - 5% - 3% 9% 2% 6% 2% - 6% 4% 5% 6% 1% 6% 4%
Conservative Democrat 20 9 11 2 6 9 4 12 4 3 - - 20 - 4 11 4 12 3 3 8 12 8 11 1 9 11
4% 4% 4% 1% 5% 6% 3% 4% 4% 2% - - 4% - 2% 6% 10% 3% 9% 11% 5% 3% 5% 4% 2% 4% 4%
Socialist 19 13 6 9 6 2 1 6 4 5 - - 19 - 12 4 3 11 1 2 7 12 7 6 6 9 10
4% 6% 2% 6% 5% 2% 1% 2% 4% 5% - - 4% - 4% 2% 6% 3% 3% 6% 4% 3% 4% 2% 7% 4% 3%
Libertarian 13 4 9 5 - 6 2 7 2 1 3 - 13 - 8 2 3 8 - 3 2 11 1 11 2 4 9
2% 2% 3% 3% - 5% 1% 3% 2% 1% 23% - 2% - 3% 1% 6% 2% - 11% 1% 3% * 4% 2% 2% 3%
Trump Democrat 7 - 7 3 3 1 * 6 1 - - - 7 - 4 3 1 4 3 - * 7 2 2 3 2 6
1% - 2% 2% 2% 1% * 2% 1% - - - 1% - 1% 1% 2% 1% 9% - * 2% 1% 1% 3% 1% 2%

Page 108
Fielding Period: November 27 - 28, 2018
HCAPS (Filtered on Registered Voters)
Weighted To The U.S. General Adult Population
30 Nov 2018
Table 94
LABEL1102D Which of the following labels do you most identify with as a Democrat?
Please rank your top three labels. Next to the first-ranked labels, enter ''1'', next to the second-ranked label, enter ''2''; next to the third-ranked label, enter ''3.''
You may select up to three options.
Summary Of Rank 3
Base: GOP
Presidential
Election Candidate
Gender Age Ethnicity Political Party Political Ideology Voted For Education Locale Income
_____________ ______________________ _______________________ ____________________ ____________________ _____________________ _____________ ________________ _________
Colle- Some
Cons- ge Gr- Colle- $75K Less
Hisp- Black Repub- Democ- Indep- Libe- Mode- erva- 3rd ad And ge Or Urb- Subu- Or Than
Total Male Female 18-34 35-49 50-64 65+ White anic /AA Other lican rat endent ral rate tive Clinton Trump Party Higher Less an rban Rural More $75K
______ _____ _______ _____ _____ _____ ____ _____ _____ _____ _____ ______ ______ ______ ______ ______ ______ ________ ______ _____ ______ ______ ____ _____ _____ ____ ____
Nationalist 5 4 1 4 * - 1 1 - 2 - - 5 - 3 2 - 2 1 - 1 3 2 2 * 2 3
1% 2% * 3% * - 1% * - 2% - - 1% - 1% 1% - 1% 2% - 1% 1% 1% 1% * 1% 1%
Other 3 2 1 - 1 - 2 3 - - - - 3 - 2 1 - 2 - 1 2 1 - 3 - 3 -
1% 1% * - 1% - 2% 1% - - - - 1% - 1% 1% - 1% - 5% 1% * - 1% - 1% -
Antifa 3 * 2 3 - - - 2 - - - - 3 - 1 2 - 1 - * 2 1 * 2 - 2 1
1% * 1% 2% - - - 1% - - - - 1% - * 1% - * - 2% 1% * * 1% - 1% *
Communist 2 * 1 1 1 1 - 1 * 1 - - 2 - 1 1 - - 1 * * 1 * * 1 - 2
* * * * 1% * - * * 1% - - * - * * - - 2% 1% * * * * 1% - 1%
Populist 2 2 - 2 - - - 2 - - - - 2 - 2 - - 2 - - - 2 - 2 - 2 -
* 1% - 1% - - - 1% - - - - * - 1% - - * - - - 1% - 1% - 1% -

Page 109
Fielding Period: November 27 - 28, 2018
HCAPS (Filtered on Registered Voters)
Weighted To The U.S. General Adult Population
30 Nov 2018
Table 95
LABEL1102D Which of the following labels do you most identify with as a Democrat?
Please rank your top three labels. Next to the first-ranked labels, enter ''1'', next to the second-ranked label, enter ''2''; next to the third-ranked label, enter ''3.''
You may select up to three options.
Summary Of Rank 1,2,3
Base: GOP
Presidential
Election Candidate
Gender Age Ethnicity Political Party Political Ideology Voted For Education Locale Income
_____________ ______________________ _______________________ ____________________ ____________________ _____________________ _____________ ________________ _________
Colle- Some
Cons- ge Gr- Colle- $75K Less
Hisp- Black Repub- Democ- Indep- Libe- Mode- erva- 3rd ad And ge Or Urb- Subu- Or Than
Total Male Female 18-34 35-49 50-64 65+ White anic /AA Other lican rat endent ral rate tive Clinton Trump Party Higher Less an rban Rural More $75K
______ _____ _______ _____ _____ _____ ____ _____ _____ _____ _____ ______ ______ ______ ______ ______ ______ ________ ______ _____ ______ ______ ____ _____ _____ ____ ____
Unweighted Base 526 211 315 148 131 133 114 324 52 119 11 - 526 - 298 185 43 397 36 25 213 313 183 255 88 202 323
Weighted Base 521 204 317 139 117 136 129 269 101 113 13 - 521 - 280 194 47 397 33 25 180 340 169 268 83 242 277
Obama Democrat 231 93 138 60 54 61 57 102 45 71 2 - 231 - 126 86 19 199 6 1 80 151 88 107 37 109 122
44% 46% 44% 43% 46% 45% 44% 38% 44% 63% 17% - 44% - 45% 44% 41% 50% 20% 6% 44% 45% 52% 40% 44% 45% 44%
Liberal Democrat 195 71 124 45 49 50 51 103 41 34 5 - 195 - 162 28 4 168 7 2 72 123 65 105 24 106 88
37% 35% 39% 32% 42% 37% 39% 38% 40% 30% 36% - 37% - 58% 15% 9% 42% 23% 9% 40% 36% 39% 39% 29% 44% 32%
Moderate Democrat 167 64 103 29 36 47 56 96 17 50 4 - 167 - 65 94 9 137 12 9 71 97 62 84 21 82 86
32% 31% 33% 21% 31% 35% 43% 36% 16% 44% 29% - 32% - 23% 48% 20% 35% 35% 35% 39% 28% 37% 31% 26% 34% 31%
Environmentalist 147 69 78 48 25 33 41 85 23 22 6 - 147 - 91 44 12 125 9 * 61 86 40 88 19 81 65
28% 34% 25% 35% 22% 24% 31% 32% 23% 20% 49% - 28% - 32% 23% 25% 32% 28% 2% 34% 25% 24% 33% 23% 34% 24%
Clinton Democrat 124 50 74 33 33 32 27 51 36 31 1 - 124 - 58 57 9 97 9 3 41 84 44 57 23 52 72
24% 25% 23% 24% 29% 23% 21% 19% 36% 28% 5% - 24% - 21% 30% 20% 24% 26% 11% 22% 25% 26% 21% 28% 22% 26%
Conservative Democrat 88 27 61 34 15 18 21 43 18 24 1 - 88 - 17 47 24 52 11 5 25 63 26 46 16 31 57
17% 13% 19% 25% 13% 13% 16% 16% 18% 21% 11% - 17% - 6% 24% 52% 13% 34% 21% 14% 19% 16% 17% 19% 13% 21%
Democratic Socialist 75 37 38 24 14 24 13 45 13 13 1 - 75 - 55 17 3 65 1 3 25 50 21 44 10 30 45
14% 18% 12% 17% 12% 18% 10% 17% 13% 12% 9% - 14% - 20% 9% 6% 16% 3% 13% 14% 15% 12% 16% 12% 12% 16%
Fiscally Conservative 71 36 36 11 11 14 35 46 14 10 - - 71 - 33 34 4 55 4 3 34 37 24 40 7 40 31
Democrat 14% 17% 11% 8% 10% 10% 27% 17% 13% 9% - - 14% - 12% 18% 8% 14% 13% 12% 19% 11% 14% 15% 8% 17% 11%
Socially Conservative 67 22 45 29 20 13 5 26 20 18 * - 67 - 17 35 15 48 9 2 22 46 30 26 11 23 44
Democrat 13% 11% 14% 21% 17% 10% 4% 10% 19% 16% 3% - 13% - 6% 18% 32% 12% 28% 8% 12% 13% 18% 10% 13% 9% 16%
Socialist 40 19 21 17 13 7 3 15 9 9 3 - 40 - 26 8 6 30 2 2 11 29 13 18 9 17 23
8% 10% 7% 13% 11% 5% 2% 5% 9% 8% 23% - 8% - 9% 4% 12% 8% 7% 7% 6% 8% 8% 7% 11% 7% 8%
Libertarian 23 9 14 9 2 9 3 11 6 2 4 - 23 - 11 8 4 9 2 8 7 16 2 16 5 8 15
4% 4% 4% 6% 2% 7% 2% 4% 6% 2% 29% - 4% - 4% 4% 8% 2% 5% 30% 4% 5% 1% 6% 6% 3% 5%
Trump Democrat 21 8 13 6 5 6 4 16 4 1 - - 21 - 9 9 3 8 8 3 6 15 3 13 5 10 11
4% 4% 4% 5% 4% 4% 3% 6% 4% * - - 4% - 3% 5% 6% 2% 23% 14% 3% 4% 2% 5% 6% 4% 4%

Page 110
Fielding Period: November 27 - 28, 2018
HCAPS (Filtered on Registered Voters)
Weighted To The U.S. General Adult Population
30 Nov 2018
Table 95
LABEL1102D Which of the following labels do you most identify with as a Democrat?
Please rank your top three labels. Next to the first-ranked labels, enter ''1'', next to the second-ranked label, enter ''2''; next to the third-ranked label, enter ''3.''
You may select up to three options.
Summary Of Rank 1,2,3
Base: GOP
Presidential
Election Candidate
Gender Age Ethnicity Political Party Political Ideology Voted For Education Locale Income
_____________ ______________________ _______________________ ____________________ ____________________ _____________________ _____________ ________________ _________
Colle- Some
Cons- ge Gr- Colle- $75K Less
Hisp- Black Repub- Democ- Indep- Libe- Mode- erva- 3rd ad And ge Or Urb- Subu- Or Than
Total Male Female 18-34 35-49 50-64 65+ White anic /AA Other lican rat endent ral rate tive Clinton Trump Party Higher Less an rban Rural More $75K
______ _____ _______ _____ _____ _____ ____ _____ _____ _____ _____ ______ ______ ______ ______ ______ ______ ________ ______ _____ ______ ______ ____ _____ _____ ____ ____
Nationalist 16 11 5 8 2 4 2 5 1 7 - - 16 - 7 5 3 10 1 1 3 13 7 6 2 6 10
3% 5% 2% 5% 2% 3% 2% 2% 1% 6% - - 3% - 2% 3% 7% 3% 2% 2% 1% 4% 4% 2% 2% 2% 3%
Populist 12 7 4 4 1 2 5 9 1 1 - - 12 - 9 2 * 7 1 1 3 9 3 6 2 7 5
2% 4% 1% 3% * 2% 4% 3% 1% 1% - - 2% - 3% 1% 1% 2% 2% 3% 1% 3% 2% 2% 3% 3% 2%
Communist 7 1 6 5 1 1 - 2 2 2 - - 7 - 4 2 1 3 2 1 2 5 3 3 1 1 6
1% * 2% 4% 1% * - 1% 2% 1% - - 1% - 2% 1% 2% 1% 6% 3% 1% 2% 2% 1% 1% 1% 2%
Antifa 7 3 3 5 1 1 - 4 - 1 - - 7 - 5 2 - 4 1 * 3 4 * 6 1 4 3
1% 2% 1% 4% 1% * - 1% - 1% - - 1% - 2% 1% - 1% 3% 2% 2% 1% * 2% 1% 1% 1%
Other 5 2 3 * 2 - 2 5 - - - - 5 - 3 2 - 3 - 2 4 1 1 4 - 4 1
1% 1% 1% * 2% - 2% 2% - - - - 1% - 1% 1% - 1% - 7% 2% * 1% 1% - 2% *

Page 111
Fielding Period: November 27 - 28, 2018
HCAPS (Filtered on Registered Voters)
Weighted To The U.S. General Adult Population
30 Nov 2018
Table 96
LABEL1102D_1 Which of the following labels do you most identify with as a Democrat?
Please rank your top three labels. Next to the first-ranked labels, enter ''1'', next to the second-ranked label, enter ''2''; next to the third-ranked label, enter ''3.''
You may select up to three options.
Democratic Socialist
Base: GOP
Presidential
Election Candidate
Gender Age Ethnicity Political Party Political Ideology Voted For Education Locale Income
_____________ ______________________ _______________________ ____________________ ____________________ _____________________ _____________ ________________ _________
Colle- Some
Cons- ge Gr- Colle- $75K Less
Hisp- Black Repub- Democ- Indep- Libe- Mode- erva- 3rd ad And ge Or Urb- Subu- Or Than
Total Male Female 18-34 35-49 50-64 65+ White anic /AA Other lican rat endent ral rate tive Clinton Trump Party Higher Less an rban Rural More $75K
______ _____ _______ _____ _____ _____ ____ _____ _____ _____ _____ ______ ______ ______ ______ ______ ______ ________ ______ _____ ______ ______ ____ _____ _____ ____ ____
Unweighted Base 526 211 315 148 131 133 114 324 52 119 11 - 526 - 298 185 43 397 36 25 213 313 183 255 88 202 323
Weighted Base 521 204 317 139 117 136 129 269 101 113 13 - 521 - 280 194 47 397 33 25 180 340 169 268 83 242 277
Rank 1 26 14 13 5 7 9 4 17 8 1 - - 26 - 22 4 * 22 1 2 12 14 9 16 2 14 12
5% 7% 4% 4% 6% 7% 3% 6% 8% 1% - - 5% - 8% 2% 1% 6% 3% 9% 7% 4% 5% 6% 2% 6% 4%
Rank 2 21 12 8 8 5 6 2 14 - 6 - - 21 - 15 4 2 17 - 1 6 14 4 12 4 11 10
4% 6% 3% 6% 4% 4% 2% 5% - 5% - - 4% - 5% 2% 4% 4% - 4% 3% 4% 2% 5% 5% 4% 4%
Rank 3 28 11 17 10 2 9 6 14 5 7 1 - 28 - 18 9 * 27 - - 6 22 8 16 4 5 22
5% 5% 5% 8% 2% 7% 5% 5% 5% 6% 9% - 5% - 7% 5% 1% 7% - - 3% 6% 5% 6% 5% 2% 8%
None of these 46 16 30 8 14 15 9 25 10 8 1 - 46 - 23 16 7 26 2 8 9 37 12 21 13 13 32
9% 8% 9% 6% 12% 11% 7% 9% 10% 7% 8% - 9% - 8% 8% 14% 6% 7% 34% 5% 11% 7% 8% 15% 6% 12%
No Answer 400 150 249 107 88 97 108 200 78 92 11 - 400 - 202 161 37 306 29 13 146 253 136 203 61 199 201
77% 74% 79% 77% 76% 71% 83% 74% 77% 81% 83% - 77% - 72% 83% 80% 77% 91% 53% 81% 74% 81% 76% 73% 82% 72%
Sigma 521 204 317 139 117 136 129 269 101 113 13 - 521 - 280 194 47 397 33 25 180 340 169 268 83 242 277
100% 100% 100% 100% 100% 100% 100% 100% 100% 100% 100% - 100% - 100% 100% 100% 100% 100% 100% 100% 100% 100% 100% 100% 100% 100%

Page 112
Fielding Period: November 27 - 28, 2018
HCAPS (Filtered on Registered Voters)
Weighted To The U.S. General Adult Population
30 Nov 2018
Table 97
LABEL1102D_2 Which of the following labels do you most identify with as a Democrat?
Please rank your top three labels. Next to the first-ranked labels, enter ''1'', next to the second-ranked label, enter ''2''; next to the third-ranked label, enter ''3.''
You may select up to three options.
Liberal Democrat
Base: GOP
Presidential
Election Candidate
Gender Age Ethnicity Political Party Political Ideology Voted For Education Locale Income
_____________ ______________________ _______________________ ____________________ ____________________ _____________________ _____________ ________________ _________
Colle- Some
Cons- ge Gr- Colle- $75K Less
Hisp- Black Repub- Democ- Indep- Libe- Mode- erva- 3rd ad And ge Or Urb- Subu- Or Than
Total Male Female 18-34 35-49 50-64 65+ White anic /AA Other lican rat endent ral rate tive Clinton Trump Party Higher Less an rban Rural More $75K
______ _____ _______ _____ _____ _____ ____ _____ _____ _____ _____ ______ ______ ______ ______ ______ ______ ________ ______ _____ ______ ______ ____ _____ _____ ____ ____
Unweighted Base 526 211 315 148 131 133 114 324 52 119 11 - 526 - 298 185 43 397 36 25 213 313 183 255 88 202 323
Weighted Base 521 204 317 139 117 136 129 269 101 113 13 - 521 - 280 194 47 397 33 25 180 340 169 268 83 242 277
Rank 1 104 37 67 24 19 27 34 56 24 16 4 - 104 - 96 9 - 89 3 1 36 69 36 57 11 64 41
20% 18% 21% 18% 16% 20% 26% 21% 24% 14% 30% - 20% - 34% 4% - 22% 9% 3% 20% 20% 21% 21% 14% 26% 15%
Rank 2 52 19 33 13 17 10 12 28 11 9 - - 52 - 40 10 3 48 3 - 21 32 15 32 5 24 28
10% 9% 10% 10% 15% 7% 9% 10% 11% 8% - - 10% - 14% 5% 5% 12% 8% - 11% 9% 9% 12% 6% 10% 10%
Rank 3 38 15 23 7 13 13 5 19 6 9 1 - 38 - 26 10 2 31 2 2 16 23 14 17 8 18 20
7% 7% 7% 5% 11% 10% 4% 7% 6% 8% 6% - 7% - 9% 5% 4% 8% 5% 6% 9% 7% 8% 6% 9% 8% 7%
None of these 46 16 30 8 14 15 9 25 10 8 1 - 46 - 23 16 7 26 2 8 9 37 12 21 13 13 32
9% 8% 9% 6% 12% 11% 7% 9% 10% 7% 8% - 9% - 8% 8% 14% 6% 7% 34% 5% 11% 7% 8% 15% 6% 12%
No Answer 280 116 163 86 53 70 70 141 50 72 7 - 280 - 95 149 36 203 23 14 99 180 92 142 46 123 157
54% 57% 52% 62% 46% 52% 54% 53% 50% 63% 56% - 54% - 34% 77% 77% 51% 70% 57% 55% 53% 54% 53% 56% 51% 57%
Sigma 521 204 317 139 117 136 129 269 101 113 13 - 521 - 280 194 47 397 33 25 180 340 169 268 83 242 277
100% 100% 100% 100% 100% 100% 100% 100% 100% 100% 100% - 100% - 100% 100% 100% 100% 100% 100% 100% 100% 100% 100% 100% 100% 100%

Page 113
Fielding Period: November 27 - 28, 2018
HCAPS (Filtered on Registered Voters)
Weighted To The U.S. General Adult Population
30 Nov 2018
Table 98
LABEL1102D_3 Which of the following labels do you most identify with as a Democrat?
Please rank your top three labels. Next to the first-ranked labels, enter ''1'', next to the second-ranked label, enter ''2''; next to the third-ranked label, enter ''3.''
You may select up to three options.
Moderate Democrat
Base: GOP
Presidential
Election Candidate
Gender Age Ethnicity Political Party Political Ideology Voted For Education Locale Income
_____________ ______________________ _______________________ ____________________ ____________________ _____________________ _____________ ________________ _________
Colle- Some
Cons- ge Gr- Colle- $75K Less
Hisp- Black Repub- Democ- Indep- Libe- Mode- erva- 3rd ad And ge Or Urb- Subu- Or Than
Total Male Female 18-34 35-49 50-64 65+ White anic /AA Other lican rat endent ral rate tive Clinton Trump Party Higher Less an rban Rural More $75K
______ _____ _______ _____ _____ _____ ____ _____ _____ _____ _____ ______ ______ ______ ______ ______ ______ ________ ______ _____ ______ ______ ____ _____ _____ ____ ____
Unweighted Base 526 211 315 148 131 133 114 324 52 119 11 - 526 - 298 185 43 397 36 25 213 313 183 255 88 202 323
Weighted Base 521 204 317 139 117 136 129 269 101 113 13 - 521 - 280 194 47 397 33 25 180 340 169 268 83 242 277
Rank 1 73 29 44 9 15 21 27 44 2 22 4 - 73 - 21 51 1 61 1 6 33 40 25 40 8 38 35
14% 14% 14% 7% 13% 16% 21% 16% 2% 19% 29% - 14% - 8% 26% 2% 15% 4% 23% 18% 12% 15% 15% 9% 16% 13%
Rank 2 47 21 26 14 11 11 11 28 8 11 - - 47 - 22 21 5 39 3 3 23 24 18 24 5 19 28
9% 10% 8% 10% 10% 8% 8% 10% 8% 10% - - 9% - 8% 11% 10% 10% 9% 12% 13% 7% 11% 9% 5% 8% 10%
Rank 3 48 14 33 5 9 15 18 24 6 17 - - 48 - 21 22 4 36 7 - 14 33 18 20 9 24 23
9% 7% 11% 4% 8% 11% 14% 9% 6% 15% - - 9% - 8% 11% 8% 9% 22% - 8% 10% 11% 7% 11% 10% 8%
None of these 46 16 30 8 14 15 9 25 10 8 1 - 46 - 23 16 7 26 2 8 9 37 12 21 13 13 32
9% 8% 9% 6% 12% 11% 7% 9% 10% 7% 8% - 9% - 8% 8% 14% 6% 7% 34% 5% 11% 7% 8% 15% 6% 12%
No Answer 307 123 184 102 67 73 64 148 74 56 8 - 307 - 192 84 31 234 19 8 100 207 95 162 49 147 160
59% 61% 58% 74% 57% 54% 50% 55% 73% 49% 63% - 59% - 69% 43% 66% 59% 58% 31% 56% 61% 56% 61% 59% 61% 58%
Sigma 521 204 317 139 117 136 129 269 101 113 13 - 521 - 280 194 47 397 33 25 180 340 169 268 83 242 277
100% 100% 100% 100% 100% 100% 100% 100% 100% 100% 100% - 100% - 100% 100% 100% 100% 100% 100% 100% 100% 100% 100% 100% 100% 100%

Page 114
Fielding Period: November 27 - 28, 2018
HCAPS (Filtered on Registered Voters)
Weighted To The U.S. General Adult Population
30 Nov 2018
Table 99
LABEL1102D_4 Which of the following labels do you most identify with as a Democrat?
Please rank your top three labels. Next to the first-ranked labels, enter ''1'', next to the second-ranked label, enter ''2''; next to the third-ranked label, enter ''3.''
You may select up to three options.
Conservative Democrat
Base: GOP
Presidential
Election Candidate
Gender Age Ethnicity Political Party Political Ideology Voted For Education Locale Income
_____________ ______________________ _______________________ ____________________ ____________________ _____________________ _____________ ________________ _________
Colle- Some
Cons- ge Gr- Colle- $75K Less
Hisp- Black Repub- Democ- Indep- Libe- Mode- erva- 3rd ad And ge Or Urb- Subu- Or Than
Total Male Female 18-34 35-49 50-64 65+ White anic /AA Other lican rat endent ral rate tive Clinton Trump Party Higher Less an rban Rural More $75K
______ _____ _______ _____ _____ _____ ____ _____ _____ _____ _____ ______ ______ ______ ______ ______ ______ ________ ______ _____ ______ ______ ____ _____ _____ ____ ____
Unweighted Base 526 211 315 148 131 133 114 324 52 119 11 - 526 - 298 185 43 397 36 25 213 313 183 255 88 202 323
Weighted Base 521 204 317 139 117 136 129 269 101 113 13 - 521 - 280 194 47 397 33 25 180 340 169 268 83 242 277
Rank 1 33 10 23 15 3 6 9 19 4 10 - - 33 - 3 13 17 23 3 1 9 24 9 15 9 5 27
6% 5% 7% 11% 3% 4% 7% 7% 4% 9% - - 6% - 1% 7% 36% 6% 8% 4% 5% 7% 5% 6% 10% 2% 10%
Rank 2 36 9 27 17 6 3 9 13 10 11 1 - 36 - 10 23 3 17 6 2 8 28 9 20 6 17 19
7% 4% 8% 13% 5% 3% 7% 5% 10% 10% 11% - 7% - 4% 12% 6% 4% 17% 6% 4% 8% 6% 8% 7% 7% 7%
Rank 3 20 9 11 2 6 9 4 12 4 3 - - 20 - 4 11 4 12 3 3 8 12 8 11 1 9 11
4% 4% 4% 1% 5% 6% 3% 4% 4% 2% - - 4% - 2% 6% 10% 3% 9% 11% 5% 3% 5% 4% 2% 4% 4%
None of these 46 16 30 8 14 15 9 25 10 8 1 - 46 - 23 16 7 26 2 8 9 37 12 21 13 13 32
9% 8% 9% 6% 12% 11% 7% 9% 10% 7% 8% - 9% - 8% 8% 14% 6% 7% 34% 5% 11% 7% 8% 15% 6% 12%
No Answer 386 160 226 97 87 103 99 201 72 82 10 - 386 - 240 131 16 320 19 11 146 240 131 201 55 198 188
74% 79% 71% 70% 75% 76% 77% 75% 72% 72% 81% - 74% - 86% 67% 34% 81% 59% 45% 81% 70% 77% 75% 66% 82% 68%
Sigma 521 204 317 139 117 136 129 269 101 113 13 - 521 - 280 194 47 397 33 25 180 340 169 268 83 242 277
100% 100% 100% 100% 100% 100% 100% 100% 100% 100% 100% - 100% - 100% 100% 100% 100% 100% 100% 100% 100% 100% 100% 100% 100% 100%

Page 115
Fielding Period: November 27 - 28, 2018
HCAPS (Filtered on Registered Voters)
Weighted To The U.S. General Adult Population
30 Nov 2018
Table 100
LABEL1102D_5 Which of the following labels do you most identify with as a Democrat?
Please rank your top three labels. Next to the first-ranked labels, enter ''1'', next to the second-ranked label, enter ''2''; next to the third-ranked label, enter ''3.''
You may select up to three options.
Fiscally Conservative Democrat
Base: GOP
Presidential
Election Candidate
Gender Age Ethnicity Political Party Political Ideology Voted For Education Locale Income
_____________ ______________________ _______________________ ____________________ ____________________ _____________________ _____________ ________________ _________
Colle- Some
Cons- ge Gr- Colle- $75K Less
Hisp- Black Repub- Democ- Indep- Libe- Mode- erva- 3rd ad And ge Or Urb- Subu- Or Than
Total Male Female 18-34 35-49 50-64 65+ White anic /AA Other lican rat endent ral rate tive Clinton Trump Party Higher Less an rban Rural More $75K
______ _____ _______ _____ _____ _____ ____ _____ _____ _____ _____ ______ ______ ______ ______ ______ ______ ________ ______ _____ ______ ______ ____ _____ _____ ____ ____
Unweighted Base 526 211 315 148 131 133 114 324 52 119 11 - 526 - 298 185 43 397 36 25 213 313 183 255 88 202 323
Weighted Base 521 204 317 139 117 136 129 269 101 113 13 - 521 - 280 194 47 397 33 25 180 340 169 268 83 242 277
Rank 1 26 16 10 2 5 4 14 16 9 2 - - 26 - 13 12 1 17 2 2 10 16 8 14 4 15 11
5% 8% 3% 2% 5% 3% 11% 6% 8% 1% - - 5% - 5% 6% 2% 4% 8% 6% 6% 5% 5% 5% 5% 6% 4%
Rank 2 20 7 13 5 4 2 9 13 1 4 - - 20 - 12 6 2 16 1 1 12 8 8 10 2 11 9
4% 3% 4% 4% 3% 2% 7% 5% 1% 4% - - 4% - 4% 3% 5% 4% 3% 6% 7% 2% 5% 4% 3% 5% 3%
Rank 3 25 13 12 3 2 8 12 17 4 4 - - 25 - 8 17 1 23 1 - 11 14 9 16 1 14 11
5% 6% 4% 2% 2% 6% 9% 6% 4% 4% - - 5% - 3% 9% 2% 6% 2% - 6% 4% 5% 6% 1% 6% 4%
None of these 46 16 30 8 14 15 9 25 10 8 1 - 46 - 23 16 7 26 2 8 9 37 12 21 13 13 32
9% 8% 9% 6% 12% 11% 7% 9% 10% 7% 8% - 9% - 8% 8% 14% 6% 7% 34% 5% 11% 7% 8% 15% 6% 12%
No Answer 403 152 252 120 91 106 85 198 77 95 12 - 403 - 223 144 36 316 26 14 137 266 133 207 64 189 215
77% 75% 79% 87% 78% 78% 66% 74% 76% 84% 92% - 77% - 80% 74% 77% 80% 81% 54% 76% 78% 79% 77% 77% 78% 77%
Sigma 521 204 317 139 117 136 129 269 101 113 13 - 521 - 280 194 47 397 33 25 180 340 169 268 83 242 277
100% 100% 100% 100% 100% 100% 100% 100% 100% 100% 100% - 100% - 100% 100% 100% 100% 100% 100% 100% 100% 100% 100% 100% 100% 100%

Page 116
Fielding Period: November 27 - 28, 2018
HCAPS (Filtered on Registered Voters)
Weighted To The U.S. General Adult Population
30 Nov 2018
Table 101
LABEL1102D_6 Which of the following labels do you most identify with as a Democrat?
Please rank your top three labels. Next to the first-ranked labels, enter ''1'', next to the second-ranked label, enter ''2''; next to the third-ranked label, enter ''3.''
You may select up to three options.
Socially Conservative Democrat
Base: GOP
Presidential
Election Candidate
Gender Age Ethnicity Political Party Political Ideology Voted For Education Locale Income
_____________ ______________________ _______________________ ____________________ ____________________ _____________________ _____________ ________________ _________
Colle- Some
Cons- ge Gr- Colle- $75K Less
Hisp- Black Repub- Democ- Indep- Libe- Mode- erva- 3rd ad And ge Or Urb- Subu- Or Than
Total Male Female 18-34 35-49 50-64 65+ White anic /AA Other lican rat endent ral rate tive Clinton Trump Party Higher Less an rban Rural More $75K
______ _____ _______ _____ _____ _____ ____ _____ _____ _____ _____ ______ ______ ______ ______ ______ ______ ________ ______ _____ ______ ______ ____ _____ _____ ____ ____
Unweighted Base 526 211 315 148 131 133 114 324 52 119 11 - 526 - 298 185 43 397 36 25 213 313 183 255 88 202 323
Weighted Base 521 204 317 139 117 136 129 269 101 113 13 - 521 - 280 194 47 397 33 25 180 340 169 268 83 242 277
Rank 1 19 10 9 8 7 3 2 9 3 6 - - 19 - 6 11 2 13 5 - 9 10 10 7 3 11 8
4% 5% 3% 5% 6% 2% 2% 3% 3% 5% - - 4% - 2% 6% 5% 3% 15% - 5% 3% 6% 2% 3% 5% 3%
Rank 2 19 4 16 9 6 2 2 10 5 3 * - 19 - 6 10 4 10 4 - 4 15 8 9 3 5 14
4% 2% 5% 6% 5% 2% 2% 4% 5% 3% 3% - 4% - 2% 5% 8% 3% 14% - 2% 5% 5% 3% 3% 2% 5%
Rank 3 28 8 20 13 8 8 - 8 12 8 - - 28 - 6 14 9 25 - 2 8 20 11 11 6 6 22
5% 4% 6% 9% 6% 6% - 3% 11% 7% - - 5% - 2% 7% 19% 6% - 8% 5% 6% 7% 4% 7% 3% 8%
None of these 46 16 30 8 14 15 9 25 10 8 1 - 46 - 23 16 7 26 2 8 9 37 12 21 13 13 32
9% 8% 9% 6% 12% 11% 7% 9% 10% 7% 8% - 9% - 8% 8% 14% 6% 7% 34% 5% 11% 7% 8% 15% 6% 12%
No Answer 407 165 242 102 82 107 116 218 71 88 11 - 407 - 240 142 25 324 21 15 150 258 127 221 60 206 201
78% 81% 76% 73% 71% 79% 89% 81% 70% 77% 89% - 78% - 86% 74% 54% 82% 65% 59% 83% 76% 75% 82% 71% 85% 73%
Sigma 521 204 317 139 117 136 129 269 101 113 13 - 521 - 280 194 47 397 33 25 180 340 169 268 83 242 277
100% 100% 100% 100% 100% 100% 100% 100% 100% 100% 100% - 100% - 100% 100% 100% 100% 100% 100% 100% 100% 100% 100% 100% 100% 100%

Page 117
Fielding Period: November 27 - 28, 2018
HCAPS (Filtered on Registered Voters)
Weighted To The U.S. General Adult Population
30 Nov 2018
Table 102
LABEL1102D_7 Which of the following labels do you most identify with as a Democrat?
Please rank your top three labels. Next to the first-ranked labels, enter ''1'', next to the second-ranked label, enter ''2''; next to the third-ranked label, enter ''3.''
You may select up to three options.
Clinton Democrat
Base: GOP
Presidential
Election Candidate
Gender Age Ethnicity Political Party Political Ideology Voted For Education Locale Income
_____________ ______________________ _______________________ ____________________ ____________________ _____________________ _____________ ________________ _________
Colle- Some
Cons- ge Gr- Colle- $75K Less
Hisp- Black Repub- Democ- Indep- Libe- Mode- erva- 3rd ad And ge Or Urb- Subu- Or Than
Total Male Female 18-34 35-49 50-64 65+ White anic /AA Other lican rat endent ral rate tive Clinton Trump Party Higher Less an rban Rural More $75K
______ _____ _______ _____ _____ _____ ____ _____ _____ _____ _____ ______ ______ ______ ______ ______ ______ ________ ______ _____ ______ ______ ____ _____ _____ ____ ____
Unweighted Base 526 211 315 148 131 133 114 324 52 119 11 - 526 - 298 185 43 397 36 25 213 313 183 255 88 202 323
Weighted Base 521 204 317 139 117 136 129 269 101 113 13 - 521 - 280 194 47 397 33 25 180 340 169 268 83 242 277
Rank 1 30 11 20 8 8 11 3 10 10 6 - - 30 - 12 14 4 23 7 - 9 22 15 13 3 12 19
6% 5% 6% 6% 7% 8% 2% 4% 9% 6% - - 6% - 4% 7% 9% 6% 21% - 5% 6% 9% 5% 3% 5% 7%
Rank 2 42 13 30 11 12 10 10 19 8 15 - - 42 - 13 27 2 34 - - 18 25 12 14 16 19 24
8% 6% 9% 8% 10% 7% 8% 7% 8% 14% - - 8% - 5% 14% 4% 9% - - 10% 7% 7% 5% 19% 8% 9%
Rank 3 51 27 25 14 13 10 14 22 19 9 1 - 51 - 32 16 3 40 2 3 14 37 17 30 4 22 30
10% 13% 8% 10% 11% 8% 11% 8% 18% 8% 5% - 10% - 11% 9% 6% 10% 5% 11% 8% 11% 10% 11% 5% 9% 11%
None of these 46 16 30 8 14 15 9 25 10 8 1 - 46 - 23 16 7 26 2 8 9 37 12 21 13 13 32
9% 8% 9% 6% 12% 11% 7% 9% 10% 7% 8% - 9% - 8% 8% 14% 6% 7% 34% 5% 11% 7% 8% 15% 6% 12%
No Answer 350 137 213 98 69 89 94 193 55 74 11 - 350 - 199 120 31 275 22 14 131 220 113 190 48 177 173
67% 67% 67% 71% 59% 65% 73% 72% 54% 66% 88% - 67% - 71% 62% 66% 69% 67% 56% 72% 65% 67% 71% 57% 73% 63%
Sigma 521 204 317 139 117 136 129 269 101 113 13 - 521 - 280 194 47 397 33 25 180 340 169 268 83 242 277
100% 100% 100% 100% 100% 100% 100% 100% 100% 100% 100% - 100% - 100% 100% 100% 100% 100% 100% 100% 100% 100% 100% 100% 100% 100%

Page 118
Fielding Period: November 27 - 28, 2018
HCAPS (Filtered on Registered Voters)
Weighted To The U.S. General Adult Population
30 Nov 2018
Table 103
LABEL1102D_8 Which of the following labels do you most identify with as a Democrat?
Please rank your top three labels. Next to the first-ranked labels, enter ''1'', next to the second-ranked label, enter ''2''; next to the third-ranked label, enter ''3.''
You may select up to three options.
Obama Democrat
Base: GOP
Presidential
Election Candidate
Gender Age Ethnicity Political Party Political Ideology Voted For Education Locale Income
_____________ ______________________ _______________________ ____________________ ____________________ _____________________ _____________ ________________ _________
Colle- Some
Cons- ge Gr- Colle- $75K Less
Hisp- Black Repub- Democ- Indep- Libe- Mode- erva- 3rd ad And ge Or Urb- Subu- Or Than
Total Male Female 18-34 35-49 50-64 65+ White anic /AA Other lican rat endent ral rate tive Clinton Trump Party Higher Less an rban Rural More $75K
______ _____ _______ _____ _____ _____ ____ _____ _____ _____ _____ ______ ______ ______ ______ ______ ______ ________ ______ _____ ______ ______ ____ _____ _____ ____ ____
Unweighted Base 526 211 315 148 131 133 114 324 52 119 11 - 526 - 298 185 43 397 36 25 213 313 183 255 88 202 323
Weighted Base 521 204 317 139 117 136 129 269 101 113 13 - 521 - 280 194 47 397 33 25 180 340 169 268 83 242 277
Rank 1 102 36 65 34 23 25 19 41 20 37 1 - 102 - 53 40 8 85 1 1 30 71 32 50 20 42 60
20% 18% 21% 24% 20% 19% 15% 15% 20% 32% 5% - 20% - 19% 21% 18% 21% 4% 4% 17% 21% 19% 18% 24% 17% 22%
Rank 2 87 40 46 10 18 30 28 40 15 24 2 - 87 - 48 32 6 84 1 * 28 59 36 40 12 48 39
17% 20% 15% 7% 15% 22% 22% 15% 15% 22% 12% - 17% - 17% 17% 14% 21% 3% 2% 15% 17% 21% 15% 14% 20% 14%
Rank 3 43 16 27 15 13 5 10 21 9 10 - - 43 - 25 14 4 31 4 - 22 21 20 18 5 20 23
8% 8% 8% 11% 11% 4% 7% 8% 9% 9% - - 8% - 9% 7% 10% 8% 13% - 12% 6% 12% 7% 6% 8% 8%
None of these 46 16 30 8 14 15 9 25 10 8 1 - 46 - 23 16 7 26 2 8 9 37 12 21 13 13 32
9% 8% 9% 6% 12% 11% 7% 9% 10% 7% 8% - 9% - 8% 8% 14% 6% 7% 34% 5% 11% 7% 8% 15% 6% 12%
No Answer 243 94 149 71 49 60 63 143 46 34 10 - 243 - 131 91 21 172 24 15 91 152 69 140 34 120 123
47% 46% 47% 52% 42% 44% 49% 53% 45% 30% 75% - 47% - 47% 47% 44% 43% 73% 60% 51% 45% 41% 52% 41% 49% 44%
Sigma 521 204 317 139 117 136 129 269 101 113 13 - 521 - 280 194 47 397 33 25 180 340 169 268 83 242 277
100% 100% 100% 100% 100% 100% 100% 100% 100% 100% 100% - 100% - 100% 100% 100% 100% 100% 100% 100% 100% 100% 100% 100% 100% 100%

Page 119
Fielding Period: November 27 - 28, 2018
HCAPS (Filtered on Registered Voters)
Weighted To The U.S. General Adult Population
30 Nov 2018
Table 104
LABEL1102D_9 Which of the following labels do you most identify with as a Democrat?
Please rank your top three labels. Next to the first-ranked labels, enter ''1'', next to the second-ranked label, enter ''2''; next to the third-ranked label, enter ''3.''
You may select up to three options.
Trump Democrat
Base: GOP
Presidential
Election Candidate
Gender Age Ethnicity Political Party Political Ideology Voted For Education Locale Income
_____________ ______________________ _______________________ ____________________ ____________________ _____________________ _____________ ________________ _________
Colle- Some
Cons- ge Gr- Colle- $75K Less
Hisp- Black Repub- Democ- Indep- Libe- Mode- erva- 3rd ad And ge Or Urb- Subu- Or Than
Total Male Female 18-34 35-49 50-64 65+ White anic /AA Other lican rat endent ral rate tive Clinton Trump Party Higher Less an rban Rural More $75K
______ _____ _______ _____ _____ _____ ____ _____ _____ _____ _____ ______ ______ ______ ______ ______ ______ ________ ______ _____ ______ ______ ____ _____ _____ ____ ____
Unweighted Base 526 211 315 148 131 133 114 324 52 119 11 - 526 - 298 185 43 397 36 25 213 313 183 255 88 202 323
Weighted Base 521 204 317 139 117 136 129 269 101 113 13 - 521 - 280 194 47 397 33 25 180 340 169 268 83 242 277
Rank 1 6 4 2 2 * 2 1 5 - 1 - - 6 - 4 2 - 2 2 - 2 3 - 5 1 4 2
1% 2% 1% 2% * 2% 1% 2% - * - - 1% - 1% 1% - 1% 6% - 1% 1% - 2% 2% 1% 1%
Rank 2 8 5 3 1 2 2 3 5 3 - - - 8 - 1 5 2 1 3 3 3 4 1 6 1 5 3
2% 2% 1% 1% 1% 2% 2% 2% 3% - - - 2% - 1% 2% 4% * 9% 14% 2% 1% 1% 2% 1% 2% 1%
Rank 3 7 - 7 3 3 1 * 6 1 - - - 7 - 4 3 1 4 3 - * 7 2 2 3 2 6
1% - 2% 2% 2% 1% * 2% 1% - - - 1% - 1% 1% 2% 1% 9% - * 2% 1% 1% 3% 1% 2%
None of these 46 16 30 8 14 15 9 25 10 8 1 - 46 - 23 16 7 26 2 8 9 37 12 21 13 13 32
9% 8% 9% 6% 12% 11% 7% 9% 10% 7% 8% - 9% - 8% 8% 14% 6% 7% 34% 5% 11% 7% 8% 15% 6% 12%
No Answer 453 179 274 125 98 115 116 228 86 105 12 - 453 - 247 168 38 364 23 13 165 288 153 234 66 219 234
87% 88% 87% 90% 84% 84% 90% 85% 86% 93% 92% - 87% - 88% 87% 80% 92% 70% 52% 91% 85% 91% 87% 79% 90% 85%
Sigma 521 204 317 139 117 136 129 269 101 113 13 - 521 - 280 194 47 397 33 25 180 340 169 268 83 242 277
100% 100% 100% 100% 100% 100% 100% 100% 100% 100% 100% - 100% - 100% 100% 100% 100% 100% 100% 100% 100% 100% 100% 100% 100% 100%

Page 120
Fielding Period: November 27 - 28, 2018
HCAPS (Filtered on Registered Voters)
Weighted To The U.S. General Adult Population
30 Nov 2018
Table 105
LABEL1102D_10 Which of the following labels do you most identify with as a Democrat?
Please rank your top three labels. Next to the first-ranked labels, enter ''1'', next to the second-ranked label, enter ''2''; next to the third-ranked label, enter ''3.''
You may select up to three options.
Socialist
Base: GOP
Presidential
Election Candidate
Gender Age Ethnicity Political Party Political Ideology Voted For Education Locale Income
_____________ ______________________ _______________________ ____________________ ____________________ _____________________ _____________ ________________ _________
Colle- Some
Cons- ge Gr- Colle- $75K Less
Hisp- Black Repub- Democ- Indep- Libe- Mode- erva- 3rd ad And ge Or Urb- Subu- Or Than
Total Male Female 18-34 35-49 50-64 65+ White anic /AA Other lican rat endent ral rate tive Clinton Trump Party Higher Less an rban Rural More $75K
______ _____ _______ _____ _____ _____ ____ _____ _____ _____ _____ ______ ______ ______ ______ ______ ______ ________ ______ _____ ______ ______ ____ _____ _____ ____ ____
Unweighted Base 526 211 315 148 131 133 114 324 52 119 11 - 526 - 298 185 43 397 36 25 213 313 183 255 88 202 323
Weighted Base 521 204 317 139 117 136 129 269 101 113 13 - 521 - 280 194 47 397 33 25 180 340 169 268 83 242 277
Rank 1 7 1 6 4 2 - 1 4 1 1 - - 7 - 5 2 - 6 1 * 1 6 3 3 1 3 4
1% 1% 2% 3% 2% - 1% 1% 1% 1% - - 1% - 2% 1% - 1% 2% 1% 1% 2% 2% 1% 1% 1% 1%
Rank 2 14 5 9 5 5 5 - 5 4 2 3 - 14 - 9 2 3 14 1 - 3 11 2 10 2 5 9
3% 3% 3% 4% 4% 3% - 2% 4% 2% 23% - 3% - 3% 1% 6% 3% 3% - 2% 3% 1% 4% 3% 2% 3%
Rank 3 19 13 6 9 6 2 1 6 4 5 - - 19 - 12 4 3 11 1 2 7 12 7 6 6 9 10
4% 6% 2% 6% 5% 2% 1% 2% 4% 5% - - 4% - 4% 2% 6% 3% 3% 6% 4% 3% 4% 2% 7% 4% 3%
None of these 46 16 30 8 14 15 9 25 10 8 1 - 46 - 23 16 7 26 2 8 9 37 12 21 13 13 32
9% 8% 9% 6% 12% 11% 7% 9% 10% 7% 8% - 9% - 8% 8% 14% 6% 7% 34% 5% 11% 7% 8% 15% 6% 12%
No Answer 434 168 266 114 90 114 118 230 82 97 9 - 434 - 231 169 34 341 28 15 160 275 144 229 62 212 223
83% 82% 84% 82% 77% 84% 91% 85% 81% 85% 69% - 83% - 82% 87% 73% 86% 86% 59% 89% 81% 85% 85% 74% 87% 80%
Sigma 521 204 317 139 117 136 129 269 101 113 13 - 521 - 280 194 47 397 33 25 180 340 169 268 83 242 277
100% 100% 100% 100% 100% 100% 100% 100% 100% 100% 100% - 100% - 100% 100% 100% 100% 100% 100% 100% 100% 100% 100% 100% 100% 100%

Page 121
Fielding Period: November 27 - 28, 2018
HCAPS (Filtered on Registered Voters)
Weighted To The U.S. General Adult Population
30 Nov 2018
Table 106
LABEL1102D_11 Which of the following labels do you most identify with as a Democrat?
Please rank your top three labels. Next to the first-ranked labels, enter ''1'', next to the second-ranked label, enter ''2''; next to the third-ranked label, enter ''3.''
You may select up to three options.
Communist
Base: GOP
Presidential
Election Candidate
Gender Age Ethnicity Political Party Political Ideology Voted For Education Locale Income
_____________ ______________________ _______________________ ____________________ ____________________ _____________________ _____________ ________________ _________
Colle- Some
Cons- ge Gr- Colle- $75K Less
Hisp- Black Repub- Democ- Indep- Libe- Mode- erva- 3rd ad And ge Or Urb- Subu- Or Than
Total Male Female 18-34 35-49 50-64 65+ White anic /AA Other lican rat endent ral rate tive Clinton Trump Party Higher Less an rban Rural More $75K
______ _____ _______ _____ _____ _____ ____ _____ _____ _____ _____ ______ ______ ______ ______ ______ ______ ________ ______ _____ ______ ______ ____ _____ _____ ____ ____
Unweighted Base 526 211 315 148 131 133 114 324 52 119 11 - 526 - 298 185 43 397 36 25 213 313 183 255 88 202 323
Weighted Base 521 204 317 139 117 136 129 269 101 113 13 - 521 - 280 194 47 397 33 25 180 340 169 268 83 242 277
Rank 1 5 * 4 4 * - - 1 2 1 - - 5 - 3 1 1 2 1 1 1 3 2 3 - 1 4
1% * 1% 3% * - - * 2% 1% - - 1% - 1% * 2% 1% 4% 2% 1% 1% 1% 1% - * 1%
Rank 2 1 - 1 * * - - 1 - - - - 1 - - 1 - 1 - - - 1 1 - - * *
* - * * * - - * - - - - * - - * - * - - - * * - - * *
Rank 3 2 * 1 1 1 1 - 1 * 1 - - 2 - 1 1 - - 1 * * 1 * * 1 - 2
* * * * 1% * - * * 1% - - * - * * - - 2% 1% * * * * 1% - 1%
None of these 46 16 30 8 14 15 9 25 10 8 1 - 46 - 23 16 7 26 2 8 9 37 12 21 13 13 32
9% 8% 9% 6% 12% 11% 7% 9% 10% 7% 8% - 9% - 8% 8% 14% 6% 7% 34% 5% 11% 7% 8% 15% 6% 12%
No Answer 467 186 281 126 101 120 120 242 88 104 12 - 467 - 252 176 39 368 29 16 170 298 154 244 69 228 240
90% 92% 89% 91% 87% 88% 93% 90% 87% 92% 92% - 90% - 90% 91% 84% 93% 88% 63% 94% 88% 91% 91% 83% 94% 86%
Sigma 521 204 317 139 117 136 129 269 101 113 13 - 521 - 280 194 47 397 33 25 180 340 169 268 83 242 277
100% 100% 100% 100% 100% 100% 100% 100% 100% 100% 100% - 100% - 100% 100% 100% 100% 100% 100% 100% 100% 100% 100% 100% 100% 100%

Page 122
Fielding Period: November 27 - 28, 2018
HCAPS (Filtered on Registered Voters)
Weighted To The U.S. General Adult Population
30 Nov 2018
Table 107
LABEL1102D_12 Which of the following labels do you most identify with as a Democrat?
Please rank your top three labels. Next to the first-ranked labels, enter ''1'', next to the second-ranked label, enter ''2''; next to the third-ranked label, enter ''3.''
You may select up to three options.
Nationalist
Base: GOP
Presidential
Election Candidate
Gender Age Ethnicity Political Party Political Ideology Voted For Education Locale Income
_____________ ______________________ _______________________ ____________________ ____________________ _____________________ _____________ ________________ _________
Colle- Some
Cons- ge Gr- Colle- $75K Less
Hisp- Black Repub- Democ- Indep- Libe- Mode- erva- 3rd ad And ge Or Urb- Subu- Or Than
Total Male Female 18-34 35-49 50-64 65+ White anic /AA Other lican rat endent ral rate tive Clinton Trump Party Higher Less an rban Rural More $75K
______ _____ _______ _____ _____ _____ ____ _____ _____ _____ _____ ______ ______ ______ ______ ______ ______ ________ ______ _____ ______ ______ ____ _____ _____ ____ ____
Unweighted Base 526 211 315 148 131 133 114 324 52 119 11 - 526 - 298 185 43 397 36 25 213 313 183 255 88 202 323
Weighted Base 521 204 317 139 117 136 129 269 101 113 13 - 521 - 280 194 47 397 33 25 180 340 169 268 83 242 277
Rank 1 3 1 2 - 1 * 1 2 1 - - - 3 - - 3 - 2 - - - 3 * 1 1 1 2
1% 1% 1% - 1% * 1% 1% 1% - - - 1% - - 2% - * - - - 1% * 1% 2% 1% 1%
Rank 2 8 5 2 4 * 3 - 2 - 5 - - 8 - 4 * 3 6 - 1 1 6 5 3 * 3 5
1% 3% 1% 3% * 3% - 1% - 4% - - 1% - 1% * 7% 2% - 2% 1% 2% 3% 1% * 1% 2%
Rank 3 5 4 1 4 * - 1 1 - 2 - - 5 - 3 2 - 2 1 - 1 3 2 2 * 2 3
1% 2% * 3% * - 1% * - 2% - - 1% - 1% 1% - 1% 2% - 1% 1% 1% 1% * 1% 1%
None of these 46 16 30 8 14 15 9 25 10 8 1 - 46 - 23 16 7 26 2 8 9 37 12 21 13 13 32
9% 8% 9% 6% 12% 11% 7% 9% 10% 7% 8% - 9% - 8% 8% 14% 6% 7% 34% 5% 11% 7% 8% 15% 6% 12%
No Answer 459 177 282 123 100 117 118 240 89 99 12 - 459 - 250 172 37 361 30 16 168 290 150 240 69 223 236
88% 87% 89% 89% 86% 86% 92% 89% 88% 87% 92% - 88% - 89% 89% 78% 91% 91% 64% 93% 85% 89% 90% 82% 92% 85%
Sigma 521 204 317 139 117 136 129 269 101 113 13 - 521 - 280 194 47 397 33 25 180 340 169 268 83 242 277
100% 100% 100% 100% 100% 100% 100% 100% 100% 100% 100% - 100% - 100% 100% 100% 100% 100% 100% 100% 100% 100% 100% 100% 100% 100%

Page 123
Fielding Period: November 27 - 28, 2018
HCAPS (Filtered on Registered Voters)
Weighted To The U.S. General Adult Population
30 Nov 2018
Table 108
LABEL1102D_13 Which of the following labels do you most identify with as a Democrat?
Please rank your top three labels. Next to the first-ranked labels, enter ''1'', next to the second-ranked label, enter ''2''; next to the third-ranked label, enter ''3.''
You may select up to three options.
Populist
Base: GOP
Presidential
Election Candidate
Gender Age Ethnicity Political Party Political Ideology Voted For Education Locale Income
_____________ ______________________ _______________________ ____________________ ____________________ _____________________ _____________ ________________ _________
Colle- Some
Cons- ge Gr- Colle- $75K Less
Hisp- Black Repub- Democ- Indep- Libe- Mode- erva- 3rd ad And ge Or Urb- Subu- Or Than
Total Male Female 18-34 35-49 50-64 65+ White anic /AA Other lican rat endent ral rate tive Clinton Trump Party Higher Less an rban Rural More $75K
______ _____ _______ _____ _____ _____ ____ _____ _____ _____ _____ ______ ______ ______ ______ ______ ______ ________ ______ _____ ______ ______ ____ _____ _____ ____ ____
Unweighted Base 526 211 315 148 131 133 114 324 52 119 11 - 526 - 298 185 43 397 36 25 213 313 183 255 88 202 323
Weighted Base 521 204 317 139 117 136 129 269 101 113 13 - 521 - 280 194 47 397 33 25 180 340 169 268 83 242 277
Rank 1 3 1 2 2 * 1 - 1 1 1 - - 3 - 1 2 * * 1 - - 3 - 2 1 - 3
1% 1% * 1% * * - * 1% 1% - - 1% - * 1% 1% * 2% - - 1% - 1% 1% - 1%
Rank 2 7 4 3 * * 2 5 6 - 1 - - 7 - 7 - - 5 - 1 3 5 3 3 1 5 2
1% 2% 1% * * 1% 4% 2% - 1% - - 1% - 3% - - 1% - 3% 1% 1% 2% 1% 1% 2% 1%
Rank 3 2 2 - 2 - - - 2 - - - - 2 - 2 - - 2 - - - 2 - 2 - 2 -
* 1% - 1% - - - 1% - - - - * - 1% - - * - - - 1% - 1% - 1% -
None of these 46 16 30 8 14 15 9 25 10 8 1 - 46 - 23 16 7 26 2 8 9 37 12 21 13 13 32
9% 8% 9% 6% 12% 11% 7% 9% 10% 7% 8% - 9% - 8% 8% 14% 6% 7% 34% 5% 11% 7% 8% 15% 6% 12%
No Answer 463 180 283 127 102 118 115 235 89 104 12 - 463 - 247 176 40 364 30 16 169 294 154 241 68 222 240
89% 88% 89% 92% 87% 87% 89% 87% 88% 92% 92% - 89% - 88% 91% 85% 92% 91% 64% 93% 86% 91% 90% 82% 92% 87%
Sigma 521 204 317 139 117 136 129 269 101 113 13 - 521 - 280 194 47 397 33 25 180 340 169 268 83 242 277
100% 100% 100% 100% 100% 100% 100% 100% 100% 100% 100% - 100% - 100% 100% 100% 100% 100% 100% 100% 100% 100% 100% 100% 100% 100%

Page 124
Fielding Period: November 27 - 28, 2018
HCAPS (Filtered on Registered Voters)
Weighted To The U.S. General Adult Population
30 Nov 2018
Table 109
LABEL1102D_14 Which of the following labels do you most identify with as a Democrat?
Please rank your top three labels. Next to the first-ranked labels, enter ''1'', next to the second-ranked label, enter ''2''; next to the third-ranked label, enter ''3.''
You may select up to three options.
Environmentalist
Base: GOP
Presidential
Election Candidate
Gender Age Ethnicity Political Party Political Ideology Voted For Education Locale Income
_____________ ______________________ _______________________ ____________________ ____________________ _____________________ _____________ ________________ _________
Colle- Some
Cons- ge Gr- Colle- $75K Less
Hisp- Black Repub- Democ- Indep- Libe- Mode- erva- 3rd ad And ge Or Urb- Subu- Or Than
Total Male Female 18-34 35-49 50-64 65+ White anic /AA Other lican rat endent ral rate tive Clinton Trump Party Higher Less an rban Rural More $75K
______ _____ _______ _____ _____ _____ ____ _____ _____ _____ _____ ______ ______ ______ ______ ______ ______ ________ ______ _____ ______ ______ ____ _____ _____ ____ ____
Unweighted Base 526 211 315 148 131 133 114 324 52 119 11 - 526 - 298 185 43 397 36 25 213 313 183 255 88 202 323
Weighted Base 521 204 317 139 117 136 129 269 101 113 13 - 521 - 280 194 47 397 33 25 180 340 169 268 83 242 277
Rank 1 26 11 15 9 7 8 3 15 2 2 3 - 26 - 13 9 4 23 - * 12 14 5 16 5 13 13
5% 6% 5% 6% 6% 6% 2% 6% 2% 2% 23% - 5% - 5% 5% 8% 6% - 2% 6% 4% 3% 6% 6% 6% 5%
Rank 2 71 29 41 25 9 17 20 37 18 8 3 - 71 - 42 24 5 54 6 - 26 45 19 42 9 32 39
14% 14% 13% 18% 7% 13% 15% 14% 17% 7% 23% - 14% - 15% 12% 10% 14% 19% - 14% 13% 12% 16% 11% 13% 14%
Rank 3 50 28 22 14 10 8 18 33 3 13 * - 50 - 36 11 3 47 3 - 23 27 15 30 5 36 14
10% 14% 7% 10% 9% 6% 14% 12% 3% 11% 3% - 10% - 13% 6% 7% 12% 8% - 13% 8% 9% 11% 5% 15% 5%
None of these 46 16 30 8 14 15 9 25 10 8 1 - 46 - 23 16 7 26 2 8 9 37 12 21 13 13 32
9% 8% 9% 6% 12% 11% 7% 9% 10% 7% 8% - 9% - 8% 8% 14% 6% 7% 34% 5% 11% 7% 8% 15% 6% 12%
No Answer 328 118 209 83 77 88 80 159 68 83 6 - 328 - 166 133 28 246 21 16 110 217 117 159 52 148 180
63% 58% 66% 60% 66% 64% 62% 59% 67% 74% 43% - 63% - 59% 69% 60% 62% 66% 65% 61% 64% 69% 59% 62% 61% 65%
Sigma 521 204 317 139 117 136 129 269 101 113 13 - 521 - 280 194 47 397 33 25 180 340 169 268 83 242 277
100% 100% 100% 100% 100% 100% 100% 100% 100% 100% 100% - 100% - 100% 100% 100% 100% 100% 100% 100% 100% 100% 100% 100% 100% 100%

Page 125
Fielding Period: November 27 - 28, 2018
HCAPS (Filtered on Registered Voters)
Weighted To The U.S. General Adult Population
30 Nov 2018
Table 110
LABEL1102D_15 Which of the following labels do you most identify with as a Democrat?
Please rank your top three labels. Next to the first-ranked labels, enter ''1'', next to the second-ranked label, enter ''2''; next to the third-ranked label, enter ''3.''
You may select up to three options.
Libertarian
Base: GOP
Presidential
Election Candidate
Gender Age Ethnicity Political Party Political Ideology Voted For Education Locale Income
_____________ ______________________ _______________________ ____________________ ____________________ _____________________ _____________ ________________ _________
Colle- Some
Cons- ge Gr- Colle- $75K Less
Hisp- Black Repub- Democ- Indep- Libe- Mode- erva- 3rd ad And ge Or Urb- Subu- Or Than
Total Male Female 18-34 35-49 50-64 65+ White anic /AA Other lican rat endent ral rate tive Clinton Trump Party Higher Less an rban Rural More $75K
______ _____ _______ _____ _____ _____ ____ _____ _____ _____ _____ ______ ______ ______ ______ ______ ______ ________ ______ _____ ______ ______ ____ _____ _____ ____ ____
Unweighted Base 526 211 315 148 131 133 114 324 52 119 11 - 526 - 298 185 43 397 36 25 213 313 183 255 88 202 323
Weighted Base 521 204 317 139 117 136 129 269 101 113 13 - 521 - 280 194 47 397 33 25 180 340 169 268 83 242 277
Rank 1 6 2 5 2 2 2 1 3 2 1 1 - 6 - 1 5 1 1 2 2 3 3 1 4 1 4 3
1% 1% 1% 1% 1% 2% 1% 1% 2% 1% 6% - 1% - * 2% 2% * 5% 9% 2% 1% * 2% 2% 1% 1%
Rank 2 4 3 1 2 1 1 - 1 2 1 - - 4 - 2 2 - * * 3 1 2 1 1 2 1 3
1% 1% * 2% 1% * - * 2% 1% - - 1% - 1% 1% - * 1% 11% 1% 1% * * 3% * 1%
Rank 3 13 4 9 5 - 6 2 7 2 1 3 - 13 - 8 2 3 8 - 3 2 11 1 11 2 4 9
2% 2% 3% 3% - 5% 1% 3% 2% 1% 23% - 2% - 3% 1% 6% 2% - 11% 1% 3% * 4% 2% 2% 3%
None of these 46 16 30 8 14 15 9 25 10 8 1 - 46 - 23 16 7 26 2 8 9 37 12 21 13 13 32
9% 8% 9% 6% 12% 11% 7% 9% 10% 7% 8% - 9% - 8% 8% 14% 6% 7% 34% 5% 11% 7% 8% 15% 6% 12%
No Answer 451 178 273 122 100 111 117 233 85 103 8 - 451 - 245 169 36 362 29 9 164 287 155 231 65 221 231
87% 88% 86% 88% 86% 82% 91% 87% 84% 91% 63% - 87% - 88% 87% 77% 91% 88% 36% 91% 84% 92% 86% 78% 91% 83%
Sigma 521 204 317 139 117 136 129 269 101 113 13 - 521 - 280 194 47 397 33 25 180 340 169 268 83 242 277
100% 100% 100% 100% 100% 100% 100% 100% 100% 100% 100% - 100% - 100% 100% 100% 100% 100% 100% 100% 100% 100% 100% 100% 100% 100%

Page 126
Fielding Period: November 27 - 28, 2018
HCAPS (Filtered on Registered Voters)
Weighted To The U.S. General Adult Population
30 Nov 2018
Table 111
LABEL1102D_16 Which of the following labels do you most identify with as a Democrat?
Please rank your top three labels. Next to the first-ranked labels, enter ''1'', next to the second-ranked label, enter ''2''; next to the third-ranked label, enter ''3.''
You may select up to three options.
Antifa
Base: GOP
Presidential
Election Candidate
Gender Age Ethnicity Political Party Political Ideology Voted For Education Locale Income
_____________ ______________________ _______________________ ____________________ ____________________ _____________________ _____________ ________________ _________
Colle- Some
Cons- ge Gr- Colle- $75K Less
Hisp- Black Repub- Democ- Indep- Libe- Mode- erva- 3rd ad And ge Or Urb- Subu- Or Than
Total Male Female 18-34 35-49 50-64 65+ White anic /AA Other lican rat endent ral rate tive Clinton Trump Party Higher Less an rban Rural More $75K
______ _____ _______ _____ _____ _____ ____ _____ _____ _____ _____ ______ ______ ______ ______ ______ ______ ________ ______ _____ ______ ______ ____ _____ _____ ____ ____
Unweighted Base 526 211 315 148 131 133 114 324 52 119 11 - 526 - 298 185 43 397 36 25 213 313 183 255 88 202 323
Weighted Base 521 204 317 139 117 136 129 269 101 113 13 - 521 - 280 194 47 397 33 25 180 340 169 268 83 242 277
Rank 1 3 2 1 2 1 1 - 1 - 1 - - 3 - 3 - - 2 1 - 1 2 - 2 1 1 2
1% 1% * 1% * * - * - 1% - - 1% - 1% - - * 3% - 1% * - 1% 1% * 1%
Rank 2 1 1 * * 1 - - 1 - - - - 1 - 1 - - 1 - - - 1 - 1 - 1 *
* * * * 1% - - * - - - - * - * - - * - - - * - * - * *
Rank 3 3 * 2 3 - - - 2 - - - - 3 - 1 2 - 1 - * 2 1 * 2 - 2 1
1% * 1% 2% - - - 1% - - - - 1% - * 1% - * - 2% 1% * * 1% - 1% *
None of these 46 16 30 8 14 15 9 25 10 8 1 - 46 - 23 16 7 26 2 8 9 37 12 21 13 13 32
9% 8% 9% 6% 12% 11% 7% 9% 10% 7% 8% - 9% - 8% 8% 14% 6% 7% 34% 5% 11% 7% 8% 15% 6% 12%
No Answer 468 184 284 126 101 120 120 240 91 105 12 - 468 - 252 176 40 367 29 16 168 299 156 241 70 226 242
90% 90% 89% 91% 87% 88% 93% 89% 90% 92% 92% - 90% - 90% 91% 86% 93% 90% 65% 93% 88% 93% 90% 84% 93% 87%
Sigma 521 204 317 139 117 136 129 269 101 113 13 - 521 - 280 194 47 397 33 25 180 340 169 268 83 242 277
100% 100% 100% 100% 100% 100% 100% 100% 100% 100% 100% - 100% - 100% 100% 100% 100% 100% 100% 100% 100% 100% 100% 100% 100% 100%

Page 127
Fielding Period: November 27 - 28, 2018
HCAPS (Filtered on Registered Voters)
Weighted To The U.S. General Adult Population
30 Nov 2018
Table 112
LABEL1102D_98 Which of the following labels do you most identify with as a Democrat?
Please rank your top three labels. Next to the first-ranked labels, enter ''1'', next to the second-ranked label, enter ''2''; next to the third-ranked label, enter ''3.''
You may select up to three options.
Other
Base: GOP
Presidential
Election Candidate
Gender Age Ethnicity Political Party Political Ideology Voted For Education Locale Income
_____________ ______________________ _______________________ ____________________ ____________________ _____________________ _____________ ________________ _________
Colle- Some
Cons- ge Gr- Colle- $75K Less
Hisp- Black Repub- Democ- Indep- Libe- Mode- erva- 3rd ad And ge Or Urb- Subu- Or Than
Total Male Female 18-34 35-49 50-64 65+ White anic /AA Other lican rat endent ral rate tive Clinton Trump Party Higher Less an rban Rural More $75K
______ _____ _______ _____ _____ _____ ____ _____ _____ _____ _____ ______ ______ ______ ______ ______ ______ ________ ______ _____ ______ ______ ____ _____ _____ ____ ____
Unweighted Base 526 211 315 148 131 133 114 324 52 119 11 - 526 - 298 185 43 397 36 25 213 313 183 255 88 202 323
Weighted Base 521 204 317 139 117 136 129 269 101 113 13 - 521 - 280 194 47 397 33 25 180 340 169 268 83 242 277
Rank 1 1 - 1 * 1 - - 1 - - - - 1 - * 1 - 1 - 1 1 - 1 1 - 1 1
* - * * 1% - - 1% - - - - * - * 1% - * - 2% 1% - 1% * - * *
Rank 2 - - - - - - - - - - - - - - - - - - - - - - - - - - -
- - - - - - - - - - - - - - - - - - - - - - - - - - -
Rank 3 3 2 1 - 1 - 2 3 - - - - 3 - 2 1 - 2 - 1 2 1 - 3 - 3 -
1% 1% * - 1% - 2% 1% - - - - 1% - 1% 1% - 1% - 5% 1% * - 1% - 1% -
None of these 46 16 30 8 14 15 9 25 10 8 1 - 46 - 23 16 7 26 2 8 9 37 12 21 13 13 32
9% 8% 9% 6% 12% 11% 7% 9% 10% 7% 8% - 9% - 8% 8% 14% 6% 7% 34% 5% 11% 7% 8% 15% 6% 12%
No Answer 470 185 284 131 101 120 118 239 91 106 12 - 470 - 254 175 40 368 30 15 168 302 156 243 71 225 244
90% 91% 90% 94% 86% 89% 91% 89% 90% 93% 92% - 90% - 91% 90% 86% 93% 93% 59% 93% 89% 92% 91% 85% 93% 88%
Sigma 521 204 317 139 117 136 129 269 101 113 13 - 521 - 280 194 47 397 33 25 180 340 169 268 83 242 277
100% 100% 100% 100% 100% 100% 100% 100% 100% 100% 100% - 100% - 100% 100% 100% 100% 100% 100% 100% 100% 100% 100% 100% 100% 100%

Page 128
Fielding Period: November 27 - 28, 2018
HCAPS (Filtered on Registered Voters)
Weighted To The U.S. General Adult Population
30 Nov 2018
Table 113
LABEL1103I Which of the following labels do you most identify with?
Please rank your top three labels. Next to the first-ranked labels, enter ''1'', next to the second-ranked label, enter ''2''; next to the third-ranked label, enter ''3.''
You may select up to three options.
Summary Of Rank 1
Base: GOP
Presidential
Election Candidate
Gender Age Ethnicity Political Party Political Ideology Voted For Education Locale Income
_____________ ______________________ _______________________ ____________________ ____________________ _____________________ _____________ ________________ _________
Colle- Some
Cons- ge Gr- Colle- $75K Less
Hisp- Black Repub- Democ- Indep- Libe- Mode- erva- 3rd ad And ge Or Urb- Subu- Or Than
Total Male Female 18-34 35-49 50-64 65+ White anic /AA Other lican rat endent ral rate tive Clinton Trump Party Higher Less an rban Rural More $75K
______ _____ _______ _____ _____ _____ ____ _____ _____ _____ _____ ______ ______ ______ ______ ______ ______ ________ ______ _____ ______ ______ ____ _____ _____ ____ ____
Unweighted Base 382 205 177 121 95 92 74 295 24 36 8 - - 382 77 223 82 106 124 48 149 233 92 211 79 133 243
Weighted Base 408 224 185 118 106 104 80 284 51 40 8 - - 408 61 269 78 119 142 51 147 261 113 229 66 182 215
Moderate Democrat 31 23 8 13 6 6 6 17 6 3 - - - 31 10 21 * 21 2 6 20 11 9 21 1 21 10
8% 10% 4% 11% 5% 6% 8% 6% 11% 8% - - - 8% 16% 8% 1% 17% 2% 11% 13% 4% 8% 9% 2% 12% 5%
Trump Republican 30 9 21 5 10 13 3 24 4 1 1 - - 30 2 23 5 * 26 - 7 24 7 18 5 16 14
7% 4% 11% 4% 9% 12% 4% 8% 9% 2% 16% - - 7% 3% 8% 7% * 18% - 4% 9% 6% 8% 8% 9% 7%
Libertarian 27 12 15 14 8 3 1 22 3 2 - - - 27 7 15 5 2 14 3 7 20 9 10 7 4 23
7% 5% 8% 12% 7% 3% 1% 8% 6% 4% - - - 7% 11% 5% 7% 2% 10% 7% 5% 8% 8% 5% 11% 2% 11%
Christian Conservative 22 9 13 4 9 2 8 13 5 1 - - - 22 - 12 10 7 6 3 8 14 2 9 11 8 13
5% 4% 7% 3% 8% 1% 9% 4% 10% 4% - - - 5% - 4% 12% 6% 5% 6% 5% 5% 1% 4% 16% 5% 6%
Fiscal Conservative 21 12 9 5 2 6 8 16 3 - - - - 21 1 16 4 4 7 5 15 6 4 14 3 14 6
5% 6% 5% 4% 2% 6% 10% 6% 6% - - - - 5% 2% 6% 5% 3% 5% 10% 10% 2% 3% 6% 4% 8% 3%
Reagan Republican 21 18 3 2 3 10 6 19 - - - - - 21 - 12 9 2 13 5 14 7 6 14 1 12 8
5% 8% 2% 2% 3% 9% 7% 7% - - - - - 5% - 4% 12% 1% 9% 10% 10% 3% 5% 6% 1% 7% 4%
Obama Democrat 20 9 11 6 9 4 1 9 - 7 1 - - 20 2 18 - 12 2 4 5 15 8 10 2 12 8
5% 4% 6% 5% 9% 4% 1% 3% - 17% 13% - - 5% 2% 7% - 10% 2% 8% 3% 6% 7% 4% 2% 6% 4%
Liberal Democrat 19 8 11 8 4 3 4 11 2 6 - - - 19 14 4 - 12 - 3 8 11 7 11 * 7 12
5% 3% 6% 7% 4% 3% 5% 4% 3% 15% - - - 5% 24% 2% - 10% - 5% 5% 4% 6% 5% * 4% 5%
Compassionate Conservative 15 8 8 5 1 3 6 13 - - 2 - - 15 1 4 10 * 9 2 2 13 4 8 3 3 10
4% 3% 4% 4% 1% 3% 8% 5% - - 20% - - 4% 2% 2% 12% * 7% 4% 1% 5% 4% 4% 4% 2% 4%
Moderate Republican 13 8 6 4 1 5 3 12 - 1 - - - 13 - 9 4 2 7 - 3 11 3 9 2 5 9
3% 4% 3% 3% 1% 5% 4% 4% - 3% - - - 3% - 4% 5% 1% 5% - 2% 4% 3% 4% 3% 3% 4%
Social Conservative 12 5 7 2 2 6 2 11 - - - - - 12 2 5 5 2 3 4 4 9 3 8 1 4 7
3% 2% 4% 2% 2% 6% 2% 4% - - - - - 3% 3% 2% 7% 2% 2% 8% 2% 3% 3% 3% 2% 2% 3%
Democratic Socialist 12 6 6 6 3 - 3 9 - 1 - - - 12 7 5 - 5 1 1 4 8 * 10 1 7 5
3% 3% 3% 5% 3% - 3% 3% - 3% - - - 3% 11% 2% - 4% 1% 2% 3% 3% * 4% 2% 4% 2%

Page 129
Fielding Period: November 27 - 28, 2018
HCAPS (Filtered on Registered Voters)
Weighted To The U.S. General Adult Population
30 Nov 2018
Table 113
LABEL1103I Which of the following labels do you most identify with?
Please rank your top three labels. Next to the first-ranked labels, enter ''1'', next to the second-ranked label, enter ''2''; next to the third-ranked label, enter ''3.''
You may select up to three options.
Summary Of Rank 1
Base: GOP
Presidential
Election Candidate
Gender Age Ethnicity Political Party Political Ideology Voted For Education Locale Income
_____________ ______________________ _______________________ ____________________ ____________________ _____________________ _____________ ________________ _________
Colle- Some
Cons- ge Gr- Colle- $75K Less
Hisp- Black Repub- Democ- Indep- Libe- Mode- erva- 3rd ad And ge Or Urb- Subu- Or Than
Total Male Female 18-34 35-49 50-64 65+ White anic /AA Other lican rat endent ral rate tive Clinton Trump Party Higher Less an rban Rural More $75K
______ _____ _______ _____ _____ _____ ____ _____ _____ _____ _____ ______ ______ ______ ______ ______ ______ ________ ______ _____ ______ ______ ____ _____ _____ ____ ____
Conservative Democrat 11 7 4 5 1 1 3 8 2 1 - - - 11 - 10 2 5 * 1 4 8 1 8 2 4 7
3% 3% 2% 4% 1% 1% 4% 3% 4% 2% - - - 3% - 4% 2% 5% * 2% 2% 3% 1% 4% 3% 2% 3%
Populist 11 6 5 4 6 1 - 3 - 6 - - - 11 1 10 - - 9 1 1 10 3 7 1 9 2
3% 3% 3% 3% 5% 1% - 1% - 14% - - - 3% 2% 4% - - 7% 2% 1% 4% 3% 3% 1% 5% 1%
Bush Republican 11 6 5 3 7 - 1 6 4 - 1 - - 11 * 8 3 5 3 2 1 10 5 4 2 4 6
3% 3% 3% 2% 7% - 1% 2% 9% - 8% - - 3% 1% 3% 4% 4% 2% 4% 1% 4% 4% 2% 3% 2% 3%
Nationalist 11 5 5 3 3 1 3 3 2 1 2 - - 11 2 7 1 3 4 1 6 5 6 3 2 3 6
3% 2% 3% 3% 3% 1% 3% 1% 4% 4% 30% - - 3% 3% 3% 2% 3% 3% 3% 4% 2% 6% 1% 3% 2% 3%
Liberal Republican 10 5 5 4 2 1 3 9 1 - - - - 10 6 4 1 4 3 * 4 6 2 5 2 2 8
2% 2% 3% 3% 2% 1% 3% 3% 1% - - - - 2% 9% 1% 1% 3% 2% 1% 3% 2% 2% 2% 3% 1% 4%
Conservative Republican 10 4 5 5 1 3 - 7 2 1 - - - 10 1 3 6 1 6 - 1 8 3 4 2 3 7
2% 2% 3% 5% 1% 3% - 2% 4% 2% - - - 2% 1% 1% 8% 1% 4% - 1% 3% 3% 2% 3% 1% 3%
Clinton Democrat 8 6 3 - 4 5 - 4 2 1 - - - 8 * 7 1 5 - - 2 6 5 1 3 2 4
2% 3% 2% - 3% 5% - 1% 5% 3% - - - 2% 1% 3% 1% 4% - - 2% 2% 4% * 4% 1% 2%
Other 8 7 1 - 4 2 1 7 - 1 - - - 8 - 5 3 1 4 2 4 3 * 5 2 2 5
2% 3% 1% - 4% 2% 1% 2% - 2% - - - 2% - 2% 4% 1% 3% 3% 3% 1% * 2% 3% 1% 2%
Socialist 7 5 2 1 4 1 - 7 - - - - - 7 1 5 * 1 5 1 6 1 1 1 5 4 2
2% 2% 1% 1% 4% 1% - 2% - - - - - 2% 2% 2% * 1% 3% 2% 4% * 1% * 7% 2% 1%
Alt-Right 1 - 1 - 1 - - - - - - - - 1 - 1 - - - - - 1 - 1 - 1 -
* - * - 1% - - - - - - - - * - * - - - - - * - * - * -
Heartland Republican * * - - - * - * - - - - - * - * - * - - - * - - * - *
* * - - - * - * - - - - - * - * - * - - - * - - 1% - *
Antifa - - - - - - - - - - - - - - - - - - - - - - - - - - -
- - - - - - - - - - - - - - - - - - - - - - - - - - -
Communist - - - - - - - - - - - - - - - - - - - - - - - - - - -
- - - - - - - - - - - - - - - - - - - - - - - - - - -

Page 130
Fielding Period: November 27 - 28, 2018
HCAPS (Filtered on Registered Voters)
Weighted To The U.S. General Adult Population
30 Nov 2018
Table 114
LABEL1103I Which of the following labels do you most identify with?
Please rank your top three labels. Next to the first-ranked labels, enter ''1'', next to the second-ranked label, enter ''2''; next to the third-ranked label, enter ''3.''
You may select up to three options.
Summary Of Rank 2
Base: GOP
Presidential
Election Candidate
Gender Age Ethnicity Political Party Political Ideology Voted For Education Locale Income
_____________ ______________________ _______________________ ____________________ ____________________ _____________________ _____________ ________________ _________
Colle- Some
Cons- ge Gr- Colle- $75K Less
Hisp- Black Repub- Democ- Indep- Libe- Mode- erva- 3rd ad And ge Or Urb- Subu- Or Than
Total Male Female 18-34 35-49 50-64 65+ White anic /AA Other lican rat endent ral rate tive Clinton Trump Party Higher Less an rban Rural More $75K
______ _____ _______ _____ _____ _____ ____ _____ _____ _____ _____ ______ ______ ______ ______ ______ ______ ________ ______ _____ ______ ______ ____ _____ _____ ____ ____
Unweighted Base 382 205 177 121 95 92 74 295 24 36 8 - - 382 77 223 82 106 124 48 149 233 92 211 79 133 243
Weighted Base 408 224 185 118 106 104 80 284 51 40 8 - - 408 61 269 78 119 142 51 147 261 113 229 66 182 215
Obama Democrat 29 12 17 20 5 2 2 16 7 5 - - - 29 11 17 1 17 * - 4 24 9 15 4 13 15
7% 5% 9% 17% 4% 2% 3% 6% 13% 12% - - - 7% 18% 6% 1% 14% * - 3% 9% 8% 7% 6% 7% 7%
Moderate Republican 27 22 6 5 8 9 6 11 10 - 1 - - 27 1 24 2 8 12 6 11 17 11 15 2 15 12
7% 10% 3% 4% 7% 8% 7% 4% 19% - 7% - - 7% 1% 9% 3% 7% 8% 12% 7% 6% 9% 7% 3% 8% 6%
Moderate Democrat 23 8 15 4 12 3 4 8 8 5 1 - - 23 3 20 - 14 6 2 3 20 8 10 5 4 19
6% 3% 8% 3% 11% 3% 5% 3% 16% 13% 13% - - 6% 5% 7% - 12% 4% 3% 2% 8% 7% 4% 8% 2% 9%
Compassionate Conservative 22 9 13 3 2 8 9 21 - 1 - - - 22 2 12 9 7 5 4 11 11 5 11 6 9 11
5% 4% 7% 2% 2% 8% 12% 7% - 3% - - - 5% 3% 4% 11% 6% 4% 9% 8% 4% 5% 5% 9% 5% 5%
Reagan Republican 19 6 13 2 3 11 3 17 1 1 - - - 19 2 11 6 1 15 - 6 13 6 11 2 11 9
5% 3% 7% 2% 2% 11% 4% 6% 2% 2% - - - 5% 4% 4% 8% 1% 10% - 4% 5% 5% 5% 4% 6% 4%
Fiscal Conservative 17 15 3 4 2 9 3 13 1 1 - - - 17 1 15 2 3 10 4 13 5 5 10 3 9 8
4% 7% 1% 3% 2% 9% 4% 5% 3% 2% - - - 4% 1% 5% 2% 3% 7% 7% 9% 2% 4% 4% 4% 5% 4%
Libertarian 15 10 5 5 1 4 6 9 - 2 3 - - 15 3 6 6 2 7 5 10 6 7 5 4 4 10
4% 4% 3% 4% 1% 4% 7% 3% - 5% 37% - - 4% 6% 2% 7% 2% 5% 10% 7% 2% 6% 2% 6% 2% 5%
Social Conservative 15 6 8 9 - 1 4 11 2 - - - - 15 - 10 4 2 8 - 3 12 5 7 4 2 13
4% 3% 4% 8% - 1% 5% 4% 4% - - - - 4% - 4% 5% 2% 6% - 2% 4% 4% 3% 5% 1% 6%
Nationalist 13 10 3 1 6 6 1 6 - 6 - - - 13 - 11 2 - 9 1 5 8 - 12 2 11 2
3% 5% 2% 1% 5% 6% 1% 2% - 14% - - - 3% - 4% 3% - 6% 2% 4% 3% - 5% 2% 6% 1%
Liberal Democrat 13 6 7 5 4 1 3 10 - 1 - - - 13 10 3 - 6 1 2 5 8 2 10 * 7 6
3% 3% 4% 5% 3% 1% 4% 4% - 3% - - - 3% 17% 1% - 5% 1% 4% 4% 3% 2% 4% 1% 4% 3%
Liberal Republican 13 5 8 6 5 1 1 9 - 2 1 - - 13 2 11 - 2 3 1 4 8 3 7 3 4 9
3% 2% 4% 5% 5% 1% 1% 3% - 4% 14% - - 3% 3% 4% - 2% 2% 2% 3% 3% 2% 3% 5% 2% 4%
Conservative Democrat 11 6 5 2 6 3 1 6 2 1 - - - 11 * 8 3 7 - - 6 6 3 8 1 4 7
3% 3% 3% 1% 5% 3% 1% 2% 3% 3% - - - 3% 1% 3% 3% 6% - - 4% 2% 3% 3% 1% 2% 3%

Page 131
Fielding Period: November 27 - 28, 2018
HCAPS (Filtered on Registered Voters)
Weighted To The U.S. General Adult Population
30 Nov 2018
Table 114
LABEL1103I Which of the following labels do you most identify with?
Please rank your top three labels. Next to the first-ranked labels, enter ''1'', next to the second-ranked label, enter ''2''; next to the third-ranked label, enter ''3.''
You may select up to three options.
Summary Of Rank 2
Base: GOP
Presidential
Election Candidate
Gender Age Ethnicity Political Party Political Ideology Voted For Education Locale Income
_____________ ______________________ _______________________ ____________________ ____________________ _____________________ _____________ ________________ _________
Colle- Some
Cons- ge Gr- Colle- $75K Less
Hisp- Black Repub- Democ- Indep- Libe- Mode- erva- 3rd ad And ge Or Urb- Subu- Or Than
Total Male Female 18-34 35-49 50-64 65+ White anic /AA Other lican rat endent ral rate tive Clinton Trump Party Higher Less an rban Rural More $75K
______ _____ _______ _____ _____ _____ ____ _____ _____ _____ _____ ______ ______ ______ ______ ______ ______ ________ ______ _____ ______ ______ ____ _____ _____ ____ ____
Conservative Republican 11 6 5 2 4 2 3 8 - 1 - - - 11 - 3 8 - 6 4 3 8 2 7 2 7 5
3% 3% 3% 2% 4% 2% 4% 3% - 2% - - - 3% - 1% 11% - 4% 7% 2% 3% 1% 3% 3% 4% 2%
Clinton Democrat 10 4 6 4 6 * 1 6 - 4 - - - 10 2 8 * 6 1 1 2 9 6 3 2 7 3
3% 2% 3% 3% 6% * 1% 2% - 10% - - - 3% 3% 3% 1% 5% 1% 2% 1% 3% 5% 1% 3% 4% 1%
Trump Republican 10 8 2 1 3 4 2 10 - - - - - 10 - 3 7 - 9 - 3 7 - 7 2 4 6
2% 3% 1% 1% 3% 4% 2% 3% - - - - - 2% - 1% 9% - 6% - 2% 3% - 3% 4% 2% 3%
Bush Republican 10 4 5 2 5 1 1 10 - - - - - 10 1 7 2 3 6 - 7 3 1 8 1 7 3
2% 2% 3% 2% 5% 1% 2% 3% - - - - - 2% 2% 3% 2% 3% 4% - 5% 1% 1% 4% 1% 4% 1%
Democratic Socialist 9 2 6 3 3 3 1 7 - 2 - - - 9 6 2 1 3 - 3 3 5 3 5 1 * 8
2% 1% 3% 2% 3% 3% 1% 2% - 5% - - - 2% 9% 1% 1% 3% - 6% 2% 2% 3% 2% 1% * 4%
Christian Conservative 9 4 4 1 3 2 2 7 - - 1 - - 9 - * 9 * 6 2 2 7 3 4 2 2 4
2% 2% 2% 1% 3% 2% 3% 3% - - 17% - - 2% - * 11% * 4% 4% 1% 3% 2% 2% 3% 1% 2%
Socialist 7 1 6 6 - - 1 6 - 1 - - - 7 - 7 - 1 - 1 1 6 - 6 1 4 3
2% * 3% 5% - - 1% 2% - 2% - - - 2% - 2% - 1% - 3% 1% 2% - 3% 1% 2% 1%
Populist 6 5 1 2 2 - 2 5 1 - - - - 6 2 4 - * 4 1 3 3 2 3 1 3 3
1% 2% * 2% 2% - 2% 2% 2% - - - - 1% 4% 1% - * 2% 2% 2% 1% 1% 1% 1% 1% 2%
Antifa 6 * 5 3 3 - - 3 2 - - - - 6 2 4 - * 5 - 3 3 5 * - 5 *
1% * 3% 3% 2% - - 1% 4% - - - - 1% 3% 1% - * 4% - 2% 1% 5% * - 3% *
Other 4 4 - - - 2 2 4 - - - - - 4 - 2 3 - 2 2 - 4 2 2 1 2 1
1% 2% - - - 2% 2% 1% - - - - - 1% - 1% 3% - 2% 4% - 2% 1% 1% 1% 1% *
Communist 3 3 * 2 1 - - * 3 - - - - 3 1 2 - - 1 - 1 2 - 3 * * 3
1% 1% * 2% 1% - - * 5% - - - - 1% 2% 1% - - 1% - * 1% - 1% 1% * 1%
Alt-Right 1 1 1 1 1 - - 1 - - - - - 1 - 1 * - 1 * 1 * 1 * * - 1
* * * 1% 1% - - * - - - - - * - * * - * 1% 1% * 1% * 1% - 1%
Heartland Republican - - - - - - - - - - - - - - - - - - - - - - - - - - -
- - - - - - - - - - - - - - - - - - - - - - - - - - -

Page 132
Fielding Period: November 27 - 28, 2018
HCAPS (Filtered on Registered Voters)
Weighted To The U.S. General Adult Population
30 Nov 2018
Table 115
LABEL1103I Which of the following labels do you most identify with?
Please rank your top three labels. Next to the first-ranked labels, enter ''1'', next to the second-ranked label, enter ''2''; next to the third-ranked label, enter ''3.''
You may select up to three options.
Summary Of Rank 3
Base: GOP
Presidential
Election Candidate
Gender Age Ethnicity Political Party Political Ideology Voted For Education Locale Income
_____________ ______________________ _______________________ ____________________ ____________________ _____________________ _____________ ________________ _________
Colle- Some
Cons- ge Gr- Colle- $75K Less
Hisp- Black Repub- Democ- Indep- Libe- Mode- erva- 3rd ad And ge Or Urb- Subu- Or Than
Total Male Female 18-34 35-49 50-64 65+ White anic /AA Other lican rat endent ral rate tive Clinton Trump Party Higher Less an rban Rural More $75K
______ _____ _______ _____ _____ _____ ____ _____ _____ _____ _____ ______ ______ ______ ______ ______ ______ ________ ______ _____ ______ ______ ____ _____ _____ ____ ____
Unweighted Base 382 205 177 121 95 92 74 295 24 36 8 - - 382 77 223 82 106 124 48 149 233 92 211 79 133 243
Weighted Base 408 224 185 118 106 104 80 284 51 40 8 - - 408 61 269 78 119 142 51 147 261 113 229 66 182 215
Trump Republican 27 18 9 3 11 4 9 15 2 6 2 - - 27 2 14 11 - 21 2 6 21 9 15 3 12 10
7% 8% 5% 2% 10% 4% 11% 5% 4% 14% 20% - - 7% 3% 5% 14% - 15% 4% 4% 8% 8% 7% 4% 7% 5%
Fiscal Conservative 19 14 5 5 3 7 6 16 - 1 - - - 19 1 10 8 3 7 5 8 12 7 10 2 11 9
5% 6% 3% 4% 3% 6% 7% 6% - 2% - - - 5% 1% 4% 11% 2% 5% 10% 5% 4% 6% 4% 3% 6% 4%
Moderate Democrat 18 14 4 6 9 * 3 12 4 1 - - - 18 3 13 2 11 4 1 6 12 10 6 3 5 13
5% 6% 2% 5% 8% * 4% 4% 9% 3% - - - 5% 5% 5% 3% 9% 3% 1% 4% 5% 8% 3% 5% 3% 6%
Reagan Republican 18 9 9 3 9 4 2 12 - 5 1 - - 18 1 10 7 5 10 3 6 12 6 9 3 11 7
4% 4% 5% 2% 9% 4% 3% 4% - 12% 16% - - 4% 1% 4% 9% 4% 7% 5% 4% 5% 5% 4% 4% 6% 3%
Conservative Democrat 18 11 7 8 5 2 4 10 3 3 - - - 18 7 10 1 11 3 * 10 8 5 10 3 12 6
4% 5% 4% 6% 5% 2% 4% 4% 6% 6% - - - 4% 11% 4% 1% 9% 2% 1% 7% 3% 4% 4% 5% 6% 3%
Liberal Republican 16 4 12 7 1 8 - 13 1 - - - - 16 2 10 4 4 6 3 5 11 9 5 1 9 7
4% 2% 6% 6% 1% 8% - 4% 3% - - - - 4% 3% 4% 5% 3% 4% 6% 3% 4% 8% 2% 2% 5% 3%
Obama Democrat 15 5 10 5 2 2 6 9 2 3 - - - 15 7 9 - 8 * 2 8 7 7 7 1 5 10
4% 2% 6% 4% 2% 2% 7% 3% 4% 8% - - - 4% 11% 3% - 7% * 4% 6% 3% 6% 3% 2% 3% 5%
Moderate Republican 14 4 9 5 3 1 4 8 3 - - - - 14 - 12 2 1 7 2 7 6 3 10 - 10 4
3% 2% 5% 4% 3% 1% 5% 3% 6% - - - - 3% - 4% 2% 1% 5% 4% 5% 2% 3% 4% - 5% 2%
Socialist 13 5 8 8 * 2 2 10 - 2 1 - - 13 4 8 - 4 6 2 * 12 3 9 1 2 11
3% 2% 4% 7% * 2% 3% 3% - 4% 13% - - 3% 7% 3% - 3% 4% 4% * 5% 3% 4% 1% 1% 5%
Compassionate Conservative 12 8 5 3 4 2 3 6 2 2 - - - 12 1 9 2 4 4 1 3 9 5 8 - 6 6
3% 3% 2% 2% 4% 2% 4% 2% 5% 6% - - - 3% 2% 3% 3% 3% 3% 3% 2% 3% 4% 3% - 3% 3%
Libertarian 12 6 6 6 2 3 1 10 - 1 - - - 12 3 9 1 4 1 3 7 5 2 9 1 8 4
3% 3% 3% 5% 2% 3% 2% 3% - 4% - - - 3% 5% 3% 1% 3% 1% 5% 5% 2% 2% 4% 1% 5% 2%
Conservative Republican 11 5 6 6 4 1 - 6 2 1 2 - - 11 - 7 4 1 4 - 1 10 1 6 4 2 9
3% 2% 3% 5% 3% 1% - 2% 4% 3% 21% - - 3% - 3% 5% 1% 3% - 1% 4% 1% 3% 6% 1% 4%

Page 133
Fielding Period: November 27 - 28, 2018
HCAPS (Filtered on Registered Voters)
Weighted To The U.S. General Adult Population
30 Nov 2018
Table 115
LABEL1103I Which of the following labels do you most identify with?
Please rank your top three labels. Next to the first-ranked labels, enter ''1'', next to the second-ranked label, enter ''2''; next to the third-ranked label, enter ''3.''
You may select up to three options.
Summary Of Rank 3
Base: GOP
Presidential
Election Candidate
Gender Age Ethnicity Political Party Political Ideology Voted For Education Locale Income
_____________ ______________________ _______________________ ____________________ ____________________ _____________________ _____________ ________________ _________
Colle- Some
Cons- ge Gr- Colle- $75K Less
Hisp- Black Repub- Democ- Indep- Libe- Mode- erva- 3rd ad And ge Or Urb- Subu- Or Than
Total Male Female 18-34 35-49 50-64 65+ White anic /AA Other lican rat endent ral rate tive Clinton Trump Party Higher Less an rban Rural More $75K
______ _____ _______ _____ _____ _____ ____ _____ _____ _____ _____ ______ ______ ______ ______ ______ ______ ________ ______ _____ ______ ______ ____ _____ _____ ____ ____
Clinton Democrat 10 5 6 6 1 2 1 7 3 - - - - 10 3 6 1 5 1 1 3 7 1 8 1 2 8
3% 2% 3% 5% 1% 2% 2% 2% 6% - - - - 3% 5% 2% 1% 4% 1% 2% 2% 3% 1% 4% 1% 1% 4%
Social Conservative 10 4 6 2 2 4 2 7 1 1 - - - 10 2 5 2 1 6 - 6 4 3 5 1 5 5
2% 2% 3% 2% 2% 4% 2% 2% 1% 3% - - - 2% 4% 2% 3% 1% 4% - 4% 1% 3% 2% 2% 3% 2%
Other 9 5 4 3 1 4 1 6 4 - - - - 9 2 6 1 2 * 5 7 2 - 5 4 2 5
2% 2% 2% 3% 1% 4% 1% 2% 7% - - - - 2% 3% 2% 1% 2% * 9% 5% 1% - 2% 6% 1% 2%
Christian Conservative 9 5 4 1 6 1 1 8 - 1 - - - 9 1 4 4 1 3 3 2 7 1 5 2 5 3
2% 2% 2% 1% 5% 1% 1% 3% - 2% - - - 2% 1% 2% 5% * 2% 6% 1% 3% 1% 2% 3% 3% 2%
Nationalist 8 3 5 1 2 6 - 6 2 - - - - 8 1 4 3 - 7 - 1 6 1 6 2 4 4
2% 1% 3% * 1% 6% - 2% 4% - - - - 2% 2% 1% 3% - 5% - 1% 2% * 2% 3% 2% 2%
Bush Republican 8 5 3 4 1 1 1 6 - 1 - - - 8 2 6 - 3 2 - 2 5 4 3 * 1 6
2% 2% 2% 3% 1% 1% 2% 2% - 3% - - - 2% 3% 2% - 2% 1% - 2% 2% 3% 1% 1% 1% 3%
Alt-Right 7 * 6 1 6 - - 1 5 1 - - - 7 1 6 - 6 * - 1 6 1 - 6 - 7
2% * 3% 1% 6% - - * 10% 2% - - - 2% 2% 2% - 5% * - * 2% 1% - 8% - 3%
Populist 6 3 3 2 - 4 - 6 - - - - - 6 1 5 * * 4 2 4 2 * 5 1 3 3
2% 1% 2% 2% - 4% - 2% - - - - - 2% 2% 2% * * 2% 4% 3% 1% * 2% 1% 2% 2%
Democratic Socialist 6 5 1 2 2 2 - 3 2 1 - - - 6 1 5 - 3 1 * 2 4 3 3 * 2 4
1% 2% * 2% 2% 2% - 1% 3% 3% - - - 1% 2% 2% - 3% 1% 1% 1% 2% 2% 1% 1% 1% 2%
Heartland Republican 6 3 3 * 1 3 2 4 - - - - - 6 1 2 3 1 2 1 1 5 2 1 3 3 2
1% 1% 2% * 1% 3% 2% 1% - - - - - 1% 1% 1% 4% 1% 1% 2% 1% 2% 2% * 4% 2% 1%
Liberal Democrat 4 3 2 1 1 * 3 3 - 2 - - - 4 2 3 - 3 1 - 1 4 1 3 1 2 3
1% 1% 1% * 1% * 3% 1% - 4% - - - 1% 2% 1% - 2% 1% - 1% 1% * 1% 1% 1% 1%
Communist 2 1 1 2 - - - 2 - - - - - 2 - 2 - - 1 - - 2 - 1 1 1 1
1% * 1% 2% - - - 1% - - - - - 1% - 1% - - 1% - - 1% - * 2% 1% *
Antifa 1 1 * 1 - - - 1 - - - - - 1 1 - * * - * - 1 - 1 * - 1
* * * 1% - - - * - - - - - * 1% - 1% * - 1% - * - * 1% - 1%

Page 134
Fielding Period: November 27 - 28, 2018
HCAPS (Filtered on Registered Voters)
Weighted To The U.S. General Adult Population
30 Nov 2018
Table 116
LABEL1103I Which of the following labels do you most identify with?
Please rank your top three labels. Next to the first-ranked labels, enter ''1'', next to the second-ranked label, enter ''2''; next to the third-ranked label, enter ''3.''
You may select up to three options.
Summary Of Rank 1,2,3
Base: GOP
Presidential
Election Candidate
Gender Age Ethnicity Political Party Political Ideology Voted For Education Locale Income
_____________ ______________________ _______________________ ____________________ ____________________ _____________________ _____________ ________________ _________
Colle- Some
Cons- ge Gr- Colle- $75K Less
Hisp- Black Repub- Democ- Indep- Libe- Mode- erva- 3rd ad And ge Or Urb- Subu- Or Than
Total Male Female 18-34 35-49 50-64 65+ White anic /AA Other lican rat endent ral rate tive Clinton Trump Party Higher Less an rban Rural More $75K
______ _____ _______ _____ _____ _____ ____ _____ _____ _____ _____ ______ ______ ______ ______ ______ ______ ________ ______ _____ ______ ______ ____ _____ _____ ____ ____
Unweighted Base 382 205 177 121 95 92 74 295 24 36 8 - - 382 77 223 82 106 124 48 149 233 92 211 79 133 243
Weighted Base 408 224 185 118 106 104 80 284 51 40 8 - - 408 61 269 78 119 142 51 147 261 113 229 66 182 215
Moderate Democrat 72 45 27 23 26 9 13 37 18 10 1 - - 72 16 54 3 46 13 8 28 44 26 36 10 30 42
18% 20% 15% 20% 25% 9% 17% 13% 36% 24% 13% - - 18% 25% 20% 4% 38% 9% 15% 19% 17% 23% 16% 15% 17% 20%
Trump Republican 67 34 32 9 23 21 14 49 6 6 3 - - 67 4 40 23 * 56 2 16 51 15 41 10 31 31
16% 15% 18% 7% 22% 20% 17% 17% 13% 16% 35% - - 16% 7% 15% 29% * 39% 4% 11% 20% 14% 18% 15% 17% 14%
Obama Democrat 64 26 38 31 16 8 9 35 9 15 1 - - 64 19 44 1 37 3 6 18 47 24 32 7 30 34
16% 12% 21% 26% 15% 8% 11% 12% 17% 37% 13% - - 16% 31% 16% 1% 31% 2% 12% 12% 18% 22% 14% 11% 16% 16%
Reagan Republican 58 33 25 7 15 25 11 48 1 6 1 - - 58 3 33 22 7 38 8 26 32 18 35 6 34 24
14% 15% 14% 6% 14% 24% 14% 17% 2% 14% 16% - - 14% 5% 12% 29% 6% 27% 15% 18% 12% 16% 15% 9% 19% 11%
Fiscal Conservative 58 41 17 13 7 22 16 46 4 1 - - - 58 3 41 14 10 24 14 35 22 16 34 7 34 24
14% 18% 9% 11% 6% 21% 20% 16% 9% 3% - - - 14% 4% 15% 19% 8% 17% 27% 24% 9% 14% 15% 11% 19% 11%
Moderate Republican 54 34 21 14 12 15 13 31 12 1 1 - - 54 1 46 8 10 26 8 21 34 17 34 4 30 25
13% 15% 11% 12% 11% 15% 17% 11% 24% 3% 7% - - 13% 1% 17% 10% 9% 18% 16% 14% 13% 15% 15% 5% 16% 12%
Libertarian 54 28 26 25 11 10 8 41 3 5 3 - - 54 13 30 11 8 23 11 24 31 18 24 12 16 37
13% 13% 14% 21% 10% 10% 10% 15% 6% 13% 37% - - 13% 22% 11% 15% 6% 16% 22% 16% 12% 16% 11% 18% 9% 17%
Compassionate Conservative 50 24 26 11 7 13 19 40 2 4 2 - - 50 4 25 21 12 19 7 16 33 14 27 9 18 27
12% 11% 14% 9% 6% 13% 23% 14% 5% 9% 20% - - 12% 6% 9% 27% 10% 13% 15% 11% 13% 13% 12% 13% 10% 13%
Conservative Democrat 40 24 16 15 12 7 7 24 7 5 - - - 40 7 28 5 24 3 1 19 21 9 25 6 20 21
10% 11% 9% 12% 11% 6% 9% 8% 13% 12% - - - 10% 12% 10% 6% 20% 2% 2% 13% 8% 8% 11% 8% 11% 10%
Christian Conservative 39 18 21 6 18 5 11 28 5 2 1 - - 39 1 16 22 8 15 8 12 27 6 19 14 16 21
10% 8% 11% 5% 17% 5% 13% 10% 10% 5% 17% - - 10% 1% 6% 28% 7% 11% 16% 8% 10% 5% 8% 22% 9% 10%
Liberal Republican 38 14 24 17 8 10 3 31 2 2 1 - - 38 9 24 5 10 12 4 13 25 14 17 7 15 23
9% 6% 13% 15% 8% 9% 4% 11% 4% 4% 14% - - 9% 15% 9% 6% 8% 9% 9% 9% 10% 13% 7% 11% 8% 11%
Social Conservative 37 15 21 14 5 11 8 30 3 1 - - - 37 4 21 12 5 17 4 13 24 11 19 6 10 25
9% 7% 12% 11% 4% 10% 10% 10% 5% 3% - - - 9% 7% 8% 15% 5% 12% 8% 9% 9% 10% 8% 9% 6% 12%

Page 135
Fielding Period: November 27 - 28, 2018
HCAPS (Filtered on Registered Voters)
Weighted To The U.S. General Adult Population
30 Nov 2018
Table 116
LABEL1103I Which of the following labels do you most identify with?
Please rank your top three labels. Next to the first-ranked labels, enter ''1'', next to the second-ranked label, enter ''2''; next to the third-ranked label, enter ''3.''
You may select up to three options.
Summary Of Rank 1,2,3
Base: GOP
Presidential
Election Candidate
Gender Age Ethnicity Political Party Political Ideology Voted For Education Locale Income
_____________ ______________________ _______________________ ____________________ ____________________ _____________________ _____________ ________________ _________
Colle- Some
Cons- ge Gr- Colle- $75K Less
Hisp- Black Repub- Democ- Indep- Libe- Mode- erva- 3rd ad And ge Or Urb- Subu- Or Than
Total Male Female 18-34 35-49 50-64 65+ White anic /AA Other lican rat endent ral rate tive Clinton Trump Party Higher Less an rban Rural More $75K
______ _____ _______ _____ _____ _____ ____ _____ _____ _____ _____ ______ ______ ______ ______ ______ ______ ________ ______ _____ ______ ______ ____ _____ _____ ____ ____
Liberal Democrat 36 17 19 14 9 4 10 24 2 9 - - - 36 26 10 - 20 2 5 14 22 10 24 2 16 20
9% 7% 10% 12% 8% 4% 12% 8% 3% 22% - - - 9% 43% 4% - 17% 2% 9% 9% 9% 9% 11% 2% 9% 9%
Conservative Republican 32 16 16 14 9 6 3 20 4 3 2 - - 32 1 13 18 2 16 4 6 26 6 18 8 11 21
8% 7% 9% 12% 8% 6% 4% 7% 8% 7% 21% - - 8% 1% 5% 24% 2% 11% 7% 4% 10% 5% 8% 12% 6% 10%
Nationalist 32 18 14 5 10 13 4 15 4 7 2 - - 32 3 22 6 3 20 2 13 19 7 20 5 19 12
8% 8% 7% 4% 10% 13% 5% 5% 8% 18% 30% - - 8% 5% 8% 8% 3% 14% 4% 9% 7% 6% 9% 8% 10% 6%
Clinton Democrat 29 15 15 10 11 7 2 16 5 6 - - - 29 5 21 2 16 2 2 7 22 12 12 5 12 15
7% 7% 8% 8% 10% 6% 3% 6% 11% 14% - - - 7% 9% 8% 3% 14% 1% 4% 5% 8% 10% 5% 8% 7% 7%
Bush Republican 28 15 13 9 13 2 4 22 4 1 1 - - 28 3 20 4 10 11 2 10 18 10 15 3 12 16
7% 7% 7% 7% 13% 2% 5% 8% 9% 3% 8% - - 7% 5% 8% 6% 9% 7% 4% 7% 7% 9% 6% 5% 7% 7%
Democratic Socialist 26 14 13 11 8 5 3 19 2 5 - - - 26 13 12 1 11 2 4 9 17 6 18 3 9 18
6% 6% 7% 9% 7% 4% 4% 7% 3% 12% - - - 6% 22% 5% 1% 9% 2% 8% 6% 7% 6% 8% 4% 5% 8%
Socialist 26 11 15 15 5 3 3 22 - 2 1 - - 26 6 20 * 6 11 4 7 19 4 16 6 10 16
6% 5% 8% 13% 4% 3% 4% 8% - 6% 13% - - 6% 9% 7% * 5% 7% 9% 5% 7% 3% 7% 9% 5% 7%
Populist 23 14 9 9 7 5 2 14 1 6 - - - 23 5 18 * 1 16 4 8 15 5 15 2 15 8
6% 6% 5% 8% 7% 5% 2% 5% 2% 14% - - - 6% 7% 7% * 1% 12% 8% 5% 6% 5% 7% 4% 8% 4%
Other 21 16 5 3 5 9 4 17 4 1 - - - 21 2 13 6 3 7 8 11 10 2 12 7 6 11
5% 7% 3% 3% 5% 9% 4% 6% 7% 2% - - - 5% 3% 5% 8% 3% 5% 16% 8% 4% 2% 5% 10% 3% 5%
Alt-Right 9 1 8 1 7 - - 2 5 1 - - - 9 1 7 * 6 1 * 1 7 2 1 6 1 8
2% * 4% 1% 7% - - 1% 10% 2% - - - 2% 2% 3% * 5% 1% 1% 1% 3% 2% * 9% * 4%
Antifa 7 1 6 4 3 - - 4 2 - - - - 7 3 4 * 1 5 * 3 4 5 1 * 5 2
2% 1% 3% 4% 2% - - 2% 4% - - - - 2% 5% 1% 1% 1% 4% 1% 2% 2% 5% 1% 1% 3% 1%
Heartland Republican 6 3 3 * 1 3 2 4 - - - - - 6 1 3 3 1 2 1 1 5 2 1 3 3 3
1% 1% 2% * 1% 3% 2% 2% - - - - - 1% 1% 1% 4% 1% 1% 2% 1% 2% 2% * 5% 2% 1%
Communist 5 4 2 5 1 - - 3 3 - - - - 5 1 4 - - 2 - 1 5 - 4 2 2 4
1% 2% 1% 4% 1% - - 1% 5% - - - - 1% 2% 2% - - 1% - * 2% - 2% 2% 1% 2%

Page 136
Fielding Period: November 27 - 28, 2018
HCAPS (Filtered on Registered Voters)
Weighted To The U.S. General Adult Population
30 Nov 2018
Table 117
LABEL1103I_1 Which of the following labels do you most identify with?
Please rank your top three labels. Next to the first-ranked labels, enter ''1'', next to the second-ranked label, enter ''2''; next to the third-ranked label, enter ''3.''
You may select up to three options.
Compassionate Conservative
Base: GOP
Presidential
Election Candidate
Gender Age Ethnicity Political Party Political Ideology Voted For Education Locale Income
_____________ ______________________ _______________________ ____________________ ____________________ _____________________ _____________ ________________ _________
Colle- Some
Cons- ge Gr- Colle- $75K Less
Hisp- Black Repub- Democ- Indep- Libe- Mode- erva- 3rd ad And ge Or Urb- Subu- Or Than
Total Male Female 18-34 35-49 50-64 65+ White anic /AA Other lican rat endent ral rate tive Clinton Trump Party Higher Less an rban Rural More $75K
______ _____ _______ _____ _____ _____ ____ _____ _____ _____ _____ ______ ______ ______ ______ ______ ______ ________ ______ _____ ______ ______ ____ _____ _____ ____ ____
Unweighted Base 382 205 177 121 95 92 74 295 24 36 8 - - 382 77 223 82 106 124 48 149 233 92 211 79 133 243
Weighted Base 408 224 185 118 106 104 80 284 51 40 8 - - 408 61 269 78 119 142 51 147 261 113 229 66 182 215
Rank 1 15 8 8 5 1 3 6 13 - - 2 - - 15 1 4 10 * 9 2 2 13 4 8 3 3 10
4% 3% 4% 4% 1% 3% 8% 5% - - 20% - - 4% 2% 2% 12% * 7% 4% 1% 5% 4% 4% 4% 2% 4%
Rank 2 22 9 13 3 2 8 9 21 - 1 - - - 22 2 12 9 7 5 4 11 11 5 11 6 9 11
5% 4% 7% 2% 2% 8% 12% 7% - 3% - - - 5% 3% 4% 11% 6% 4% 9% 8% 4% 5% 5% 9% 5% 5%
Rank 3 12 8 5 3 4 2 3 6 2 2 - - - 12 1 9 2 4 4 1 3 9 5 8 - 6 6
3% 3% 2% 2% 4% 2% 4% 2% 5% 6% - - - 3% 2% 3% 3% 3% 3% 3% 2% 3% 4% 3% - 3% 3%
None of these 78 45 32 19 14 26 19 53 15 6 1 - - 78 3 66 8 26 16 7 23 55 23 46 9 33 42
19% 20% 18% 16% 13% 25% 24% 19% 28% 16% 13% - - 19% 6% 25% 11% 22% 11% 14% 15% 21% 20% 20% 13% 18% 20%
No Answer 281 154 127 88 86 64 43 191 34 30 5 - - 281 54 178 48 82 108 36 108 173 76 156 49 132 146
69% 69% 69% 75% 81% 62% 53% 67% 67% 75% 67% - - 69% 88% 66% 62% 68% 76% 72% 73% 66% 67% 68% 73% 72% 68%
Sigma 408 224 185 118 106 104 80 284 51 40 8 - - 408 61 269 78 119 142 51 147 261 113 229 66 182 215
100% 100% 100% 100% 100% 100% 100% 100% 100% 100% 100% - - 100% 100% 100% 100% 100% 100% 100% 100% 100% 100% 100% 100% 100% 100%

Page 137
Fielding Period: November 27 - 28, 2018
HCAPS (Filtered on Registered Voters)
Weighted To The U.S. General Adult Population
30 Nov 2018
Table 118
LABEL1103I_2 Which of the following labels do you most identify with?
Please rank your top three labels. Next to the first-ranked labels, enter ''1'', next to the second-ranked label, enter ''2''; next to the third-ranked label, enter ''3.''
You may select up to three options.
Christian Conservative
Base: GOP
Presidential
Election Candidate
Gender Age Ethnicity Political Party Political Ideology Voted For Education Locale Income
_____________ ______________________ _______________________ ____________________ ____________________ _____________________ _____________ ________________ _________
Colle- Some
Cons- ge Gr- Colle- $75K Less
Hisp- Black Repub- Democ- Indep- Libe- Mode- erva- 3rd ad And ge Or Urb- Subu- Or Than
Total Male Female 18-34 35-49 50-64 65+ White anic /AA Other lican rat endent ral rate tive Clinton Trump Party Higher Less an rban Rural More $75K
______ _____ _______ _____ _____ _____ ____ _____ _____ _____ _____ ______ ______ ______ ______ ______ ______ ________ ______ _____ ______ ______ ____ _____ _____ ____ ____
Unweighted Base 382 205 177 121 95 92 74 295 24 36 8 - - 382 77 223 82 106 124 48 149 233 92 211 79 133 243
Weighted Base 408 224 185 118 106 104 80 284 51 40 8 - - 408 61 269 78 119 142 51 147 261 113 229 66 182 215
Rank 1 22 9 13 4 9 2 8 13 5 1 - - - 22 - 12 10 7 6 3 8 14 2 9 11 8 13
5% 4% 7% 3% 8% 1% 9% 4% 10% 4% - - - 5% - 4% 12% 6% 5% 6% 5% 5% 1% 4% 16% 5% 6%
Rank 2 9 4 4 1 3 2 2 7 - - 1 - - 9 - * 9 * 6 2 2 7 3 4 2 2 4
2% 2% 2% 1% 3% 2% 3% 3% - - 17% - - 2% - * 11% * 4% 4% 1% 3% 2% 2% 3% 1% 2%
Rank 3 9 5 4 1 6 1 1 8 - 1 - - - 9 1 4 4 1 3 3 2 7 1 5 2 5 3
2% 2% 2% 1% 5% 1% 1% 3% - 2% - - - 2% 1% 2% 5% * 2% 6% 1% 3% 1% 2% 3% 3% 2%
None of these 78 45 32 19 14 26 19 53 15 6 1 - - 78 3 66 8 26 16 7 23 55 23 46 9 33 42
19% 20% 18% 16% 13% 25% 24% 19% 28% 16% 13% - - 19% 6% 25% 11% 22% 11% 14% 15% 21% 20% 20% 13% 18% 20%
No Answer 291 160 131 93 75 73 50 203 31 32 6 - - 291 57 187 47 85 111 36 112 179 84 164 43 134 152
71% 72% 71% 79% 71% 71% 63% 72% 62% 79% 70% - - 71% 93% 69% 61% 71% 78% 70% 77% 68% 75% 72% 65% 74% 71%
Sigma 408 224 185 118 106 104 80 284 51 40 8 - - 408 61 269 78 119 142 51 147 261 113 229 66 182 215
100% 100% 100% 100% 100% 100% 100% 100% 100% 100% 100% - - 100% 100% 100% 100% 100% 100% 100% 100% 100% 100% 100% 100% 100% 100%

Page 138
Fielding Period: November 27 - 28, 2018
HCAPS (Filtered on Registered Voters)
Weighted To The U.S. General Adult Population
30 Nov 2018
Table 119
LABEL1103I_3 Which of the following labels do you most identify with?
Please rank your top three labels. Next to the first-ranked labels, enter ''1'', next to the second-ranked label, enter ''2''; next to the third-ranked label, enter ''3.''
You may select up to three options.
Social Conservative
Base: GOP
Presidential
Election Candidate
Gender Age Ethnicity Political Party Political Ideology Voted For Education Locale Income
_____________ ______________________ _______________________ ____________________ ____________________ _____________________ _____________ ________________ _________
Colle- Some
Cons- ge Gr- Colle- $75K Less
Hisp- Black Repub- Democ- Indep- Libe- Mode- erva- 3rd ad And ge Or Urb- Subu- Or Than
Total Male Female 18-34 35-49 50-64 65+ White anic /AA Other lican rat endent ral rate tive Clinton Trump Party Higher Less an rban Rural More $75K
______ _____ _______ _____ _____ _____ ____ _____ _____ _____ _____ ______ ______ ______ ______ ______ ______ ________ ______ _____ ______ ______ ____ _____ _____ ____ ____
Unweighted Base 382 205 177 121 95 92 74 295 24 36 8 - - 382 77 223 82 106 124 48 149 233 92 211 79 133 243
Weighted Base 408 224 185 118 106 104 80 284 51 40 8 - - 408 61 269 78 119 142 51 147 261 113 229 66 182 215
Rank 1 12 5 7 2 2 6 2 11 - - - - - 12 2 5 5 2 3 4 4 9 3 8 1 4 7
3% 2% 4% 2% 2% 6% 2% 4% - - - - - 3% 3% 2% 7% 2% 2% 8% 2% 3% 3% 3% 2% 2% 3%
Rank 2 15 6 8 9 - 1 4 11 2 - - - - 15 - 10 4 2 8 - 3 12 5 7 4 2 13
4% 3% 4% 8% - 1% 5% 4% 4% - - - - 4% - 4% 5% 2% 6% - 2% 4% 4% 3% 5% 1% 6%
Rank 3 10 4 6 2 2 4 2 7 1 1 - - - 10 2 5 2 1 6 - 6 4 3 5 1 5 5
2% 2% 3% 2% 2% 4% 2% 2% 1% 3% - - - 2% 4% 2% 3% 1% 4% - 4% 1% 3% 2% 2% 3% 2%
None of these 78 45 32 19 14 26 19 53 15 6 1 - - 78 3 66 8 26 16 7 23 55 23 46 9 33 42
19% 20% 18% 16% 13% 25% 24% 19% 28% 16% 13% - - 19% 6% 25% 11% 22% 11% 14% 15% 21% 20% 20% 13% 18% 20%
No Answer 293 163 131 85 88 67 54 201 34 33 7 - - 293 53 182 58 88 109 40 111 182 79 163 51 139 148
72% 73% 71% 72% 83% 65% 67% 71% 66% 82% 87% - - 72% 87% 68% 74% 74% 77% 78% 76% 70% 70% 71% 78% 77% 69%
Sigma 408 224 185 118 106 104 80 284 51 40 8 - - 408 61 269 78 119 142 51 147 261 113 229 66 182 215
100% 100% 100% 100% 100% 100% 100% 100% 100% 100% 100% - - 100% 100% 100% 100% 100% 100% 100% 100% 100% 100% 100% 100% 100% 100%

Page 139
Fielding Period: November 27 - 28, 2018
HCAPS (Filtered on Registered Voters)
Weighted To The U.S. General Adult Population
30 Nov 2018
Table 120
LABEL1103I_4 Which of the following labels do you most identify with?
Please rank your top three labels. Next to the first-ranked labels, enter ''1'', next to the second-ranked label, enter ''2''; next to the third-ranked label, enter ''3.''
You may select up to three options.
Fiscal Conservative
Base: GOP
Presidential
Election Candidate
Gender Age Ethnicity Political Party Political Ideology Voted For Education Locale Income
_____________ ______________________ _______________________ ____________________ ____________________ _____________________ _____________ ________________ _________
Colle- Some
Cons- ge Gr- Colle- $75K Less
Hisp- Black Repub- Democ- Indep- Libe- Mode- erva- 3rd ad And ge Or Urb- Subu- Or Than
Total Male Female 18-34 35-49 50-64 65+ White anic /AA Other lican rat endent ral rate tive Clinton Trump Party Higher Less an rban Rural More $75K
______ _____ _______ _____ _____ _____ ____ _____ _____ _____ _____ ______ ______ ______ ______ ______ ______ ________ ______ _____ ______ ______ ____ _____ _____ ____ ____
Unweighted Base 382 205 177 121 95 92 74 295 24 36 8 - - 382 77 223 82 106 124 48 149 233 92 211 79 133 243
Weighted Base 408 224 185 118 106 104 80 284 51 40 8 - - 408 61 269 78 119 142 51 147 261 113 229 66 182 215
Rank 1 21 12 9 5 2 6 8 16 3 - - - - 21 1 16 4 4 7 5 15 6 4 14 3 14 6
5% 6% 5% 4% 2% 6% 10% 6% 6% - - - - 5% 2% 6% 5% 3% 5% 10% 10% 2% 3% 6% 4% 8% 3%
Rank 2 17 15 3 4 2 9 3 13 1 1 - - - 17 1 15 2 3 10 4 13 5 5 10 3 9 8
4% 7% 1% 3% 2% 9% 4% 5% 3% 2% - - - 4% 1% 5% 2% 3% 7% 7% 9% 2% 4% 4% 4% 5% 4%
Rank 3 19 14 5 5 3 7 6 16 - 1 - - - 19 1 10 8 3 7 5 8 12 7 10 2 11 9
5% 6% 3% 4% 3% 6% 7% 6% - 2% - - - 5% 1% 4% 11% 2% 5% 10% 5% 4% 6% 4% 3% 6% 4%
None of these 78 45 32 19 14 26 19 53 15 6 1 - - 78 3 66 8 26 16 7 23 55 23 46 9 33 42
19% 20% 18% 16% 13% 25% 24% 19% 28% 16% 13% - - 19% 6% 25% 11% 22% 11% 14% 15% 21% 20% 20% 13% 18% 20%
No Answer 272 137 136 86 85 56 45 185 32 33 7 - - 272 55 162 55 84 102 30 89 183 74 148 50 115 149
67% 61% 74% 73% 81% 54% 56% 65% 63% 81% 87% - - 67% 90% 60% 71% 70% 72% 60% 61% 70% 66% 65% 75% 63% 69%
Sigma 408 224 185 118 106 104 80 284 51 40 8 - - 408 61 269 78 119 142 51 147 261 113 229 66 182 215
100% 100% 100% 100% 100% 100% 100% 100% 100% 100% 100% - - 100% 100% 100% 100% 100% 100% 100% 100% 100% 100% 100% 100% 100% 100%

Page 140
Fielding Period: November 27 - 28, 2018
HCAPS (Filtered on Registered Voters)
Weighted To The U.S. General Adult Population
30 Nov 2018
Table 121
LABEL1103I_5 Which of the following labels do you most identify with?
Please rank your top three labels. Next to the first-ranked labels, enter ''1'', next to the second-ranked label, enter ''2''; next to the third-ranked label, enter ''3.''
You may select up to three options.
Trump Republican
Base: GOP
Presidential
Election Candidate
Gender Age Ethnicity Political Party Political Ideology Voted For Education Locale Income
_____________ ______________________ _______________________ ____________________ ____________________ _____________________ _____________ ________________ _________
Colle- Some
Cons- ge Gr- Colle- $75K Less
Hisp- Black Repub- Democ- Indep- Libe- Mode- erva- 3rd ad And ge Or Urb- Subu- Or Than
Total Male Female 18-34 35-49 50-64 65+ White anic /AA Other lican rat endent ral rate tive Clinton Trump Party Higher Less an rban Rural More $75K
______ _____ _______ _____ _____ _____ ____ _____ _____ _____ _____ ______ ______ ______ ______ ______ ______ ________ ______ _____ ______ ______ ____ _____ _____ ____ ____
Unweighted Base 382 205 177 121 95 92 74 295 24 36 8 - - 382 77 223 82 106 124 48 149 233 92 211 79 133 243
Weighted Base 408 224 185 118 106 104 80 284 51 40 8 - - 408 61 269 78 119 142 51 147 261 113 229 66 182 215
Rank 1 30 9 21 5 10 13 3 24 4 1 1 - - 30 2 23 5 * 26 - 7 24 7 18 5 16 14
7% 4% 11% 4% 9% 12% 4% 8% 9% 2% 16% - - 7% 3% 8% 7% * 18% - 4% 9% 6% 8% 8% 9% 7%
Rank 2 10 8 2 1 3 4 2 10 - - - - - 10 - 3 7 - 9 - 3 7 - 7 2 4 6
2% 3% 1% 1% 3% 4% 2% 3% - - - - - 2% - 1% 9% - 6% - 2% 3% - 3% 4% 2% 3%
Rank 3 27 18 9 3 11 4 9 15 2 6 2 - - 27 2 14 11 - 21 2 6 21 9 15 3 12 10
7% 8% 5% 2% 10% 4% 11% 5% 4% 14% 20% - - 7% 3% 5% 14% - 15% 4% 4% 8% 8% 7% 4% 7% 5%
None of these 78 45 32 19 14 26 19 53 15 6 1 - - 78 3 66 8 26 16 7 23 55 23 46 9 33 42
19% 20% 18% 16% 13% 25% 24% 19% 28% 16% 13% - - 19% 6% 25% 11% 22% 11% 14% 15% 21% 20% 20% 13% 18% 20%
No Answer 264 144 120 90 69 57 47 182 30 27 4 - - 264 54 163 47 93 71 42 109 155 75 142 47 118 142
65% 64% 65% 76% 65% 55% 59% 64% 59% 68% 51% - - 65% 87% 61% 60% 78% 50% 82% 74% 59% 66% 62% 71% 65% 66%
Sigma 408 224 185 118 106 104 80 284 51 40 8 - - 408 61 269 78 119 142 51 147 261 113 229 66 182 215
100% 100% 100% 100% 100% 100% 100% 100% 100% 100% 100% - - 100% 100% 100% 100% 100% 100% 100% 100% 100% 100% 100% 100% 100% 100%
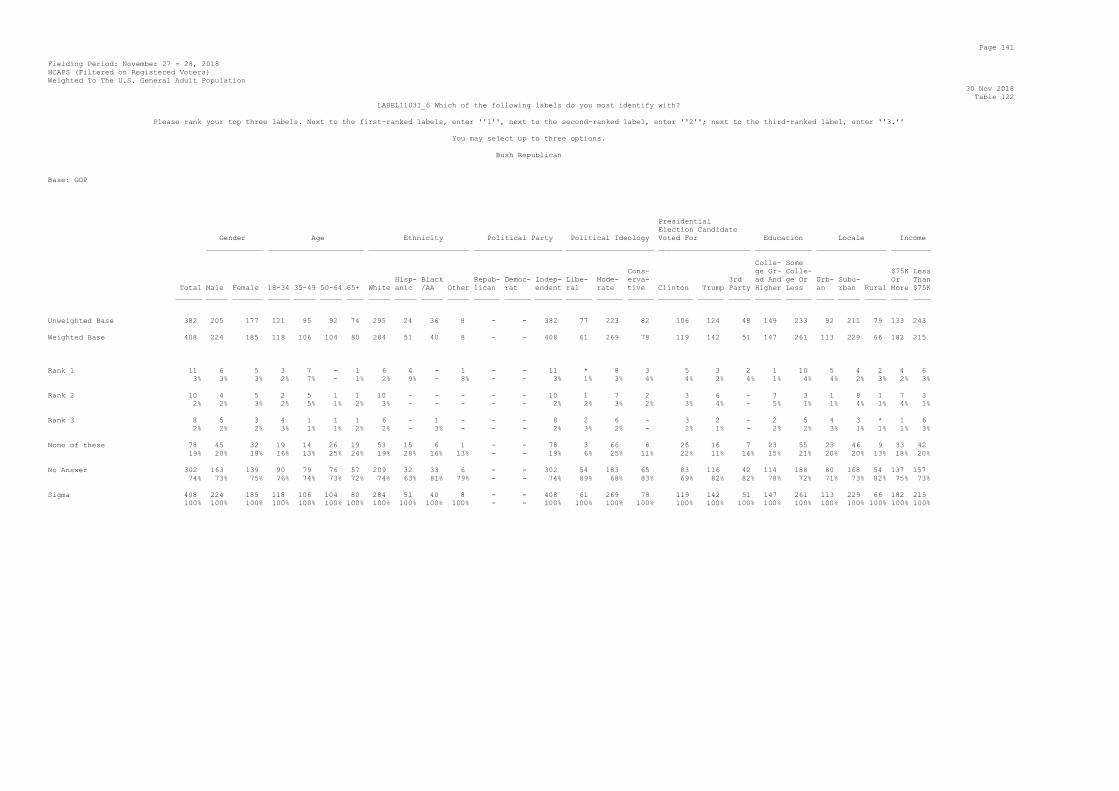
Page 141
Fielding Period: November 27 - 28, 2018
HCAPS (Filtered on Registered Voters)
Weighted To The U.S. General Adult Population
30 Nov 2018
Table 122
LABEL1103I_6 Which of the following labels do you most identify with?
Please rank your top three labels. Next to the first-ranked labels, enter ''1'', next to the second-ranked label, enter ''2''; next to the third-ranked label, enter ''3.''
You may select up to three options.
Bush Republican
Base: GOP
Presidential
Election Candidate
Gender Age Ethnicity Political Party Political Ideology Voted For Education Locale Income
_____________ ______________________ _______________________ ____________________ ____________________ _____________________ _____________ ________________ _________
Colle- Some
Cons- ge Gr- Colle- $75K Less
Hisp- Black Repub- Democ- Indep- Libe- Mode- erva- 3rd ad And ge Or Urb- Subu- Or Than
Total Male Female 18-34 35-49 50-64 65+ White anic /AA Other lican rat endent ral rate tive Clinton Trump Party Higher Less an rban Rural More $75K
______ _____ _______ _____ _____ _____ ____ _____ _____ _____ _____ ______ ______ ______ ______ ______ ______ ________ ______ _____ ______ ______ ____ _____ _____ ____ ____
Unweighted Base 382 205 177 121 95 92 74 295 24 36 8 - - 382 77 223 82 106 124 48 149 233 92 211 79 133 243
Weighted Base 408 224 185 118 106 104 80 284 51 40 8 - - 408 61 269 78 119 142 51 147 261 113 229 66 182 215
Rank 1 11 6 5 3 7 - 1 6 4 - 1 - - 11 * 8 3 5 3 2 1 10 5 4 2 4 6
3% 3% 3% 2% 7% - 1% 2% 9% - 8% - - 3% 1% 3% 4% 4% 2% 4% 1% 4% 4% 2% 3% 2% 3%
Rank 2 10 4 5 2 5 1 1 10 - - - - - 10 1 7 2 3 6 - 7 3 1 8 1 7 3
2% 2% 3% 2% 5% 1% 2% 3% - - - - - 2% 2% 3% 2% 3% 4% - 5% 1% 1% 4% 1% 4% 1%
Rank 3 8 5 3 4 1 1 1 6 - 1 - - - 8 2 6 - 3 2 - 2 5 4 3 * 1 6
2% 2% 2% 3% 1% 1% 2% 2% - 3% - - - 2% 3% 2% - 2% 1% - 2% 2% 3% 1% 1% 1% 3%
None of these 78 45 32 19 14 26 19 53 15 6 1 - - 78 3 66 8 26 16 7 23 55 23 46 9 33 42
19% 20% 18% 16% 13% 25% 24% 19% 28% 16% 13% - - 19% 6% 25% 11% 22% 11% 14% 15% 21% 20% 20% 13% 18% 20%
No Answer 302 163 139 90 79 76 57 209 32 33 6 - - 302 54 183 65 83 116 42 114 188 80 168 54 137 157
74% 73% 75% 76% 74% 73% 72% 74% 63% 81% 79% - - 74% 89% 68% 83% 69% 82% 82% 78% 72% 71% 73% 82% 75% 73%
Sigma 408 224 185 118 106 104 80 284 51 40 8 - - 408 61 269 78 119 142 51 147 261 113 229 66 182 215
100% 100% 100% 100% 100% 100% 100% 100% 100% 100% 100% - - 100% 100% 100% 100% 100% 100% 100% 100% 100% 100% 100% 100% 100% 100%

Page 142
Fielding Period: November 27 - 28, 2018
HCAPS (Filtered on Registered Voters)
Weighted To The U.S. General Adult Population
30 Nov 2018
Table 123
LABEL1103I_7 Which of the following labels do you most identify with?
Please rank your top three labels. Next to the first-ranked labels, enter ''1'', next to the second-ranked label, enter ''2''; next to the third-ranked label, enter ''3.''
You may select up to three options.
Reagan Republican
Base: GOP
Presidential
Election Candidate
Gender Age Ethnicity Political Party Political Ideology Voted For Education Locale Income
_____________ ______________________ _______________________ ____________________ ____________________ _____________________ _____________ ________________ _________
Colle- Some
Cons- ge Gr- Colle- $75K Less
Hisp- Black Repub- Democ- Indep- Libe- Mode- erva- 3rd ad And ge Or Urb- Subu- Or Than
Total Male Female 18-34 35-49 50-64 65+ White anic /AA Other lican rat endent ral rate tive Clinton Trump Party Higher Less an rban Rural More $75K
______ _____ _______ _____ _____ _____ ____ _____ _____ _____ _____ ______ ______ ______ ______ ______ ______ ________ ______ _____ ______ ______ ____ _____ _____ ____ ____
Unweighted Base 382 205 177 121 95 92 74 295 24 36 8 - - 382 77 223 82 106 124 48 149 233 92 211 79 133 243
Weighted Base 408 224 185 118 106 104 80 284 51 40 8 - - 408 61 269 78 119 142 51 147 261 113 229 66 182 215
Rank 1 21 18 3 2 3 10 6 19 - - - - - 21 - 12 9 2 13 5 14 7 6 14 1 12 8
5% 8% 2% 2% 3% 9% 7% 7% - - - - - 5% - 4% 12% 1% 9% 10% 10% 3% 5% 6% 1% 7% 4%
Rank 2 19 6 13 2 3 11 3 17 1 1 - - - 19 2 11 6 1 15 - 6 13 6 11 2 11 9
5% 3% 7% 2% 2% 11% 4% 6% 2% 2% - - - 5% 4% 4% 8% 1% 10% - 4% 5% 5% 5% 4% 6% 4%
Rank 3 18 9 9 3 9 4 2 12 - 5 1 - - 18 1 10 7 5 10 3 6 12 6 9 3 11 7
4% 4% 5% 2% 9% 4% 3% 4% - 12% 16% - - 4% 1% 4% 9% 4% 7% 5% 4% 5% 5% 4% 4% 6% 3%
None of these 78 45 32 19 14 26 19 53 15 6 1 - - 78 3 66 8 26 16 7 23 55 23 46 9 33 42
19% 20% 18% 16% 13% 25% 24% 19% 28% 16% 13% - - 19% 6% 25% 11% 22% 11% 14% 15% 21% 20% 20% 13% 18% 20%
No Answer 272 145 127 92 77 52 50 182 35 28 6 - - 272 55 170 47 86 88 36 98 174 73 148 52 115 149
67% 65% 69% 78% 73% 51% 63% 64% 69% 71% 71% - - 67% 90% 63% 61% 72% 62% 71% 67% 67% 64% 64% 78% 63% 69%
Sigma 408 224 185 118 106 104 80 284 51 40 8 - - 408 61 269 78 119 142 51 147 261 113 229 66 182 215
100% 100% 100% 100% 100% 100% 100% 100% 100% 100% 100% - - 100% 100% 100% 100% 100% 100% 100% 100% 100% 100% 100% 100% 100% 100%

Page 143
Fielding Period: November 27 - 28, 2018
HCAPS (Filtered on Registered Voters)
Weighted To The U.S. General Adult Population
30 Nov 2018
Table 124
LABEL1103I_8 Which of the following labels do you most identify with?
Please rank your top three labels. Next to the first-ranked labels, enter ''1'', next to the second-ranked label, enter ''2''; next to the third-ranked label, enter ''3.''
You may select up to three options.
Heartland Republican
Base: GOP
Presidential
Election Candidate
Gender Age Ethnicity Political Party Political Ideology Voted For Education Locale Income
_____________ ______________________ _______________________ ____________________ ____________________ _____________________ _____________ ________________ _________
Colle- Some
Cons- ge Gr- Colle- $75K Less
Hisp- Black Repub- Democ- Indep- Libe- Mode- erva- 3rd ad And ge Or Urb- Subu- Or Than
Total Male Female 18-34 35-49 50-64 65+ White anic /AA Other lican rat endent ral rate tive Clinton Trump Party Higher Less an rban Rural More $75K
______ _____ _______ _____ _____ _____ ____ _____ _____ _____ _____ ______ ______ ______ ______ ______ ______ ________ ______ _____ ______ ______ ____ _____ _____ ____ ____
Unweighted Base 382 205 177 121 95 92 74 295 24 36 8 - - 382 77 223 82 106 124 48 149 233 92 211 79 133 243
Weighted Base 408 224 185 118 106 104 80 284 51 40 8 - - 408 61 269 78 119 142 51 147 261 113 229 66 182 215
Rank 1 * * - - - * - * - - - - - * - * - * - - - * - - * - *
* * - - - * - * - - - - - * - * - * - - - * - - 1% - *
Rank 2 - - - - - - - - - - - - - - - - - - - - - - - - - - -
- - - - - - - - - - - - - - - - - - - - - - - - - - -
Rank 3 6 3 3 * 1 3 2 4 - - - - - 6 1 2 3 1 2 1 1 5 2 1 3 3 2
1% 1% 2% * 1% 3% 2% 1% - - - - - 1% 1% 1% 4% 1% 1% 2% 1% 2% 2% * 4% 2% 1%
None of these 78 45 32 19 14 26 19 53 15 6 1 - - 78 3 66 8 26 16 7 23 55 23 46 9 33 42
19% 20% 18% 16% 13% 25% 24% 19% 28% 16% 13% - - 19% 6% 25% 11% 22% 11% 14% 15% 21% 20% 20% 13% 18% 20%
No Answer 324 175 149 98 92 75 60 226 36 34 7 - - 324 57 201 66 92 124 43 123 201 88 182 54 146 170
79% 78% 81% 83% 86% 72% 74% 80% 72% 84% 87% - - 79% 93% 75% 86% 77% 88% 84% 84% 77% 78% 79% 82% 80% 79%
Sigma 408 224 185 118 106 104 80 284 51 40 8 - - 408 61 269 78 119 142 51 147 261 113 229 66 182 215
100% 100% 100% 100% 100% 100% 100% 100% 100% 100% 100% - - 100% 100% 100% 100% 100% 100% 100% 100% 100% 100% 100% 100% 100% 100%

Page 144
Fielding Period: November 27 - 28, 2018
HCAPS (Filtered on Registered Voters)
Weighted To The U.S. General Adult Population
30 Nov 2018
Table 125
LABEL1103I_9 Which of the following labels do you most identify with?
Please rank your top three labels. Next to the first-ranked labels, enter ''1'', next to the second-ranked label, enter ''2''; next to the third-ranked label, enter ''3.''
You may select up to three options.
Liberal Republican
Base: GOP
Presidential
Election Candidate
Gender Age Ethnicity Political Party Political Ideology Voted For Education Locale Income
_____________ ______________________ _______________________ ____________________ ____________________ _____________________ _____________ ________________ _________
Colle- Some
Cons- ge Gr- Colle- $75K Less
Hisp- Black Repub- Democ- Indep- Libe- Mode- erva- 3rd ad And ge Or Urb- Subu- Or Than
Total Male Female 18-34 35-49 50-64 65+ White anic /AA Other lican rat endent ral rate tive Clinton Trump Party Higher Less an rban Rural More $75K
______ _____ _______ _____ _____ _____ ____ _____ _____ _____ _____ ______ ______ ______ ______ ______ ______ ________ ______ _____ ______ ______ ____ _____ _____ ____ ____
Unweighted Base 382 205 177 121 95 92 74 295 24 36 8 - - 382 77 223 82 106 124 48 149 233 92 211 79 133 243
Weighted Base 408 224 185 118 106 104 80 284 51 40 8 - - 408 61 269 78 119 142 51 147 261 113 229 66 182 215
Rank 1 10 5 5 4 2 1 3 9 1 - - - - 10 6 4 1 4 3 * 4 6 2 5 2 2 8
2% 2% 3% 3% 2% 1% 3% 3% 1% - - - - 2% 9% 1% 1% 3% 2% 1% 3% 2% 2% 2% 3% 1% 4%
Rank 2 13 5 8 6 5 1 1 9 - 2 1 - - 13 2 11 - 2 3 1 4 8 3 7 3 4 9
3% 2% 4% 5% 5% 1% 1% 3% - 4% 14% - - 3% 3% 4% - 2% 2% 2% 3% 3% 2% 3% 5% 2% 4%
Rank 3 16 4 12 7 1 8 - 13 1 - - - - 16 2 10 4 4 6 3 5 11 9 5 1 9 7
4% 2% 6% 6% 1% 8% - 4% 3% - - - - 4% 3% 4% 5% 3% 4% 6% 3% 4% 8% 2% 2% 5% 3%
None of these 78 45 32 19 14 26 19 53 15 6 1 - - 78 3 66 8 26 16 7 23 55 23 46 9 33 42
19% 20% 18% 16% 13% 25% 24% 19% 28% 16% 13% - - 19% 6% 25% 11% 22% 11% 14% 15% 21% 20% 20% 13% 18% 20%
No Answer 292 164 128 81 84 68 58 200 34 32 6 - - 292 49 179 65 84 114 40 111 181 76 166 50 135 149
72% 73% 69% 69% 80% 66% 72% 71% 68% 80% 73% - - 72% 80% 66% 83% 70% 80% 78% 76% 69% 67% 72% 76% 74% 70%
Sigma 408 224 185 118 106 104 80 284 51 40 8 - - 408 61 269 78 119 142 51 147 261 113 229 66 182 215
100% 100% 100% 100% 100% 100% 100% 100% 100% 100% 100% - - 100% 100% 100% 100% 100% 100% 100% 100% 100% 100% 100% 100% 100% 100%

Page 145
Fielding Period: November 27 - 28, 2018
HCAPS (Filtered on Registered Voters)
Weighted To The U.S. General Adult Population
30 Nov 2018
Table 126
LABEL1103I_10 Which of the following labels do you most identify with?
Please rank your top three labels. Next to the first-ranked labels, enter ''1'', next to the second-ranked label, enter ''2''; next to the third-ranked label, enter ''3.''
You may select up to three options.
Moderate Republican
Base: GOP
Presidential
Election Candidate
Gender Age Ethnicity Political Party Political Ideology Voted For Education Locale Income
_____________ ______________________ _______________________ ____________________ ____________________ _____________________ _____________ ________________ _________
Colle- Some
Cons- ge Gr- Colle- $75K Less
Hisp- Black Repub- Democ- Indep- Libe- Mode- erva- 3rd ad And ge Or Urb- Subu- Or Than
Total Male Female 18-34 35-49 50-64 65+ White anic /AA Other lican rat endent ral rate tive Clinton Trump Party Higher Less an rban Rural More $75K
______ _____ _______ _____ _____ _____ ____ _____ _____ _____ _____ ______ ______ ______ ______ ______ ______ ________ ______ _____ ______ ______ ____ _____ _____ ____ ____
Unweighted Base 382 205 177 121 95 92 74 295 24 36 8 - - 382 77 223 82 106 124 48 149 233 92 211 79 133 243
Weighted Base 408 224 185 118 106 104 80 284 51 40 8 - - 408 61 269 78 119 142 51 147 261 113 229 66 182 215
Rank 1 13 8 6 4 1 5 3 12 - 1 - - - 13 - 9 4 2 7 - 3 11 3 9 2 5 9
3% 4% 3% 3% 1% 5% 4% 4% - 3% - - - 3% - 4% 5% 1% 5% - 2% 4% 3% 4% 3% 3% 4%
Rank 2 27 22 6 5 8 9 6 11 10 - 1 - - 27 1 24 2 8 12 6 11 17 11 15 2 15 12
7% 10% 3% 4% 7% 8% 7% 4% 19% - 7% - - 7% 1% 9% 3% 7% 8% 12% 7% 6% 9% 7% 3% 8% 6%
Rank 3 14 4 9 5 3 1 4 8 3 - - - - 14 - 12 2 1 7 2 7 6 3 10 - 10 4
3% 2% 5% 4% 3% 1% 5% 3% 6% - - - - 3% - 4% 2% 1% 5% 4% 5% 2% 3% 4% - 5% 2%
None of these 78 45 32 19 14 26 19 53 15 6 1 - - 78 3 66 8 26 16 7 23 55 23 46 9 33 42
19% 20% 18% 16% 13% 25% 24% 19% 28% 16% 13% - - 19% 6% 25% 11% 22% 11% 14% 15% 21% 20% 20% 13% 18% 20%
No Answer 276 144 132 85 80 63 48 200 24 33 7 - - 276 57 157 61 83 100 36 103 172 73 149 54 120 148
68% 64% 71% 72% 76% 60% 60% 70% 47% 82% 80% - - 68% 93% 58% 79% 70% 71% 71% 70% 66% 65% 65% 81% 66% 69%
Sigma 408 224 185 118 106 104 80 284 51 40 8 - - 408 61 269 78 119 142 51 147 261 113 229 66 182 215
100% 100% 100% 100% 100% 100% 100% 100% 100% 100% 100% - - 100% 100% 100% 100% 100% 100% 100% 100% 100% 100% 100% 100% 100% 100%

Page 146
Fielding Period: November 27 - 28, 2018
HCAPS (Filtered on Registered Voters)
Weighted To The U.S. General Adult Population
30 Nov 2018
Table 127
LABEL1103I_11 Which of the following labels do you most identify with?
Please rank your top three labels. Next to the first-ranked labels, enter ''1'', next to the second-ranked label, enter ''2''; next to the third-ranked label, enter ''3.''
You may select up to three options.
Conservative Republican
Base: GOP
Presidential
Election Candidate
Gender Age Ethnicity Political Party Political Ideology Voted For Education Locale Income
_____________ ______________________ _______________________ ____________________ ____________________ _____________________ _____________ ________________ _________
Colle- Some
Cons- ge Gr- Colle- $75K Less
Hisp- Black Repub- Democ- Indep- Libe- Mode- erva- 3rd ad And ge Or Urb- Subu- Or Than
Total Male Female 18-34 35-49 50-64 65+ White anic /AA Other lican rat endent ral rate tive Clinton Trump Party Higher Less an rban Rural More $75K
______ _____ _______ _____ _____ _____ ____ _____ _____ _____ _____ ______ ______ ______ ______ ______ ______ ________ ______ _____ ______ ______ ____ _____ _____ ____ ____
Unweighted Base 382 205 177 121 95 92 74 295 24 36 8 - - 382 77 223 82 106 124 48 149 233 92 211 79 133 243
Weighted Base 408 224 185 118 106 104 80 284 51 40 8 - - 408 61 269 78 119 142 51 147 261 113 229 66 182 215
Rank 1 10 4 5 5 1 3 - 7 2 1 - - - 10 1 3 6 1 6 - 1 8 3 4 2 3 7
2% 2% 3% 5% 1% 3% - 2% 4% 2% - - - 2% 1% 1% 8% 1% 4% - 1% 3% 3% 2% 3% 1% 3%
Rank 2 11 6 5 2 4 2 3 8 - 1 - - - 11 - 3 8 - 6 4 3 8 2 7 2 7 5
3% 3% 3% 2% 4% 2% 4% 3% - 2% - - - 3% - 1% 11% - 4% 7% 2% 3% 1% 3% 3% 4% 2%
Rank 3 11 5 6 6 4 1 - 6 2 1 2 - - 11 - 7 4 1 4 - 1 10 1 6 4 2 9
3% 2% 3% 5% 3% 1% - 2% 4% 3% 21% - - 3% - 3% 5% 1% 3% - 1% 4% 1% 3% 6% 1% 4%
None of these 78 45 32 19 14 26 19 53 15 6 1 - - 78 3 66 8 26 16 7 23 55 23 46 9 33 42
19% 20% 18% 16% 13% 25% 24% 19% 28% 16% 13% - - 19% 6% 25% 11% 22% 11% 14% 15% 21% 20% 20% 13% 18% 20%
No Answer 298 162 136 85 83 72 58 210 32 31 5 - - 298 57 190 51 92 110 40 118 180 84 165 49 139 152
73% 73% 74% 72% 79% 70% 72% 74% 63% 78% 65% - - 73% 93% 71% 65% 77% 78% 80% 81% 69% 75% 72% 74% 76% 71%
Sigma 408 224 185 118 106 104 80 284 51 40 8 - - 408 61 269 78 119 142 51 147 261 113 229 66 182 215
100% 100% 100% 100% 100% 100% 100% 100% 100% 100% 100% - - 100% 100% 100% 100% 100% 100% 100% 100% 100% 100% 100% 100% 100% 100%

Page 147
Fielding Period: November 27 - 28, 2018
HCAPS (Filtered on Registered Voters)
Weighted To The U.S. General Adult Population
30 Nov 2018
Table 128
LABEL1103I_12 Which of the following labels do you most identify with?
Please rank your top three labels. Next to the first-ranked labels, enter ''1'', next to the second-ranked label, enter ''2''; next to the third-ranked label, enter ''3.''
You may select up to three options.
Communist
Base: GOP
Presidential
Election Candidate
Gender Age Ethnicity Political Party Political Ideology Voted For Education Locale Income
_____________ ______________________ _______________________ ____________________ ____________________ _____________________ _____________ ________________ _________
Colle- Some
Cons- ge Gr- Colle- $75K Less
Hisp- Black Repub- Democ- Indep- Libe- Mode- erva- 3rd ad And ge Or Urb- Subu- Or Than
Total Male Female 18-34 35-49 50-64 65+ White anic /AA Other lican rat endent ral rate tive Clinton Trump Party Higher Less an rban Rural More $75K
______ _____ _______ _____ _____ _____ ____ _____ _____ _____ _____ ______ ______ ______ ______ ______ ______ ________ ______ _____ ______ ______ ____ _____ _____ ____ ____
Unweighted Base 382 205 177 121 95 92 74 295 24 36 8 - - 382 77 223 82 106 124 48 149 233 92 211 79 133 243
Weighted Base 408 224 185 118 106 104 80 284 51 40 8 - - 408 61 269 78 119 142 51 147 261 113 229 66 182 215
Rank 1 - - - - - - - - - - - - - - - - - - - - - - - - - - -
- - - - - - - - - - - - - - - - - - - - - - - - - - -
Rank 2 3 3 * 2 1 - - * 3 - - - - 3 1 2 - - 1 - 1 2 - 3 * * 3
1% 1% * 2% 1% - - * 5% - - - - 1% 2% 1% - - 1% - * 1% - 1% 1% * 1%
Rank 3 2 1 1 2 - - - 2 - - - - - 2 - 2 - - 1 - - 2 - 1 1 1 1
1% * 1% 2% - - - 1% - - - - - 1% - 1% - - 1% - - 1% - * 2% 1% *
None of these 78 45 32 19 14 26 19 53 15 6 1 - - 78 3 66 8 26 16 7 23 55 23 46 9 33 42
19% 20% 18% 16% 13% 25% 24% 19% 28% 16% 13% - - 19% 6% 25% 11% 22% 11% 14% 15% 21% 20% 20% 13% 18% 20%
No Answer 325 174 151 94 92 78 61 228 34 34 7 - - 325 57 199 69 93 124 44 124 201 90 179 56 148 169
80% 78% 82% 80% 87% 75% 76% 80% 66% 84% 87% - - 80% 93% 74% 89% 78% 88% 86% 84% 77% 80% 78% 84% 81% 79%
Sigma 408 224 185 118 106 104 80 284 51 40 8 - - 408 61 269 78 119 142 51 147 261 113 229 66 182 215
100% 100% 100% 100% 100% 100% 100% 100% 100% 100% 100% - - 100% 100% 100% 100% 100% 100% 100% 100% 100% 100% 100% 100% 100% 100%

Page 148
Fielding Period: November 27 - 28, 2018
HCAPS (Filtered on Registered Voters)
Weighted To The U.S. General Adult Population
30 Nov 2018
Table 129
LABEL1103I_13 Which of the following labels do you most identify with?
Please rank your top three labels. Next to the first-ranked labels, enter ''1'', next to the second-ranked label, enter ''2''; next to the third-ranked label, enter ''3.''
You may select up to three options.
Socialist
Base: GOP
Presidential
Election Candidate
Gender Age Ethnicity Political Party Political Ideology Voted For Education Locale Income
_____________ ______________________ _______________________ ____________________ ____________________ _____________________ _____________ ________________ _________
Colle- Some
Cons- ge Gr- Colle- $75K Less
Hisp- Black Repub- Democ- Indep- Libe- Mode- erva- 3rd ad And ge Or Urb- Subu- Or Than
Total Male Female 18-34 35-49 50-64 65+ White anic /AA Other lican rat endent ral rate tive Clinton Trump Party Higher Less an rban Rural More $75K
______ _____ _______ _____ _____ _____ ____ _____ _____ _____ _____ ______ ______ ______ ______ ______ ______ ________ ______ _____ ______ ______ ____ _____ _____ ____ ____
Unweighted Base 382 205 177 121 95 92 74 295 24 36 8 - - 382 77 223 82 106 124 48 149 233 92 211 79 133 243
Weighted Base 408 224 185 118 106 104 80 284 51 40 8 - - 408 61 269 78 119 142 51 147 261 113 229 66 182 215
Rank 1 7 5 2 1 4 1 - 7 - - - - - 7 1 5 * 1 5 1 6 1 1 1 5 4 2
2% 2% 1% 1% 4% 1% - 2% - - - - - 2% 2% 2% * 1% 3% 2% 4% * 1% * 7% 2% 1%
Rank 2 7 1 6 6 - - 1 6 - 1 - - - 7 - 7 - 1 - 1 1 6 - 6 1 4 3
2% * 3% 5% - - 1% 2% - 2% - - - 2% - 2% - 1% - 3% 1% 2% - 3% 1% 2% 1%
Rank 3 13 5 8 8 * 2 2 10 - 2 1 - - 13 4 8 - 4 6 2 * 12 3 9 1 2 11
3% 2% 4% 7% * 2% 3% 3% - 4% 13% - - 3% 7% 3% - 3% 4% 4% * 5% 3% 4% 1% 1% 5%
None of these 78 45 32 19 14 26 19 53 15 6 1 - - 78 3 66 8 26 16 7 23 55 23 46 9 33 42
19% 20% 18% 16% 13% 25% 24% 19% 28% 16% 13% - - 19% 6% 25% 11% 22% 11% 14% 15% 21% 20% 20% 13% 18% 20%
No Answer 305 167 137 84 88 75 58 209 36 32 6 - - 305 52 183 69 88 116 40 117 187 86 167 51 140 157
75% 75% 74% 71% 83% 72% 72% 74% 72% 78% 74% - - 75% 85% 68% 89% 74% 82% 78% 80% 72% 77% 73% 77% 77% 73%
Sigma 408 224 185 118 106 104 80 284 51 40 8 - - 408 61 269 78 119 142 51 147 261 113 229 66 182 215
100% 100% 100% 100% 100% 100% 100% 100% 100% 100% 100% - - 100% 100% 100% 100% 100% 100% 100% 100% 100% 100% 100% 100% 100% 100%

Page 149
Fielding Period: November 27 - 28, 2018
HCAPS (Filtered on Registered Voters)
Weighted To The U.S. General Adult Population
30 Nov 2018
Table 130
LABEL1103I_14 Which of the following labels do you most identify with?
Please rank your top three labels. Next to the first-ranked labels, enter ''1'', next to the second-ranked label, enter ''2''; next to the third-ranked label, enter ''3.''
You may select up to three options.
Democratic Socialist
Base: GOP
Presidential
Election Candidate
Gender Age Ethnicity Political Party Political Ideology Voted For Education Locale Income
_____________ ______________________ _______________________ ____________________ ____________________ _____________________ _____________ ________________ _________
Colle- Some
Cons- ge Gr- Colle- $75K Less
Hisp- Black Repub- Democ- Indep- Libe- Mode- erva- 3rd ad And ge Or Urb- Subu- Or Than
Total Male Female 18-34 35-49 50-64 65+ White anic /AA Other lican rat endent ral rate tive Clinton Trump Party Higher Less an rban Rural More $75K
______ _____ _______ _____ _____ _____ ____ _____ _____ _____ _____ ______ ______ ______ ______ ______ ______ ________ ______ _____ ______ ______ ____ _____ _____ ____ ____
Unweighted Base 382 205 177 121 95 92 74 295 24 36 8 - - 382 77 223 82 106 124 48 149 233 92 211 79 133 243
Weighted Base 408 224 185 118 106 104 80 284 51 40 8 - - 408 61 269 78 119 142 51 147 261 113 229 66 182 215
Rank 1 12 6 6 6 3 - 3 9 - 1 - - - 12 7 5 - 5 1 1 4 8 * 10 1 7 5
3% 3% 3% 5% 3% - 3% 3% - 3% - - - 3% 11% 2% - 4% 1% 2% 3% 3% * 4% 2% 4% 2%
Rank 2 9 2 6 3 3 3 1 7 - 2 - - - 9 6 2 1 3 - 3 3 5 3 5 1 * 8
2% 1% 3% 2% 3% 3% 1% 2% - 5% - - - 2% 9% 1% 1% 3% - 6% 2% 2% 3% 2% 1% * 4%
Rank 3 6 5 1 2 2 2 - 3 2 1 - - - 6 1 5 - 3 1 * 2 4 3 3 * 2 4
1% 2% * 2% 2% 2% - 1% 3% 3% - - - 1% 2% 2% - 3% 1% 1% 1% 2% 2% 1% 1% 1% 2%
None of these 78 45 32 19 14 26 19 53 15 6 1 - - 78 3 66 8 26 16 7 23 55 23 46 9 33 42
19% 20% 18% 16% 13% 25% 24% 19% 28% 16% 13% - - 19% 6% 25% 11% 22% 11% 14% 15% 21% 20% 20% 13% 18% 20%
No Answer 304 164 140 88 84 73 58 212 35 29 7 - - 304 44 191 68 83 124 40 115 189 84 165 55 141 155
74% 73% 76% 75% 80% 71% 72% 75% 68% 73% 87% - - 74% 72% 71% 88% 69% 87% 78% 78% 72% 74% 72% 83% 77% 72%
Sigma 408 224 185 118 106 104 80 284 51 40 8 - - 408 61 269 78 119 142 51 147 261 113 229 66 182 215
100% 100% 100% 100% 100% 100% 100% 100% 100% 100% 100% - - 100% 100% 100% 100% 100% 100% 100% 100% 100% 100% 100% 100% 100% 100%

Page 150
Fielding Period: November 27 - 28, 2018
HCAPS (Filtered on Registered Voters)
Weighted To The U.S. General Adult Population
30 Nov 2018
Table 131
LABEL1103I_15 Which of the following labels do you most identify with?
Please rank your top three labels. Next to the first-ranked labels, enter ''1'', next to the second-ranked label, enter ''2''; next to the third-ranked label, enter ''3.''
You may select up to three options.
Liberal Democrat
Base: GOP
Presidential
Election Candidate
Gender Age Ethnicity Political Party Political Ideology Voted For Education Locale Income
_____________ ______________________ _______________________ ____________________ ____________________ _____________________ _____________ ________________ _________
Colle- Some
Cons- ge Gr- Colle- $75K Less
Hisp- Black Repub- Democ- Indep- Libe- Mode- erva- 3rd ad And ge Or Urb- Subu- Or Than
Total Male Female 18-34 35-49 50-64 65+ White anic /AA Other lican rat endent ral rate tive Clinton Trump Party Higher Less an rban Rural More $75K
______ _____ _______ _____ _____ _____ ____ _____ _____ _____ _____ ______ ______ ______ ______ ______ ______ ________ ______ _____ ______ ______ ____ _____ _____ ____ ____
Unweighted Base 382 205 177 121 95 92 74 295 24 36 8 - - 382 77 223 82 106 124 48 149 233 92 211 79 133 243
Weighted Base 408 224 185 118 106 104 80 284 51 40 8 - - 408 61 269 78 119 142 51 147 261 113 229 66 182 215
Rank 1 19 8 11 8 4 3 4 11 2 6 - - - 19 14 4 - 12 - 3 8 11 7 11 * 7 12
5% 3% 6% 7% 4% 3% 5% 4% 3% 15% - - - 5% 24% 2% - 10% - 5% 5% 4% 6% 5% * 4% 5%
Rank 2 13 6 7 5 4 1 3 10 - 1 - - - 13 10 3 - 6 1 2 5 8 2 10 * 7 6
3% 3% 4% 5% 3% 1% 4% 4% - 3% - - - 3% 17% 1% - 5% 1% 4% 4% 3% 2% 4% 1% 4% 3%
Rank 3 4 3 2 1 1 * 3 3 - 2 - - - 4 2 3 - 3 1 - 1 4 1 3 1 2 3
1% 1% 1% * 1% * 3% 1% - 4% - - - 1% 2% 1% - 2% 1% - 1% 1% * 1% 1% 1% 1%
None of these 78 45 32 19 14 26 19 53 15 6 1 - - 78 3 66 8 26 16 7 23 55 23 46 9 33 42
19% 20% 18% 16% 13% 25% 24% 19% 28% 16% 13% - - 19% 6% 25% 11% 22% 11% 14% 15% 21% 20% 20% 13% 18% 20%
No Answer 294 161 133 85 84 74 52 207 35 25 7 - - 294 32 193 69 73 124 39 111 184 80 158 56 134 152
72% 72% 72% 72% 79% 71% 64% 73% 68% 62% 87% - - 72% 52% 72% 89% 61% 87% 77% 75% 70% 71% 69% 84% 74% 71%
Sigma 408 224 185 118 106 104 80 284 51 40 8 - - 408 61 269 78 119 142 51 147 261 113 229 66 182 215
100% 100% 100% 100% 100% 100% 100% 100% 100% 100% 100% - - 100% 100% 100% 100% 100% 100% 100% 100% 100% 100% 100% 100% 100% 100%

Page 151
Fielding Period: November 27 - 28, 2018
HCAPS (Filtered on Registered Voters)
Weighted To The U.S. General Adult Population
30 Nov 2018
Table 132
LABEL1103I_16 Which of the following labels do you most identify with?
Please rank your top three labels. Next to the first-ranked labels, enter ''1'', next to the second-ranked label, enter ''2''; next to the third-ranked label, enter ''3.''
You may select up to three options.
Moderate Democrat
Base: GOP
Presidential
Election Candidate
Gender Age Ethnicity Political Party Political Ideology Voted For Education Locale Income
_____________ ______________________ _______________________ ____________________ ____________________ _____________________ _____________ ________________ _________
Colle- Some
Cons- ge Gr- Colle- $75K Less
Hisp- Black Repub- Democ- Indep- Libe- Mode- erva- 3rd ad And ge Or Urb- Subu- Or Than
Total Male Female 18-34 35-49 50-64 65+ White anic /AA Other lican rat endent ral rate tive Clinton Trump Party Higher Less an rban Rural More $75K
______ _____ _______ _____ _____ _____ ____ _____ _____ _____ _____ ______ ______ ______ ______ ______ ______ ________ ______ _____ ______ ______ ____ _____ _____ ____ ____
Unweighted Base 382 205 177 121 95 92 74 295 24 36 8 - - 382 77 223 82 106 124 48 149 233 92 211 79 133 243
Weighted Base 408 224 185 118 106 104 80 284 51 40 8 - - 408 61 269 78 119 142 51 147 261 113 229 66 182 215
Rank 1 31 23 8 13 6 6 6 17 6 3 - - - 31 10 21 * 21 2 6 20 11 9 21 1 21 10
8% 10% 4% 11% 5% 6% 8% 6% 11% 8% - - - 8% 16% 8% 1% 17% 2% 11% 13% 4% 8% 9% 2% 12% 5%
Rank 2 23 8 15 4 12 3 4 8 8 5 1 - - 23 3 20 - 14 6 2 3 20 8 10 5 4 19
6% 3% 8% 3% 11% 3% 5% 3% 16% 13% 13% - - 6% 5% 7% - 12% 4% 3% 2% 8% 7% 4% 8% 2% 9%
Rank 3 18 14 4 6 9 * 3 12 4 1 - - - 18 3 13 2 11 4 1 6 12 10 6 3 5 13
5% 6% 2% 5% 8% * 4% 4% 9% 3% - - - 5% 5% 5% 3% 9% 3% 1% 4% 5% 8% 3% 5% 3% 6%
None of these 78 45 32 19 14 26 19 53 15 6 1 - - 78 3 66 8 26 16 7 23 55 23 46 9 33 42
19% 20% 18% 16% 13% 25% 24% 19% 28% 16% 13% - - 19% 6% 25% 11% 22% 11% 14% 15% 21% 20% 20% 13% 18% 20%
No Answer 258 133 125 75 66 69 48 194 18 24 6 - - 258 42 150 66 48 113 36 96 162 64 146 48 119 131
63% 60% 68% 64% 62% 66% 60% 68% 35% 60% 74% - - 63% 69% 56% 85% 40% 80% 71% 65% 62% 57% 64% 72% 66% 61%
Sigma 408 224 185 118 106 104 80 284 51 40 8 - - 408 61 269 78 119 142 51 147 261 113 229 66 182 215
100% 100% 100% 100% 100% 100% 100% 100% 100% 100% 100% - - 100% 100% 100% 100% 100% 100% 100% 100% 100% 100% 100% 100% 100% 100%

Page 152
Fielding Period: November 27 - 28, 2018
HCAPS (Filtered on Registered Voters)
Weighted To The U.S. General Adult Population
30 Nov 2018
Table 133
LABEL1103I_17 Which of the following labels do you most identify with?
Please rank your top three labels. Next to the first-ranked labels, enter ''1'', next to the second-ranked label, enter ''2''; next to the third-ranked label, enter ''3.''
You may select up to three options.
Conservative Democrat
Base: GOP
Presidential
Election Candidate
Gender Age Ethnicity Political Party Political Ideology Voted For Education Locale Income
_____________ ______________________ _______________________ ____________________ ____________________ _____________________ _____________ ________________ _________
Colle- Some
Cons- ge Gr- Colle- $75K Less
Hisp- Black Repub- Democ- Indep- Libe- Mode- erva- 3rd ad And ge Or Urb- Subu- Or Than
Total Male Female 18-34 35-49 50-64 65+ White anic /AA Other lican rat endent ral rate tive Clinton Trump Party Higher Less an rban Rural More $75K
______ _____ _______ _____ _____ _____ ____ _____ _____ _____ _____ ______ ______ ______ ______ ______ ______ ________ ______ _____ ______ ______ ____ _____ _____ ____ ____
Unweighted Base 382 205 177 121 95 92 74 295 24 36 8 - - 382 77 223 82 106 124 48 149 233 92 211 79 133 243
Weighted Base 408 224 185 118 106 104 80 284 51 40 8 - - 408 61 269 78 119 142 51 147 261 113 229 66 182 215
Rank 1 11 7 4 5 1 1 3 8 2 1 - - - 11 - 10 2 5 * 1 4 8 1 8 2 4 7
3% 3% 2% 4% 1% 1% 4% 3% 4% 2% - - - 3% - 4% 2% 5% * 2% 2% 3% 1% 4% 3% 2% 3%
Rank 2 11 6 5 2 6 3 1 6 2 1 - - - 11 * 8 3 7 - - 6 6 3 8 1 4 7
3% 3% 3% 1% 5% 3% 1% 2% 3% 3% - - - 3% 1% 3% 3% 6% - - 4% 2% 3% 3% 1% 2% 3%
Rank 3 18 11 7 8 5 2 4 10 3 3 - - - 18 7 10 1 11 3 * 10 8 5 10 3 12 6
4% 5% 4% 6% 5% 2% 4% 4% 6% 6% - - - 4% 11% 4% 1% 9% 2% 1% 7% 3% 4% 4% 5% 6% 3%
None of these 78 45 32 19 14 26 19 53 15 6 1 - - 78 3 66 8 26 16 7 23 55 23 46 9 33 42
19% 20% 18% 16% 13% 25% 24% 19% 28% 16% 13% - - 19% 6% 25% 11% 22% 11% 14% 15% 21% 20% 20% 13% 18% 20%
No Answer 290 154 136 84 81 71 54 207 30 29 7 - - 290 50 175 64 69 123 43 105 185 81 157 52 130 152
71% 69% 74% 71% 76% 69% 67% 73% 58% 73% 87% - - 71% 82% 65% 83% 58% 87% 84% 72% 71% 71% 69% 78% 71% 71%
Sigma 408 224 185 118 106 104 80 284 51 40 8 - - 408 61 269 78 119 142 51 147 261 113 229 66 182 215
100% 100% 100% 100% 100% 100% 100% 100% 100% 100% 100% - - 100% 100% 100% 100% 100% 100% 100% 100% 100% 100% 100% 100% 100% 100%

Page 153
Fielding Period: November 27 - 28, 2018
HCAPS (Filtered on Registered Voters)
Weighted To The U.S. General Adult Population
30 Nov 2018
Table 134
LABEL1103I_18 Which of the following labels do you most identify with?
Please rank your top three labels. Next to the first-ranked labels, enter ''1'', next to the second-ranked label, enter ''2''; next to the third-ranked label, enter ''3.''
You may select up to three options.
Clinton Democrat
Base: GOP
Presidential
Election Candidate
Gender Age Ethnicity Political Party Political Ideology Voted For Education Locale Income
_____________ ______________________ _______________________ ____________________ ____________________ _____________________ _____________ ________________ _________
Colle- Some
Cons- ge Gr- Colle- $75K Less
Hisp- Black Repub- Democ- Indep- Libe- Mode- erva- 3rd ad And ge Or Urb- Subu- Or Than
Total Male Female 18-34 35-49 50-64 65+ White anic /AA Other lican rat endent ral rate tive Clinton Trump Party Higher Less an rban Rural More $75K
______ _____ _______ _____ _____ _____ ____ _____ _____ _____ _____ ______ ______ ______ ______ ______ ______ ________ ______ _____ ______ ______ ____ _____ _____ ____ ____
Unweighted Base 382 205 177 121 95 92 74 295 24 36 8 - - 382 77 223 82 106 124 48 149 233 92 211 79 133 243
Weighted Base 408 224 185 118 106 104 80 284 51 40 8 - - 408 61 269 78 119 142 51 147 261 113 229 66 182 215
Rank 1 8 6 3 - 4 5 - 4 2 1 - - - 8 * 7 1 5 - - 2 6 5 1 3 2 4
2% 3% 2% - 3% 5% - 1% 5% 3% - - - 2% 1% 3% 1% 4% - - 2% 2% 4% * 4% 1% 2%
Rank 2 10 4 6 4 6 * 1 6 - 4 - - - 10 2 8 * 6 1 1 2 9 6 3 2 7 3
3% 2% 3% 3% 6% * 1% 2% - 10% - - - 3% 3% 3% 1% 5% 1% 2% 1% 3% 5% 1% 3% 4% 1%
Rank 3 10 5 6 6 1 2 1 7 3 - - - - 10 3 6 1 5 1 1 3 7 1 8 1 2 8
3% 2% 3% 5% 1% 2% 2% 2% 6% - - - - 3% 5% 2% 1% 4% 1% 2% 2% 3% 1% 4% 1% 1% 4%
None of these 78 45 32 19 14 26 19 53 15 6 1 - - 78 3 66 8 26 16 7 23 55 23 46 9 33 42
19% 20% 18% 16% 13% 25% 24% 19% 28% 16% 13% - - 19% 6% 25% 11% 22% 11% 14% 15% 21% 20% 20% 13% 18% 20%
No Answer 301 163 138 89 81 71 59 215 31 28 7 - - 301 52 182 67 77 124 42 117 184 78 171 52 138 158
74% 73% 75% 75% 77% 69% 74% 76% 61% 71% 87% - - 74% 86% 67% 86% 65% 88% 82% 80% 70% 69% 75% 78% 76% 73%
Sigma 408 224 185 118 106 104 80 284 51 40 8 - - 408 61 269 78 119 142 51 147 261 113 229 66 182 215
100% 100% 100% 100% 100% 100% 100% 100% 100% 100% 100% - - 100% 100% 100% 100% 100% 100% 100% 100% 100% 100% 100% 100% 100% 100%

Page 154
Fielding Period: November 27 - 28, 2018
HCAPS (Filtered on Registered Voters)
Weighted To The U.S. General Adult Population
30 Nov 2018
Table 135
LABEL1103I_19 Which of the following labels do you most identify with?
Please rank your top three labels. Next to the first-ranked labels, enter ''1'', next to the second-ranked label, enter ''2''; next to the third-ranked label, enter ''3.''
You may select up to three options.
Obama Democrat
Base: GOP
Presidential
Election Candidate
Gender Age Ethnicity Political Party Political Ideology Voted For Education Locale Income
_____________ ______________________ _______________________ ____________________ ____________________ _____________________ _____________ ________________ _________
Colle- Some
Cons- ge Gr- Colle- $75K Less
Hisp- Black Repub- Democ- Indep- Libe- Mode- erva- 3rd ad And ge Or Urb- Subu- Or Than
Total Male Female 18-34 35-49 50-64 65+ White anic /AA Other lican rat endent ral rate tive Clinton Trump Party Higher Less an rban Rural More $75K
______ _____ _______ _____ _____ _____ ____ _____ _____ _____ _____ ______ ______ ______ ______ ______ ______ ________ ______ _____ ______ ______ ____ _____ _____ ____ ____
Unweighted Base 382 205 177 121 95 92 74 295 24 36 8 - - 382 77 223 82 106 124 48 149 233 92 211 79 133 243
Weighted Base 408 224 185 118 106 104 80 284 51 40 8 - - 408 61 269 78 119 142 51 147 261 113 229 66 182 215
Rank 1 20 9 11 6 9 4 1 9 - 7 1 - - 20 2 18 - 12 2 4 5 15 8 10 2 12 8
5% 4% 6% 5% 9% 4% 1% 3% - 17% 13% - - 5% 2% 7% - 10% 2% 8% 3% 6% 7% 4% 2% 6% 4%
Rank 2 29 12 17 20 5 2 2 16 7 5 - - - 29 11 17 1 17 * - 4 24 9 15 4 13 15
7% 5% 9% 17% 4% 2% 3% 6% 13% 12% - - - 7% 18% 6% 1% 14% * - 3% 9% 8% 7% 6% 7% 7%
Rank 3 15 5 10 5 2 2 6 9 2 3 - - - 15 7 9 - 8 * 2 8 7 7 7 1 5 10
4% 2% 6% 4% 2% 2% 7% 3% 4% 8% - - - 4% 11% 3% - 7% * 4% 6% 3% 6% 3% 2% 3% 5%
None of these 78 45 32 19 14 26 19 53 15 6 1 - - 78 3 66 8 26 16 7 23 55 23 46 9 33 42
19% 20% 18% 16% 13% 25% 24% 19% 28% 16% 13% - - 19% 6% 25% 11% 22% 11% 14% 15% 21% 20% 20% 13% 18% 20%
No Answer 266 152 114 68 76 70 52 196 28 19 6 - - 266 39 159 68 57 123 38 107 159 66 150 50 120 138
65% 68% 62% 57% 72% 67% 65% 69% 54% 47% 74% - - 65% 63% 59% 88% 47% 87% 74% 73% 61% 58% 66% 76% 66% 65%
Sigma 408 224 185 118 106 104 80 284 51 40 8 - - 408 61 269 78 119 142 51 147 261 113 229 66 182 215
100% 100% 100% 100% 100% 100% 100% 100% 100% 100% 100% - - 100% 100% 100% 100% 100% 100% 100% 100% 100% 100% 100% 100% 100% 100%

Page 155
Fielding Period: November 27 - 28, 2018
HCAPS (Filtered on Registered Voters)
Weighted To The U.S. General Adult Population
30 Nov 2018
Table 136
LABEL1103I_20 Which of the following labels do you most identify with?
Please rank your top three labels. Next to the first-ranked labels, enter ''1'', next to the second-ranked label, enter ''2''; next to the third-ranked label, enter ''3.''
You may select up to three options.
Nationalist
Base: GOP
Presidential
Election Candidate
Gender Age Ethnicity Political Party Political Ideology Voted For Education Locale Income
_____________ ______________________ _______________________ ____________________ ____________________ _____________________ _____________ ________________ _________
Colle- Some
Cons- ge Gr- Colle- $75K Less
Hisp- Black Repub- Democ- Indep- Libe- Mode- erva- 3rd ad And ge Or Urb- Subu- Or Than
Total Male Female 18-34 35-49 50-64 65+ White anic /AA Other lican rat endent ral rate tive Clinton Trump Party Higher Less an rban Rural More $75K
______ _____ _______ _____ _____ _____ ____ _____ _____ _____ _____ ______ ______ ______ ______ ______ ______ ________ ______ _____ ______ ______ ____ _____ _____ ____ ____
Unweighted Base 382 205 177 121 95 92 74 295 24 36 8 - - 382 77 223 82 106 124 48 149 233 92 211 79 133 243
Weighted Base 408 224 185 118 106 104 80 284 51 40 8 - - 408 61 269 78 119 142 51 147 261 113 229 66 182 215
Rank 1 11 5 5 3 3 1 3 3 2 1 2 - - 11 2 7 1 3 4 1 6 5 6 3 2 3 6
3% 2% 3% 3% 3% 1% 3% 1% 4% 4% 30% - - 3% 3% 3% 2% 3% 3% 3% 4% 2% 6% 1% 3% 2% 3%
Rank 2 13 10 3 1 6 6 1 6 - 6 - - - 13 - 11 2 - 9 1 5 8 - 12 2 11 2
3% 5% 2% 1% 5% 6% 1% 2% - 14% - - - 3% - 4% 3% - 6% 2% 4% 3% - 5% 2% 6% 1%
Rank 3 8 3 5 1 2 6 - 6 2 - - - - 8 1 4 3 - 7 - 1 6 1 6 2 4 4
2% 1% 3% * 1% 6% - 2% 4% - - - - 2% 2% 1% 3% - 5% - 1% 2% * 2% 3% 2% 2%
None of these 78 45 32 19 14 26 19 53 15 6 1 - - 78 3 66 8 26 16 7 23 55 23 46 9 33 42
19% 20% 18% 16% 13% 25% 24% 19% 28% 16% 13% - - 19% 6% 25% 11% 22% 11% 14% 15% 21% 20% 20% 13% 18% 20%
No Answer 298 160 139 94 82 65 58 216 32 27 5 - - 298 54 181 63 90 106 42 112 187 83 163 52 131 161
73% 72% 75% 80% 77% 62% 72% 76% 63% 67% 56% - - 73% 89% 67% 81% 76% 75% 82% 76% 71% 74% 71% 79% 72% 75%
Sigma 408 224 185 118 106 104 80 284 51 40 8 - - 408 61 269 78 119 142 51 147 261 113 229 66 182 215
100% 100% 100% 100% 100% 100% 100% 100% 100% 100% 100% - - 100% 100% 100% 100% 100% 100% 100% 100% 100% 100% 100% 100% 100% 100%

Page 156
Fielding Period: November 27 - 28, 2018
HCAPS (Filtered on Registered Voters)
Weighted To The U.S. General Adult Population
30 Nov 2018
Table 137
LABEL1103I_21 Which of the following labels do you most identify with?
Please rank your top three labels. Next to the first-ranked labels, enter ''1'', next to the second-ranked label, enter ''2''; next to the third-ranked label, enter ''3.''
You may select up to three options.
Populist
Base: GOP
Presidential
Election Candidate
Gender Age Ethnicity Political Party Political Ideology Voted For Education Locale Income
_____________ ______________________ _______________________ ____________________ ____________________ _____________________ _____________ ________________ _________
Colle- Some
Cons- ge Gr- Colle- $75K Less
Hisp- Black Repub- Democ- Indep- Libe- Mode- erva- 3rd ad And ge Or Urb- Subu- Or Than
Total Male Female 18-34 35-49 50-64 65+ White anic /AA Other lican rat endent ral rate tive Clinton Trump Party Higher Less an rban Rural More $75K
______ _____ _______ _____ _____ _____ ____ _____ _____ _____ _____ ______ ______ ______ ______ ______ ______ ________ ______ _____ ______ ______ ____ _____ _____ ____ ____
Unweighted Base 382 205 177 121 95 92 74 295 24 36 8 - - 382 77 223 82 106 124 48 149 233 92 211 79 133 243
Weighted Base 408 224 185 118 106 104 80 284 51 40 8 - - 408 61 269 78 119 142 51 147 261 113 229 66 182 215
Rank 1 11 6 5 4 6 1 - 3 - 6 - - - 11 1 10 - - 9 1 1 10 3 7 1 9 2
3% 3% 3% 3% 5% 1% - 1% - 14% - - - 3% 2% 4% - - 7% 2% 1% 4% 3% 3% 1% 5% 1%
Rank 2 6 5 1 2 2 - 2 5 1 - - - - 6 2 4 - * 4 1 3 3 2 3 1 3 3
1% 2% * 2% 2% - 2% 2% 2% - - - - 1% 4% 1% - * 2% 2% 2% 1% 1% 1% 1% 1% 2%
Rank 3 6 3 3 2 - 4 - 6 - - - - - 6 1 5 * * 4 2 4 2 * 5 1 3 3
2% 1% 2% 2% - 4% - 2% - - - - - 2% 2% 2% * * 2% 4% 3% 1% * 2% 1% 2% 2%
None of these 78 45 32 19 14 26 19 53 15 6 1 - - 78 3 66 8 26 16 7 23 55 23 46 9 33 42
19% 20% 18% 16% 13% 25% 24% 19% 28% 16% 13% - - 19% 6% 25% 11% 22% 11% 14% 15% 21% 20% 20% 13% 18% 20%
No Answer 307 164 143 90 85 73 60 216 36 28 7 - - 307 53 185 69 93 110 40 116 191 85 167 55 135 164
75% 74% 77% 76% 80% 70% 74% 76% 70% 71% 87% - - 75% 87% 69% 89% 78% 77% 79% 79% 73% 75% 73% 83% 74% 77%
Sigma 408 224 185 118 106 104 80 284 51 40 8 - - 408 61 269 78 119 142 51 147 261 113 229 66 182 215
100% 100% 100% 100% 100% 100% 100% 100% 100% 100% 100% - - 100% 100% 100% 100% 100% 100% 100% 100% 100% 100% 100% 100% 100% 100%

Page 157
Fielding Period: November 27 - 28, 2018
HCAPS (Filtered on Registered Voters)
Weighted To The U.S. General Adult Population
30 Nov 2018
Table 138
LABEL1103I_22 Which of the following labels do you most identify with?
Please rank your top three labels. Next to the first-ranked labels, enter ''1'', next to the second-ranked label, enter ''2''; next to the third-ranked label, enter ''3.''
You may select up to three options.
Libertarian
Base: GOP
Presidential
Election Candidate
Gender Age Ethnicity Political Party Political Ideology Voted For Education Locale Income
_____________ ______________________ _______________________ ____________________ ____________________ _____________________ _____________ ________________ _________
Colle- Some
Cons- ge Gr- Colle- $75K Less
Hisp- Black Repub- Democ- Indep- Libe- Mode- erva- 3rd ad And ge Or Urb- Subu- Or Than
Total Male Female 18-34 35-49 50-64 65+ White anic /AA Other lican rat endent ral rate tive Clinton Trump Party Higher Less an rban Rural More $75K
______ _____ _______ _____ _____ _____ ____ _____ _____ _____ _____ ______ ______ ______ ______ ______ ______ ________ ______ _____ ______ ______ ____ _____ _____ ____ ____
Unweighted Base 382 205 177 121 95 92 74 295 24 36 8 - - 382 77 223 82 106 124 48 149 233 92 211 79 133 243
Weighted Base 408 224 185 118 106 104 80 284 51 40 8 - - 408 61 269 78 119 142 51 147 261 113 229 66 182 215
Rank 1 27 12 15 14 8 3 1 22 3 2 - - - 27 7 15 5 2 14 3 7 20 9 10 7 4 23
7% 5% 8% 12% 7% 3% 1% 8% 6% 4% - - - 7% 11% 5% 7% 2% 10% 7% 5% 8% 8% 5% 11% 2% 11%
Rank 2 15 10 5 5 1 4 6 9 - 2 3 - - 15 3 6 6 2 7 5 10 6 7 5 4 4 10
4% 4% 3% 4% 1% 4% 7% 3% - 5% 37% - - 4% 6% 2% 7% 2% 5% 10% 7% 2% 6% 2% 6% 2% 5%
Rank 3 12 6 6 6 2 3 1 10 - 1 - - - 12 3 9 1 4 1 3 7 5 2 9 1 8 4
3% 3% 3% 5% 2% 3% 2% 3% - 4% - - - 3% 5% 3% 1% 3% 1% 5% 5% 2% 2% 4% 1% 5% 2%
None of these 78 45 32 19 14 26 19 53 15 6 1 - - 78 3 66 8 26 16 7 23 55 23 46 9 33 42
19% 20% 18% 16% 13% 25% 24% 19% 28% 16% 13% - - 19% 6% 25% 11% 22% 11% 14% 15% 21% 20% 20% 13% 18% 20%
No Answer 276 150 126 74 82 67 53 190 34 29 4 - - 276 45 174 58 86 103 33 101 175 72 158 46 133 136
68% 67% 68% 63% 77% 65% 66% 67% 66% 72% 50% - - 68% 73% 64% 74% 72% 73% 65% 69% 67% 64% 69% 69% 73% 63%
Sigma 408 224 185 118 106 104 80 284 51 40 8 - - 408 61 269 78 119 142 51 147 261 113 229 66 182 215
100% 100% 100% 100% 100% 100% 100% 100% 100% 100% 100% - - 100% 100% 100% 100% 100% 100% 100% 100% 100% 100% 100% 100% 100% 100%

Page 158
Fielding Period: November 27 - 28, 2018
HCAPS (Filtered on Registered Voters)
Weighted To The U.S. General Adult Population
30 Nov 2018
Table 139
LABEL1103I_23 Which of the following labels do you most identify with?
Please rank your top three labels. Next to the first-ranked labels, enter ''1'', next to the second-ranked label, enter ''2''; next to the third-ranked label, enter ''3.''
You may select up to three options.
Alt-Right
Base: GOP
Presidential
Election Candidate
Gender Age Ethnicity Political Party Political Ideology Voted For Education Locale Income
_____________ ______________________ _______________________ ____________________ ____________________ _____________________ _____________ ________________ _________
Colle- Some
Cons- ge Gr- Colle- $75K Less
Hisp- Black Repub- Democ- Indep- Libe- Mode- erva- 3rd ad And ge Or Urb- Subu- Or Than
Total Male Female 18-34 35-49 50-64 65+ White anic /AA Other lican rat endent ral rate tive Clinton Trump Party Higher Less an rban Rural More $75K
______ _____ _______ _____ _____ _____ ____ _____ _____ _____ _____ ______ ______ ______ ______ ______ ______ ________ ______ _____ ______ ______ ____ _____ _____ ____ ____
Unweighted Base 382 205 177 121 95 92 74 295 24 36 8 - - 382 77 223 82 106 124 48 149 233 92 211 79 133 243
Weighted Base 408 224 185 118 106 104 80 284 51 40 8 - - 408 61 269 78 119 142 51 147 261 113 229 66 182 215
Rank 1 1 - 1 - 1 - - - - - - - - 1 - 1 - - - - - 1 - 1 - 1 -
* - * - 1% - - - - - - - - * - * - - - - - * - * - * -
Rank 2 1 1 1 1 1 - - 1 - - - - - 1 - 1 * - 1 * 1 * 1 * * - 1
* * * 1% 1% - - * - - - - - * - * * - * 1% 1% * 1% * 1% - 1%
Rank 3 7 * 6 1 6 - - 1 5 1 - - - 7 1 6 - 6 * - 1 6 1 - 6 - 7
2% * 3% 1% 6% - - * 10% 2% - - - 2% 2% 2% - 5% * - * 2% 1% - 8% - 3%
None of these 78 45 32 19 14 26 19 53 15 6 1 - - 78 3 66 8 26 16 7 23 55 23 46 9 33 42
19% 20% 18% 16% 13% 25% 24% 19% 28% 16% 13% - - 19% 6% 25% 11% 22% 11% 14% 15% 21% 20% 20% 13% 18% 20%
No Answer 321 177 144 97 85 78 61 229 31 33 7 - - 321 56 196 69 88 125 44 123 199 88 182 51 149 164
79% 79% 78% 82% 80% 75% 76% 81% 62% 82% 87% - - 79% 92% 73% 89% 73% 88% 86% 84% 76% 78% 79% 78% 82% 77%
Sigma 408 224 185 118 106 104 80 284 51 40 8 - - 408 61 269 78 119 142 51 147 261 113 229 66 182 215
100% 100% 100% 100% 100% 100% 100% 100% 100% 100% 100% - - 100% 100% 100% 100% 100% 100% 100% 100% 100% 100% 100% 100% 100% 100%

Page 159
Fielding Period: November 27 - 28, 2018
HCAPS (Filtered on Registered Voters)
Weighted To The U.S. General Adult Population
30 Nov 2018
Table 140
LABEL1103I_24 Which of the following labels do you most identify with?
Please rank your top three labels. Next to the first-ranked labels, enter ''1'', next to the second-ranked label, enter ''2''; next to the third-ranked label, enter ''3.''
You may select up to three options.
Antifa
Base: GOP
Presidential
Election Candidate
Gender Age Ethnicity Political Party Political Ideology Voted For Education Locale Income
_____________ ______________________ _______________________ ____________________ ____________________ _____________________ _____________ ________________ _________
Colle- Some
Cons- ge Gr- Colle- $75K Less
Hisp- Black Repub- Democ- Indep- Libe- Mode- erva- 3rd ad And ge Or Urb- Subu- Or Than
Total Male Female 18-34 35-49 50-64 65+ White anic /AA Other lican rat endent ral rate tive Clinton Trump Party Higher Less an rban Rural More $75K
______ _____ _______ _____ _____ _____ ____ _____ _____ _____ _____ ______ ______ ______ ______ ______ ______ ________ ______ _____ ______ ______ ____ _____ _____ ____ ____
Unweighted Base 382 205 177 121 95 92 74 295 24 36 8 - - 382 77 223 82 106 124 48 149 233 92 211 79 133 243
Weighted Base 408 224 185 118 106 104 80 284 51 40 8 - - 408 61 269 78 119 142 51 147 261 113 229 66 182 215
Rank 1 - - - - - - - - - - - - - - - - - - - - - - - - - - -
- - - - - - - - - - - - - - - - - - - - - - - - - - -
Rank 2 6 * 5 3 3 - - 3 2 - - - - 6 2 4 - * 5 - 3 3 5 * - 5 *
1% * 3% 3% 2% - - 1% 4% - - - - 1% 3% 1% - * 4% - 2% 1% 5% * - 3% *
Rank 3 1 1 * 1 - - - 1 - - - - - 1 1 - * * - * - 1 - 1 * - 1
* * * 1% - - - * - - - - - * 1% - 1% * - 1% - * - * 1% - 1%
None of these 78 45 32 19 14 26 19 53 15 6 1 - - 78 3 66 8 26 16 7 23 55 23 46 9 33 42
19% 20% 18% 16% 13% 25% 24% 19% 28% 16% 13% - - 19% 6% 25% 11% 22% 11% 14% 15% 21% 20% 20% 13% 18% 20%
No Answer 323 177 146 94 90 78 61 226 34 34 7 - - 323 55 200 69 93 121 43 122 202 85 181 57 144 171
79% 79% 79% 80% 85% 75% 76% 80% 67% 84% 87% - - 79% 90% 74% 89% 78% 85% 86% 83% 77% 75% 79% 86% 79% 80%
Sigma 408 224 185 118 106 104 80 284 51 40 8 - - 408 61 269 78 119 142 51 147 261 113 229 66 182 215
100% 100% 100% 100% 100% 100% 100% 100% 100% 100% 100% - - 100% 100% 100% 100% 100% 100% 100% 100% 100% 100% 100% 100% 100% 100%

Page 160
Fielding Period: November 27 - 28, 2018
HCAPS (Filtered on Registered Voters)
Weighted To The U.S. General Adult Population
30 Nov 2018
Table 141
LABEL1103I_98 Which of the following labels do you most identify with?
Please rank your top three labels. Next to the first-ranked labels, enter ''1'', next to the second-ranked label, enter ''2''; next to the third-ranked label, enter ''3.''
You may select up to three options.
Other
Base: GOP
Presidential
Election Candidate
Gender Age Ethnicity Political Party Political Ideology Voted For Education Locale Income
_____________ ______________________ _______________________ ____________________ ____________________ _____________________ _____________ ________________ _________
Colle- Some
Cons- ge Gr- Colle- $75K Less
Hisp- Black Repub- Democ- Indep- Libe- Mode- erva- 3rd ad And ge Or Urb- Subu- Or Than
Total Male Female 18-34 35-49 50-64 65+ White anic /AA Other lican rat endent ral rate tive Clinton Trump Party Higher Less an rban Rural More $75K
______ _____ _______ _____ _____ _____ ____ _____ _____ _____ _____ ______ ______ ______ ______ ______ ______ ________ ______ _____ ______ ______ ____ _____ _____ ____ ____
Unweighted Base 382 205 177 121 95 92 74 295 24 36 8 - - 382 77 223 82 106 124 48 149 233 92 211 79 133 243
Weighted Base 408 224 185 118 106 104 80 284 51 40 8 - - 408 61 269 78 119 142 51 147 261 113 229 66 182 215
Rank 1 8 7 1 - 4 2 1 7 - 1 - - - 8 - 5 3 1 4 2 4 3 * 5 2 2 5
2% 3% 1% - 4% 2% 1% 2% - 2% - - - 2% - 2% 4% 1% 3% 3% 3% 1% * 2% 3% 1% 2%
Rank 2 4 4 - - - 2 2 4 - - - - - 4 - 2 3 - 2 2 - 4 2 2 1 2 1
1% 2% - - - 2% 2% 1% - - - - - 1% - 1% 3% - 2% 4% - 2% 1% 1% 1% 1% *
Rank 3 9 5 4 3 1 4 1 6 4 - - - - 9 2 6 1 2 * 5 7 2 - 5 4 2 5
2% 2% 2% 3% 1% 4% 1% 2% 7% - - - - 2% 3% 2% 1% 2% * 9% 5% 1% - 2% 6% 1% 2%
None of these 78 45 32 19 14 26 19 53 15 6 1 - - 78 3 66 8 26 16 7 23 55 23 46 9 33 42
19% 20% 18% 16% 13% 25% 24% 19% 28% 16% 13% - - 19% 6% 25% 11% 22% 11% 14% 15% 21% 20% 20% 13% 18% 20%
No Answer 309 162 147 96 87 69 58 214 33 33 7 - - 309 56 191 63 90 120 36 113 196 88 170 51 144 162
76% 73% 80% 81% 82% 66% 72% 76% 65% 83% 87% - - 76% 91% 71% 81% 76% 84% 71% 77% 75% 78% 74% 77% 79% 75%
Sigma 408 224 185 118 106 104 80 284 51 40 8 - - 408 61 269 78 119 142 51 147 261 113 229 66 182 215
100% 100% 100% 100% 100% 100% 100% 100% 100% 100% 100% - - 100% 100% 100% 100% 100% 100% 100% 100% 100% 100% 100% 100% 100% 100%

Page 161
Fielding Period: November 27 - 28, 2018
HCAPS (Filtered on Registered Voters)
Weighted To The U.S. General Adult Population
30 Nov 2018
Table 142
F1 Now we will show you some names and groups. Please indicate if you have a favorable or unfavorable view of that person or group - or if you've never heard of them.
Summary Of Ever Heard Of
Base: All Respondents
Presidential
Election Candidate
Gender Age Ethnicity Political Party Political Ideology Voted For Education Locale Income
_____________ ______________________ _______________________ ____________________ ____________________ _____________________ _____________ ________________ _________
Colle- Some
Cons- ge Gr- Colle- $75K Less
Hisp- Black Repub- Democ- Indep- Libe- Mode- erva- 3rd ad And ge Or Urb- Subu- Or Than
Total Male Female 18-34 35-49 50-64 65+ White anic /AA Other lican rat endent ral rate tive Clinton Trump Party Higher Less an rban Rural More $75K
______ _____ _______ _____ _____ _____ ____ _____ _____ _____ _____ ______ ______ ______ ______ ______ ______ ________ ______ _____ ______ ______ ____ _____ _____ ____ ____
Unweighted Base 1407 675 732 416 359 364 268 1049 104 173 25 437 526 382 437 549 421 537 505 113 543 864 388 719 300 548 846
Weighted Base 1407 687 720 383 345 382 297 938 208 169 26 450 521 408 385 593 429 547 532 108 481 926 395 742 270 679 704
Donald Trump 1351 666 685 364 324 365 297 915 187 161 25 435 508 385 375 552 424 531 521 104 474 877 374 717 260 666 664
96% 97% 95% 95% 94% 96% 100% 97% 90% 95% 96% 97% 98% 94% 97% 93% 99% 97% 98% 96% 98% 95% 95% 97% 96% 98% 94%
Barack Obama 1336 662 674 364 324 357 290 903 186 162 25 420 508 387 374 551 411 538 508 102 470 866 376 703 257 660 658
95% 96% 94% 95% 94% 94% 98% 96% 89% 96% 96% 93% 98% 95% 97% 93% 96% 98% 96% 94% 98% 94% 95% 95% 95% 97% 93%
Hillary Clinton 1322 656 666 362 324 350 287 897 186 157 22 426 489 386 365 549 408 525 513 102 468 854 369 696 257 658 647
94% 95% 93% 95% 94% 92% 96% 96% 89% 93% 85% 95% 94% 95% 95% 93% 95% 96% 96% 94% 97% 92% 93% 94% 95% 97% 92%
U.S. Military 1307 655 653 350 316 356 285 892 184 152 21 439 480 369 364 534 409 505 519 100 455 852 377 687 243 649 638
93% 95% 91% 91% 91% 93% 96% 95% 89% 90% 81% 98% 92% 90% 95% 90% 95% 92% 98% 93% 95% 92% 96% 93% 90% 96% 91%
FBI 1234 632 602 337 292 334 272 841 172 145 23 398 461 358 350 503 381 507 474 98 439 795 355 643 237 625 586
88% 92% 84% 88% 84% 87% 91% 90% 83% 86% 88% 88% 89% 88% 91% 85% 89% 93% 89% 91% 91% 86% 90% 87% 88% 92% 83%
Bernie Sanders 1233 636 597 335 296 330 272 838 171 150 24 391 467 357 358 499 376 507 474 98 446 786 342 659 231 620 597
88% 93% 83% 87% 86% 87% 91% 89% 82% 89% 92% 87% 90% 87% 93% 84% 88% 93% 89% 91% 93% 85% 87% 89% 86% 91% 85%
Joe Biden 1199 634 565 310 291 331 267 829 153 147 19 385 461 335 351 478 370 499 464 97 446 753 342 632 225 622 560
85% 92% 78% 81% 84% 87% 90% 88% 74% 87% 74% 86% 89% 82% 91% 81% 86% 91% 87% 90% 93% 81% 86% 85% 83% 92% 80%
Mike Pence 1174 602 572 294 286 319 275 822 148 139 19 387 432 340 348 453 372 470 472 90 440 734 323 627 224 617 542
83% 88% 79% 77% 83% 83% 93% 88% 71% 82% 76% 86% 83% 83% 90% 76% 87% 86% 89% 83% 91% 79% 82% 85% 83% 91% 77%
U.S. Supreme Court 1163 591 572 320 269 324 249 802 156 130 19 394 433 319 330 457 377 457 463 95 426 737 323 615 225 591 555
83% 86% 79% 84% 78% 85% 84% 85% 75% 77% 74% 88% 83% 78% 86% 77% 88% 84% 87% 88% 89% 80% 82% 83% 83% 87% 79%
Nancy Pelosi 1162 615 547 295 278 318 271 784 162 141 23 401 429 318 329 451 382 465 479 92 426 736 336 609 217 597 551
83% 90% 76% 77% 80% 83% 91% 84% 78% 84% 91% 89% 82% 78% 85% 76% 89% 85% 90% 85% 89% 79% 85% 82% 80% 88% 78%
Brett Kavanaugh 1113 590 523 286 268 293 266 774 152 126 15 376 417 309 335 420 358 452 444 87 422 691 318 590 205 589 509
79% 86% 73% 75% 78% 77% 89% 82% 73% 75% 58% 83% 80% 76% 87% 71% 83% 83% 84% 81% 88% 75% 80% 80% 76% 87% 72%
Paul Ryan 1100 596 503 270 262 305 263 770 132 136 16 361 420 308 337 425 338 462 442 84 422 678 319 591 190 583 506
78% 87% 70% 70% 76% 80% 89% 82% 63% 81% 62% 80% 81% 75% 87% 72% 79% 84% 83% 77% 88% 73% 81% 80% 70% 86% 72%
Elizabeth Warren 1002 542 460 233 239 279 251 694 137 112 18 330 381 282 311 366 326 420 394 83 391 611 274 555 174 542 448
71% 79% 64% 61% 69% 73% 84% 74% 66% 67% 71% 73% 73% 69% 81% 62% 76% 77% 74% 76% 81% 66% 69% 75% 64% 80% 64%
Robert Mueller 1001 579 422 257 235 278 231 693 138 111 14 321 387 283 313 378 309 424 389 84 403 598 291 535 174 555 433
71% 84% 59% 67% 68% 73% 78% 74% 66% 66% 53% 71% 74% 69% 81% 64% 72% 77% 73% 78% 84% 65% 74% 72% 65% 82% 61%

Page 162
Fielding Period: November 27 - 28, 2018
HCAPS (Filtered on Registered Voters)
Weighted To The U.S. General Adult Population
30 Nov 2018
Table 142
F1 Now we will show you some names and groups. Please indicate if you have a favorable or unfavorable view of that person or group - or if you've never heard of them.
Summary Of Ever Heard Of
Base: All Respondents
Presidential
Election Candidate
Gender Age Ethnicity Political Party Political Ideology Voted For Education Locale Income
_____________ ______________________ _______________________ ____________________ ____________________ _____________________ _____________ ________________ _________
Colle- Some
Cons- ge Gr- Colle- $75K Less
Hisp- Black Repub- Democ- Indep- Libe- Mode- erva- 3rd ad And ge Or Urb- Subu- Or Than
Total Male Female 18-34 35-49 50-64 65+ White anic /AA Other lican rat endent ral rate tive Clinton Trump Party Higher Less an rban Rural More $75K
______ _____ _______ _____ _____ _____ ____ _____ _____ _____ _____ ______ ______ ______ ______ ______ ______ ________ ______ _____ ______ ______ ____ _____ _____ ____ ____
Mitch McConnell 982 563 419 231 224 277 249 674 141 111 13 327 382 264 306 364 311 417 379 81 390 592 285 516 180 532 437
70% 82% 58% 60% 65% 73% 84% 72% 68% 66% 52% 73% 73% 65% 79% 61% 73% 76% 71% 75% 81% 64% 72% 70% 67% 78% 62%
Chuck Schumer 926 530 396 217 221 261 226 645 119 108 12 317 353 246 288 341 296 384 392 76 377 549 269 501 156 512 404
66% 77% 55% 57% 64% 69% 76% 69% 57% 64% 46% 70% 68% 60% 75% 58% 69% 70% 74% 70% 78% 59% 68% 68% 58% 75% 57%
Stephen Bannon 856 488 369 219 201 240 196 587 126 91 12 284 341 224 300 305 251 385 317 69 356 501 245 469 142 476 374
61% 71% 51% 57% 58% 63% 66% 63% 61% 54% 46% 63% 66% 55% 78% 51% 58% 70% 60% 64% 74% 54% 62% 63% 53% 70% 53%
James Mattis 717 452 265 213 161 191 152 486 99 81 12 263 253 194 220 261 236 286 303 58 283 434 227 377 113 397 312
51% 66% 37% 56% 46% 50% 51% 52% 48% 48% 45% 58% 49% 48% 57% 44% 55% 52% 57% 54% 59% 47% 57% 51% 42% 58% 44%

Page 163
Fielding Period: November 27 - 28, 2018
HCAPS (Filtered on Registered Voters)
Weighted To The U.S. General Adult Population
30 Nov 2018
Table 143
F1 Now we will show you some names and groups. Please indicate if you have a favorable or unfavorable view of that person or group - or if you've never heard of them.
Summary Of Very Favorable/ Favorable
Base: All Respondents
Presidential
Election Candidate
Gender Age Ethnicity Political Party Political Ideology Voted For Education Locale Income
_____________ ______________________ _______________________ ____________________ ____________________ _____________________ _____________ ________________ _________
Colle- Some
Cons- ge Gr- Colle- $75K Less
Hisp- Black Repub- Democ- Indep- Libe- Mode- erva- 3rd ad And ge Or Urb- Subu- Or Than
Total Male Female 18-34 35-49 50-64 65+ White anic /AA Other lican rat endent ral rate tive Clinton Trump Party Higher Less an rban Rural More $75K
______ _____ _______ _____ _____ _____ ____ _____ _____ _____ _____ ______ ______ ______ ______ ______ ______ ________ ______ _____ ______ ______ ____ _____ _____ ____ ____
Unweighted Base 1407 675 732 416 359 364 268 1049 104 173 25 437 526 382 437 549 421 537 505 113 543 864 388 719 300 548 846
Weighted Base 1407 687 720 383 345 382 297 938 208 169 26 450 521 408 385 593 429 547 532 108 481 926 395 742 270 679 704
U.S. Military 1181 590 591 283 284 338 276 829 154 132 17 419 425 323 304 480 397 449 486 87 420 761 337 619 225 592 569
84% 86% 82% 74% 82% 89% 93% 88% 74% 78% 67% 93% 82% 79% 79% 81% 93% 82% 91% 80% 87% 82% 85% 84% 83% 87% 81%
FBI 885 441 444 239 194 240 212 604 123 108 11 257 384 235 290 361 234 419 292 64 340 545 261 458 166 454 413
63% 64% 62% 62% 56% 63% 71% 64% 59% 64% 44% 57% 74% 58% 75% 61% 55% 77% 55% 60% 71% 59% 66% 62% 61% 67% 59%
U.S. Supreme Court 820 412 408 211 183 231 195 591 101 81 13 333 269 210 194 313 313 279 383 61 302 518 222 430 168 423 384
58% 60% 57% 55% 53% 60% 66% 63% 49% 48% 49% 74% 52% 51% 50% 53% 73% 51% 72% 56% 63% 56% 56% 58% 62% 62% 55%
Barack Obama 817 390 427 264 192 192 169 472 145 141 14 104 474 227 345 369 103 514 116 62 309 508 272 424 121 398 415
58% 57% 59% 69% 56% 50% 57% 50% 70% 84% 55% 23% 91% 56% 90% 62% 24% 94% 22% 57% 64% 55% 69% 57% 45% 59% 59%
Joe Biden 760 368 392 204 193 186 178 482 111 122 10 129 418 205 316 328 117 452 165 57 299 462 254 390 116 410 346
54% 54% 54% 53% 56% 49% 60% 51% 53% 72% 39% 29% 80% 50% 82% 55% 27% 83% 31% 53% 62% 50% 64% 53% 43% 60% 49%
Bernie Sanders 724 333 391 225 175 178 146 442 121 111 14 101 399 215 310 320 93 430 140 59 262 462 228 382 115 362 359
51% 49% 54% 59% 51% 47% 49% 47% 58% 66% 54% 23% 77% 53% 81% 54% 22% 79% 26% 54% 54% 50% 58% 51% 43% 53% 51%
Mike Pence 576 295 280 123 153 166 133 452 54 45 5 339 87 147 71 188 318 84 410 33 200 376 142 298 135 286 281
41% 43% 39% 32% 44% 44% 45% 48% 26% 27% 21% 75% 17% 36% 18% 32% 74% 15% 77% 31% 42% 41% 36% 40% 50% 42% 40%
Donald Trump 556 287 270 140 132 157 128 458 46 26 7 358 48 145 58 176 322 22 455 19 167 389 138 280 138 270 270
40% 42% 37% 36% 38% 41% 43% 49% 22% 16% 26% 79% 9% 35% 15% 30% 75% 4% 86% 17% 35% 42% 35% 38% 51% 40% 38%
Hillary Clinton 548 237 312 166 144 119 120 292 113 113 7 63 368 114 261 232 56 413 60 9 190 358 204 264 81 251 295
39% 34% 43% 43% 42% 31% 40% 31% 54% 67% 27% 14% 71% 28% 68% 39% 13% 76% 11% 8% 40% 39% 52% 36% 30% 37% 42%
Robert Mueller 542 324 219 132 119 163 128 353 83 71 7 108 288 144 246 211 85 321 130 41 252 290 186 276 81 317 220
39% 47% 30% 35% 35% 43% 43% 38% 40% 42% 27% 24% 55% 35% 64% 36% 20% 59% 24% 38% 52% 31% 47% 37% 30% 47% 31%
Elizabeth Warren 482 244 238 115 122 117 128 288 80 80 10 78 291 110 248 181 52 318 90 27 206 276 164 246 71 270 210
34% 36% 33% 30% 35% 31% 43% 31% 39% 48% 40% 17% 56% 27% 64% 31% 12% 58% 17% 25% 43% 30% 41% 33% 26% 40% 30%
Brett Kavanaugh 479 270 209 108 120 136 116 396 39 27 3 291 61 124 55 151 273 54 345 38 172 307 119 254 105 239 230
34% 39% 29% 28% 35% 36% 39% 42% 19% 16% 12% 65% 12% 30% 14% 25% 64% 10% 65% 35% 36% 33% 30% 34% 39% 35% 33%
Nancy Pelosi 471 237 235 136 126 102 107 267 87 85 11 71 299 99 247 184 41 326 78 16 187 284 175 231 65 250 221
34% 34% 33% 36% 36% 27% 36% 28% 42% 50% 41% 16% 57% 24% 64% 31% 10% 60% 15% 15% 39% 31% 44% 31% 24% 37% 31%
Paul Ryan 457 249 208 112 108 141 97 354 44 37 2 254 88 113 66 182 209 92 288 32 165 292 141 228 88 221 228
32% 36% 29% 29% 31% 37% 33% 38% 21% 22% 9% 56% 17% 28% 17% 31% 49% 17% 54% 30% 34% 32% 36% 31% 33% 33% 32%

Page 164
Fielding Period: November 27 - 28, 2018
HCAPS (Filtered on Registered Voters)
Weighted To The U.S. General Adult Population
30 Nov 2018
Table 143
F1 Now we will show you some names and groups. Please indicate if you have a favorable or unfavorable view of that person or group - or if you've never heard of them.
Summary Of Very Favorable/ Favorable
Base: All Respondents
Presidential
Election Candidate
Gender Age Ethnicity Political Party Political Ideology Voted For Education Locale Income
_____________ ______________________ _______________________ ____________________ ____________________ _____________________ _____________ ________________ _________
Colle- Some
Cons- ge Gr- Colle- $75K Less
Hisp- Black Repub- Democ- Indep- Libe- Mode- erva- 3rd ad And ge Or Urb- Subu- Or Than
Total Male Female 18-34 35-49 50-64 65+ White anic /AA Other lican rat endent ral rate tive Clinton Trump Party Higher Less an rban Rural More $75K
______ _____ _______ _____ _____ _____ ____ _____ _____ _____ _____ ______ ______ ______ ______ ______ ______ ________ ______ _____ ______ ______ ____ _____ _____ ____ ____
James Mattis 436 273 163 110 101 125 100 323 44 42 6 201 119 115 115 140 182 133 237 30 179 257 134 237 66 257 175
31% 40% 23% 29% 29% 33% 34% 34% 21% 25% 25% 45% 23% 28% 30% 24% 42% 24% 45% 27% 37% 28% 34% 32% 24% 38% 25%
Chuck Schumer 408 214 193 105 104 97 101 248 71 58 6 81 233 92 204 154 50 260 101 24 178 230 159 203 47 234 174
29% 31% 27% 27% 30% 26% 34% 26% 34% 34% 22% 18% 45% 23% 53% 26% 12% 48% 19% 22% 37% 25% 40% 27% 17% 34% 25%
Mitch McConnell 354 198 156 90 79 105 79 259 50 30 - 206 72 74 57 110 186 59 234 25 130 224 110 173 71 191 157
25% 29% 22% 24% 23% 28% 27% 28% 24% 18% - 46% 14% 18% 15% 19% 44% 11% 44% 23% 27% 24% 28% 23% 26% 28% 22%
Stephen Bannon 224 125 99 86 63 47 28 154 43 19 2 116 55 52 57 80 88 55 135 14 67 158 89 100 36 118 106
16% 18% 14% 22% 18% 12% 10% 16% 21% 11% 6% 26% 11% 13% 15% 13% 20% 10% 25% 13% 14% 17% 22% 13% 13% 17% 15%

Page 165
Fielding Period: November 27 - 28, 2018
HCAPS (Filtered on Registered Voters)
Weighted To The U.S. General Adult Population
30 Nov 2018
Table 144
F1 Now we will show you some names and groups. Please indicate if you have a favorable or unfavorable view of that person or group - or if you've never heard of them.
Summary Of Very Unfavorable/ Unfavorable
Base: All Respondents
Presidential
Election Candidate
Gender Age Ethnicity Political Party Political Ideology Voted For Education Locale Income
_____________ ______________________ _______________________ ____________________ ____________________ _____________________ _____________ ________________ _________
Colle- Some
Cons- ge Gr- Colle- $75K Less
Hisp- Black Repub- Democ- Indep- Libe- Mode- erva- 3rd ad And ge Or Urb- Subu- Or Than
Total Male Female 18-34 35-49 50-64 65+ White anic /AA Other lican rat endent ral rate tive Clinton Trump Party Higher Less an rban Rural More $75K
______ _____ _______ _____ _____ _____ ____ _____ _____ _____ _____ ______ ______ ______ ______ ______ ______ ________ ______ _____ ______ ______ ____ _____ _____ ____ ____
Unweighted Base 1407 675 732 416 359 364 268 1049 104 173 25 437 526 382 437 549 421 537 505 113 543 864 388 719 300 548 846
Weighted Base 1407 687 720 383 345 382 297 938 208 169 26 450 521 408 385 593 429 547 532 108 481 926 395 742 270 679 704
Donald Trump 795 379 416 225 192 208 169 457 141 134 18 78 460 241 317 376 102 509 66 85 306 489 237 437 122 396 393
56% 55% 58% 59% 56% 55% 57% 49% 68% 80% 70% 17% 88% 59% 82% 63% 24% 93% 12% 79% 64% 53% 60% 59% 45% 58% 56%
Hillary Clinton 774 419 354 196 180 231 166 605 73 44 15 363 121 273 105 317 352 111 453 93 278 495 166 432 175 407 352
55% 61% 49% 51% 52% 61% 56% 65% 35% 26% 58% 81% 23% 67% 27% 53% 82% 20% 85% 86% 58% 54% 42% 58% 65% 60% 50%
Nancy Pelosi 691 378 312 159 152 216 164 517 74 56 13 329 130 218 83 267 341 138 401 76 239 452 161 378 152 347 330
49% 55% 43% 42% 44% 57% 55% 55% 36% 33% 49% 73% 25% 54% 21% 45% 80% 25% 75% 70% 50% 49% 41% 51% 56% 51% 47%
Paul Ryan 642 347 295 158 154 164 166 416 87 99 14 108 331 194 271 243 129 370 154 51 256 386 178 363 102 361 277
46% 51% 41% 41% 45% 43% 56% 44% 42% 58% 53% 24% 64% 48% 70% 41% 30% 68% 29% 47% 53% 42% 45% 49% 38% 53% 39%
Brett Kavanaugh 634 320 314 178 148 157 150 379 114 99 12 85 356 185 280 269 85 398 99 49 250 384 199 335 100 350 279
45% 47% 44% 46% 43% 41% 50% 40% 55% 58% 47% 19% 68% 45% 73% 45% 20% 73% 19% 46% 52% 41% 50% 45% 37% 52% 40%
Stephen Bannon 632 362 270 133 139 193 168 433 83 71 10 168 286 172 243 226 163 330 181 55 289 343 156 369 106 359 268
45% 53% 37% 35% 40% 50% 56% 46% 40% 42% 40% 37% 55% 42% 63% 38% 38% 60% 34% 51% 60% 37% 40% 50% 39% 53% 38%
Mitch McConnell 628 365 263 141 145 172 170 416 91 81 13 121 310 190 248 255 125 358 146 56 260 368 175 344 109 341 279
45% 53% 37% 37% 42% 45% 57% 44% 44% 48% 52% 27% 60% 47% 64% 43% 29% 65% 27% 52% 54% 40% 44% 46% 41% 50% 40%
Mike Pence 598 306 292 171 133 152 142 369 94 94 14 47 345 193 278 266 55 386 62 57 240 358 181 329 89 331 261
43% 45% 41% 45% 39% 40% 48% 39% 45% 56% 54% 10% 66% 47% 72% 45% 13% 71% 12% 53% 50% 39% 46% 44% 33% 49% 37%
Elizabeth Warren 521 298 223 118 117 162 123 407 57 32 8 251 90 172 62 184 274 102 304 56 185 335 110 308 103 272 238
37% 43% 31% 31% 34% 42% 41% 43% 27% 19% 31% 56% 17% 42% 16% 31% 64% 19% 57% 52% 38% 36% 28% 42% 38% 40% 34%
Barack Obama 519 272 246 100 132 165 122 431 41 21 11 315 33 160 28 182 308 24 392 40 160 359 104 280 136 263 243
37% 40% 34% 26% 38% 43% 41% 46% 20% 12% 42% 70% 6% 39% 7% 31% 72% 4% 74% 37% 33% 39% 26% 38% 50% 39% 34%
Chuck Schumer 518 316 202 112 116 164 125 398 48 50 6 237 120 153 84 188 246 124 291 52 199 319 110 299 109 278 230
37% 46% 28% 29% 34% 43% 42% 42% 23% 29% 24% 53% 23% 38% 22% 32% 57% 23% 55% 48% 41% 34% 28% 40% 40% 41% 33%
Bernie Sanders 508 302 206 109 120 152 126 396 49 38 10 289 68 142 48 178 282 77 334 40 184 324 115 277 116 258 239
36% 44% 29% 29% 35% 40% 43% 42% 24% 23% 38% 64% 13% 35% 12% 30% 66% 14% 63% 37% 38% 35% 29% 37% 43% 38% 34%
Robert Mueller 458 255 203 125 116 115 103 340 56 40 7 212 99 139 67 167 224 103 259 44 150 308 105 260 93 238 213
33% 37% 28% 33% 34% 30% 35% 36% 27% 24% 26% 47% 19% 34% 17% 28% 52% 19% 49% 40% 31% 33% 27% 35% 35% 35% 30%
Joe Biden 439 266 173 106 98 146 89 347 42 25 9 256 43 130 36 149 254 47 299 40 147 292 88 242 109 212 214
31% 39% 24% 28% 28% 38% 30% 37% 20% 15% 36% 57% 8% 32% 9% 25% 59% 9% 56% 37% 31% 32% 22% 33% 40% 31% 30%

Page 166
Fielding Period: November 27 - 28, 2018
HCAPS (Filtered on Registered Voters)
Weighted To The U.S. General Adult Population
30 Nov 2018
Table 144
F1 Now we will show you some names and groups. Please indicate if you have a favorable or unfavorable view of that person or group - or if you've never heard of them.
Summary Of Very Unfavorable/ Unfavorable
Base: All Respondents
Presidential
Election Candidate
Gender Age Ethnicity Political Party Political Ideology Voted For Education Locale Income
_____________ ______________________ _______________________ ____________________ ____________________ _____________________ _____________ ________________ _________
Colle- Some
Cons- ge Gr- Colle- $75K Less
Hisp- Black Repub- Democ- Indep- Libe- Mode- erva- 3rd ad And ge Or Urb- Subu- Or Than
Total Male Female 18-34 35-49 50-64 65+ White anic /AA Other lican rat endent ral rate tive Clinton Trump Party Higher Less an rban Rural More $75K
______ _____ _______ _____ _____ _____ ____ _____ _____ _____ _____ ______ ______ ______ ______ ______ ______ ________ ______ _____ ______ ______ ____ _____ _____ ____ ____
FBI 349 191 158 98 98 94 60 237 49 37 11 141 77 123 60 142 147 88 182 34 99 250 93 185 71 171 174
25% 28% 22% 26% 28% 25% 20% 25% 24% 22% 44% 31% 15% 30% 16% 24% 34% 16% 34% 31% 21% 27% 24% 25% 26% 25% 25%
U.S. Supreme Court 342 179 163 109 86 93 54 211 54 49 7 62 164 109 135 143 64 178 81 34 124 218 101 185 57 168 171
24% 26% 23% 28% 25% 24% 18% 22% 26% 29% 25% 14% 31% 27% 35% 24% 15% 33% 15% 32% 26% 24% 26% 25% 21% 25% 24%
James Mattis 281 179 102 103 59 66 52 163 55 38 5 62 134 79 105 121 55 153 65 29 104 177 93 140 47 140 138
20% 26% 14% 27% 17% 17% 18% 17% 27% 23% 20% 14% 26% 19% 27% 20% 13% 28% 12% 26% 22% 19% 24% 19% 17% 21% 20%
U.S. Military 127 65 62 67 32 18 9 63 30 20 4 20 55 46 60 55 12 56 33 13 35 91 41 68 18 57 69
9% 9% 9% 18% 9% 5% 3% 7% 14% 12% 14% 4% 11% 11% 16% 9% 3% 10% 6% 12% 7% 10% 10% 9% 7% 8% 10%
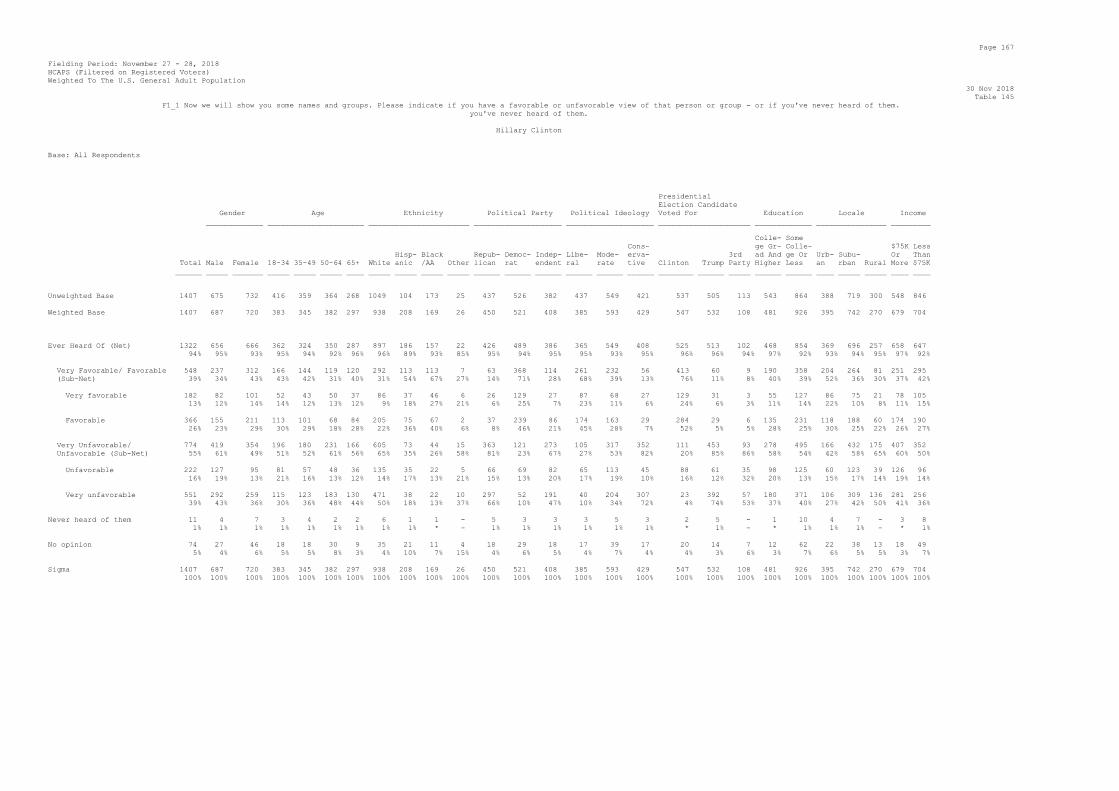
Page 167
Fielding Period: November 27 - 28, 2018
HCAPS (Filtered on Registered Voters)
Weighted To The U.S. General Adult Population
30 Nov 2018
Table 145
F1_1 Now we will show you some names and groups. Please indicate if you have a favorable or unfavorable view of that person or group - or if you've never heard of them.
you've never heard of them.
Hillary Clinton
Base: All Respondents
Presidential
Election Candidate
Gender Age Ethnicity Political Party Political Ideology Voted For Education Locale Income
_____________ ______________________ _______________________ ____________________ ____________________ _____________________ _____________ ________________ _________
Colle- Some
Cons- ge Gr- Colle- $75K Less
Hisp- Black Repub- Democ- Indep- Libe- Mode- erva- 3rd ad And ge Or Urb- Subu- Or Than
Total Male Female 18-34 35-49 50-64 65+ White anic /AA Other lican rat endent ral rate tive Clinton Trump Party Higher Less an rban Rural More $75K
______ _____ _______ _____ _____ _____ ____ _____ _____ _____ _____ ______ ______ ______ ______ ______ ______ ________ ______ _____ ______ ______ ____ _____ _____ ____ ____
Unweighted Base 1407 675 732 416 359 364 268 1049 104 173 25 437 526 382 437 549 421 537 505 113 543 864 388 719 300 548 846
Weighted Base 1407 687 720 383 345 382 297 938 208 169 26 450 521 408 385 593 429 547 532 108 481 926 395 742 270 679 704
Ever Heard Of (Net) 1322 656 666 362 324 350 287 897 186 157 22 426 489 386 365 549 408 525 513 102 468 854 369 696 257 658 647
94% 95% 93% 95% 94% 92% 96% 96% 89% 93% 85% 95% 94% 95% 95% 93% 95% 96% 96% 94% 97% 92% 93% 94% 95% 97% 92%
Very Favorable/ Favorable 548 237 312 166 144 119 120 292 113 113 7 63 368 114 261 232 56 413 60 9 190 358 204 264 81 251 295
(Sub-Net) 39% 34% 43% 43% 42% 31% 40% 31% 54% 67% 27% 14% 71% 28% 68% 39% 13% 76% 11% 8% 40% 39% 52% 36% 30% 37% 42%
Very favorable 182 82 101 52 43 50 37 86 37 46 6 26 129 27 87 68 27 129 31 3 55 127 86 75 21 78 105
13% 12% 14% 14% 12% 13% 12% 9% 18% 27% 21% 6% 25% 7% 23% 11% 6% 24% 6% 3% 11% 14% 22% 10% 8% 11% 15%
Favorable 366 155 211 113 101 68 84 205 75 67 2 37 239 86 174 163 29 284 29 6 135 231 118 188 60 174 190
26% 23% 29% 30% 29% 18% 28% 22% 36% 40% 6% 8% 46% 21% 45% 28% 7% 52% 5% 5% 28% 25% 30% 25% 22% 26% 27%
Very Unfavorable/ 774 419 354 196 180 231 166 605 73 44 15 363 121 273 105 317 352 111 453 93 278 495 166 432 175 407 352
Unfavorable (Sub-Net) 55% 61% 49% 51% 52% 61% 56% 65% 35% 26% 58% 81% 23% 67% 27% 53% 82% 20% 85% 86% 58% 54% 42% 58% 65% 60% 50%
Unfavorable 222 127 95 81 57 48 36 135 35 22 5 66 69 82 65 113 45 88 61 35 98 125 60 123 39 126 96
16% 19% 13% 21% 16% 13% 12% 14% 17% 13% 21% 15% 13% 20% 17% 19% 10% 16% 12% 32% 20% 13% 15% 17% 14% 19% 14%
Very unfavorable 551 292 259 115 123 183 130 471 38 22 10 297 52 191 40 204 307 23 392 57 180 371 106 309 136 281 256
39% 43% 36% 30% 36% 48% 44% 50% 18% 13% 37% 66% 10% 47% 10% 34% 72% 4% 74% 53% 37% 40% 27% 42% 50% 41% 36%
Never heard of them 11 4 7 3 4 2 2 6 1 1 - 5 3 3 3 5 3 2 5 - 1 10 4 7 - 3 8
1% 1% 1% 1% 1% 1% 1% 1% 1% * - 1% 1% 1% 1% 1% 1% * 1% - * 1% 1% 1% - * 1%
No opinion 74 27 46 18 18 30 9 35 21 11 4 18 29 18 17 39 17 20 14 7 12 62 22 38 13 18 49
5% 4% 6% 5% 5% 8% 3% 4% 10% 7% 15% 4% 6% 5% 4% 7% 4% 4% 3% 6% 3% 7% 6% 5% 5% 3% 7%
Sigma 1407 687 720 383 345 382 297 938 208 169 26 450 521 408 385 593 429 547 532 108 481 926 395 742 270 679 704
100% 100% 100% 100% 100% 100% 100% 100% 100% 100% 100% 100% 100% 100% 100% 100% 100% 100% 100% 100% 100% 100% 100% 100% 100% 100% 100%

Page 168
Fielding Period: November 27 - 28, 2018
HCAPS (Filtered on Registered Voters)
Weighted To The U.S. General Adult Population
30 Nov 2018
Table 146
F1_2 Now we will show you some names and groups. Please indicate if you have a favorable or unfavorable view of that person or group - or if you've never heard of them.
you've never heard of them.
Donald Trump
Base: All Respondents
Presidential
Election Candidate
Gender Age Ethnicity Political Party Political Ideology Voted For Education Locale Income
_____________ ______________________ _______________________ ____________________ ____________________ _____________________ _____________ ________________ _________
Colle- Some
Cons- ge Gr- Colle- $75K Less
Hisp- Black Repub- Democ- Indep- Libe- Mode- erva- 3rd ad And ge Or Urb- Subu- Or Than
Total Male Female 18-34 35-49 50-64 65+ White anic /AA Other lican rat endent ral rate tive Clinton Trump Party Higher Less an rban Rural More $75K
______ _____ _______ _____ _____ _____ ____ _____ _____ _____ _____ ______ ______ ______ ______ ______ ______ ________ ______ _____ ______ ______ ____ _____ _____ ____ ____
Unweighted Base 1407 675 732 416 359 364 268 1049 104 173 25 437 526 382 437 549 421 537 505 113 543 864 388 719 300 548 846
Weighted Base 1407 687 720 383 345 382 297 938 208 169 26 450 521 408 385 593 429 547 532 108 481 926 395 742 270 679 704
Ever Heard Of (Net) 1351 666 685 364 324 365 297 915 187 161 25 435 508 385 375 552 424 531 521 104 474 877 374 717 260 666 664
96% 97% 95% 95% 94% 96% 100% 97% 90% 95% 96% 97% 98% 94% 97% 93% 99% 97% 98% 96% 98% 95% 95% 97% 96% 98% 94%
Very Favorable/ Favorable 556 287 270 140 132 157 128 458 46 26 7 358 48 145 58 176 322 22 455 19 167 389 138 280 138 270 270
(Sub-Net) 40% 42% 37% 36% 38% 41% 43% 49% 22% 16% 26% 79% 9% 35% 15% 30% 75% 4% 86% 17% 35% 42% 35% 38% 51% 40% 38%
Very favorable 296 157 139 68 65 95 68 260 16 10 4 223 17 55 34 67 196 5 261 6 88 209 69 154 74 143 149
21% 23% 19% 18% 19% 25% 23% 28% 8% 6% 16% 49% 3% 13% 9% 11% 46% 1% 49% 5% 18% 23% 17% 21% 27% 21% 21%
Favorable 260 129 131 71 67 62 59 198 29 16 3 135 32 90 25 109 126 17 194 13 80 180 68 127 65 128 121
18% 19% 18% 19% 19% 16% 20% 21% 14% 10% 10% 30% 6% 22% 6% 18% 29% 3% 36% 12% 17% 19% 17% 17% 24% 19% 17%
Very Unfavorable/ 795 379 416 225 192 208 169 457 141 134 18 78 460 241 317 376 102 509 66 85 306 489 237 437 122 396 393
Unfavorable (Sub-Net) 56% 55% 58% 59% 56% 55% 57% 49% 68% 80% 70% 17% 88% 59% 82% 63% 24% 93% 12% 79% 64% 53% 60% 59% 45% 58% 56%
Unfavorable 178 79 99 60 52 41 25 116 28 21 4 42 62 70 35 98 46 67 42 29 63 115 49 99 30 88 89
13% 12% 14% 16% 15% 11% 8% 12% 13% 13% 15% 9% 12% 17% 9% 17% 11% 12% 8% 26% 13% 12% 13% 13% 11% 13% 13%
Very unfavorable 617 300 317 164 140 167 145 341 114 113 14 36 398 171 282 278 56 442 24 57 243 374 187 338 92 308 304
44% 44% 44% 43% 41% 44% 49% 36% 55% 67% 56% 8% 77% 42% 73% 47% 13% 81% 5% 52% 50% 40% 47% 46% 34% 45% 43%
Never heard of them 12 6 5 5 4 3 - 6 2 3 - 6 4 2 6 5 1 5 3 - 3 9 7 4 1 4 7
1% 1% 1% 1% 1% 1% - 1% 1% 2% - 1% 1% * 2% 1% * 1% * - 1% 1% 2% 1% * 1% 1%
No opinion 44 15 30 13 18 14 - 17 19 5 1 9 8 21 4 36 4 11 8 4 5 40 14 21 10 9 33
3% 2% 4% 3% 5% 4% - 2% 9% 3% 4% 2% 2% 5% 1% 6% 1% 2% 1% 4% 1% 4% 4% 3% 4% 1% 5%
Sigma 1407 687 720 383 345 382 297 938 208 169 26 450 521 408 385 593 429 547 532 108 481 926 395 742 270 679 704
100% 100% 100% 100% 100% 100% 100% 100% 100% 100% 100% 100% 100% 100% 100% 100% 100% 100% 100% 100% 100% 100% 100% 100% 100% 100% 100%

Page 169
Fielding Period: November 27 - 28, 2018
HCAPS (Filtered on Registered Voters)
Weighted To The U.S. General Adult Population
30 Nov 2018
Table 147
F1_4 Now we will show you some names and groups. Please indicate if you have a favorable or unfavorable view of that person or group - or if you've never heard of them.
you've never heard of them.
Mike Pence
Base: All Respondents
Presidential
Election Candidate
Gender Age Ethnicity Political Party Political Ideology Voted For Education Locale Income
_____________ ______________________ _______________________ ____________________ ____________________ _____________________ _____________ ________________ _________
Colle- Some
Cons- ge Gr- Colle- $75K Less
Hisp- Black Repub- Democ- Indep- Libe- Mode- erva- 3rd ad And ge Or Urb- Subu- Or Than
Total Male Female 18-34 35-49 50-64 65+ White anic /AA Other lican rat endent ral rate tive Clinton Trump Party Higher Less an rban Rural More $75K
______ _____ _______ _____ _____ _____ ____ _____ _____ _____ _____ ______ ______ ______ ______ ______ ______ ________ ______ _____ ______ ______ ____ _____ _____ ____ ____
Unweighted Base 1407 675 732 416 359 364 268 1049 104 173 25 437 526 382 437 549 421 537 505 113 543 864 388 719 300 548 846
Weighted Base 1407 687 720 383 345 382 297 938 208 169 26 450 521 408 385 593 429 547 532 108 481 926 395 742 270 679 704
Ever Heard Of (Net) 1174 602 572 294 286 319 275 822 148 139 19 387 432 340 348 453 372 470 472 90 440 734 323 627 224 617 542
83% 88% 79% 77% 83% 83% 93% 88% 71% 82% 76% 86% 83% 83% 90% 76% 87% 86% 89% 83% 91% 79% 82% 85% 83% 91% 77%
Very Favorable/ Favorable 576 295 280 123 153 166 133 452 54 45 5 339 87 147 71 188 318 84 410 33 200 376 142 298 135 286 281
(Sub-Net) 41% 43% 39% 32% 44% 44% 45% 48% 26% 27% 21% 75% 17% 36% 18% 32% 74% 15% 77% 31% 42% 41% 36% 40% 50% 42% 40%
Very favorable 255 132 123 49 60 75 70 219 16 10 1 196 19 39 25 50 179 16 216 6 79 176 47 146 62 136 112
18% 19% 17% 13% 18% 20% 23% 23% 7% 6% 5% 44% 4% 10% 7% 8% 42% 3% 41% 5% 16% 19% 12% 20% 23% 20% 16%
Favorable 321 164 157 74 92 91 64 233 39 35 4 143 68 108 46 137 138 68 194 27 121 200 95 152 74 150 169
23% 24% 22% 19% 27% 24% 21% 25% 19% 21% 16% 32% 13% 26% 12% 23% 32% 12% 36% 25% 25% 22% 24% 21% 27% 22% 24%
Very Unfavorable/ 598 306 292 171 133 152 142 369 94 94 14 47 345 193 278 266 55 386 62 57 240 358 181 329 89 331 261
Unfavorable (Sub-Net) 43% 45% 41% 45% 39% 40% 48% 39% 45% 56% 54% 10% 66% 47% 72% 45% 13% 71% 12% 53% 50% 39% 46% 44% 33% 49% 37%
Unfavorable 223 106 117 81 39 53 50 137 38 38 3 35 107 75 75 113 34 118 40 21 72 150 63 126 34 113 106
16% 15% 16% 21% 11% 14% 17% 15% 18% 23% 10% 8% 20% 18% 20% 19% 8% 22% 8% 20% 15% 16% 16% 17% 13% 17% 15%
Very unfavorable 376 201 175 89 94 100 93 232 56 56 11 12 238 118 202 153 21 268 22 36 168 208 118 203 55 218 155
27% 29% 24% 23% 27% 26% 31% 25% 27% 33% 44% 3% 46% 29% 52% 26% 5% 49% 4% 33% 35% 22% 30% 27% 20% 32% 22%
Never heard of them 45 13 32 26 12 7 - 13 13 11 1 12 22 10 13 23 9 21 6 5 7 38 16 19 10 10 35
3% 2% 4% 7% 4% 2% - 1% 6% 7% 3% 3% 4% 2% 3% 4% 2% 4% 1% 4% 2% 4% 4% 3% 4% 2% 5%
No opinion 188 72 116 62 47 56 22 104 48 19 6 52 67 58 24 116 48 56 54 13 34 154 56 96 37 52 127
13% 10% 16% 16% 14% 15% 7% 11% 23% 11% 21% 12% 13% 14% 6% 20% 11% 10% 10% 12% 7% 17% 14% 13% 14% 8% 18%
Sigma 1407 687 720 383 345 382 297 938 208 169 26 450 521 408 385 593 429 547 532 108 481 926 395 742 270 679 704
100% 100% 100% 100% 100% 100% 100% 100% 100% 100% 100% 100% 100% 100% 100% 100% 100% 100% 100% 100% 100% 100% 100% 100% 100% 100% 100%

Page 170
Fielding Period: November 27 - 28, 2018
HCAPS (Filtered on Registered Voters)
Weighted To The U.S. General Adult Population
30 Nov 2018
Table 148
F1_8 Now we will show you some names and groups. Please indicate if you have a favorable or unfavorable view of that person or group - or if you've never heard of them.
you've never heard of them.
Paul Ryan
Base: All Respondents
Presidential
Election Candidate
Gender Age Ethnicity Political Party Political Ideology Voted For Education Locale Income
_____________ ______________________ _______________________ ____________________ ____________________ _____________________ _____________ ________________ _________
Colle- Some
Cons- ge Gr- Colle- $75K Less
Hisp- Black Repub- Democ- Indep- Libe- Mode- erva- 3rd ad And ge Or Urb- Subu- Or Than
Total Male Female 18-34 35-49 50-64 65+ White anic /AA Other lican rat endent ral rate tive Clinton Trump Party Higher Less an rban Rural More $75K
______ _____ _______ _____ _____ _____ ____ _____ _____ _____ _____ ______ ______ ______ ______ ______ ______ ________ ______ _____ ______ ______ ____ _____ _____ ____ ____
Unweighted Base 1407 675 732 416 359 364 268 1049 104 173 25 437 526 382 437 549 421 537 505 113 543 864 388 719 300 548 846
Weighted Base 1407 687 720 383 345 382 297 938 208 169 26 450 521 408 385 593 429 547 532 108 481 926 395 742 270 679 704
Ever Heard Of (Net) 1100 596 503 270 262 305 263 770 132 136 16 361 420 308 337 425 338 462 442 84 422 678 319 591 190 583 506
78% 87% 70% 70% 76% 80% 89% 82% 63% 81% 62% 80% 81% 75% 87% 72% 79% 84% 83% 77% 88% 73% 81% 80% 70% 86% 72%
Very Favorable/ Favorable 457 249 208 112 108 141 97 354 44 37 2 254 88 113 66 182 209 92 288 32 165 292 141 228 88 221 228
(Sub-Net) 32% 36% 29% 29% 31% 37% 33% 38% 21% 22% 9% 56% 17% 28% 17% 31% 49% 17% 54% 30% 34% 32% 36% 31% 33% 33% 32%
Very favorable 98 56 42 28 22 40 7 76 11 8 1 64 19 15 22 29 48 16 65 5 39 59 34 50 14 53 45
7% 8% 6% 7% 6% 11% 2% 8% 5% 5% 3% 14% 4% 4% 6% 5% 11% 3% 12% 5% 8% 6% 8% 7% 5% 8% 6%
Favorable 359 193 166 84 86 100 90 278 34 30 2 190 69 98 44 153 161 76 223 27 126 233 108 178 73 168 183
26% 28% 23% 22% 25% 26% 30% 30% 16% 17% 6% 42% 13% 24% 11% 26% 38% 14% 42% 25% 26% 25% 27% 24% 27% 25% 26%
Very Unfavorable/ 642 347 295 158 154 164 166 416 87 99 14 108 331 194 271 243 129 370 154 51 256 386 178 363 102 361 277
Unfavorable (Sub-Net) 46% 51% 41% 41% 45% 43% 56% 44% 42% 58% 53% 24% 64% 48% 70% 41% 30% 68% 29% 47% 53% 42% 45% 49% 38% 53% 39%
Unfavorable 297 142 156 79 66 69 84 210 39 37 6 73 121 99 86 124 87 136 98 27 113 185 88 158 52 146 149
21% 21% 22% 21% 19% 18% 28% 22% 19% 22% 22% 16% 23% 24% 22% 21% 20% 25% 18% 25% 23% 20% 22% 21% 19% 21% 21%
Very unfavorable 345 206 139 79 88 96 82 206 48 61 8 35 210 96 185 119 41 234 56 24 144 201 90 205 50 216 128
25% 30% 19% 21% 26% 25% 28% 22% 23% 36% 32% 8% 40% 23% 48% 20% 10% 43% 11% 22% 30% 22% 23% 28% 18% 32% 18%
Never heard of them 68 12 56 37 17 9 5 20 30 10 2 14 25 23 10 46 12 23 10 7 10 58 14 36 17 15 53
5% 2% 8% 10% 5% 2% 2% 2% 14% 6% 9% 3% 5% 6% 3% 8% 3% 4% 2% 7% 2% 6% 4% 5% 6% 2% 7%
No opinion 240 79 161 76 66 68 30 149 47 23 7 75 76 77 39 122 78 63 80 17 49 190 62 114 63 82 146
17% 11% 22% 20% 19% 18% 10% 16% 23% 14% 28% 17% 15% 19% 10% 21% 18% 11% 15% 16% 10% 21% 16% 15% 23% 12% 21%
Sigma 1407 687 720 383 345 382 297 938 208 169 26 450 521 408 385 593 429 547 532 108 481 926 395 742 270 679 704
100% 100% 100% 100% 100% 100% 100% 100% 100% 100% 100% 100% 100% 100% 100% 100% 100% 100% 100% 100% 100% 100% 100% 100% 100% 100% 100%

Page 171
Fielding Period: November 27 - 28, 2018
HCAPS (Filtered on Registered Voters)
Weighted To The U.S. General Adult Population
30 Nov 2018
Table 149
F1_9 Now we will show you some names and groups. Please indicate if you have a favorable or unfavorable view of that person or group - or if you've never heard of them.
you've never heard of them.
Nancy Pelosi
Base: All Respondents
Presidential
Election Candidate
Gender Age Ethnicity Political Party Political Ideology Voted For Education Locale Income
_____________ ______________________ _______________________ ____________________ ____________________ _____________________ _____________ ________________ _________
Colle- Some
Cons- ge Gr- Colle- $75K Less
Hisp- Black Repub- Democ- Indep- Libe- Mode- erva- 3rd ad And ge Or Urb- Subu- Or Than
Total Male Female 18-34 35-49 50-64 65+ White anic /AA Other lican rat endent ral rate tive Clinton Trump Party Higher Less an rban Rural More $75K
______ _____ _______ _____ _____ _____ ____ _____ _____ _____ _____ ______ ______ ______ ______ ______ ______ ________ ______ _____ ______ ______ ____ _____ _____ ____ ____
Unweighted Base 1407 675 732 416 359 364 268 1049 104 173 25 437 526 382 437 549 421 537 505 113 543 864 388 719 300 548 846
Weighted Base 1407 687 720 383 345 382 297 938 208 169 26 450 521 408 385 593 429 547 532 108 481 926 395 742 270 679 704
Ever Heard Of (Net) 1162 615 547 295 278 318 271 784 162 141 23 401 429 318 329 451 382 465 479 92 426 736 336 609 217 597 551
83% 90% 76% 77% 80% 83% 91% 84% 78% 84% 91% 89% 82% 78% 85% 76% 89% 85% 90% 85% 89% 79% 85% 82% 80% 88% 78%
Very Favorable/ Favorable 471 237 235 136 126 102 107 267 87 85 11 71 299 99 247 184 41 326 78 16 187 284 175 231 65 250 221
(Sub-Net) 34% 34% 33% 36% 36% 27% 36% 28% 42% 50% 41% 16% 57% 24% 64% 31% 10% 60% 15% 15% 39% 31% 44% 31% 24% 37% 31%
Very favorable 124 57 67 30 27 40 26 69 21 26 5 14 93 17 79 34 12 88 25 1 42 82 54 57 14 68 56
9% 8% 9% 8% 8% 11% 9% 7% 10% 15% 21% 3% 18% 4% 20% 6% 3% 16% 5% 1% 9% 9% 14% 8% 5% 10% 8%
Favorable 347 180 168 106 99 62 81 198 67 59 5 57 206 82 168 150 29 238 54 14 146 202 121 175 51 182 165
25% 26% 23% 28% 29% 16% 27% 21% 32% 35% 21% 13% 40% 20% 44% 25% 7% 44% 10% 13% 30% 22% 31% 24% 19% 27% 23%
Very Unfavorable/ 691 378 312 159 152 216 164 517 74 56 13 329 130 218 83 267 341 138 401 76 239 452 161 378 152 347 330
Unfavorable (Sub-Net) 49% 55% 43% 42% 44% 57% 55% 55% 36% 33% 49% 73% 25% 54% 21% 45% 80% 25% 75% 70% 50% 49% 41% 51% 56% 51% 47%
Unfavorable 281 148 133 88 60 79 54 180 50 34 3 85 91 97 57 148 76 104 111 29 91 190 88 147 47 135 145
20% 22% 18% 23% 17% 21% 18% 19% 24% 20% 10% 19% 18% 24% 15% 25% 18% 19% 21% 27% 19% 21% 22% 20% 17% 20% 21%
Very unfavorable 410 230 180 71 92 138 109 337 24 22 10 244 38 121 25 119 265 34 289 46 148 262 73 231 105 212 185
29% 33% 25% 19% 27% 36% 37% 36% 11% 13% 39% 54% 7% 30% 7% 20% 62% 6% 54% 43% 31% 28% 19% 31% 39% 31% 26%
Never heard of them 34 5 29 19 7 6 2 19 10 2 - 8 12 12 8 18 8 10 7 4 5 28 7 21 6 9 23
2% 1% 4% 5% 2% 2% 1% 2% 5% 1% - 2% 2% 3% 2% 3% 2% 2% 1% 4% 1% 3% 2% 3% 2% 1% 3%
No opinion 211 67 144 69 61 57 25 136 37 26 2 42 80 78 49 124 39 72 46 12 49 162 53 112 47 73 130
15% 10% 20% 18% 18% 15% 8% 14% 18% 15% 9% 9% 15% 19% 13% 21% 9% 13% 9% 12% 10% 17% 13% 15% 17% 11% 18%
Sigma 1407 687 720 383 345 382 297 938 208 169 26 450 521 408 385 593 429 547 532 108 481 926 395 742 270 679 704
100% 100% 100% 100% 100% 100% 100% 100% 100% 100% 100% 100% 100% 100% 100% 100% 100% 100% 100% 100% 100% 100% 100% 100% 100% 100% 100%

Page 172
Fielding Period: November 27 - 28, 2018
HCAPS (Filtered on Registered Voters)
Weighted To The U.S. General Adult Population
30 Nov 2018
Table 150
F1_10 Now we will show you some names and groups. Please indicate if you have a favorable or unfavorable view of that person or group - or if you've never heard of them.
you've never heard of them.
Mitch McConnell
Base: All Respondents
Presidential
Election Candidate
Gender Age Ethnicity Political Party Political Ideology Voted For Education Locale Income
_____________ ______________________ _______________________ ____________________ ____________________ _____________________ _____________ ________________ _________
Colle- Some
Cons- ge Gr- Colle- $75K Less
Hisp- Black Repub- Democ- Indep- Libe- Mode- erva- 3rd ad And ge Or Urb- Subu- Or Than
Total Male Female 18-34 35-49 50-64 65+ White anic /AA Other lican rat endent ral rate tive Clinton Trump Party Higher Less an rban Rural More $75K
______ _____ _______ _____ _____ _____ ____ _____ _____ _____ _____ ______ ______ ______ ______ ______ ______ ________ ______ _____ ______ ______ ____ _____ _____ ____ ____
Unweighted Base 1407 675 732 416 359 364 268 1049 104 173 25 437 526 382 437 549 421 537 505 113 543 864 388 719 300 548 846
Weighted Base 1407 687 720 383 345 382 297 938 208 169 26 450 521 408 385 593 429 547 532 108 481 926 395 742 270 679 704
Ever Heard Of (Net) 982 563 419 231 224 277 249 674 141 111 13 327 382 264 306 364 311 417 379 81 390 592 285 516 180 532 437
70% 82% 58% 60% 65% 73% 84% 72% 68% 66% 52% 73% 73% 65% 79% 61% 73% 76% 71% 75% 81% 64% 72% 70% 67% 78% 62%
Very Favorable/ Favorable 354 198 156 90 79 105 79 259 50 30 - 206 72 74 57 110 186 59 234 25 130 224 110 173 71 191 157
(Sub-Net) 25% 29% 22% 24% 23% 28% 27% 28% 24% 18% - 46% 14% 18% 15% 19% 44% 11% 44% 23% 27% 24% 28% 23% 26% 28% 22%
Very favorable 66 34 32 22 14 23 7 50 9 3 - 40 21 4 20 13 33 12 42 5 26 39 23 34 9 39 26
5% 5% 4% 6% 4% 6% 2% 5% 4% 2% - 9% 4% 1% 5% 2% 8% 2% 8% 4% 5% 4% 6% 5% 3% 6% 4%
Favorable 288 164 124 68 65 83 72 209 42 27 - 166 51 70 37 97 154 47 192 20 104 184 87 139 62 152 132
20% 24% 17% 18% 19% 22% 24% 22% 20% 16% - 37% 10% 17% 10% 16% 36% 9% 36% 18% 22% 20% 22% 19% 23% 22% 19%
Very Unfavorable/ 628 365 263 141 145 172 170 416 91 81 13 121 310 190 248 255 125 358 146 56 260 368 175 344 109 341 279
Unfavorable (Sub-Net) 45% 53% 37% 37% 42% 45% 57% 44% 44% 48% 52% 27% 60% 47% 64% 43% 29% 65% 27% 52% 54% 40% 44% 46% 41% 50% 40%
Unfavorable 274 156 118 71 64 72 68 182 51 26 8 85 97 89 63 130 81 127 97 22 98 176 85 134 55 127 143
19% 23% 16% 18% 18% 19% 23% 19% 24% 16% 30% 19% 19% 22% 16% 22% 19% 23% 18% 21% 20% 19% 21% 18% 20% 19% 20%
Very unfavorable 354 209 145 70 81 100 103 233 40 55 6 36 213 101 186 124 44 231 49 34 162 191 90 210 54 214 137
25% 30% 20% 18% 24% 26% 35% 25% 19% 33% 22% 8% 41% 25% 48% 21% 10% 42% 9% 31% 34% 21% 23% 28% 20% 32% 19%
Never heard of them 103 27 77 54 27 18 5 53 23 16 3 23 42 31 25 54 24 30 26 11 16 88 28 54 21 31 73
7% 4% 11% 14% 8% 5% 2% 6% 11% 10% 12% 5% 8% 8% 7% 9% 6% 6% 5% 10% 3% 9% 7% 7% 8% 5% 10%
No opinion 322 97 225 98 95 87 43 211 44 41 9 100 97 113 54 174 93 100 127 16 76 246 82 171 69 117 195
23% 14% 31% 26% 27% 23% 14% 22% 21% 24% 36% 22% 19% 28% 14% 29% 22% 18% 24% 15% 16% 27% 21% 23% 25% 17% 28%
Sigma 1407 687 720 383 345 382 297 938 208 169 26 450 521 408 385 593 429 547 532 108 481 926 395 742 270 679 704
100% 100% 100% 100% 100% 100% 100% 100% 100% 100% 100% 100% 100% 100% 100% 100% 100% 100% 100% 100% 100% 100% 100% 100% 100% 100% 100%

Page 173
Fielding Period: November 27 - 28, 2018
HCAPS (Filtered on Registered Voters)
Weighted To The U.S. General Adult Population
30 Nov 2018
Table 151
F1_11 Now we will show you some names and groups. Please indicate if you have a favorable or unfavorable view of that person or group - or if you've never heard of them.
you've never heard of them.
Chuck Schumer
Base: All Respondents
Presidential
Election Candidate
Gender Age Ethnicity Political Party Political Ideology Voted For Education Locale Income
_____________ ______________________ _______________________ ____________________ ____________________ _____________________ _____________ ________________ _________
Colle- Some
Cons- ge Gr- Colle- $75K Less
Hisp- Black Repub- Democ- Indep- Libe- Mode- erva- 3rd ad And ge Or Urb- Subu- Or Than
Total Male Female 18-34 35-49 50-64 65+ White anic /AA Other lican rat endent ral rate tive Clinton Trump Party Higher Less an rban Rural More $75K
______ _____ _______ _____ _____ _____ ____ _____ _____ _____ _____ ______ ______ ______ ______ ______ ______ ________ ______ _____ ______ ______ ____ _____ _____ ____ ____
Unweighted Base 1407 675 732 416 359 364 268 1049 104 173 25 437 526 382 437 549 421 537 505 113 543 864 388 719 300 548 846
Weighted Base 1407 687 720 383 345 382 297 938 208 169 26 450 521 408 385 593 429 547 532 108 481 926 395 742 270 679 704
Ever Heard Of (Net) 926 530 396 217 221 261 226 645 119 108 12 317 353 246 288 341 296 384 392 76 377 549 269 501 156 512 404
66% 77% 55% 57% 64% 69% 76% 69% 57% 64% 46% 70% 68% 60% 75% 58% 69% 70% 74% 70% 78% 59% 68% 68% 58% 75% 57%
Very Favorable/ Favorable 408 214 193 105 104 97 101 248 71 58 6 81 233 92 204 154 50 260 101 24 178 230 159 203 47 234 174
(Sub-Net) 29% 31% 27% 27% 30% 26% 34% 26% 34% 34% 22% 18% 45% 23% 53% 26% 12% 48% 19% 22% 37% 25% 40% 27% 17% 34% 25%
Very favorable 98 38 60 23 22 21 31 62 13 18 1 14 69 15 56 35 7 67 18 8 41 57 47 43 8 49 49
7% 6% 8% 6% 6% 6% 11% 7% 6% 11% 5% 3% 13% 4% 15% 6% 2% 12% 3% 8% 9% 6% 12% 6% 3% 7% 7%
Favorable 310 176 133 81 83 76 70 186 58 40 4 67 164 78 148 119 43 193 83 16 137 173 112 159 39 185 125
22% 26% 19% 21% 24% 20% 23% 20% 28% 24% 17% 15% 31% 19% 38% 20% 10% 35% 16% 15% 28% 19% 28% 22% 14% 27% 18%
Very Unfavorable/ 518 316 202 112 116 164 125 398 48 50 6 237 120 153 84 188 246 124 291 52 199 319 110 299 109 278 230
Unfavorable (Sub-Net) 37% 46% 28% 29% 34% 43% 42% 42% 23% 29% 24% 53% 23% 38% 22% 32% 57% 23% 55% 48% 41% 34% 28% 40% 40% 41% 33%
Unfavorable 229 137 92 70 55 52 52 162 25 27 1 73 74 79 53 111 65 88 86 32 89 140 63 121 45 120 107
16% 20% 13% 18% 16% 14% 18% 17% 12% 16% 5% 16% 14% 19% 14% 19% 15% 16% 16% 29% 19% 15% 16% 16% 17% 18% 15%
Very unfavorable 289 179 111 43 61 112 73 235 23 23 5 164 47 74 31 76 181 36 205 20 110 179 47 178 64 158 123
21% 26% 15% 11% 18% 29% 25% 25% 11% 14% 19% 36% 9% 18% 8% 13% 42% 7% 38% 19% 23% 19% 12% 24% 24% 23% 17%
Never heard of them 124 34 91 68 29 21 6 66 27 17 4 30 50 36 23 67 34 41 19 12 30 95 29 61 34 39 85
9% 5% 13% 18% 8% 5% 2% 7% 13% 10% 16% 7% 10% 9% 6% 11% 8% 8% 4% 11% 6% 10% 7% 8% 13% 6% 12%
No opinion 357 123 234 98 95 99 65 227 61 44 10 103 117 127 74 184 99 122 121 20 75 282 98 179 80 129 216
25% 18% 33% 26% 28% 26% 22% 24% 30% 26% 38% 23% 22% 31% 19% 31% 23% 22% 23% 18% 16% 30% 25% 24% 30% 19% 31%
Sigma 1407 687 720 383 345 382 297 938 208 169 26 450 521 408 385 593 429 547 532 108 481 926 395 742 270 679 704
100% 100% 100% 100% 100% 100% 100% 100% 100% 100% 100% 100% 100% 100% 100% 100% 100% 100% 100% 100% 100% 100% 100% 100% 100% 100% 100%

Page 174
Fielding Period: November 27 - 28, 2018
HCAPS (Filtered on Registered Voters)
Weighted To The U.S. General Adult Population
30 Nov 2018
Table 152
F1_12 Now we will show you some names and groups. Please indicate if you have a favorable or unfavorable view of that person or group - or if you've never heard of them.
you've never heard of them.
Bernie Sanders
Base: All Respondents
Presidential
Election Candidate
Gender Age Ethnicity Political Party Political Ideology Voted For Education Locale Income
_____________ ______________________ _______________________ ____________________ ____________________ _____________________ _____________ ________________ _________
Colle- Some
Cons- ge Gr- Colle- $75K Less
Hisp- Black Repub- Democ- Indep- Libe- Mode- erva- 3rd ad And ge Or Urb- Subu- Or Than
Total Male Female 18-34 35-49 50-64 65+ White anic /AA Other lican rat endent ral rate tive Clinton Trump Party Higher Less an rban Rural More $75K
______ _____ _______ _____ _____ _____ ____ _____ _____ _____ _____ ______ ______ ______ ______ ______ ______ ________ ______ _____ ______ ______ ____ _____ _____ ____ ____
Unweighted Base 1407 675 732 416 359 364 268 1049 104 173 25 437 526 382 437 549 421 537 505 113 543 864 388 719 300 548 846
Weighted Base 1407 687 720 383 345 382 297 938 208 169 26 450 521 408 385 593 429 547 532 108 481 926 395 742 270 679 704
Ever Heard Of (Net) 1233 636 597 335 296 330 272 838 171 150 24 391 467 357 358 499 376 507 474 98 446 786 342 659 231 620 597
88% 93% 83% 87% 86% 87% 91% 89% 82% 89% 92% 87% 90% 87% 93% 84% 88% 93% 89% 91% 93% 85% 87% 89% 86% 91% 85%
Very Favorable/ Favorable 724 333 391 225 175 178 146 442 121 111 14 101 399 215 310 320 93 430 140 59 262 462 228 382 115 362 359
(Sub-Net) 51% 49% 54% 59% 51% 47% 49% 47% 58% 66% 54% 23% 77% 53% 81% 54% 22% 79% 26% 54% 54% 50% 58% 51% 43% 53% 51%
Very favorable 295 146 149 112 77 64 42 158 75 47 7 33 183 77 158 104 33 196 43 23 97 198 91 156 48 144 151
21% 21% 21% 29% 22% 17% 14% 17% 36% 28% 29% 7% 35% 19% 41% 18% 8% 36% 8% 21% 20% 21% 23% 21% 18% 21% 21%
Favorable 429 187 242 114 99 114 103 284 46 64 7 68 216 138 152 217 61 234 98 36 165 264 137 226 67 218 208
31% 27% 34% 30% 29% 30% 35% 30% 22% 38% 26% 15% 42% 34% 39% 37% 14% 43% 18% 33% 34% 29% 35% 30% 25% 32% 30%
Very Unfavorable/ 508 302 206 109 120 152 126 396 49 38 10 289 68 142 48 178 282 77 334 40 184 324 115 277 116 258 239
Unfavorable (Sub-Net) 36% 44% 29% 29% 35% 40% 43% 42% 24% 23% 38% 64% 13% 35% 12% 30% 66% 14% 63% 37% 38% 35% 29% 37% 43% 38% 34%
Unfavorable 222 134 88 51 61 62 48 154 24 30 2 93 46 79 34 108 80 53 127 14 81 141 57 110 55 120 101
16% 19% 12% 13% 18% 16% 16% 16% 12% 18% 9% 21% 9% 19% 9% 18% 19% 10% 24% 13% 17% 15% 14% 15% 20% 18% 14%
Very unfavorable 286 169 118 58 59 91 78 242 25 9 8 197 22 62 14 70 202 24 206 25 103 183 57 168 61 138 138
20% 25% 16% 15% 17% 24% 26% 26% 12% 5% 29% 44% 4% 15% 4% 12% 47% 4% 39% 23% 21% 20% 15% 23% 23% 20% 20%
Never heard of them 24 6 18 13 8 3 - 7 7 4 1 15 3 6 3 13 8 4 9 2 2 22 12 8 4 5 19
2% 1% 3% 3% 2% 1% - 1% 3% 2% 2% 3% * 1% 1% 2% 2% 1% 2% 2% * 2% 3% 1% 1% 1% 3%
No opinion 150 45 105 35 42 48 25 94 30 15 1 44 51 45 24 81 45 36 48 8 33 117 41 74 35 55 88
11% 7% 15% 9% 12% 13% 9% 10% 15% 9% 6% 10% 10% 11% 6% 14% 11% 7% 9% 7% 7% 13% 10% 10% 13% 8% 12%
Sigma 1407 687 720 383 345 382 297 938 208 169 26 450 521 408 385 593 429 547 532 108 481 926 395 742 270 679 704
100% 100% 100% 100% 100% 100% 100% 100% 100% 100% 100% 100% 100% 100% 100% 100% 100% 100% 100% 100% 100% 100% 100% 100% 100% 100% 100%

Page 175
Fielding Period: November 27 - 28, 2018
HCAPS (Filtered on Registered Voters)
Weighted To The U.S. General Adult Population
30 Nov 2018
Table 153
F1_13 Now we will show you some names and groups. Please indicate if you have a favorable or unfavorable view of that person or group - or if you've never heard of them.
you've never heard of them.
Elizabeth Warren
Base: All Respondents
Presidential
Election Candidate
Gender Age Ethnicity Political Party Political Ideology Voted For Education Locale Income
_____________ ______________________ _______________________ ____________________ ____________________ _____________________ _____________ ________________ _________
Colle- Some
Cons- ge Gr- Colle- $75K Less
Hisp- Black Repub- Democ- Indep- Libe- Mode- erva- 3rd ad And ge Or Urb- Subu- Or Than
Total Male Female 18-34 35-49 50-64 65+ White anic /AA Other lican rat endent ral rate tive Clinton Trump Party Higher Less an rban Rural More $75K
______ _____ _______ _____ _____ _____ ____ _____ _____ _____ _____ ______ ______ ______ ______ ______ ______ ________ ______ _____ ______ ______ ____ _____ _____ ____ ____
Unweighted Base 1407 675 732 416 359 364 268 1049 104 173 25 437 526 382 437 549 421 537 505 113 543 864 388 719 300 548 846
Weighted Base 1407 687 720 383 345 382 297 938 208 169 26 450 521 408 385 593 429 547 532 108 481 926 395 742 270 679 704
Ever Heard Of (Net) 1002 542 460 233 239 279 251 694 137 112 18 330 381 282 311 366 326 420 394 83 391 611 274 555 174 542 448
71% 79% 64% 61% 69% 73% 84% 74% 66% 67% 71% 73% 73% 69% 81% 62% 76% 77% 74% 76% 81% 66% 69% 75% 64% 80% 64%
Very Favorable/ Favorable 482 244 238 115 122 117 128 288 80 80 10 78 291 110 248 181 52 318 90 27 206 276 164 246 71 270 210
(Sub-Net) 34% 36% 33% 30% 35% 31% 43% 31% 39% 48% 40% 17% 56% 27% 64% 31% 12% 58% 17% 25% 43% 30% 41% 33% 26% 40% 30%
Very favorable 156 72 83 33 42 41 40 101 23 21 5 15 117 23 109 36 11 123 20 3 68 87 47 88 20 91 64
11% 11% 12% 9% 12% 11% 13% 11% 11% 12% 18% 3% 22% 6% 28% 6% 3% 22% 4% 3% 14% 9% 12% 12% 7% 13% 9%
Favorable 326 172 154 82 80 76 88 187 58 60 6 64 174 86 139 145 41 195 70 24 138 188 117 158 51 178 146
23% 25% 21% 21% 23% 20% 30% 20% 28% 35% 22% 14% 33% 21% 36% 25% 10% 36% 13% 22% 29% 20% 29% 21% 19% 26% 21%
Very Unfavorable/ 521 298 223 118 117 162 123 407 57 32 8 251 90 172 62 184 274 102 304 56 185 335 110 308 103 272 238
Unfavorable (Sub-Net) 37% 43% 31% 31% 34% 42% 41% 43% 27% 19% 31% 56% 17% 42% 16% 31% 64% 19% 57% 52% 38% 36% 28% 42% 38% 40% 34%
Unfavorable 219 117 101 70 56 52 41 151 38 18 2 73 58 85 44 103 72 77 88 27 74 145 64 122 33 108 111
16% 17% 14% 18% 16% 14% 14% 16% 18% 11% 7% 16% 11% 21% 11% 17% 17% 14% 17% 25% 15% 16% 16% 16% 12% 16% 16%
Very unfavorable 302 180 121 49 61 109 82 255 19 14 6 178 32 87 19 81 202 25 216 29 111 191 46 186 69 164 128
21% 26% 17% 13% 18% 29% 28% 27% 9% 8% 25% 40% 6% 21% 5% 14% 47% 4% 41% 27% 23% 21% 12% 25% 26% 24% 18%
Never heard of them 112 41 71 49 37 23 3 61 21 17 2 33 34 37 16 59 37 29 39 8 29 83 32 59 21 43 69
8% 6% 10% 13% 11% 6% 1% 7% 10% 10% 9% 7% 7% 9% 4% 10% 9% 5% 7% 7% 6% 9% 8% 8% 8% 6% 10%
No opinion 293 104 189 101 69 80 43 183 50 39 5 87 105 89 59 168 65 98 99 18 61 231 89 128 75 95 187
21% 15% 26% 26% 20% 21% 14% 19% 24% 23% 19% 19% 20% 22% 15% 28% 15% 18% 19% 16% 13% 25% 22% 17% 28% 14% 27%
Sigma 1407 687 720 383 345 382 297 938 208 169 26 450 521 408 385 593 429 547 532 108 481 926 395 742 270 679 704
100% 100% 100% 100% 100% 100% 100% 100% 100% 100% 100% 100% 100% 100% 100% 100% 100% 100% 100% 100% 100% 100% 100% 100% 100% 100% 100%

Page 176
Fielding Period: November 27 - 28, 2018
HCAPS (Filtered on Registered Voters)
Weighted To The U.S. General Adult Population
30 Nov 2018
Table 154
F1_14 Now we will show you some names and groups. Please indicate if you have a favorable or unfavorable view of that person or group - or if you've never heard of them.
you've never heard of them.
Joe Biden
Base: All Respondents
Presidential
Election Candidate
Gender Age Ethnicity Political Party Political Ideology Voted For Education Locale Income
_____________ ______________________ _______________________ ____________________ ____________________ _____________________ _____________ ________________ _________
Colle- Some
Cons- ge Gr- Colle- $75K Less
Hisp- Black Repub- Democ- Indep- Libe- Mode- erva- 3rd ad And ge Or Urb- Subu- Or Than
Total Male Female 18-34 35-49 50-64 65+ White anic /AA Other lican rat endent ral rate tive Clinton Trump Party Higher Less an rban Rural More $75K
______ _____ _______ _____ _____ _____ ____ _____ _____ _____ _____ ______ ______ ______ ______ ______ ______ ________ ______ _____ ______ ______ ____ _____ _____ ____ ____
Unweighted Base 1407 675 732 416 359 364 268 1049 104 173 25 437 526 382 437 549 421 537 505 113 543 864 388 719 300 548 846
Weighted Base 1407 687 720 383 345 382 297 938 208 169 26 450 521 408 385 593 429 547 532 108 481 926 395 742 270 679 704
Ever Heard Of (Net) 1199 634 565 310 291 331 267 829 153 147 19 385 461 335 351 478 370 499 464 97 446 753 342 632 225 622 560
85% 92% 78% 81% 84% 87% 90% 88% 74% 87% 74% 86% 89% 82% 91% 81% 86% 91% 87% 90% 93% 81% 86% 85% 83% 92% 80%
Very Favorable/ Favorable 760 368 392 204 193 186 178 482 111 122 10 129 418 205 316 328 117 452 165 57 299 462 254 390 116 410 346
(Sub-Net) 54% 54% 54% 53% 56% 49% 60% 51% 53% 72% 39% 29% 80% 50% 82% 55% 27% 83% 31% 53% 62% 50% 64% 53% 43% 60% 49%
Very favorable 339 152 187 84 77 91 87 193 60 77 3 28 236 73 173 137 29 246 41 21 129 210 124 172 43 181 159
24% 22% 26% 22% 22% 24% 29% 21% 29% 46% 13% 6% 45% 18% 45% 23% 7% 45% 8% 19% 27% 23% 31% 23% 16% 27% 23%
Favorable 421 216 205 120 116 95 91 289 51 45 7 101 182 132 142 191 87 206 124 36 170 251 129 218 73 230 187
30% 31% 28% 31% 33% 25% 30% 31% 24% 27% 26% 22% 35% 32% 37% 32% 20% 38% 23% 33% 35% 27% 33% 29% 27% 34% 27%
Very Unfavorable/ 439 266 173 106 98 146 89 347 42 25 9 256 43 130 36 149 254 47 299 40 147 292 88 242 109 212 214
Unfavorable (Sub-Net) 31% 39% 24% 28% 28% 38% 30% 37% 20% 15% 36% 57% 8% 32% 9% 25% 59% 9% 56% 37% 31% 32% 22% 33% 40% 31% 30%
Unfavorable 193 117 76 64 42 53 34 137 31 11 2 92 30 67 19 85 89 37 113 22 62 130 46 98 48 92 97
14% 17% 10% 17% 12% 14% 12% 15% 15% 6% 9% 20% 6% 16% 5% 14% 21% 7% 21% 21% 13% 14% 12% 13% 18% 13% 14%
Very unfavorable 246 149 97 42 56 93 55 210 11 14 7 164 13 63 17 65 165 10 186 18 85 161 42 143 61 120 117
17% 22% 14% 11% 16% 24% 18% 22% 5% 8% 26% 36% 2% 16% 4% 11% 38% 2% 35% 17% 18% 17% 11% 19% 23% 18% 17%
Never heard of them 43 12 31 24 14 3 2 12 17 6 1 15 12 15 10 23 10 9 12 1 8 35 16 24 4 10 32
3% 2% 4% 6% 4% 1% 1% 1% 8% 3% 5% 3% 2% 4% 3% 4% 2% 2% 2% 1% 2% 4% 4% 3% 1% 2% 4%
No opinion 165 41 124 49 41 47 28 97 38 16 5 50 48 58 24 92 49 39 55 10 28 137 38 86 41 47 113
12% 6% 17% 13% 12% 12% 10% 10% 18% 9% 21% 11% 9% 14% 6% 16% 11% 7% 10% 9% 6% 15% 10% 12% 15% 7% 16%
Sigma 1407 687 720 383 345 382 297 938 208 169 26 450 521 408 385 593 429 547 532 108 481 926 395 742 270 679 704
100% 100% 100% 100% 100% 100% 100% 100% 100% 100% 100% 100% 100% 100% 100% 100% 100% 100% 100% 100% 100% 100% 100% 100% 100% 100% 100%

Page 177
Fielding Period: November 27 - 28, 2018
HCAPS (Filtered on Registered Voters)
Weighted To The U.S. General Adult Population
30 Nov 2018
Table 155
F1_21 Now we will show you some names and groups. Please indicate if you have a favorable or unfavorable view of that person or group - or if you've never heard of them.
you've never heard of them.
Stephen Bannon
Base: All Respondents
Presidential
Election Candidate
Gender Age Ethnicity Political Party Political Ideology Voted For Education Locale Income
_____________ ______________________ _______________________ ____________________ ____________________ _____________________ _____________ ________________ _________
Colle- Some
Cons- ge Gr- Colle- $75K Less
Hisp- Black Repub- Democ- Indep- Libe- Mode- erva- 3rd ad And ge Or Urb- Subu- Or Than
Total Male Female 18-34 35-49 50-64 65+ White anic /AA Other lican rat endent ral rate tive Clinton Trump Party Higher Less an rban Rural More $75K
______ _____ _______ _____ _____ _____ ____ _____ _____ _____ _____ ______ ______ ______ ______ ______ ______ ________ ______ _____ ______ ______ ____ _____ _____ ____ ____
Unweighted Base 1407 675 732 416 359 364 268 1049 104 173 25 437 526 382 437 549 421 537 505 113 543 864 388 719 300 548 846
Weighted Base 1407 687 720 383 345 382 297 938 208 169 26 450 521 408 385 593 429 547 532 108 481 926 395 742 270 679 704
Ever Heard Of (Net) 856 488 369 219 201 240 196 587 126 91 12 284 341 224 300 305 251 385 317 69 356 501 245 469 142 476 374
61% 71% 51% 57% 58% 63% 66% 63% 61% 54% 46% 63% 66% 55% 78% 51% 58% 70% 60% 64% 74% 54% 62% 63% 53% 70% 53%
Very Favorable/ Favorable 224 125 99 86 63 47 28 154 43 19 2 116 55 52 57 80 88 55 135 14 67 158 89 100 36 118 106
(Sub-Net) 16% 18% 14% 22% 18% 12% 10% 16% 21% 11% 6% 26% 11% 13% 15% 13% 20% 10% 25% 13% 14% 17% 22% 13% 13% 17% 15%
Very favorable 65 36 29 35 22 7 1 36 20 8 - 28 19 18 24 25 16 21 36 2 17 48 29 23 13 32 33
5% 5% 4% 9% 6% 2% * 4% 10% 5% - 6% 4% 4% 6% 4% 4% 4% 7% 2% 4% 5% 7% 3% 5% 5% 5%
Favorable 159 89 70 51 41 40 27 117 23 12 2 88 36 35 33 54 71 33 99 11 50 110 59 77 23 86 73
11% 13% 10% 13% 12% 11% 9% 12% 11% 7% 6% 19% 7% 8% 9% 9% 17% 6% 19% 10% 10% 12% 15% 10% 8% 13% 10%
Very Unfavorable/ 632 362 270 133 139 193 168 433 83 71 10 168 286 172 243 226 163 330 181 55 289 343 156 369 106 359 268
Unfavorable (Sub-Net) 45% 53% 37% 35% 40% 50% 56% 46% 40% 42% 40% 37% 55% 42% 63% 38% 38% 60% 34% 51% 60% 37% 40% 50% 39% 53% 38%
Unfavorable 235 132 103 70 50 62 53 170 32 20 2 99 72 61 53 92 90 79 108 17 94 141 63 123 49 120 113
17% 19% 14% 18% 14% 16% 18% 18% 16% 12% 7% 22% 14% 15% 14% 15% 21% 14% 20% 15% 20% 15% 16% 17% 18% 18% 16%
Very unfavorable 397 231 166 63 89 130 115 264 51 51 9 69 214 111 190 134 73 251 74 39 195 202 93 247 57 239 155
28% 34% 23% 17% 26% 34% 39% 28% 24% 30% 33% 15% 41% 27% 49% 23% 17% 46% 14% 36% 40% 22% 24% 33% 21% 35% 22%
Never heard of them 192 63 129 72 48 44 28 106 42 25 7 51 73 59 31 105 56 62 53 21 45 147 61 88 43 67 121
14% 9% 18% 19% 14% 11% 10% 11% 20% 15% 26% 11% 14% 14% 8% 18% 13% 11% 10% 19% 9% 16% 15% 12% 16% 10% 17%
No opinion 359 136 223 91 97 98 73 245 40 53 7 115 106 125 54 183 122 101 162 19 81 278 89 185 85 136 209
26% 20% 31% 24% 28% 26% 25% 26% 19% 32% 28% 26% 20% 31% 14% 31% 28% 18% 30% 17% 17% 30% 23% 25% 31% 20% 30%
Sigma 1407 687 720 383 345 382 297 938 208 169 26 450 521 408 385 593 429 547 532 108 481 926 395 742 270 679 704
100% 100% 100% 100% 100% 100% 100% 100% 100% 100% 100% 100% 100% 100% 100% 100% 100% 100% 100% 100% 100% 100% 100% 100% 100% 100% 100%

Page 178
Fielding Period: November 27 - 28, 2018
HCAPS (Filtered on Registered Voters)
Weighted To The U.S. General Adult Population
30 Nov 2018
Table 156
F1_34 Now we will show you some names and groups. Please indicate if you have a favorable or unfavorable view of that person or group - or if you've never heard of them.
you've never heard of them.
Robert Mueller
Base: All Respondents
Presidential
Election Candidate
Gender Age Ethnicity Political Party Political Ideology Voted For Education Locale Income
_____________ ______________________ _______________________ ____________________ ____________________ _____________________ _____________ ________________ _________
Colle- Some
Cons- ge Gr- Colle- $75K Less
Hisp- Black Repub- Democ- Indep- Libe- Mode- erva- 3rd ad And ge Or Urb- Subu- Or Than
Total Male Female 18-34 35-49 50-64 65+ White anic /AA Other lican rat endent ral rate tive Clinton Trump Party Higher Less an rban Rural More $75K
______ _____ _______ _____ _____ _____ ____ _____ _____ _____ _____ ______ ______ ______ ______ ______ ______ ________ ______ _____ ______ ______ ____ _____ _____ ____ ____
Unweighted Base 1407 675 732 416 359 364 268 1049 104 173 25 437 526 382 437 549 421 537 505 113 543 864 388 719 300 548 846
Weighted Base 1407 687 720 383 345 382 297 938 208 169 26 450 521 408 385 593 429 547 532 108 481 926 395 742 270 679 704
Ever Heard Of (Net) 1001 579 422 257 235 278 231 693 138 111 14 321 387 283 313 378 309 424 389 84 403 598 291 535 174 555 433
71% 84% 59% 67% 68% 73% 78% 74% 66% 66% 53% 71% 74% 69% 81% 64% 72% 77% 73% 78% 84% 65% 74% 72% 65% 82% 61%
Very Favorable/ Favorable 542 324 219 132 119 163 128 353 83 71 7 108 288 144 246 211 85 321 130 41 252 290 186 276 81 317 220
(Sub-Net) 39% 47% 30% 35% 35% 43% 43% 38% 40% 42% 27% 24% 55% 35% 64% 36% 20% 59% 24% 38% 52% 31% 47% 37% 30% 47% 31%
Very favorable 246 157 89 45 47 80 73 168 25 35 5 32 151 63 135 86 25 174 34 22 120 127 80 139 27 159 86
17% 23% 12% 12% 14% 21% 25% 18% 12% 21% 20% 7% 29% 15% 35% 15% 6% 32% 6% 20% 25% 14% 20% 19% 10% 23% 12%
Favorable 296 167 130 87 72 83 55 185 58 36 2 77 137 81 112 125 60 147 96 19 133 164 106 136 54 158 133
21% 24% 18% 23% 21% 22% 18% 20% 28% 21% 7% 17% 26% 20% 29% 21% 14% 27% 18% 17% 28% 18% 27% 18% 20% 23% 19%
Very Unfavorable/ 458 255 203 125 116 115 103 340 56 40 7 212 99 139 67 167 224 103 259 44 150 308 105 260 93 238 213
Unfavorable (Sub-Net) 33% 37% 28% 33% 34% 30% 35% 36% 27% 24% 26% 47% 19% 34% 17% 28% 52% 19% 49% 40% 31% 33% 27% 35% 35% 35% 30%
Unfavorable 217 116 101 63 64 44 46 157 28 21 3 80 57 75 31 93 94 61 99 28 71 146 55 117 45 120 95
15% 17% 14% 17% 18% 11% 16% 17% 13% 12% 13% 18% 11% 18% 8% 16% 22% 11% 19% 26% 15% 16% 14% 16% 17% 18% 13%
Very unfavorable 241 140 102 61 52 71 57 183 28 19 3 132 42 64 36 74 131 42 160 16 79 162 50 143 48 119 118
17% 20% 14% 16% 15% 19% 19% 19% 13% 11% 13% 29% 8% 16% 9% 13% 30% 8% 30% 14% 16% 18% 13% 19% 18% 17% 17%
Never heard of them 96 23 72 48 27 21 1 51 17 13 7 26 33 30 20 50 26 32 30 7 16 80 18 57 21 32 64
7% 3% 10% 12% 8% 5% * 5% 8% 8% 28% 6% 6% 7% 5% 9% 6% 6% 6% 6% 3% 9% 4% 8% 8% 5% 9%
No opinion 311 84 226 78 83 83 66 195 53 45 5 103 101 95 52 165 94 91 113 17 63 248 87 150 74 93 207
22% 12% 31% 20% 24% 22% 22% 21% 26% 27% 19% 23% 19% 23% 14% 28% 22% 17% 21% 16% 13% 27% 22% 20% 28% 14% 29%
Sigma 1407 687 720 383 345 382 297 938 208 169 26 450 521 408 385 593 429 547 532 108 481 926 395 742 270 679 704
100% 100% 100% 100% 100% 100% 100% 100% 100% 100% 100% 100% 100% 100% 100% 100% 100% 100% 100% 100% 100% 100% 100% 100% 100% 100% 100%
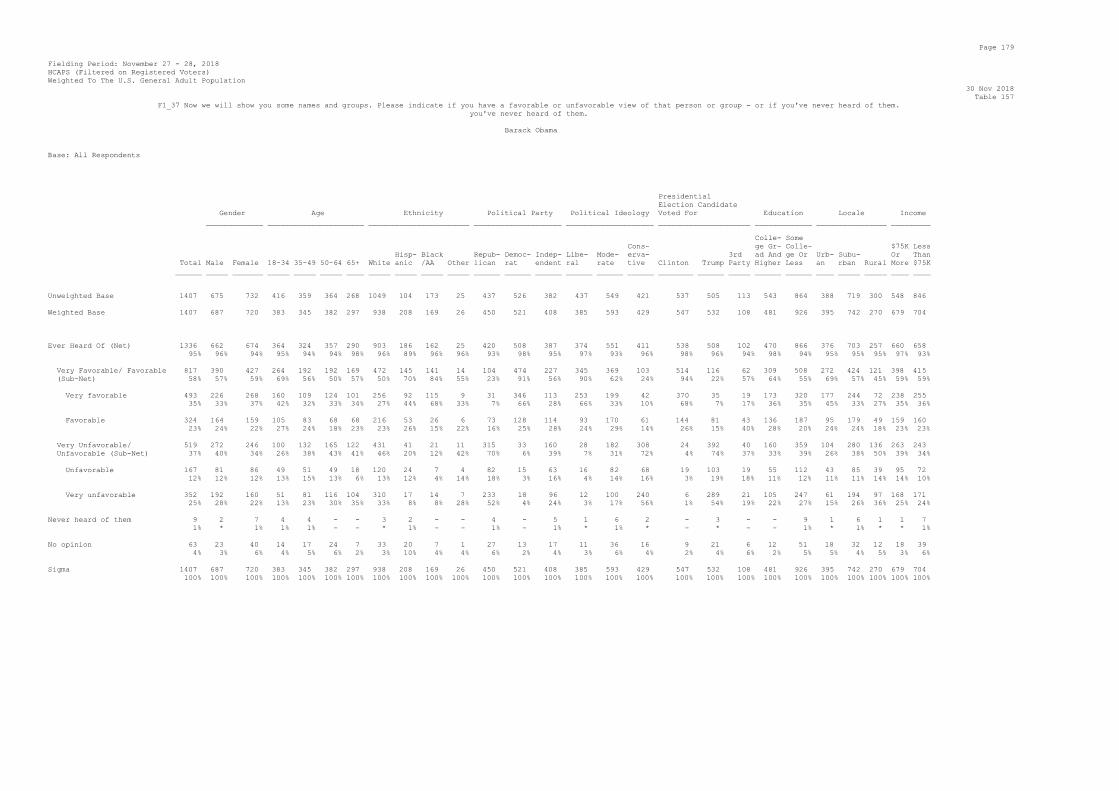
Page 179
Fielding Period: November 27 - 28, 2018
HCAPS (Filtered on Registered Voters)
Weighted To The U.S. General Adult Population
30 Nov 2018
Table 157
F1_37 Now we will show you some names and groups. Please indicate if you have a favorable or unfavorable view of that person or group - or if you've never heard of them.
you've never heard of them.
Barack Obama
Base: All Respondents
Presidential
Election Candidate
Gender Age Ethnicity Political Party Political Ideology Voted For Education Locale Income
_____________ ______________________ _______________________ ____________________ ____________________ _____________________ _____________ ________________ _________
Colle- Some
Cons- ge Gr- Colle- $75K Less
Hisp- Black Repub- Democ- Indep- Libe- Mode- erva- 3rd ad And ge Or Urb- Subu- Or Than
Total Male Female 18-34 35-49 50-64 65+ White anic /AA Other lican rat endent ral rate tive Clinton Trump Party Higher Less an rban Rural More $75K
______ _____ _______ _____ _____ _____ ____ _____ _____ _____ _____ ______ ______ ______ ______ ______ ______ ________ ______ _____ ______ ______ ____ _____ _____ ____ ____
Unweighted Base 1407 675 732 416 359 364 268 1049 104 173 25 437 526 382 437 549 421 537 505 113 543 864 388 719 300 548 846
Weighted Base 1407 687 720 383 345 382 297 938 208 169 26 450 521 408 385 593 429 547 532 108 481 926 395 742 270 679 704
Ever Heard Of (Net) 1336 662 674 364 324 357 290 903 186 162 25 420 508 387 374 551 411 538 508 102 470 866 376 703 257 660 658
95% 96% 94% 95% 94% 94% 98% 96% 89% 96% 96% 93% 98% 95% 97% 93% 96% 98% 96% 94% 98% 94% 95% 95% 95% 97% 93%
Very Favorable/ Favorable 817 390 427 264 192 192 169 472 145 141 14 104 474 227 345 369 103 514 116 62 309 508 272 424 121 398 415
(Sub-Net) 58% 57% 59% 69% 56% 50% 57% 50% 70% 84% 55% 23% 91% 56% 90% 62% 24% 94% 22% 57% 64% 55% 69% 57% 45% 59% 59%
Very favorable 493 226 268 160 109 124 101 256 92 115 9 31 346 113 253 199 42 370 35 19 173 320 177 244 72 238 255
35% 33% 37% 42% 32% 33% 34% 27% 44% 68% 33% 7% 66% 28% 66% 33% 10% 68% 7% 17% 36% 35% 45% 33% 27% 35% 36%
Favorable 324 164 159 105 83 68 68 216 53 26 6 73 128 114 93 170 61 144 81 43 136 187 95 179 49 159 160
23% 24% 22% 27% 24% 18% 23% 23% 26% 15% 22% 16% 25% 28% 24% 29% 14% 26% 15% 40% 28% 20% 24% 24% 18% 23% 23%
Very Unfavorable/ 519 272 246 100 132 165 122 431 41 21 11 315 33 160 28 182 308 24 392 40 160 359 104 280 136 263 243
Unfavorable (Sub-Net) 37% 40% 34% 26% 38% 43% 41% 46% 20% 12% 42% 70% 6% 39% 7% 31% 72% 4% 74% 37% 33% 39% 26% 38% 50% 39% 34%
Unfavorable 167 81 86 49 51 49 18 120 24 7 4 82 15 63 16 82 68 19 103 19 55 112 43 85 39 95 72
12% 12% 12% 13% 15% 13% 6% 13% 12% 4% 14% 18% 3% 16% 4% 14% 16% 3% 19% 18% 11% 12% 11% 11% 14% 14% 10%
Very unfavorable 352 192 160 51 81 116 104 310 17 14 7 233 18 96 12 100 240 6 289 21 105 247 61 194 97 168 171
25% 28% 22% 13% 23% 30% 35% 33% 8% 8% 28% 52% 4% 24% 3% 17% 56% 1% 54% 19% 22% 27% 15% 26% 36% 25% 24%
Never heard of them 9 2 7 4 4 - - 3 2 - - 4 - 5 1 6 2 - 3 - - 9 1 6 1 1 7
1% * 1% 1% 1% - - * 1% - - 1% - 1% * 1% * - * - - 1% * 1% * * 1%
No opinion 63 23 40 14 17 24 7 33 20 7 1 27 13 17 11 36 16 9 21 6 12 51 18 32 12 18 39
4% 3% 6% 4% 5% 6% 2% 3% 10% 4% 4% 6% 2% 4% 3% 6% 4% 2% 4% 6% 2% 5% 5% 4% 5% 3% 6%
Sigma 1407 687 720 383 345 382 297 938 208 169 26 450 521 408 385 593 429 547 532 108 481 926 395 742 270 679 704
100% 100% 100% 100% 100% 100% 100% 100% 100% 100% 100% 100% 100% 100% 100% 100% 100% 100% 100% 100% 100% 100% 100% 100% 100% 100% 100%

Page 180
Fielding Period: November 27 - 28, 2018
HCAPS (Filtered on Registered Voters)
Weighted To The U.S. General Adult Population
30 Nov 2018
Table 158
F1_53 Now we will show you some names and groups. Please indicate if you have a favorable or unfavorable view of that person or group - or if you've never heard of them.
you've never heard of them.
U.S. Military
Base: All Respondents
Presidential
Election Candidate
Gender Age Ethnicity Political Party Political Ideology Voted For Education Locale Income
_____________ ______________________ _______________________ ____________________ ____________________ _____________________ _____________ ________________ _________
Colle- Some
Cons- ge Gr- Colle- $75K Less
Hisp- Black Repub- Democ- Indep- Libe- Mode- erva- 3rd ad And ge Or Urb- Subu- Or Than
Total Male Female 18-34 35-49 50-64 65+ White anic /AA Other lican rat endent ral rate tive Clinton Trump Party Higher Less an rban Rural More $75K
______ _____ _______ _____ _____ _____ ____ _____ _____ _____ _____ ______ ______ ______ ______ ______ ______ ________ ______ _____ ______ ______ ____ _____ _____ ____ ____
Unweighted Base 1407 675 732 416 359 364 268 1049 104 173 25 437 526 382 437 549 421 537 505 113 543 864 388 719 300 548 846
Weighted Base 1407 687 720 383 345 382 297 938 208 169 26 450 521 408 385 593 429 547 532 108 481 926 395 742 270 679 704
Ever Heard Of (Net) 1307 655 653 350 316 356 285 892 184 152 21 439 480 369 364 534 409 505 519 100 455 852 377 687 243 649 638
93% 95% 91% 91% 91% 93% 96% 95% 89% 90% 81% 98% 92% 90% 95% 90% 95% 92% 98% 93% 95% 92% 96% 93% 90% 96% 91%
Very Favorable/ Favorable 1181 590 591 283 284 338 276 829 154 132 17 419 425 323 304 480 397 449 486 87 420 761 337 619 225 592 569
(Sub-Net) 84% 86% 82% 74% 82% 89% 93% 88% 74% 78% 67% 93% 82% 79% 79% 81% 93% 82% 91% 80% 87% 82% 85% 84% 83% 87% 81%
Very favorable 680 357 323 155 156 200 168 497 84 66 13 301 189 184 138 256 286 204 349 51 225 454 181 357 142 339 326
48% 52% 45% 41% 45% 52% 57% 53% 40% 39% 51% 67% 36% 45% 36% 43% 67% 37% 66% 47% 47% 49% 46% 48% 52% 50% 46%
Favorable 501 233 268 128 127 138 108 332 70 66 4 118 236 139 166 224 111 246 137 36 195 306 156 262 83 254 243
36% 34% 37% 33% 37% 36% 36% 35% 34% 39% 16% 26% 45% 34% 43% 38% 26% 45% 26% 33% 40% 33% 39% 35% 31% 37% 35%
Very Unfavorable/ 127 65 62 67 32 18 9 63 30 20 4 20 55 46 60 55 12 56 33 13 35 91 41 68 18 57 69
Unfavorable (Sub-Net) 9% 9% 9% 18% 9% 5% 3% 7% 14% 12% 14% 4% 11% 11% 16% 9% 3% 10% 6% 12% 7% 10% 10% 9% 7% 8% 10%
Unfavorable 92 50 42 49 23 13 7 49 15 13 4 14 44 29 45 37 9 38 24 11 31 61 24 55 13 51 41
7% 7% 6% 13% 7% 3% 2% 5% 7% 8% 14% 3% 8% 7% 12% 6% 2% 7% 5% 11% 6% 7% 6% 7% 5% 7% 6%
Very unfavorable 35 15 20 19 9 5 2 13 15 7 - 6 11 16 15 17 3 18 8 2 4 31 17 13 5 6 28
2% 2% 3% 5% 3% 1% 1% 1% 7% 4% - 1% 2% 4% 4% 3% 1% 3% 2% 2% 1% 3% 4% 2% 2% 1% 4%
Never heard of them 8 5 3 5 3 - - 1 2 2 - 4 3 1 3 2 3 2 3 1 2 5 2 6 - 3 5
1% 1% * 1% 1% - - * 1% 1% - 1% 1% * 1% * 1% * * 1% * 1% 1% 1% - * 1%
No opinion 92 27 64 28 27 25 12 45 22 14 5 7 37 38 18 56 17 41 10 7 24 68 16 49 28 27 61
7% 4% 9% 7% 8% 7% 4% 5% 10% 8% 19% 2% 7% 9% 5% 9% 4% 7% 2% 7% 5% 7% 4% 7% 10% 4% 9%
Sigma 1407 687 720 383 345 382 297 938 208 169 26 450 521 408 385 593 429 547 532 108 481 926 395 742 270 679 704
100% 100% 100% 100% 100% 100% 100% 100% 100% 100% 100% 100% 100% 100% 100% 100% 100% 100% 100% 100% 100% 100% 100% 100% 100% 100% 100%

Page 181
Fielding Period: November 27 - 28, 2018
HCAPS (Filtered on Registered Voters)
Weighted To The U.S. General Adult Population
30 Nov 2018
Table 159
F1_54 Now we will show you some names and groups. Please indicate if you have a favorable or unfavorable view of that person or group - or if you've never heard of them.
you've never heard of them.
FBI
Base: All Respondents
Presidential
Election Candidate
Gender Age Ethnicity Political Party Political Ideology Voted For Education Locale Income
_____________ ______________________ _______________________ ____________________ ____________________ _____________________ _____________ ________________ _________
Colle- Some
Cons- ge Gr- Colle- $75K Less
Hisp- Black Repub- Democ- Indep- Libe- Mode- erva- 3rd ad And ge Or Urb- Subu- Or Than
Total Male Female 18-34 35-49 50-64 65+ White anic /AA Other lican rat endent ral rate tive Clinton Trump Party Higher Less an rban Rural More $75K
______ _____ _______ _____ _____ _____ ____ _____ _____ _____ _____ ______ ______ ______ ______ ______ ______ ________ ______ _____ ______ ______ ____ _____ _____ ____ ____
Unweighted Base 1407 675 732 416 359 364 268 1049 104 173 25 437 526 382 437 549 421 537 505 113 543 864 388 719 300 548 846
Weighted Base 1407 687 720 383 345 382 297 938 208 169 26 450 521 408 385 593 429 547 532 108 481 926 395 742 270 679 704
Ever Heard Of (Net) 1234 632 602 337 292 334 272 841 172 145 23 398 461 358 350 503 381 507 474 98 439 795 355 643 237 625 586
88% 92% 84% 88% 84% 87% 91% 90% 83% 86% 88% 88% 89% 88% 91% 85% 89% 93% 89% 91% 91% 86% 90% 87% 88% 92% 83%
Very Favorable/ Favorable 885 441 444 239 194 240 212 604 123 108 11 257 384 235 290 361 234 419 292 64 340 545 261 458 166 454 413
(Sub-Net) 63% 64% 62% 62% 56% 63% 71% 64% 59% 64% 44% 57% 74% 58% 75% 61% 55% 77% 55% 60% 71% 59% 66% 62% 61% 67% 59%
Very favorable 257 128 129 76 50 68 63 189 24 32 5 72 107 78 82 102 73 114 82 21 80 178 74 135 48 122 130
18% 19% 18% 20% 15% 18% 21% 20% 11% 19% 19% 16% 21% 19% 21% 17% 17% 21% 15% 20% 17% 19% 19% 18% 18% 18% 18%
Favorable 628 313 315 163 144 173 149 415 100 77 6 185 277 157 208 259 160 304 210 43 260 368 187 323 118 333 282
45% 46% 44% 43% 42% 45% 50% 44% 48% 45% 25% 41% 53% 38% 54% 44% 37% 56% 39% 40% 54% 40% 47% 44% 44% 49% 40%
Very Unfavorable/ 349 191 158 98 98 94 60 237 49 37 11 141 77 123 60 142 147 88 182 34 99 250 93 185 71 171 174
Unfavorable (Sub-Net) 25% 28% 22% 26% 28% 25% 20% 25% 24% 22% 44% 31% 15% 30% 16% 24% 34% 16% 34% 31% 21% 27% 24% 25% 26% 25% 25%
Unfavorable 236 120 115 67 58 67 43 167 25 21 11 95 61 73 46 90 100 65 111 29 77 159 55 127 53 113 118
17% 18% 16% 17% 17% 18% 15% 18% 12% 12% 44% 21% 12% 18% 12% 15% 23% 12% 21% 26% 16% 17% 14% 17% 20% 17% 17%
Very unfavorable 114 71 43 32 39 27 16 70 25 16 - 46 15 50 14 53 47 23 71 5 23 91 38 58 18 57 56
8% 10% 6% 8% 11% 7% 6% 7% 12% 10% - 10% 3% 12% 4% 9% 11% 4% 13% 5% 5% 10% 10% 8% 7% 8% 8%
Never heard of them 9 3 7 7 2 - - 4 1 4 - 3 5 2 5 3 2 6 1 - 2 7 3 6 - 4 5
1% * 1% 2% 1% - - * 1% 2% - 1% 1% * 1% * * 1% * - * 1% 1% 1% - 1% 1%
No opinion 163 52 111 38 51 48 26 93 34 20 3 50 55 48 30 87 46 35 57 10 40 123 38 93 33 50 113
12% 8% 15% 10% 15% 13% 9% 10% 17% 12% 12% 11% 11% 12% 8% 15% 11% 6% 11% 9% 8% 13% 10% 12% 12% 7% 16%
Sigma 1407 687 720 383 345 382 297 938 208 169 26 450 521 408 385 593 429 547 532 108 481 926 395 742 270 679 704
100% 100% 100% 100% 100% 100% 100% 100% 100% 100% 100% 100% 100% 100% 100% 100% 100% 100% 100% 100% 100% 100% 100% 100% 100% 100% 100%

Page 182
Fielding Period: November 27 - 28, 2018
HCAPS (Filtered on Registered Voters)
Weighted To The U.S. General Adult Population
30 Nov 2018
Table 160
F1_55 Now we will show you some names and groups. Please indicate if you have a favorable or unfavorable view of that person or group - or if you've never heard of them.
you've never heard of them.
U.S. Supreme Court
Base: All Respondents
Presidential
Election Candidate
Gender Age Ethnicity Political Party Political Ideology Voted For Education Locale Income
_____________ ______________________ _______________________ ____________________ ____________________ _____________________ _____________ ________________ _________
Colle- Some
Cons- ge Gr- Colle- $75K Less
Hisp- Black Repub- Democ- Indep- Libe- Mode- erva- 3rd ad And ge Or Urb- Subu- Or Than
Total Male Female 18-34 35-49 50-64 65+ White anic /AA Other lican rat endent ral rate tive Clinton Trump Party Higher Less an rban Rural More $75K
______ _____ _______ _____ _____ _____ ____ _____ _____ _____ _____ ______ ______ ______ ______ ______ ______ ________ ______ _____ ______ ______ ____ _____ _____ ____ ____
Unweighted Base 1407 675 732 416 359 364 268 1049 104 173 25 437 526 382 437 549 421 537 505 113 543 864 388 719 300 548 846
Weighted Base 1407 687 720 383 345 382 297 938 208 169 26 450 521 408 385 593 429 547 532 108 481 926 395 742 270 679 704
Ever Heard Of (Net) 1163 591 572 320 269 324 249 802 156 130 19 394 433 319 330 457 377 457 463 95 426 737 323 615 225 591 555
83% 86% 79% 84% 78% 85% 84% 85% 75% 77% 74% 88% 83% 78% 86% 77% 88% 84% 87% 88% 89% 80% 82% 83% 83% 87% 79%
Very Favorable/ Favorable 820 412 408 211 183 231 195 591 101 81 13 333 269 210 194 313 313 279 383 61 302 518 222 430 168 423 384
(Sub-Net) 58% 60% 57% 55% 53% 60% 66% 63% 49% 48% 49% 74% 52% 51% 50% 53% 73% 51% 72% 56% 63% 56% 56% 58% 62% 62% 55%
Very favorable 214 114 100 59 46 60 49 151 30 17 6 98 63 53 43 85 85 61 110 16 79 134 66 116 32 113 99
15% 17% 14% 15% 13% 16% 16% 16% 14% 10% 21% 22% 12% 13% 11% 14% 20% 11% 21% 15% 16% 15% 17% 16% 12% 17% 14%
Favorable 607 298 309 152 137 171 147 440 71 64 7 234 206 157 151 228 228 218 273 45 223 384 156 314 136 310 285
43% 43% 43% 40% 40% 45% 49% 47% 34% 38% 27% 52% 40% 39% 39% 38% 53% 40% 51% 41% 46% 41% 40% 42% 50% 46% 41%
Very Unfavorable/ 342 179 163 109 86 93 54 211 54 49 7 62 164 109 135 143 64 178 81 34 124 218 101 185 57 168 171
Unfavorable (Sub-Net) 24% 26% 23% 28% 25% 24% 18% 22% 26% 29% 25% 14% 31% 27% 35% 24% 15% 33% 15% 32% 26% 24% 26% 25% 21% 25% 24%
Unfavorable 244 129 115 82 56 62 44 158 34 33 5 47 116 76 97 94 53 127 60 24 95 149 70 135 39 123 118
17% 19% 16% 21% 16% 16% 15% 17% 16% 20% 18% 11% 22% 19% 25% 16% 12% 23% 11% 22% 20% 16% 18% 18% 15% 18% 17%
Very unfavorable 98 50 48 27 30 32 10 53 21 16 2 14 47 33 38 49 11 51 21 10 29 70 32 50 17 45 53
7% 7% 7% 7% 9% 8% 3% 6% 10% 10% 7% 3% 9% 8% 10% 8% 3% 9% 4% 9% 6% 8% 8% 7% 6% 7% 7%
Never heard of them 14 8 5 5 6 1 2 6 6 2 - 8 4 1 2 5 6 3 9 * 2 12 3 10 1 6 8
1% 1% 1% 1% 2% * 1% 1% 3% 1% - 2% 1% * 1% 1% 1% 1% 2% * * 1% 1% 1% * 1% 1%
No opinion 230 87 143 58 70 57 46 131 46 37 7 48 83 88 54 131 46 87 60 13 54 177 69 117 45 83 141
16% 13% 20% 15% 20% 15% 15% 14% 22% 22% 26% 11% 16% 22% 14% 22% 11% 16% 11% 12% 11% 19% 17% 16% 17% 12% 20%
Sigma 1407 687 720 383 345 382 297 938 208 169 26 450 521 408 385 593 429 547 532 108 481 926 395 742 270 679 704
100% 100% 100% 100% 100% 100% 100% 100% 100% 100% 100% 100% 100% 100% 100% 100% 100% 100% 100% 100% 100% 100% 100% 100% 100% 100% 100%

Page 183
Fielding Period: November 27 - 28, 2018
HCAPS (Filtered on Registered Voters)
Weighted To The U.S. General Adult Population
30 Nov 2018
Table 161
F1_62 Now we will show you some names and groups. Please indicate if you have a favorable or unfavorable view of that person or group - or if you've never heard of them.
you've never heard of them.
Brett Kavanaugh
Base: All Respondents
Presidential
Election Candidate
Gender Age Ethnicity Political Party Political Ideology Voted For Education Locale Income
_____________ ______________________ _______________________ ____________________ ____________________ _____________________ _____________ ________________ _________
Colle- Some
Cons- ge Gr- Colle- $75K Less
Hisp- Black Repub- Democ- Indep- Libe- Mode- erva- 3rd ad And ge Or Urb- Subu- Or Than
Total Male Female 18-34 35-49 50-64 65+ White anic /AA Other lican rat endent ral rate tive Clinton Trump Party Higher Less an rban Rural More $75K
______ _____ _______ _____ _____ _____ ____ _____ _____ _____ _____ ______ ______ ______ ______ ______ ______ ________ ______ _____ ______ ______ ____ _____ _____ ____ ____
Unweighted Base 1407 675 732 416 359 364 268 1049 104 173 25 437 526 382 437 549 421 537 505 113 543 864 388 719 300 548 846
Weighted Base 1407 687 720 383 345 382 297 938 208 169 26 450 521 408 385 593 429 547 532 108 481 926 395 742 270 679 704
Ever Heard Of (Net) 1113 590 523 286 268 293 266 774 152 126 15 376 417 309 335 420 358 452 444 87 422 691 318 590 205 589 509
79% 86% 73% 75% 78% 77% 89% 82% 73% 75% 58% 83% 80% 76% 87% 71% 83% 83% 84% 81% 88% 75% 80% 80% 76% 87% 72%
Very Favorable/ Favorable 479 270 209 108 120 136 116 396 39 27 3 291 61 124 55 151 273 54 345 38 172 307 119 254 105 239 230
(Sub-Net) 34% 39% 29% 28% 35% 36% 39% 42% 19% 16% 12% 65% 12% 30% 14% 25% 64% 10% 65% 35% 36% 33% 30% 34% 39% 35% 33%
Very favorable 223 128 95 35 63 68 57 187 19 11 3 157 21 45 27 43 153 12 188 10 82 141 45 132 46 124 95
16% 19% 13% 9% 18% 18% 19% 20% 9% 7% 12% 35% 4% 11% 7% 7% 36% 2% 35% 9% 17% 15% 11% 18% 17% 18% 14%
Favorable 256 142 114 73 57 68 58 209 20 16 - 134 41 79 28 107 120 42 157 28 90 166 74 122 60 114 135
18% 21% 16% 19% 16% 18% 20% 22% 10% 10% - 30% 8% 19% 7% 18% 28% 8% 30% 26% 19% 18% 19% 16% 22% 17% 19%
Very Unfavorable/ 634 320 314 178 148 157 150 379 114 99 12 85 356 185 280 269 85 398 99 49 250 384 199 335 100 350 279
Unfavorable (Sub-Net) 45% 47% 44% 46% 43% 41% 50% 40% 55% 58% 47% 19% 68% 45% 73% 45% 20% 73% 19% 46% 52% 41% 50% 45% 37% 52% 40%
Unfavorable 234 120 114 87 45 57 45 132 50 30 5 60 92 79 70 112 51 110 59 20 93 141 83 111 40 109 122
17% 18% 16% 23% 13% 15% 15% 14% 24% 18% 19% 13% 18% 19% 18% 19% 12% 20% 11% 19% 19% 15% 21% 15% 15% 16% 17%
Very unfavorable 400 200 200 91 104 100 105 246 64 69 7 25 264 106 209 157 33 288 40 29 157 242 115 224 60 241 157
28% 29% 28% 24% 30% 26% 35% 26% 31% 41% 27% 6% 51% 26% 54% 26% 8% 53% 8% 27% 33% 26% 29% 30% 22% 35% 22%
Never heard of them 60 22 39 28 12 18 3 30 8 11 7 11 23 20 10 35 16 19 12 7 12 48 17 31 12 16 44
4% 3% 5% 7% 4% 5% 1% 3% 4% 6% 26% 3% 4% 5% 2% 6% 4% 4% 2% 7% 3% 5% 4% 4% 5% 2% 6%
No opinion 234 75 159 69 65 70 29 134 48 32 4 63 80 79 41 138 55 75 76 14 47 187 61 120 53 74 151
17% 11% 22% 18% 19% 18% 10% 14% 23% 19% 16% 14% 15% 19% 11% 23% 13% 14% 14% 13% 10% 20% 15% 16% 19% 11% 21%
Sigma 1407 687 720 383 345 382 297 938 208 169 26 450 521 408 385 593 429 547 532 108 481 926 395 742 270 679 704
100% 100% 100% 100% 100% 100% 100% 100% 100% 100% 100% 100% 100% 100% 100% 100% 100% 100% 100% 100% 100% 100% 100% 100% 100% 100% 100%

Page 184
Fielding Period: November 27 - 28, 2018
HCAPS (Filtered on Registered Voters)
Weighted To The U.S. General Adult Population
30 Nov 2018
Table 162
F1_63 Now we will show you some names and groups. Please indicate if you have a favorable or unfavorable view of that person or group - or if you've never heard of them.
you've never heard of them.
James Mattis
Base: All Respondents
Presidential
Election Candidate
Gender Age Ethnicity Political Party Political Ideology Voted For Education Locale Income
_____________ ______________________ _______________________ ____________________ ____________________ _____________________ _____________ ________________ _________
Colle- Some
Cons- ge Gr- Colle- $75K Less
Hisp- Black Repub- Democ- Indep- Libe- Mode- erva- 3rd ad And ge Or Urb- Subu- Or Than
Total Male Female 18-34 35-49 50-64 65+ White anic /AA Other lican rat endent ral rate tive Clinton Trump Party Higher Less an rban Rural More $75K
______ _____ _______ _____ _____ _____ ____ _____ _____ _____ _____ ______ ______ ______ ______ ______ ______ ________ ______ _____ ______ ______ ____ _____ _____ ____ ____
Unweighted Base 1407 675 732 416 359 364 268 1049 104 173 25 437 526 382 437 549 421 537 505 113 543 864 388 719 300 548 846
Weighted Base 1407 687 720 383 345 382 297 938 208 169 26 450 521 408 385 593 429 547 532 108 481 926 395 742 270 679 704
Ever Heard Of (Net) 717 452 265 213 161 191 152 486 99 81 12 263 253 194 220 261 236 286 303 58 283 434 227 377 113 397 312
51% 66% 37% 56% 46% 50% 51% 52% 48% 48% 45% 58% 49% 48% 57% 44% 55% 52% 57% 54% 59% 47% 57% 51% 42% 58% 44%
Very Favorable/ Favorable 436 273 163 110 101 125 100 323 44 42 6 201 119 115 115 140 182 133 237 30 179 257 134 237 66 257 175
(Sub-Net) 31% 40% 23% 29% 29% 33% 34% 34% 21% 25% 25% 45% 23% 28% 30% 24% 42% 24% 45% 27% 37% 28% 34% 32% 24% 38% 25%
Very favorable 128 79 49 36 33 35 25 104 14 6 * 76 29 23 28 26 74 26 82 10 50 78 36 78 14 82 44
9% 12% 7% 9% 9% 9% 8% 11% 7% 4% 1% 17% 6% 6% 7% 4% 17% 5% 15% 9% 10% 8% 9% 11% 5% 12% 6%
Favorable 308 194 114 74 68 90 75 219 30 36 6 125 90 92 86 114 107 107 155 20 129 178 98 158 52 174 131
22% 28% 16% 19% 20% 24% 25% 23% 14% 21% 24% 28% 17% 23% 22% 19% 25% 20% 29% 19% 27% 19% 25% 21% 19% 26% 19%
Very Unfavorable/ 281 179 102 103 59 66 52 163 55 38 5 62 134 79 105 121 55 153 65 29 104 177 93 140 47 140 138
Unfavorable (Sub-Net) 20% 26% 14% 27% 17% 17% 18% 17% 27% 23% 20% 14% 26% 19% 27% 20% 13% 28% 12% 26% 22% 19% 24% 19% 17% 21% 20%
Unfavorable 194 121 74 72 44 43 36 117 41 21 4 50 86 54 65 92 37 108 43 20 67 128 66 104 25 94 97
14% 18% 10% 19% 13% 11% 12% 12% 20% 13% 14% 11% 17% 13% 17% 16% 9% 20% 8% 18% 14% 14% 17% 14% 9% 14% 14%
Very unfavorable 86 58 28 31 16 23 16 46 14 17 1 13 47 25 41 28 17 45 23 9 37 49 28 36 22 46 40
6% 8% 4% 8% 5% 6% 6% 5% 7% 10% 6% 3% 9% 6% 11% 5% 4% 8% 4% 8% 8% 5% 7% 5% 8% 7% 6%
Never heard of them 258 84 174 80 70 61 47 160 42 36 9 67 109 73 51 127 80 95 68 26 79 179 66 127 66 100 155
18% 12% 24% 21% 20% 16% 16% 17% 20% 21% 34% 15% 21% 18% 13% 21% 19% 17% 13% 24% 16% 19% 17% 17% 24% 15% 22%
No opinion 432 150 281 89 115 129 98 293 67 52 5 120 159 141 115 205 112 166 160 24 119 312 102 238 91 182 237
31% 22% 39% 23% 33% 34% 33% 31% 32% 31% 21% 27% 31% 35% 30% 35% 26% 30% 30% 22% 25% 34% 26% 32% 34% 27% 34%
Sigma 1407 687 720 383 345 382 297 938 208 169 26 450 521 408 385 593 429 547 532 108 481 926 395 742 270 679 704
100% 100% 100% 100% 100% 100% 100% 100% 100% 100% 100% 100% 100% 100% 100% 100% 100% 100% 100% 100% 100% 100% 100% 100% 100% 100% 100%

Page 185
Fielding Period: November 27 - 28, 2018
HCAPS (Filtered on Registered Voters)
Weighted To The U.S. General Adult Population
30 Nov 2018
Table 163
HORSE1 Which of the following candidates are you most likely to vote for in a Democratic primary?
Base: Democrats And Independents
Presidential
Election Candidate
Gender Age Ethnicity Political Party Political Ideology Voted For Education Locale Income
_____________ ______________________ _______________________ ____________________ ____________________ _____________________ _____________ ________________ _________
Colle- Some
Cons- ge Gr- Colle- $75K Less
Hisp- Black Repub- Democ- Indep- Libe- Mode- erva- 3rd ad And ge Or Urb- Subu- Or Than
Total Male Female 18-34 35-49 50-64 65+ White anic /AA Other lican rat endent ral rate tive Clinton Trump Party Higher Less an rban Rural More $75K
______ _____ _______ _____ _____ _____ ____ _____ _____ _____ _____ ______ ______ ______ ______ ______ ______ ________ ______ _____ ______ ______ ____ _____ _____ ____ ____
Unweighted Base 459 219 240 141 112 118 88 321 43 79 4 - 271 188 197 192 70 252 69 38 169 290 139 233 87 162 293
Weighted Base 456 219 237 131 112 117 96 282 81 75 4 - 256 199 173 210 72 253 76 39 132 324 151 240 65 208 240
Hillary Clinton 60 29 31 27 16 15 1 20 16 16 1 - 40 20 17 30 12 41 4 1 10 50 29 24 7 20 40
13% 13% 13% 21% 15% 13% 1% 7% 20% 22% 16% - 16% 10% 10% 15% 17% 16% 5% 3% 7% 15% 19% 10% 11% 9% 17%
Bernie Sanders 68 41 27 38 12 12 7 48 12 7 1 - 41 27 30 26 12 35 12 10 22 47 23 37 9 30 39
15% 19% 12% 29% 11% 10% 7% 17% 15% 9% 28% - 16% 14% 18% 12% 16% 14% 16% 25% 16% 14% 15% 16% 13% 14% 16%
Joe Biden 112 42 71 24 26 32 30 71 16 21 - - 73 39 37 65 10 71 19 9 30 82 39 57 16 59 53
25% 19% 30% 19% 23% 27% 31% 25% 20% 29% - - 28% 20% 21% 31% 14% 28% 25% 23% 23% 25% 26% 24% 25% 28% 22%
Kamala Harris 9 4 6 2 1 4 2 5 1 2 - - 9 1 8 1 - 7 - 1 3 6 3 5 1 3 6
2% 2% 2% 2% 1% 4% 2% 2% 2% 3% - - 3% * 5% 1% - 3% - 2% 2% 2% 2% 2% 2% 1% 3%
Elizabeth Warren 18 9 9 5 7 2 5 11 7 - - - 14 4 15 3 - 15 * * 7 11 7 9 2 8 10
4% 4% 4% 4% 6% 2% 5% 4% 9% - - - 5% 2% 9% 2% - 6% * 1% 6% 3% 5% 4% 3% 4% 4%
Cory Booker 14 7 7 2 4 4 3 7 1 6 - - 12 2 9 4 1 11 1 2 4 10 3 9 2 7 6
3% 3% 3% 2% 4% 4% 3% 2% 1% 8% - - 5% 1% 5% 2% 1% 4% 1% 5% 3% 3% 2% 4% 3% 3% 3%
Beto O'Rourke 41 21 20 12 8 11 11 25 9 8 - - 28 13 34 7 - 36 1 - 17 24 20 19 3 27 14
9% 10% 9% 9% 7% 9% 11% 9% 11% 10% - - 11% 7% 20% 3% - 14% 1% - 13% 8% 13% 8% 5% 13% 6%
Michael Avenatti 5 2 3 2 2 - - 1 4 - - - 2 3 3 2 - - 3 2 3 2 3 1 2 3 2
1% 1% 1% 2% 2% - - * 5% - - - 1% 1% 2% 1% - - 3% 5% 2% * 2% * 2% 1% 1%
Michael Bloomberg 11 10 1 1 - 4 6 11 - - - - 1 10 2 7 1 8 1 1 8 3 2 9 - 8 3
2% 4% 1% 1% - 3% 6% 4% - - - - * 5% 1% 3% 2% 3% 1% 3% 6% 1% 2% 4% - 4% 1%
Other 18 14 4 1 8 3 6 12 - 5 1 - 4 14 2 7 9 3 11 4 5 14 1 12 5 9 7
4% 6% 2% 1% 7% 3% 6% 4% - 7% 26% - 1% 7% 1% 3% 13% 1% 14% 9% 3% 4% 1% 5% 7% 4% 3%
Not sure 66 23 44 13 19 20 14 46 11 6 1 - 30 37 15 41 10 25 11 7 15 51 16 39 11 20 44
15% 10% 18% 10% 17% 17% 15% 16% 14% 9% 30% - 12% 19% 8% 20% 14% 10% 15% 18% 11% 16% 11% 16% 17% 9% 18%
Not planning on voting 32 18 15 2 9 10 12 25 3 2 - - 4 29 1 14 17 1 14 2 8 24 5 19 8 15 14
7% 8% 6% 1% 8% 9% 12% 9% 4% 3% - - 2% 14% 1% 7% 23% * 18% 5% 6% 7% 4% 8% 12% 7% 6%
Sigma 456 219 237 131 112 117 96 282 81 75 4 - 256 199 173 210 72 253 76 39 132 324 151 240 65 208 240
100% 100% 100% 100% 100% 100% 100% 100% 100% 100% 100% - 100% 100% 100% 100% 100% 100% 100% 100% 100% 100% 100% 100% 100% 100% 100%

Page 186
Fielding Period: November 27 - 28, 2018
HCAPS (Filtered on Registered Voters)
Weighted To The U.S. General Adult Population
30 Nov 2018
Table 164
HORSE1A Which of the following candidates are you most likely to vote for in a Democratic primary?
Base: Democrats And Independents
Presidential
Election Candidate
Gender Age Ethnicity Political Party Political Ideology Voted For Education Locale Income
_____________ ______________________ _______________________ ____________________ ____________________ _____________________ _____________ ________________ _________
Colle- Some
Cons- ge Gr- Colle- $75K Less
Hisp- Black Repub- Democ- Indep- Libe- Mode- erva- 3rd ad And ge Or Urb- Subu- Or Than
Total Male Female 18-34 35-49 50-64 65+ White anic /AA Other lican rat endent ral rate tive Clinton Trump Party Higher Less an rban Rural More $75K
______ _____ _______ _____ _____ _____ ____ _____ _____ _____ _____ ______ ______ ______ ______ ______ ______ ________ ______ _____ ______ ______ ____ _____ _____ ____ ____
Unweighted Base 449 197 252 128 114 107 100 298 33 76 15 - 255 194 178 216 55 251 91 35 193 256 136 233 80 173 273
Weighted Base 473 208 265 126 111 122 114 270 71 79 17 - 264 209 168 253 52 263 98 37 195 278 131 258 84 217 252
Bernie Sanders 97 37 61 45 25 22 4 54 24 10 6 - 43 54 30 56 11 46 26 5 24 73 17 51 28 39 58
21% 18% 23% 36% 22% 18% 4% 20% 33% 12% 35% - 16% 26% 18% 22% 21% 18% 26% 14% 13% 26% 13% 20% 34% 18% 23%
Joe Biden 131 56 76 21 31 34 45 74 11 37 4 - 93 39 60 62 9 98 14 8 67 65 47 66 19 61 70
28% 27% 29% 17% 28% 28% 39% 27% 15% 47% 26% - 35% 18% 36% 25% 17% 37% 15% 23% 34% 23% 36% 26% 22% 28% 28%
Kamala Harris 13 5 8 2 4 4 4 7 2 4 * - 10 3 7 6 - 10 2 - 6 7 3 10 * 7 6
3% 2% 3% 1% 3% 3% 3% 2% 3% 5% 2% - 4% 1% 4% 2% - 4% 2% - 3% 2% 2% 4% * 3% 3%
Elizabeth Warren 21 8 14 6 4 7 5 17 2 2 - - 18 3 10 10 2 19 1 1 10 12 3 17 1 11 10
5% 4% 5% 5% 3% 5% 5% 6% 3% 3% - - 7% 1% 6% 4% 3% 7% 1% 3% 5% 4% 2% 7% 1% 5% 4%
Cory Booker 18 8 10 4 2 6 5 7 4 4 - - 15 3 9 9 - 13 - 2 9 8 4 14 - 12 6
4% 4% 4% 3% 2% 5% 4% 3% 6% 6% - - 6% 1% 5% 3% - 5% - 6% 5% 3% 3% 5% - 5% 2%
Beto O'Rourke 35 19 16 16 11 3 6 15 9 8 - - 25 10 19 16 - 20 5 4 14 21 10 18 7 23 11
7% 9% 6% 12% 10% 3% 5% 6% 12% 10% - - 10% 5% 11% 6% - 8% 5% 10% 7% 8% 8% 7% 8% 11% 4%
Michael Avenatti 8 7 2 3 1 1 2 5 - - - - 2 6 4 3 1 2 5 - 5 4 * 8 * 4 4
2% 3% 1% 3% 1% 1% 2% 2% - - - - 1% 3% 2% 1% 3% 1% 5% - 2% 1% * 3% * 2% 2%
Michael Bloomberg 21 13 8 3 5 6 7 14 1 * - - 7 14 6 12 3 11 6 2 15 5 8 11 2 12 8
4% 6% 3% 2% 4% 5% 6% 5% 1% 1% - - 3% 6% 3% 5% 5% 4% 6% 6% 8% 2% 6% 4% 3% 6% 3%
Other 8 7 1 4 2 2 - 2 2 1 1 - * 8 * 6 2 2 4 2 6 2 2 5 1 5 3
2% 3% 1% 3% 2% 1% - 1% 3% 2% 4% - * 4% * 2% 4% 1% 4% 7% 3% 1% 2% 2% 1% 2% 1%
Not sure 87 33 54 16 24 24 23 54 8 10 6 - 43 44 20 53 14 41 15 11 32 55 30 36 20 32 51
18% 16% 20% 13% 21% 20% 20% 20% 11% 12% 32% - 16% 21% 12% 21% 26% 16% 15% 30% 16% 20% 23% 14% 24% 15% 20%
Not planning on voting 33 17 16 5 2 13 13 21 8 3 - - 7 26 2 21 10 - 20 - 7 27 6 22 6 12 22
7% 8% 6% 4% 2% 11% 11% 8% 12% 3% - - 3% 13% 1% 8% 20% - 20% - 3% 10% 5% 8% 7% 5% 9%
Sigma 473 208 265 126 111 122 114 270 71 79 17 - 264 209 168 253 52 263 98 37 195 278 131 258 84 217 252
100% 100% 100% 100% 100% 100% 100% 100% 100% 100% 100% - 100% 100% 100% 100% 100% 100% 100% 100% 100% 100% 100% 100% 100% 100% 100%

Page 187
Fielding Period: November 27 - 28, 2018
HCAPS (Filtered on Registered Voters)
Weighted To The U.S. General Adult Population
30 Nov 2018
Table 165
HORSE2 Which of the following candidates are you most likely to vote for in a Republican primary?
Base: Republicans And Independents
Presidential
Election Candidate
Gender Age Ethnicity Political Party Political Ideology Voted For Education Locale Income
_____________ ______________________ _______________________ ____________________ ____________________ _____________________ _____________ ________________ _________
Colle- Some
Cons- ge Gr- Colle- $75K Less
Hisp- Black Repub- Democ- Indep- Libe- Mode- erva- 3rd ad And ge Or Urb- Subu- Or Than
Total Male Female 18-34 35-49 50-64 65+ White anic /AA Other lican rat endent ral rate tive Clinton Trump Party Higher Less an rban Rural More $75K
______ _____ _______ _____ _____ _____ ____ _____ _____ _____ _____ ______ ______ ______ ______ ______ ______ ________ ______ _____ ______ ______ ____ _____ _____ ____ ____
Unweighted Base 819 437 382 248 210 210 151 682 48 49 10 437 - 382 130 319 370 129 460 78 321 498 193 429 197 330 477
Weighted Base 858 472 387 235 222 234 167 653 104 54 10 450 - 408 103 377 378 146 495 77 299 560 222 455 182 426 410
Donald Trump 379 223 156 90 92 115 82 319 27 17 5 272 - 106 28 107 244 5 334 7 122 256 83 204 92 198 169
44% 47% 40% 38% 42% 49% 49% 49% 26% 31% 57% 60% - 26% 27% 28% 64% 3% 67% 9% 41% 46% 37% 45% 51% 47% 41%
Mitt Romney 54 21 33 19 16 12 7 38 10 3 1 32 - 23 10 22 23 13 23 13 21 33 13 29 12 28 26
6% 5% 9% 8% 7% 5% 4% 6% 9% 6% 11% 7% - 6% 9% 6% 6% 9% 5% 17% 7% 6% 6% 6% 6% 7% 6%
Ted Cruz 44 21 22 18 22 2 2 21 17 3 1 19 - 24 9 21 14 16 15 3 7 36 14 21 8 14 29
5% 5% 6% 7% 10% 1% 1% 3% 16% 5% 12% 4% - 6% 9% 5% 4% 11% 3% 3% 2% 6% 6% 5% 4% 3% 7%
Paul Ryan 45 23 22 14 8 14 8 35 1 3 - 24 - 20 1 27 17 8 28 3 23 22 13 23 9 20 22
5% 5% 6% 6% 4% 6% 5% 5% 1% 5% - 5% - 5% 1% 7% 4% 5% 6% 4% 8% 4% 6% 5% 5% 5% 5%
Jeff Flake 18 13 6 7 6 4 1 9 8 1 - 7 - 11 2 10 6 3 7 3 7 12 6 12 1 11 7
2% 3% 1% 3% 3% 2% * 1% 8% 2% - 2% - 3% 2% 3% 2% 2% 1% 4% 2% 2% 3% 3% * 3% 2%
Nikki Haley 19 15 5 6 1 8 4 14 5 - - 13 - 6 1 10 8 6 8 3 8 12 8 7 3 10 10
2% 3% 1% 3% 1% 3% 2% 2% 5% - - 3% - 2% 1% 3% 2% 4% 2% 3% 3% 2% 4% 2% 2% 2% 2%
John Kasich 56 38 18 8 13 13 22 51 - 2 - 17 - 38 9 33 14 26 17 10 36 20 11 38 7 35 19
6% 8% 5% 3% 6% 6% 13% 8% - 5% - 4% - 9% 9% 9% 4% 17% 4% 13% 12% 4% 5% 8% 4% 8% 5%
Ben Sasse 5 3 1 2 1 1 1 4 - * - 3 - 2 2 1 2 1 1 2 1 3 1 3 - 2 2
1% 1% * 1% * * 1% 1% - * - 1% - * 2% * * 1% * 2% * 1% 1% 1% - 1% 1%
Jeb Bush 24 13 11 13 2 4 5 17 5 1 - 14 - 9 2 17 5 5 7 7 15 9 9 9 5 12 11
3% 3% 3% 5% 1% 2% 3% 3% 5% 1% - 3% - 2% 2% 4% 1% 3% 1% 9% 5% 2% 4% 2% 3% 3% 3%
Other 13 6 7 2 4 4 3 13 - - - 4 - 9 4 6 3 8 2 1 5 8 3 8 2 10 3
2% 1% 2% 1% 2% 2% 2% 2% - - - 1% - 2% 4% 2% 1% 6% * 1% 2% 1% 1% 2% 1% 2% 1%
Not sure 141 65 76 33 45 42 22 92 19 16 2 38 - 103 18 89 34 34 43 22 40 101 40 65 35 65 70
16% 14% 20% 14% 20% 18% 13% 14% 18% 31% 20% 9% - 25% 17% 24% 9% 23% 9% 29% 13% 18% 18% 14% 19% 15% 17%
Not planning on voting 61 32 30 25 12 14 10 39 13 7 - 5 - 56 18 35 9 22 8 4 14 48 20 33 8 20 40
7% 7% 8% 11% 5% 6% 6% 6% 12% 13% - 1% - 14% 17% 9% 2% 15% 2% 5% 5% 8% 9% 7% 5% 5% 10%
Sigma 858 472 387 235 222 234 167 653 104 54 10 450 - 408 103 377 378 146 495 77 299 560 222 455 182 426 410
100% 100% 100% 100% 100% 100% 100% 100% 100% 100% 100% 100% - 100% 100% 100% 100% 100% 100% 100% 100% 100% 100% 100% 100% 100% 100%

Page 188
Fielding Period: November 27 - 28, 2018
HCAPS (Filtered on Registered Voters)
Weighted To The U.S. General Adult Population
30 Nov 2018
Table 166
HORSE3 Do you think Hillary Clinton will run again for President of the United States?
Base: All Respondents
Presidential
Election Candidate
Gender Age Ethnicity Political Party Political Ideology Voted For Education Locale Income
_____________ ______________________ _______________________ ____________________ ____________________ _____________________ _____________ ________________ _________
Colle- Some
Cons- ge Gr- Colle- $75K Less
Hisp- Black Repub- Democ- Indep- Libe- Mode- erva- 3rd ad And ge Or Urb- Subu- Or Than
Total Male Female 18-34 35-49 50-64 65+ White anic /AA Other lican rat endent ral rate tive Clinton Trump Party Higher Less an rban Rural More $75K
______ _____ _______ _____ _____ _____ ____ _____ _____ _____ _____ ______ ______ ______ ______ ______ ______ ________ ______ _____ ______ ______ ____ _____ _____ ____ ____
Unweighted Base 1407 675 732 416 359 364 268 1049 104 173 25 437 526 382 437 549 421 537 505 113 543 864 388 719 300 548 846
Weighted Base 1407 687 720 383 345 382 297 938 208 169 26 450 521 408 385 593 429 547 532 108 481 926 395 742 270 679 704
Yes 537 254 284 202 146 136 53 339 105 64 4 181 172 175 136 247 154 191 217 37 149 388 187 252 98 235 295
38% 37% 39% 53% 42% 36% 18% 36% 50% 38% 14% 40% 33% 43% 35% 42% 36% 35% 41% 34% 31% 42% 47% 34% 36% 35% 42%
No 870 433 437 181 200 246 244 600 103 104 22 269 349 233 250 346 275 356 314 71 333 537 208 489 172 444 409
62% 63% 61% 47% 58% 64% 82% 64% 50% 62% 86% 60% 67% 57% 65% 58% 64% 65% 59% 66% 69% 58% 53% 66% 64% 65% 58%
Sigma 1407 687 720 383 345 382 297 938 208 169 26 450 521 408 385 593 429 547 532 108 481 926 395 742 270 679 704
100% 100% 100% 100% 100% 100% 100% 100% 100% 100% 100% 100% 100% 100% 100% 100% 100% 100% 100% 100% 100% 100% 100% 100% 100% 100% 100%

Page 189
Fielding Period: November 27 - 28, 2018
HCAPS (Filtered on Registered Voters)
Weighted To The U.S. General Adult Population
30 Nov 2018
Table 167
I1 What would you say are the most important issues facing the country today? Please select three.
Base: All Respondents
Presidential
Election Candidate
Gender Age Ethnicity Political Party Political Ideology Voted For Education Locale Income
_____________ ______________________ _______________________ ____________________ ____________________ _____________________ _____________ ________________ _________
Colle- Some
Cons- ge Gr- Colle- $75K Less
Hisp- Black Repub- Democ- Indep- Libe- Mode- erva- 3rd ad And ge Or Urb- Subu- Or Than
Total Male Female 18-34 35-49 50-64 65+ White anic /AA Other lican rat endent ral rate tive Clinton Trump Party Higher Less an rban Rural More $75K
______ _____ _______ _____ _____ _____ ____ _____ _____ _____ _____ ______ ______ ______ ______ ______ ______ ________ ______ _____ ______ ______ ____ _____ _____ ____ ____
Unweighted Base 1407 675 732 416 359 364 268 1049 104 173 25 437 526 382 437 549 421 537 505 113 543 864 388 719 300 548 846
Weighted Base 1407 687 720 383 345 382 297 938 208 169 26 450 521 408 385 593 429 547 532 108 481 926 395 742 270 679 704
Health care 521 244 277 112 119 156 134 376 52 69 6 145 230 140 153 239 129 231 163 42 177 344 134 272 116 242 266
37% 36% 38% 29% 34% 41% 45% 40% 25% 41% 23% 32% 44% 34% 40% 40% 30% 42% 31% 38% 37% 37% 34% 37% 43% 36% 38%
Immigration 490 247 243 100 124 134 131 346 82 32 8 235 124 127 79 165 245 116 292 23 153 337 121 269 100 238 236
35% 36% 34% 26% 36% 35% 44% 37% 39% 19% 32% 52% 24% 31% 21% 28% 57% 21% 55% 21% 32% 36% 31% 36% 37% 35% 33%
Economy and jobs 360 186 174 97 99 98 66 230 63 41 6 129 124 98 96 151 114 130 135 23 121 240 97 209 55 179 181
26% 27% 24% 25% 29% 26% 22% 25% 30% 24% 24% 29% 24% 24% 25% 25% 27% 24% 25% 21% 25% 26% 24% 28% 20% 26% 26%
Guns 345 162 183 111 74 94 67 213 56 58 7 53 186 99 128 166 51 209 69 18 129 216 97 197 51 169 177
25% 24% 25% 29% 21% 25% 23% 23% 27% 35% 28% 12% 36% 24% 33% 28% 12% 38% 13% 16% 27% 23% 25% 27% 19% 25% 25%
National debt / federal 308 155 152 58 56 106 87 216 51 26 7 111 83 108 49 143 116 98 140 35 109 199 85 167 56 170 132
budget deficits 22% 23% 21% 15% 16% 28% 29% 23% 24% 15% 28% 25% 16% 27% 13% 24% 27% 18% 26% 33% 23% 21% 21% 22% 21% 25% 19%
Terrorism / national 292 136 156 63 60 90 79 231 25 24 2 129 71 87 35 127 130 67 162 21 97 195 88 140 63 133 151
security 21% 20% 22% 16% 17% 24% 26% 25% 12% 14% 9% 29% 14% 21% 9% 21% 30% 12% 30% 19% 20% 21% 22% 19% 23% 20% 21%
Environment / climate change 264 129 134 73 61 73 57 175 47 16 7 31 151 78 142 93 29 174 42 11 120 144 72 151 41 151 109
19% 19% 19% 19% 18% 19% 19% 19% 22% 10% 29% 7% 29% 19% 37% 16% 7% 32% 8% 10% 25% 16% 18% 20% 15% 22% 16%
Crime and drugs 191 70 121 66 45 46 34 132 19 30 5 60 69 59 43 90 58 61 73 16 45 146 62 92 37 69 120
14% 10% 17% 17% 13% 12% 11% 14% 9% 18% 19% 13% 13% 14% 11% 15% 13% 11% 14% 15% 9% 16% 16% 12% 14% 10% 17%
Taxes 164 93 71 45 51 52 16 105 28 12 2 75 41 44 37 70 57 40 71 24 47 117 41 84 39 80 75
12% 14% 10% 12% 15% 14% 6% 11% 13% 7% 8% 17% 8% 11% 10% 12% 13% 7% 13% 22% 10% 13% 10% 11% 14% 12% 11%
Race relations 163 68 96 47 40 38 38 79 19 53 3 41 77 41 63 66 34 92 40 5 44 120 57 73 33 79 84
12% 10% 13% 12% 12% 10% 13% 8% 9% 32% 13% 9% 15% 10% 16% 11% 8% 17% 7% 5% 9% 13% 14% 10% 12% 12% 12%
Corruption 163 88 75 51 43 39 30 126 11 21 2 54 52 52 43 61 58 54 70 11 50 113 34 89 41 78 84
12% 13% 10% 13% 12% 10% 10% 13% 5% 12% 8% 12% 10% 13% 11% 10% 14% 10% 13% 11% 10% 12% 8% 12% 15% 11% 12%
School safety 147 59 88 66 40 25 16 84 22 21 3 38 57 47 42 73 32 52 42 11 38 108 45 77 24 61 86
10% 9% 12% 17% 12% 7% 5% 9% 11% 13% 13% 8% 11% 12% 11% 12% 7% 9% 8% 11% 8% 12% 11% 10% 9% 9% 12%
Education 134 70 64 62 29 23 21 85 19 23 * 38 55 38 41 64 29 51 45 18 68 67 48 65 21 69 65
10% 10% 9% 16% 9% 6% 7% 9% 9% 13% 1% 9% 11% 9% 11% 11% 7% 9% 8% 16% 14% 7% 12% 9% 8% 10% 9%
Income inequality 114 66 48 37 34 26 17 64 19 20 7 13 57 39 61 39 14 69 17 10 47 68 35 61 19 57 57
8% 10% 7% 10% 10% 7% 6% 7% 9% 12% 27% 3% 11% 10% 16% 7% 3% 13% 3% 10% 10% 7% 9% 8% 7% 8% 8%

Page 190
Fielding Period: November 27 - 28, 2018
HCAPS (Filtered on Registered Voters)
Weighted To The U.S. General Adult Population
30 Nov 2018
Table 167
I1 What would you say are the most important issues facing the country today? Please select three.
Base: All Respondents
Presidential
Election Candidate
Gender Age Ethnicity Political Party Political Ideology Voted For Education Locale Income
_____________ ______________________ _______________________ ____________________ ____________________ _____________________ _____________ ________________ _________
Colle- Some
Cons- ge Gr- Colle- $75K Less
Hisp- Black Repub- Democ- Indep- Libe- Mode- erva- 3rd ad And ge Or Urb- Subu- Or Than
Total Male Female 18-34 35-49 50-64 65+ White anic /AA Other lican rat endent ral rate tive Clinton Trump Party Higher Less an rban Rural More $75K
______ _____ _______ _____ _____ _____ ____ _____ _____ _____ _____ ______ ______ ______ ______ ______ ______ ________ ______ _____ ______ ______ ____ _____ _____ ____ ____
Weighted Base 1407 687 720 383 345 382 297 938 208 169 26 450 521 408 385 593 429 547 532 108 481 926 395 742 270 679 704
Foreign policy 110 70 41 23 26 39 22 74 15 11 2 41 25 43 24 46 41 34 58 11 46 65 31 56 23 58 45
8% 10% 6% 6% 8% 10% 7% 8% 7% 7% 8% 9% 5% 10% 6% 8% 9% 6% 11% 10% 9% 7% 8% 8% 9% 9% 6%
Cybersecurity 95 64 32 27 22 24 23 70 14 5 * 36 30 29 27 44 24 35 43 5 40 56 29 53 13 52 43
7% 9% 4% 7% 6% 6% 8% 7% 7% 3% 2% 8% 6% 7% 7% 7% 6% 6% 8% 4% 8% 6% 7% 7% 5% 8% 6%
Criminal justice (policing, 92 40 51 39 25 13 14 44 24 18 1 28 37 26 28 41 23 37 26 11 29 63 31 42 19 34 55
courts, prisons) 7% 6% 7% 10% 7% 3% 5% 5% 12% 11% 5% 6% 7% 6% 7% 7% 5% 7% 5% 10% 6% 7% 8% 6% 7% 5% 8%
Defense 90 46 44 22 37 21 10 62 17 4 1 45 21 24 10 34 46 24 51 8 25 65 22 46 21 45 44
6% 7% 6% 6% 11% 6% 3% 7% 8% 2% 2% 10% 4% 6% 2% 6% 11% 4% 10% 7% 5% 7% 6% 6% 8% 7% 6%
Political correctness 81 40 41 9 26 26 20 59 13 5 1 38 17 25 15 23 44 15 47 10 27 54 23 43 15 45 36
6% 6% 6% 2% 7% 7% 7% 6% 6% 3% 2% 8% 3% 6% 4% 4% 10% 3% 9% 9% 6% 6% 6% 6% 5% 7% 5%
Women's rights 77 17 59 38 18 13 8 34 24 14 3 6 50 15 37 33 7 45 6 9 26 51 28 30 20 25 51
5% 3% 8% 10% 5% 3% 3% 4% 12% 8% 10% 1% 10% 4% 10% 5% 2% 8% 1% 8% 5% 6% 7% 4% 7% 4% 7%
Other 19 9 11 4 6 8 1 10 5 2 2 5 6 6 5 10 5 7 6 4 7 12 8 9 2 4 14
1% 1% 1% 1% 2% 2% 1% 1% 2% 1% 7% 1% 1% 1% 1% 2% 1% 1% 1% 4% 1% 1% 2% 1% 1% 1% 2%
Sigma 4221 2060 2161 1148 1036 1145 892 2815 625 506 77 1351 1562 1224 1156 1779 1286 1642 1595 325 1444 2777 1186 2225 810 2038 2113
300% 300% 300% 300% 300% 300% 300% 300% 300% 300% 300% 300% 300% 300% 300% 300% 300% 300% 300% 300% 300% 300% 300% 300% 300% 300% 300%

Page 191
Fielding Period: November 27 - 28, 2018
HCAPS (Filtered on Registered Voters)
Weighted To The U.S. General Adult Population
30 Nov 2018
Table 168
BUDGET1101 Do you support or oppose Congress and the President threatening to stop funding to the federal government and partially shutting it down as a way of forcing through their policies in
a government spending bill?
Base: All Respondents
Presidential
Election Candidate
Gender Age Ethnicity Political Party Political Ideology Voted For Education Locale Income
_____________ ______________________ _______________________ ____________________ ____________________ _____________________ _____________ ________________ _________
Colle- Some
Cons- ge Gr- Colle- $75K Less
Hisp- Black Repub- Democ- Indep- Libe- Mode- erva- 3rd ad And ge Or Urb- Subu- Or Than
Total Male Female 18-34 35-49 50-64 65+ White anic /AA Other lican rat endent ral rate tive Clinton Trump Party Higher Less an rban Rural More $75K
______ _____ _______ _____ _____ _____ ____ _____ _____ _____ _____ ______ ______ ______ ______ ______ ______ ________ ______ _____ ______ ______ ____ _____ _____ ____ ____
Unweighted Base 1407 675 732 416 359 364 268 1049 104 173 25 437 526 382 437 549 421 537 505 113 543 864 388 719 300 548 846
Weighted Base 1407 687 720 383 345 382 297 938 208 169 26 450 521 408 385 593 429 547 532 108 481 926 395 742 270 679 704
Support 539 284 255 162 140 144 92 397 71 38 9 293 97 144 92 188 259 88 351 31 175 364 147 274 118 261 265
38% 41% 35% 42% 41% 38% 31% 42% 34% 23% 35% 65% 19% 35% 24% 32% 60% 16% 66% 28% 36% 39% 37% 37% 44% 38% 38%
Oppose 868 403 465 221 205 237 205 541 138 131 17 158 423 264 293 405 169 459 181 78 306 562 248 468 152 418 440
62% 59% 65% 58% 59% 62% 69% 58% 66% 77% 65% 35% 81% 65% 76% 68% 40% 84% 34% 72% 64% 61% 63% 63% 56% 62% 62%
Sigma 1407 687 720 383 345 382 297 938 208 169 26 450 521 408 385 593 429 547 532 108 481 926 395 742 270 679 704
100% 100% 100% 100% 100% 100% 100% 100% 100% 100% 100% 100% 100% 100% 100% 100% 100% 100% 100% 100% 100% 100% 100% 100% 100% 100% 100%

Page 192
Fielding Period: November 27 - 28, 2018
HCAPS (Filtered on Registered Voters)
Weighted To The U.S. General Adult Population
30 Nov 2018
Table 169
BUDGET1102 Should Congressional Democrats approve funding for a border wall to avoid a partial government shutdown on December 7th?
Base: All Respondents
Presidential
Election Candidate
Gender Age Ethnicity Political Party Political Ideology Voted For Education Locale Income
_____________ ______________________ _______________________ ____________________ ____________________ _____________________ _____________ ________________ _________
Colle- Some
Cons- ge Gr- Colle- $75K Less
Hisp- Black Repub- Democ- Indep- Libe- Mode- erva- 3rd ad And ge Or Urb- Subu- Or Than
Total Male Female 18-34 35-49 50-64 65+ White anic /AA Other lican rat endent ral rate tive Clinton Trump Party Higher Less an rban Rural More $75K
______ _____ _______ _____ _____ _____ ____ _____ _____ _____ _____ ______ ______ ______ ______ ______ ______ ________ ______ _____ ______ ______ ____ _____ _____ ____ ____
Unweighted Base 1407 675 732 416 359 364 268 1049 104 173 25 437 526 382 437 549 421 537 505 113 543 864 388 719 300 548 846
Weighted Base 1407 687 720 383 345 382 297 938 208 169 26 450 521 408 385 593 429 547 532 108 481 926 395 742 270 679 704
Yes 667 344 323 157 183 187 139 505 66 57 14 355 110 193 80 255 332 103 447 39 204 463 166 349 151 307 344
47% 50% 45% 41% 53% 49% 47% 54% 32% 34% 52% 79% 21% 47% 21% 43% 78% 19% 84% 36% 42% 50% 42% 47% 56% 45% 49%
No 740 343 397 226 162 194 158 434 142 112 12 95 411 215 306 338 96 444 85 69 277 463 229 392 119 372 360
53% 50% 55% 59% 47% 51% 53% 46% 68% 66% 48% 21% 79% 53% 79% 57% 22% 81% 16% 64% 58% 50% 58% 53% 44% 55% 51%
Sigma 1407 687 720 383 345 382 297 938 208 169 26 450 521 408 385 593 429 547 532 108 481 926 395 742 270 679 704
100% 100% 100% 100% 100% 100% 100% 100% 100% 100% 100% 100% 100% 100% 100% 100% 100% 100% 100% 100% 100% 100% 100% 100% 100% 100% 100%

Page 193
Fielding Period: November 27 - 28, 2018
HCAPS (Filtered on Registered Voters)
Weighted To The U.S. General Adult Population
30 Nov 2018
Table 170
BUDGET1103 Should the President approve a measure that would protect the Special Counsel from being removed by a new Attorney General in order to avoid
a partial government shutdown on December 7th?
Base: All Respondents
Presidential
Election Candidate
Gender Age Ethnicity Political Party Political Ideology Voted For Education Locale Income
_____________ ______________________ _______________________ ____________________ ____________________ _____________________ _____________ ________________ _________
Colle- Some
Cons- ge Gr- Colle- $75K Less
Hisp- Black Repub- Democ- Indep- Libe- Mode- erva- 3rd ad And ge Or Urb- Subu- Or Than
Total Male Female 18-34 35-49 50-64 65+ White anic /AA Other lican rat endent ral rate tive Clinton Trump Party Higher Less an rban Rural More $75K
______ _____ _______ _____ _____ _____ ____ _____ _____ _____ _____ ______ ______ ______ ______ ______ ______ ________ ______ _____ ______ ______ ____ _____ _____ ____ ____
Unweighted Base 1407 675 732 416 359 364 268 1049 104 173 25 437 526 382 437 549 421 537 505 113 543 864 388 719 300 548 846
Weighted Base 1407 687 720 383 345 382 297 938 208 169 26 450 521 408 385 593 429 547 532 108 481 926 395 742 270 679 704
Yes 864 407 457 215 199 246 204 588 121 108 11 259 347 250 265 364 235 365 319 68 303 562 260 451 153 422 426
61% 59% 63% 56% 58% 65% 69% 63% 58% 64% 41% 58% 67% 61% 69% 61% 55% 67% 60% 63% 63% 61% 66% 61% 57% 62% 60%
No 543 280 263 168 146 135 93 351 87 60 15 191 174 158 120 229 194 182 212 40 179 364 135 291 117 258 279
39% 41% 37% 44% 42% 35% 31% 37% 42% 36% 59% 42% 33% 39% 31% 39% 45% 33% 40% 37% 37% 39% 34% 39% 43% 38% 40%
Sigma 1407 687 720 383 345 382 297 938 208 169 26 450 521 408 385 593 429 547 532 108 481 926 395 742 270 679 704
100% 100% 100% 100% 100% 100% 100% 100% 100% 100% 100% 100% 100% 100% 100% 100% 100% 100% 100% 100% 100% 100% 100% 100% 100% 100% 100%

Page 194
Fielding Period: November 27 - 28, 2018
HCAPS (Filtered on Registered Voters)
Weighted To The U.S. General Adult Population
30 Nov 2018
Table 171
BUDGET1104 Congress has to pass a bill by December 7th to fund the government or the government will shut down. Many agencies, including high profile entities like the Department of Homeland
Security, will shutdown until this issue has resolved. Donald Trump has threatened to veto any bill that does not include funding for a border wall. Democrats have indicated that they will
add a measure protecting Special Counsel Robert Mueller's investigation to the spending bill and do not support funding for a border wall.
Should Congress and the President work to compromise to avoid a government shutdown or should they stick to their principles even if it means shutting down the government?
Base: All Respondents
Presidential
Election Candidate
Gender Age Ethnicity Political Party Political Ideology Voted For Education Locale Income
_____________ ______________________ _______________________ ____________________ ____________________ _____________________ _____________ ________________ _________
Colle- Some
Cons- ge Gr- Colle- $75K Less
Hisp- Black Repub- Democ- Indep- Libe- Mode- erva- 3rd ad And ge Or Urb- Subu- Or Than
Total Male Female 18-34 35-49 50-64 65+ White anic /AA Other lican rat endent ral rate tive Clinton Trump Party Higher Less an rban Rural More $75K
______ _____ _______ _____ _____ _____ ____ _____ _____ _____ _____ ______ ______ ______ ______ ______ ______ ________ ______ _____ ______ ______ ____ _____ _____ ____ ____
Unweighted Base 1407 675 732 416 359 364 268 1049 104 173 25 437 526 382 437 549 421 537 505 113 543 864 388 719 300 548 846
Weighted Base 1407 687 720 383 345 382 297 938 208 169 26 450 521 408 385 593 429 547 532 108 481 926 395 742 270 679 704
Compromise 977 462 515 264 225 255 233 670 121 130 16 303 367 292 262 439 276 380 380 81 370 607 266 533 178 483 484
69% 67% 71% 69% 65% 67% 78% 71% 58% 77% 63% 67% 71% 72% 68% 74% 64% 69% 71% 75% 77% 66% 67% 72% 66% 71% 69%
Stick to their principles 430 225 205 119 120 127 64 268 87 38 10 147 153 116 123 154 153 167 152 27 111 319 129 209 92 196 220
31% 33% 29% 31% 35% 33% 22% 29% 42% 23% 37% 33% 29% 28% 32% 26% 36% 31% 29% 25% 23% 34% 33% 28% 34% 29% 31%
Sigma 1407 687 720 383 345 382 297 938 208 169 26 450 521 408 385 593 429 547 532 108 481 926 395 742 270 679 704
100% 100% 100% 100% 100% 100% 100% 100% 100% 100% 100% 100% 100% 100% 100% 100% 100% 100% 100% 100% 100% 100% 100% 100% 100% 100% 100%

Page 195
Fielding Period: November 27 - 28, 2018
HCAPS (Filtered on Registered Voters)
Weighted To The U.S. General Adult Population
30 Nov 2018
Table 172
FED1001 Is the U.S. Federal Reserve Bank raising interest rates too quickly, too slowly or about right?
Base: All Respondents
Presidential
Election Candidate
Gender Age Ethnicity Political Party Political Ideology Voted For Education Locale Income
_____________ ______________________ _______________________ ____________________ ____________________ _____________________ _____________ ________________ _________
Colle- Some
Cons- ge Gr- Colle- $75K Less
Hisp- Black Repub- Democ- Indep- Libe- Mode- erva- 3rd ad And ge Or Urb- Subu- Or Than
Total Male Female 18-34 35-49 50-64 65+ White anic /AA Other lican rat endent ral rate tive Clinton Trump Party Higher Less an rban Rural More $75K
______ _____ _______ _____ _____ _____ ____ _____ _____ _____ _____ ______ ______ ______ ______ ______ ______ ________ ______ _____ ______ ______ ____ _____ _____ ____ ____
Unweighted Base 1407 675 732 416 359 364 268 1049 104 173 25 437 526 382 437 549 421 537 505 113 543 864 388 719 300 548 846
Weighted Base 1407 687 720 383 345 382 297 938 208 169 26 450 521 408 385 593 429 547 532 108 481 926 395 742 270 679 704
Too quickly 541 267 274 135 140 167 100 357 78 72 13 176 180 179 133 216 192 204 214 38 182 359 161 271 108 262 274
38% 39% 38% 35% 40% 44% 34% 38% 37% 43% 49% 39% 35% 44% 35% 36% 45% 37% 40% 35% 38% 39% 41% 37% 40% 39% 39%
Too slowly 222 94 129 91 67 42 22 128 51 26 2 74 82 57 70 97 55 74 79 25 65 157 65 112 45 89 128
16% 14% 18% 24% 19% 11% 8% 14% 24% 15% 9% 16% 16% 14% 18% 16% 13% 14% 15% 23% 14% 17% 16% 15% 17% 13% 18%
About right 644 326 317 157 139 173 175 453 80 71 11 200 259 172 182 279 182 269 238 45 234 410 169 358 116 329 302
46% 48% 44% 41% 40% 45% 59% 48% 39% 42% 42% 44% 50% 42% 47% 47% 43% 49% 45% 42% 49% 44% 43% 48% 43% 48% 43%
Sigma 1407 687 720 383 345 382 297 938 208 169 26 450 521 408 385 593 429 547 532 108 481 926 395 742 270 679 704
100% 100% 100% 100% 100% 100% 100% 100% 100% 100% 100% 100% 100% 100% 100% 100% 100% 100% 100% 100% 100% 100% 100% 100% 100% 100% 100%

Page 196
Fielding Period: November 27 - 28, 2018
HCAPS (Filtered on Registered Voters)
Weighted To The U.S. General Adult Population
30 Nov 2018
Table 173
QFED1002 Do you trust the U.S. Federal Reserve Bank to raise interest rates responsibly or do you think they are moving too fast?
Base: All Respondents
Presidential
Election Candidate
Gender Age Ethnicity Political Party Political Ideology Voted For Education Locale Income
_____________ ______________________ _______________________ ____________________ ____________________ _____________________ _____________ ________________ _________
Colle- Some
Cons- ge Gr- Colle- $75K Less
Hisp- Black Repub- Democ- Indep- Libe- Mode- erva- 3rd ad And ge Or Urb- Subu- Or Than
Total Male Female 18-34 35-49 50-64 65+ White anic /AA Other lican rat endent ral rate tive Clinton Trump Party Higher Less an rban Rural More $75K
______ _____ _______ _____ _____ _____ ____ _____ _____ _____ _____ ______ ______ ______ ______ ______ ______ ________ ______ _____ ______ ______ ____ _____ _____ ____ ____
Unweighted Base 1407 675 732 416 359 364 268 1049 104 173 25 437 526 382 437 549 421 537 505 113 543 864 388 719 300 548 846
Weighted Base 1407 687 720 383 345 382 297 938 208 169 26 450 521 408 385 593 429 547 532 108 481 926 395 742 270 679 704
Trust to raise rates 756 396 360 202 175 198 180 521 110 80 10 257 297 191 239 307 210 306 295 58 290 466 218 406 131 397 346
responsibly 54% 58% 50% 53% 51% 52% 61% 55% 53% 47% 40% 57% 57% 47% 62% 52% 49% 56% 55% 54% 60% 50% 55% 55% 49% 58% 49%
They are moving too fast 651 291 360 180 170 183 117 418 98 89 16 193 223 217 147 286 219 241 237 50 191 460 177 335 139 283 358
46% 42% 50% 47% 49% 48% 39% 45% 47% 53% 60% 43% 43% 53% 38% 48% 51% 44% 45% 46% 40% 50% 45% 45% 51% 42% 51%
Sigma 1407 687 720 383 345 382 297 938 208 169 26 450 521 408 385 593 429 547 532 108 481 926 395 742 270 679 704
100% 100% 100% 100% 100% 100% 100% 100% 100% 100% 100% 100% 100% 100% 100% 100% 100% 100% 100% 100% 100% 100% 100% 100% 100% 100% 100%

Page 197
Fielding Period: November 27 - 28, 2018
HCAPS (Filtered on Registered Voters)
Weighted To The U.S. General Adult Population
30 Nov 2018
Table 174
QFED1003 Do you think if the U.S. Federal Reserve Bank raises interest rates too quickly it could create an economic recession or is that not likely?
Base: All Respondents
Presidential
Election Candidate
Gender Age Ethnicity Political Party Political Ideology Voted For Education Locale Income
_____________ ______________________ _______________________ ____________________ ____________________ _____________________ _____________ ________________ _________
Colle- Some
Cons- ge Gr- Colle- $75K Less
Hisp- Black Repub- Democ- Indep- Libe- Mode- erva- 3rd ad And ge Or Urb- Subu- Or Than
Total Male Female 18-34 35-49 50-64 65+ White anic /AA Other lican rat endent ral rate tive Clinton Trump Party Higher Less an rban Rural More $75K
______ _____ _______ _____ _____ _____ ____ _____ _____ _____ _____ ______ ______ ______ ______ ______ ______ ________ ______ _____ ______ ______ ____ _____ _____ ____ ____
Unweighted Base 1407 675 732 416 359 364 268 1049 104 173 25 437 526 382 437 549 421 537 505 113 543 864 388 719 300 548 846
Weighted Base 1407 687 720 383 345 382 297 938 208 169 26 450 521 408 385 593 429 547 532 108 481 926 395 742 270 679 704
Could create an economic 1012 487 525 279 247 277 209 682 144 122 19 318 371 308 278 417 317 401 383 78 347 665 293 518 200 496 498
recession 72% 71% 73% 73% 72% 73% 70% 73% 69% 72% 72% 71% 71% 75% 72% 70% 74% 73% 72% 72% 72% 72% 74% 70% 74% 73% 71%
An economic recession is not 395 199 196 104 98 105 88 256 64 47 7 132 150 100 108 176 112 146 149 30 134 261 102 223 70 183 206
likely 28% 29% 27% 27% 28% 27% 30% 27% 31% 28% 28% 29% 29% 25% 28% 30% 26% 27% 28% 28% 28% 28% 26% 30% 26% 27% 29%
Sigma 1407 687 720 383 345 382 297 938 208 169 26 450 521 408 385 593 429 547 532 108 481 926 395 742 270 679 704
100% 100% 100% 100% 100% 100% 100% 100% 100% 100% 100% 100% 100% 100% 100% 100% 100% 100% 100% 100% 100% 100% 100% 100% 100% 100% 100%

Page 198
Fielding Period: November 27 - 28, 2018
HCAPS (Filtered on Registered Voters)
Weighted To The U.S. General Adult Population
30 Nov 2018
Table 175
JUDICIAL1101A Do you think federal judges today are mostly independent and ruling just on the basis of
the law or are they influenced by politics and ruling more and more on their political views?
Base: All Respondents
Presidential
Election Candidate
Gender Age Ethnicity Political Party Political Ideology Voted For Education Locale Income
_____________ ______________________ _______________________ ____________________ ____________________ _____________________ _____________ ________________ _________
Colle- Some
Cons- ge Gr- Colle- $75K Less
Hisp- Black Repub- Democ- Indep- Libe- Mode- erva- 3rd ad And ge Or Urb- Subu- Or Than
Total Male Female 18-34 35-49 50-64 65+ White anic /AA Other lican rat endent ral rate tive Clinton Trump Party Higher Less an rban Rural More $75K
______ _____ _______ _____ _____ _____ ____ _____ _____ _____ _____ ______ ______ ______ ______ ______ ______ ________ ______ _____ ______ ______ ____ _____ _____ ____ ____
Unweighted Base 705 353 352 202 180 174 149 525 48 88 13 223 266 188 222 269 214 276 254 54 288 417 204 356 145 265 430
Weighted Base 702 369 333 181 169 197 155 474 92 87 15 226 262 202 202 291 209 281 263 53 249 453 199 367 136 329 356
Mostly independent and 240 143 97 76 51 63 50 167 26 30 3 94 83 60 72 95 72 96 101 16 81 159 85 111 44 113 123
ruling just on the basis of 34% 39% 29% 42% 30% 32% 33% 35% 28% 34% 22% 42% 31% 30% 36% 33% 35% 34% 38% 30% 33% 35% 42% 30% 32% 34% 35%
the law
Influenced by politics and 462 226 236 105 118 135 104 307 66 57 12 132 180 141 129 196 137 185 162 37 168 294 115 255 92 216 233
ruling more and more on 66% 61% 71% 58% 70% 68% 67% 65% 72% 66% 78% 58% 69% 70% 64% 67% 65% 66% 62% 70% 67% 65% 58% 70% 68% 66% 65%
their political views
Sigma 702 369 333 181 169 197 155 474 92 87 15 226 262 202 202 291 209 281 263 53 249 453 199 367 136 329 356
100% 100% 100% 100% 100% 100% 100% 100% 100% 100% 100% 100% 100% 100% 100% 100% 100% 100% 100% 100% 100% 100% 100% 100% 100% 100% 100%

Page 199
Fielding Period: November 27 - 28, 2018
HCAPS (Filtered on Registered Voters)
Weighted To The U.S. General Adult Population
30 Nov 2018
Table 176
JUDICIAL1101B Do you believe that today in America we have a strong and independent judiciary or do
we have Trump and Obama judges who make decision on the basis of their political views as much as the law?
Base: All Respondents
Presidential
Election Candidate
Gender Age Ethnicity Political Party Political Ideology Voted For Education Locale Income
_____________ ______________________ _______________________ ____________________ ____________________ _____________________ _____________ ________________ _________
Colle- Some
Cons- ge Gr- Colle- $75K Less
Hisp- Black Repub- Democ- Indep- Libe- Mode- erva- 3rd ad And ge Or Urb- Subu- Or Than
Total Male Female 18-34 35-49 50-64 65+ White anic /AA Other lican rat endent ral rate tive Clinton Trump Party Higher Less an rban Rural More $75K
______ _____ _______ _____ _____ _____ ____ _____ _____ _____ _____ ______ ______ ______ ______ ______ ______ ________ ______ _____ ______ ______ ____ _____ _____ ____ ____
Unweighted Base 702 322 380 214 179 190 119 524 56 85 12 214 260 194 215 280 207 261 251 59 255 447 184 363 155 283 416
Weighted Base 705 317 387 201 176 184 143 464 116 82 11 224 258 206 184 302 219 266 269 55 232 473 196 375 134 351 349
Strong and independent 309 135 174 82 72 88 68 193 49 45 2 93 119 92 86 142 81 123 121 20 115 194 82 169 58 165 141
judiciary 44% 43% 45% 40% 41% 48% 48% 42% 42% 55% 21% 41% 46% 45% 47% 47% 37% 46% 45% 36% 50% 41% 42% 45% 43% 47% 40%
Trump and Obama judges who 396 183 213 120 104 97 75 271 68 37 8 131 139 114 98 160 138 143 148 36 117 279 114 206 76 186 208
make decision on the basis 56% 57% 55% 60% 59% 52% 52% 58% 58% 45% 79% 59% 54% 55% 53% 53% 63% 54% 55% 64% 50% 59% 58% 55% 57% 53% 60%
of political views as much
as the law
Sigma 705 317 387 201 176 184 143 464 116 82 11 224 258 206 184 302 219 266 269 55 232 473 196 375 134 351 349
100% 100% 100% 100% 100% 100% 100% 100% 100% 100% 100% 100% 100% 100% 100% 100% 100% 100% 100% 100% 100% 100% 100% 100% 100% 100% 100%

Page 200
Fielding Period: November 27 - 28, 2018
HCAPS (Filtered on Registered Voters)
Weighted To The U.S. General Adult Population
30 Nov 2018
Table 177
M9B Do you think that, for his actions, President Trump should be impeached and removed from office, censured by Congress,
or no action should be taken?
Base: All Respondents
Presidential
Election Candidate
Gender Age Ethnicity Political Party Political Ideology Voted For Education Locale Income
_____________ ______________________ _______________________ ____________________ ____________________ _____________________ _____________ ________________ _________
Colle- Some
Cons- ge Gr- Colle- $75K Less
Hisp- Black Repub- Democ- Indep- Libe- Mode- erva- 3rd ad And ge Or Urb- Subu- Or Than
Total Male Female 18-34 35-49 50-64 65+ White anic /AA Other lican rat endent ral rate tive Clinton Trump Party Higher Less an rban Rural More $75K
______ _____ _______ _____ _____ _____ ____ _____ _____ _____ _____ ______ ______ ______ ______ ______ ______ ________ ______ _____ ______ ______ ____ _____ _____ ____ ____
Unweighted Base 1407 675 732 416 359 364 268 1049 104 173 25 437 526 382 437 549 421 537 505 113 543 864 388 719 300 548 846
Weighted Base 1407 687 720 383 345 382 297 938 208 169 26 450 521 408 385 593 429 547 532 108 481 926 395 742 270 679 704
Impeached and removed from 569 264 305 176 125 146 121 311 115 104 14 64 353 143 261 244 64 377 63 39 201 367 198 283 88 280 284
office 40% 38% 42% 46% 36% 38% 41% 33% 55% 62% 56% 14% 68% 35% 68% 41% 15% 69% 12% 36% 42% 40% 50% 38% 32% 41% 40%
Censured by Congress 284 140 144 109 80 51 43 175 54 36 1 71 107 98 89 148 47 131 70 33 105 179 98 143 43 134 150
20% 20% 20% 29% 23% 13% 15% 19% 26% 21% 4% 16% 21% 24% 23% 25% 11% 24% 13% 31% 22% 19% 25% 19% 16% 20% 21%
No action should be taken 554 283 271 97 141 184 133 452 40 29 10 315 61 167 36 201 318 40 398 36 175 379 100 315 140 265 271
39% 41% 38% 25% 41% 48% 45% 48% 19% 17% 40% 70% 12% 41% 9% 34% 74% 7% 75% 33% 36% 41% 25% 42% 52% 39% 38%
Sigma 1407 687 720 383 345 382 297 938 208 169 26 450 521 408 385 593 429 547 532 108 481 926 395 742 270 679 704
100% 100% 100% 100% 100% 100% 100% 100% 100% 100% 100% 100% 100% 100% 100% 100% 100% 100% 100% 100% 100% 100% 100% 100% 100% 100% 100%

Page 201
Fielding Period: November 27 - 28, 2018
HCAPS (Filtered on Registered Voters)
Weighted To The U.S. General Adult Population
30 Nov 2018
Table 178
M10 Do you think the investigations into Russia and President Trump are helping the country or hurting the country?
Base: All Respondents
Presidential
Election Candidate
Gender Age Ethnicity Political Party Political Ideology Voted For Education Locale Income
_____________ ______________________ _______________________ ____________________ ____________________ _____________________ _____________ ________________ _________
Colle- Some
Cons- ge Gr- Colle- $75K Less
Hisp- Black Repub- Democ- Indep- Libe- Mode- erva- 3rd ad And ge Or Urb- Subu- Or Than
Total Male Female 18-34 35-49 50-64 65+ White anic /AA Other lican rat endent ral rate tive Clinton Trump Party Higher Less an rban Rural More $75K
______ _____ _______ _____ _____ _____ ____ _____ _____ _____ _____ ______ ______ ______ ______ ______ ______ ________ ______ _____ ______ ______ ____ _____ _____ ____ ____
Unweighted Base 1407 675 732 416 359 364 268 1049 104 173 25 437 526 382 437 549 421 537 505 113 543 864 388 719 300 548 846
Weighted Base 1407 687 720 383 345 382 297 938 208 169 26 450 521 408 385 593 429 547 532 108 481 926 395 742 270 679 704
Helping the country 584 286 298 178 143 139 124 372 97 76 9 125 276 174 253 222 109 318 149 47 239 345 182 309 93 322 257
42% 42% 41% 47% 42% 36% 42% 40% 46% 45% 37% 28% 53% 43% 66% 37% 25% 58% 28% 44% 50% 37% 46% 42% 34% 47% 36%
Hurting the country 823 401 422 204 202 243 174 567 112 93 16 326 244 234 132 371 320 229 383 61 242 581 213 433 177 357 448
58% 58% 59% 53% 58% 64% 58% 60% 54% 55% 63% 72% 47% 57% 34% 63% 75% 42% 72% 56% 50% 63% 54% 58% 66% 53% 64%
Sigma 1407 687 720 383 345 382 297 938 208 169 26 450 521 408 385 593 429 547 532 108 481 926 395 742 270 679 704
100% 100% 100% 100% 100% 100% 100% 100% 100% 100% 100% 100% 100% 100% 100% 100% 100% 100% 100% 100% 100% 100% 100% 100% 100% 100% 100%

Page 202
Fielding Period: November 27 - 28, 2018
HCAPS (Filtered on Registered Voters)
Weighted To The U.S. General Adult Population
30 Nov 2018
Table 179
QCOLLUSION Do you think the independent counsel has found actual evidence of Trump campaign officials colluding with the Russians
or has he not found any evidence of such collusion?
Base: All Respondents
Presidential
Election Candidate
Gender Age Ethnicity Political Party Political Ideology Voted For Education Locale Income
_____________ ______________________ _______________________ ____________________ ____________________ _____________________ _____________ ________________ _________
Colle- Some
Cons- ge Gr- Colle- $75K Less
Hisp- Black Repub- Democ- Indep- Libe- Mode- erva- 3rd ad And ge Or Urb- Subu- Or Than
Total Male Female 18-34 35-49 50-64 65+ White anic /AA Other lican rat endent ral rate tive Clinton Trump Party Higher Less an rban Rural More $75K
______ _____ _______ _____ _____ _____ ____ _____ _____ _____ _____ ______ ______ ______ ______ ______ ______ ________ ______ _____ ______ ______ ____ _____ _____ ____ ____
Unweighted Base 1407 675 732 416 359 364 268 1049 104 173 25 437 526 382 437 549 421 537 505 113 543 864 388 719 300 548 846
Weighted Base 1407 687 720 383 345 382 297 938 208 169 26 450 521 408 385 593 429 547 532 108 481 926 395 742 270 679 704
Found 512 251 261 143 126 142 101 310 94 81 10 66 305 136 247 206 59 346 66 41 202 310 173 257 82 270 238
36% 36% 36% 37% 36% 37% 34% 33% 45% 48% 39% 15% 59% 33% 64% 35% 14% 63% 12% 38% 42% 33% 44% 35% 30% 40% 34%
Not found 585 297 288 155 139 176 115 451 59 35 11 322 81 172 62 212 310 69 401 36 177 407 125 320 140 282 287
42% 43% 40% 40% 40% 46% 39% 48% 28% 21% 41% 72% 16% 42% 16% 36% 72% 13% 75% 33% 37% 44% 32% 43% 52% 41% 41%
Don't know 311 140 171 84 80 64 82 178 55 53 5 63 135 100 76 175 59 133 65 31 102 209 97 165 48 128 179
22% 20% 24% 22% 23% 17% 27% 19% 26% 31% 19% 14% 26% 25% 20% 29% 14% 24% 12% 29% 21% 23% 25% 22% 18% 19% 25%
Sigma 1407 687 720 383 345 382 297 938 208 169 26 450 521 408 385 593 429 547 532 108 481 926 395 742 270 679 704
100% 100% 100% 100% 100% 100% 100% 100% 100% 100% 100% 100% 100% 100% 100% 100% 100% 100% 100% 100% 100% 100% 100% 100% 100% 100% 100%

Page 203
Fielding Period: November 27 - 28, 2018
HCAPS (Filtered on Registered Voters)
Weighted To The U.S. General Adult Population
30 Nov 2018
Table 180
QINV506 How long do you think independent counsel Robert Mueller should keep on investigating?
Base: All Respondents
Presidential
Election Candidate
Gender Age Ethnicity Political Party Political Ideology Voted For Education Locale Income
_____________ ______________________ _______________________ ____________________ ____________________ _____________________ _____________ ________________ _________
Colle- Some
Cons- ge Gr- Colle- $75K Less
Hisp- Black Repub- Democ- Indep- Libe- Mode- erva- 3rd ad And ge Or Urb- Subu- Or Than
Total Male Female 18-34 35-49 50-64 65+ White anic /AA Other lican rat endent ral rate tive Clinton Trump Party Higher Less an rban Rural More $75K
______ _____ _______ _____ _____ _____ ____ _____ _____ _____ _____ ______ ______ ______ ______ ______ ______ ________ ______ _____ ______ ______ ____ _____ _____ ____ ____
Unweighted Base 1407 675 732 416 359 364 268 1049 104 173 25 437 526 382 437 549 421 537 505 113 543 864 388 719 300 548 846
Weighted Base 1407 687 720 383 345 382 297 938 208 169 26 450 521 408 385 593 429 547 532 108 481 926 395 742 270 679 704
He should stop immediately 427 213 214 69 124 141 94 348 38 22 8 270 41 112 26 137 265 27 329 18 114 313 82 232 113 206 207
30% 31% 30% 18% 36% 37% 31% 37% 18% 13% 30% 60% 8% 27% 7% 23% 62% 5% 62% 17% 24% 34% 21% 31% 42% 30% 29%
Another month 142 79 63 52 28 34 30 105 14 15 4 52 35 54 26 66 50 34 70 16 61 81 36 79 28 73 65
10% 12% 9% 13% 8% 9% 10% 11% 7% 9% 17% 12% 7% 13% 7% 11% 12% 6% 13% 15% 13% 9% 9% 11% 10% 11% 9%
2 to 3 months 174 85 89 89 31 32 22 106 38 21 - 53 73 46 60 84 30 80 56 14 53 121 65 80 29 75 99
12% 12% 12% 23% 9% 8% 8% 11% 18% 13% - 12% 14% 11% 16% 14% 7% 15% 10% 13% 11% 13% 17% 11% 11% 11% 14%
3 to 6 months 99 58 41 40 26 17 16 52 21 17 2 19 53 25 41 36 22 50 20 10 33 66 31 54 14 49 49
7% 9% 6% 10% 7% 5% 5% 6% 10% 10% 6% 4% 10% 6% 11% 6% 5% 9% 4% 10% 7% 7% 8% 7% 5% 7% 7%
6 months to a year 96 35 61 36 15 17 28 51 22 20 - 10 52 33 24 64 8 54 13 6 41 55 30 49 17 41 55
7% 5% 9% 9% 4% 4% 9% 5% 10% 12% - 2% 10% 8% 6% 11% 2% 10% 2% 5% 9% 6% 8% 7% 6% 6% 8%
Indefinitely 468 216 252 97 122 141 108 276 76 73 12 48 267 138 207 206 54 303 43 44 179 289 151 247 70 234 229
33% 31% 35% 25% 35% 37% 36% 29% 36% 43% 47% 11% 51% 34% 54% 35% 13% 55% 8% 41% 37% 31% 38% 33% 26% 34% 33%
Sigma 1407 687 720 383 345 382 297 938 208 169 26 450 521 408 385 593 429 547 532 108 481 926 395 742 270 679 704
100% 100% 100% 100% 100% 100% 100% 100% 100% 100% 100% 100% 100% 100% 100% 100% 100% 100% 100% 100% 100% 100% 100% 100% 100% 100% 100%

Page 204
Fielding Period: November 27 - 28, 2018
HCAPS (Filtered on Registered Voters)
Weighted To The U.S. General Adult Population
30 Nov 2018
Table 181
QCONGRESS Do you think that the FBI needs to turn over the documents requested by Congress on the start of the Trump-Russia
investigation or should the FBI and justice department continue to withhold the documents on the start of the
investigation?
Base: All Respondents
Presidential
Election Candidate
Gender Age Ethnicity Political Party Political Ideology Voted For Education Locale Income
_____________ ______________________ _______________________ ____________________ ____________________ _____________________ _____________ ________________ _________
Colle- Some
Cons- ge Gr- Colle- $75K Less
Hisp- Black Repub- Democ- Indep- Libe- Mode- erva- 3rd ad And ge Or Urb- Subu- Or Than
Total Male Female 18-34 35-49 50-64 65+ White anic /AA Other lican rat endent ral rate tive Clinton Trump Party Higher Less an rban Rural More $75K
______ _____ _______ _____ _____ _____ ____ _____ _____ _____ _____ ______ ______ ______ ______ ______ ______ ________ ______ _____ ______ ______ ____ _____ _____ ____ ____
Unweighted Base 1407 675 732 416 359 364 268 1049 104 173 25 437 526 382 437 549 421 537 505 113 543 864 388 719 300 548 846
Weighted Base 1407 687 720 383 345 382 297 938 208 169 26 450 521 408 385 593 429 547 532 108 481 926 395 742 270 679 704
Turn over documents 1065 522 543 304 269 273 219 693 176 133 19 351 390 309 267 454 344 395 415 83 354 711 305 562 199 498 549
requested by Congress 76% 76% 75% 80% 78% 71% 74% 74% 85% 79% 75% 78% 75% 76% 69% 77% 80% 72% 78% 77% 74% 77% 77% 76% 74% 73% 78%
Withhold the documents 342 165 177 78 76 109 78 246 32 36 6 100 130 99 119 138 84 152 117 25 127 215 91 180 71 182 156
24% 24% 25% 20% 22% 29% 26% 26% 15% 21% 25% 22% 25% 24% 31% 23% 20% 28% 22% 23% 26% 23% 23% 24% 26% 27% 22%
Sigma 1407 687 720 383 345 382 297 938 208 169 26 450 521 408 385 593 429 547 532 108 481 926 395 742 270 679 704
100% 100% 100% 100% 100% 100% 100% 100% 100% 100% 100% 100% 100% 100% 100% 100% 100% 100% 100% 100% 100% 100% 100% 100% 100% 100% 100%

Page 205
Fielding Period: November 27 - 28, 2018
HCAPS (Filtered on Registered Voters)
Weighted To The U.S. General Adult Population
30 Nov 2018
Table 182
QRELEASEA Do you support or oppose the decision by the administration to declassify and publicly release the evidence used by the
FBI and the Justice department to start the investigation on possible collusion between the Trump campaign and Russia?
Base: Split 1
Presidential
Election Candidate
Gender Age Ethnicity Political Party Political Ideology Voted For Education Locale Income
_____________ ______________________ _______________________ ____________________ ____________________ _____________________ _____________ ________________ _________
Colle- Some
Cons- ge Gr- Colle- $75K Less
Hisp- Black Repub- Democ- Indep- Libe- Mode- erva- 3rd ad And ge Or Urb- Subu- Or Than
Total Male Female 18-34 35-49 50-64 65+ White anic /AA Other lican rat endent ral rate tive Clinton Trump Party Higher Less an rban Rural More $75K
______ _____ _______ _____ _____ _____ ____ _____ _____ _____ _____ ______ ______ ______ ______ ______ ______ ________ ______ _____ ______ ______ ____ _____ _____ ____ ____
Unweighted Base 704 331 373 208 173 185 138 530 57 79 12 213 267 199 228 278 198 284 245 58 271 433 203 352 149 273 424
Weighted Base 703 328 374 194 170 192 147 471 113 74 13 218 268 207 207 290 205 286 255 57 244 458 207 370 125 327 362
Strongly/Somewhat Support 484 232 252 153 105 137 88 330 80 46 10 161 177 138 134 206 145 183 192 39 177 307 141 261 82 235 242
(Net) 69% 71% 67% 79% 62% 72% 60% 70% 71% 62% 75% 74% 66% 67% 64% 71% 71% 64% 75% 68% 72% 67% 68% 70% 65% 72% 67%
Strongly support 254 127 127 74 52 86 42 176 40 27 6 91 87 71 77 83 94 95 107 19 82 172 73 135 45 132 115
36% 39% 34% 38% 31% 45% 28% 37% 35% 37% 44% 42% 32% 34% 37% 29% 46% 33% 42% 33% 34% 37% 35% 37% 36% 40% 32%
Somewhat support 230 105 125 80 53 51 46 155 40 18 4 70 90 68 56 123 51 88 85 20 95 136 68 126 36 103 127
33% 32% 33% 41% 31% 27% 32% 33% 36% 25% 32% 32% 34% 33% 27% 42% 25% 31% 33% 35% 39% 30% 33% 34% 29% 32% 35%
Strongly/Somewhat Oppose 219 96 122 40 65 54 59 141 33 28 3 57 91 68 74 85 60 103 63 19 68 151 66 109 43 92 120
(Net) 31% 29% 33% 21% 38% 28% 40% 30% 29% 38% 25% 26% 34% 33% 36% 29% 29% 36% 25% 32% 28% 33% 32% 30% 35% 28% 33%
Somewhat oppose 129 59 70 28 37 31 32 77 29 14 3 38 45 45 30 58 41 53 37 13 30 99 46 59 23 45 81
18% 18% 19% 15% 22% 16% 22% 16% 26% 19% 25% 17% 17% 22% 15% 20% 20% 19% 14% 23% 12% 22% 22% 16% 18% 14% 22%
Strongly oppose 90 37 52 12 28 23 27 64 4 14 - 20 46 23 43 27 20 49 27 5 38 52 20 50 20 47 40
13% 11% 14% 6% 16% 12% 18% 14% 4% 19% - 9% 17% 11% 21% 9% 10% 17% 10% 9% 16% 11% 10% 13% 16% 14% 11%
Sigma 703 328 374 194 170 192 147 471 113 74 13 218 268 207 207 290 205 286 255 57 244 458 207 370 125 327 362
100% 100% 100% 100% 100% 100% 100% 100% 100% 100% 100% 100% 100% 100% 100% 100% 100% 100% 100% 100% 100% 100% 100% 100% 100% 100% 100%

Page 206
Fielding Period: November 27 - 28, 2018
HCAPS (Filtered on Registered Voters)
Weighted To The U.S. General Adult Population
30 Nov 2018
Table 183
QRELEASEB Do you support or oppose the decision to declassify and publicly release the evidence used by the FBI and the Justice
department to start the investigation on possible collusion between the Trump campaign and Russia?
Base: Split 2
Presidential
Election Candidate
Gender Age Ethnicity Political Party Political Ideology Voted For Education Locale Income
_____________ ______________________ _______________________ ____________________ ____________________ _____________________ _____________ ________________ _________
Colle- Some
Cons- ge Gr- Colle- $75K Less
Hisp- Black Repub- Democ- Indep- Libe- Mode- erva- 3rd ad And ge Or Urb- Subu- Or Than
Total Male Female 18-34 35-49 50-64 65+ White anic /AA Other lican rat endent ral rate tive Clinton Trump Party Higher Less an rban Rural More $75K
______ _____ _______ _____ _____ _____ ____ _____ _____ _____ _____ ______ ______ ______ ______ ______ ______ ________ ______ _____ ______ ______ ____ _____ _____ ____ ____
Unweighted Base 703 344 359 208 186 179 130 519 47 94 13 224 259 183 209 271 223 253 260 55 272 431 185 367 151 275 422
Weighted Base 704 359 346 189 175 190 150 467 95 95 13 232 253 202 178 303 224 261 276 51 237 467 188 371 145 353 342
Strongly/Somewhat Support 500 263 238 132 133 115 120 322 69 80 8 149 207 135 142 215 143 214 173 35 173 327 131 263 106 245 254
(Net) 71% 73% 69% 70% 76% 61% 80% 69% 72% 84% 58% 64% 82% 67% 80% 71% 64% 82% 63% 68% 73% 70% 70% 71% 73% 69% 74%
Strongly support 250 149 101 53 68 64 64 160 25 52 6 77 100 70 64 106 80 111 94 17 100 150 67 137 47 139 111
35% 41% 29% 28% 39% 34% 43% 34% 26% 54% 44% 33% 40% 35% 36% 35% 36% 43% 34% 32% 42% 32% 35% 37% 32% 39% 32%
Somewhat support 251 114 136 80 64 51 56 162 44 28 2 72 107 65 78 109 63 103 79 18 73 177 65 127 59 106 144
36% 32% 39% 42% 37% 27% 37% 35% 47% 30% 14% 31% 42% 32% 44% 36% 28% 39% 29% 36% 31% 38% 34% 34% 41% 30% 42%
Strongly/Somewhat Oppose 204 96 108 57 43 75 30 145 26 15 5 83 46 67 36 88 81 47 103 16 64 140 57 108 39 108 87
(Net) 29% 27% 31% 30% 24% 39% 20% 31% 28% 16% 42% 36% 18% 33% 20% 29% 36% 18% 37% 32% 27% 30% 30% 29% 27% 31% 26%
Somewhat oppose 125 53 71 40 28 36 20 89 15 8 2 58 27 35 24 45 56 26 60 13 40 84 30 68 27 64 53
18% 15% 21% 21% 16% 19% 14% 19% 16% 8% 14% 25% 11% 17% 13% 15% 25% 10% 22% 25% 17% 18% 16% 18% 18% 18% 15%
Strongly oppose 80 43 37 17 15 39 9 56 11 8 4 25 19 32 12 43 25 21 43 4 24 56 27 40 13 44 35
11% 12% 11% 9% 9% 20% 6% 12% 12% 8% 27% 11% 7% 16% 7% 14% 11% 8% 16% 7% 10% 12% 14% 11% 9% 12% 10%
Sigma 704 359 346 189 175 190 150 467 95 95 13 232 253 202 178 303 224 261 276 51 237 467 188 371 145 353 342
100% 100% 100% 100% 100% 100% 100% 100% 100% 100% 100% 100% 100% 100% 100% 100% 100% 100% 100% 100% 100% 100% 100% 100% 100% 100% 100%

Page 207
Fielding Period: November 27 - 28, 2018
HCAPS (Filtered on Registered Voters)
Weighted To The U.S. General Adult Population
30 Nov 2018
Table 184
INV0901 Which is closest to your view?
Base: All Respondents
Presidential
Election Candidate
Gender Age Ethnicity Political Party Political Ideology Voted For Education Locale Income
_____________ ______________________ _______________________ ____________________ ____________________ _____________________ _____________ ________________ _________
Colle- Some
Cons- ge Gr- Colle- $75K Less
Hisp- Black Repub- Democ- Indep- Libe- Mode- erva- 3rd ad And ge Or Urb- Subu- Or Than
Total Male Female 18-34 35-49 50-64 65+ White anic /AA Other lican rat endent ral rate tive Clinton Trump Party Higher Less an rban Rural More $75K
______ _____ _______ _____ _____ _____ ____ _____ _____ _____ _____ ______ ______ ______ ______ ______ ______ ________ ______ _____ ______ ______ ____ _____ _____ ____ ____
Unweighted Base 1407 675 732 416 359 364 268 1049 104 173 25 437 526 382 437 549 421 537 505 113 543 864 388 719 300 548 846
Weighted Base 1407 687 720 383 345 382 297 938 208 169 26 450 521 408 385 593 429 547 532 108 481 926 395 742 270 679 704
It's important to publicly 920 481 439 263 226 236 194 612 132 120 19 307 332 267 234 388 298 351 371 70 308 612 252 491 177 452 454
release the evidence used by 65% 70% 61% 69% 66% 62% 65% 65% 63% 71% 74% 68% 64% 65% 61% 65% 70% 64% 70% 64% 64% 66% 64% 66% 66% 66% 64%
the FBI and the Justice
Department to clear the air
about
any possible wrongdoing in
starting the Trump-Russia
investigation
The administration should 487 206 281 119 119 145 103 327 77 49 7 144 189 141 151 205 131 196 161 39 173 314 143 251 93 228 250
not publicly release the 35% 30% 39% 31% 34% 38% 35% 35% 37% 29% 26% 32% 36% 35% 39% 35% 30% 36% 30% 36% 36% 34% 36% 34% 34% 34% 36%
evidence to avoid
interfering with sources and
methods of interviewing
Sigma 1407 687 720 383 345 382 297 938 208 169 26 450 521 408 385 593 429 547 532 108 481 926 395 742 270 679 704
100% 100% 100% 100% 100% 100% 100% 100% 100% 100% 100% 100% 100% 100% 100% 100% 100% 100% 100% 100% 100% 100% 100% 100% 100% 100% 100%
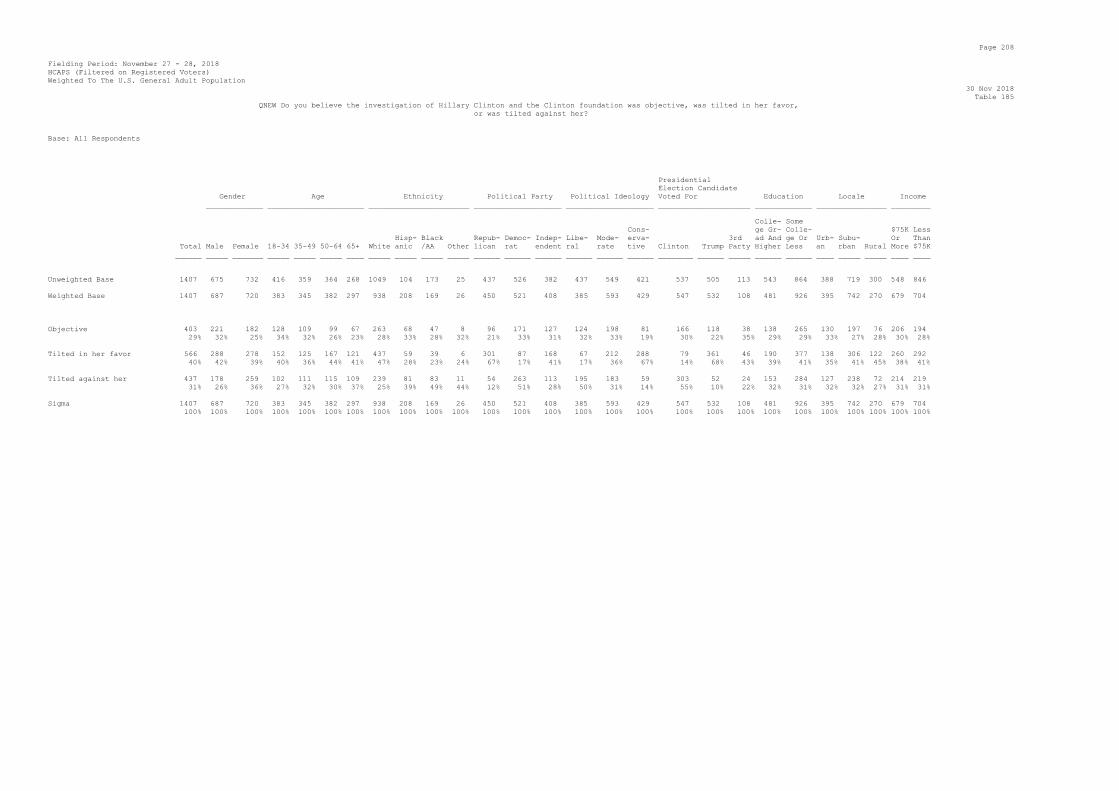
Page 208
Fielding Period: November 27 - 28, 2018
HCAPS (Filtered on Registered Voters)
Weighted To The U.S. General Adult Population
30 Nov 2018
Table 185
QNEW Do you believe the investigation of Hillary Clinton and the Clinton foundation was objective, was tilted in her favor,
or was tilted against her?
Base: All Respondents
Presidential
Election Candidate
Gender Age Ethnicity Political Party Political Ideology Voted For Education Locale Income
_____________ ______________________ _______________________ ____________________ ____________________ _____________________ _____________ ________________ _________
Colle- Some
Cons- ge Gr- Colle- $75K Less
Hisp- Black Repub- Democ- Indep- Libe- Mode- erva- 3rd ad And ge Or Urb- Subu- Or Than
Total Male Female 18-34 35-49 50-64 65+ White anic /AA Other lican rat endent ral rate tive Clinton Trump Party Higher Less an rban Rural More $75K
______ _____ _______ _____ _____ _____ ____ _____ _____ _____ _____ ______ ______ ______ ______ ______ ______ ________ ______ _____ ______ ______ ____ _____ _____ ____ ____
Unweighted Base 1407 675 732 416 359 364 268 1049 104 173 25 437 526 382 437 549 421 537 505 113 543 864 388 719 300 548 846
Weighted Base 1407 687 720 383 345 382 297 938 208 169 26 450 521 408 385 593 429 547 532 108 481 926 395 742 270 679 704
Objective 403 221 182 128 109 99 67 263 68 47 8 96 171 127 124 198 81 166 118 38 138 265 130 197 76 206 194
29% 32% 25% 34% 32% 26% 23% 28% 33% 28% 32% 21% 33% 31% 32% 33% 19% 30% 22% 35% 29% 29% 33% 27% 28% 30% 28%
Tilted in her favor 566 288 278 152 125 167 121 437 59 39 6 301 87 168 67 212 288 79 361 46 190 377 138 306 122 260 292
40% 42% 39% 40% 36% 44% 41% 47% 28% 23% 24% 67% 17% 41% 17% 36% 67% 14% 68% 43% 39% 41% 35% 41% 45% 38% 41%
Tilted against her 437 178 259 102 111 115 109 239 81 83 11 54 263 113 195 183 59 303 52 24 153 284 127 238 72 214 219
31% 26% 36% 27% 32% 30% 37% 25% 39% 49% 44% 12% 51% 28% 50% 31% 14% 55% 10% 22% 32% 31% 32% 32% 27% 31% 31%
Sigma 1407 687 720 383 345 382 297 938 208 169 26 450 521 408 385 593 429 547 532 108 481 926 395 742 270 679 704
100% 100% 100% 100% 100% 100% 100% 100% 100% 100% 100% 100% 100% 100% 100% 100% 100% 100% 100% 100% 100% 100% 100% 100% 100% 100% 100%

Page 209
Fielding Period: November 27 - 28, 2018
HCAPS (Filtered on Registered Voters)
Weighted To The U.S. General Adult Population
30 Nov 2018
Table 186
MEMO14 Do you think bias against President Trump in the FBI played a role in launching investigations against him or did bias
play no role in launching investigations?
Base: All Respondents
Presidential
Election Candidate
Gender Age Ethnicity Political Party Political Ideology Voted For Education Locale Income
_____________ ______________________ _______________________ ____________________ ____________________ _____________________ _____________ ________________ _________
Colle- Some
Cons- ge Gr- Colle- $75K Less
Hisp- Black Repub- Democ- Indep- Libe- Mode- erva- 3rd ad And ge Or Urb- Subu- Or Than
Total Male Female 18-34 35-49 50-64 65+ White anic /AA Other lican rat endent ral rate tive Clinton Trump Party Higher Less an rban Rural More $75K
______ _____ _______ _____ _____ _____ ____ _____ _____ _____ _____ ______ ______ ______ ______ ______ ______ ________ ______ _____ ______ ______ ____ _____ _____ ____ ____
Unweighted Base 1407 675 732 416 359 364 268 1049 104 173 25 437 526 382 437 549 421 537 505 113 543 864 388 719 300 548 846
Weighted Base 1407 687 720 383 345 382 297 938 208 169 26 450 521 408 385 593 429 547 532 108 481 926 395 742 270 679 704
Bias played a role 769 377 392 229 189 208 143 572 86 70 11 343 197 219 137 294 338 169 422 60 236 533 198 405 167 378 380
55% 55% 54% 60% 55% 55% 48% 61% 42% 41% 43% 76% 38% 54% 35% 50% 79% 31% 79% 55% 49% 58% 50% 55% 62% 56% 54%
Bias did not play a role 638 310 328 154 157 173 154 366 122 99 15 108 324 189 249 299 90 378 110 48 245 392 197 337 104 301 325
45% 45% 46% 40% 45% 45% 52% 39% 58% 59% 57% 24% 62% 46% 65% 50% 21% 69% 21% 45% 51% 42% 50% 45% 38% 44% 46%
Sigma 1407 687 720 383 345 382 297 938 208 169 26 450 521 408 385 593 429 547 532 108 481 926 395 742 270 679 704
100% 100% 100% 100% 100% 100% 100% 100% 100% 100% 100% 100% 100% 100% 100% 100% 100% 100% 100% 100% 100% 100% 100% 100% 100% 100% 100%

Page 210
Fielding Period: November 27 - 28, 2018
HCAPS (Filtered on Registered Voters)
Weighted To The U.S. General Adult Population
30 Nov 2018
Table 187
FBI10 Do you favor or oppose appointing a special counsel to investigate potential abuses at the FBI?
Base: All Respondents
Presidential
Election Candidate
Gender Age Ethnicity Political Party Political Ideology Voted For Education Locale Income
_____________ ______________________ _______________________ ____________________ ____________________ _____________________ _____________ ________________ _________
Colle- Some
Cons- ge Gr- Colle- $75K Less
Hisp- Black Repub- Democ- Indep- Libe- Mode- erva- 3rd ad And ge Or Urb- Subu- Or Than
Total Male Female 18-34 35-49 50-64 65+ White anic /AA Other lican rat endent ral rate tive Clinton Trump Party Higher Less an rban Rural More $75K
______ _____ _______ _____ _____ _____ ____ _____ _____ _____ _____ ______ ______ ______ ______ ______ ______ ________ ______ _____ ______ ______ ____ _____ _____ ____ ____
Unweighted Base 1407 675 732 416 359 364 268 1049 104 173 25 437 526 382 437 549 421 537 505 113 543 864 388 719 300 548 846
Weighted Base 1407 687 720 383 345 382 297 938 208 169 26 450 521 408 385 593 429 547 532 108 481 926 395 742 270 679 704
Favor 964 463 501 280 240 256 188 633 153 120 20 341 337 269 246 394 324 342 408 71 305 659 293 490 182 448 501
69% 67% 70% 73% 70% 67% 63% 67% 73% 71% 76% 76% 65% 66% 64% 66% 76% 62% 77% 65% 63% 71% 74% 66% 67% 66% 71%
Oppose 443 224 219 103 105 126 109 306 56 48 6 109 183 139 139 199 105 206 123 37 176 267 103 252 89 231 203
31% 33% 30% 27% 30% 33% 37% 33% 27% 29% 24% 24% 35% 34% 36% 34% 24% 38% 23% 35% 37% 29% 26% 34% 33% 34% 29%
Sigma 1407 687 720 383 345 382 297 938 208 169 26 450 521 408 385 593 429 547 532 108 481 926 395 742 270 679 704
100% 100% 100% 100% 100% 100% 100% 100% 100% 100% 100% 100% 100% 100% 100% 100% 100% 100% 100% 100% 100% 100% 100% 100% 100% 100% 100%

Page 211
Fielding Period: November 27 - 28, 2018
HCAPS (Filtered on Registered Voters)
Weighted To The U.S. General Adult Population
30 Nov 2018
Table 188
SC11 Should special counsel Robert Mueller be fired or not?
Base: All Respondents
Presidential
Election Candidate
Gender Age Ethnicity Political Party Political Ideology Voted For Education Locale Income
_____________ ______________________ _______________________ ____________________ ____________________ _____________________ _____________ ________________ _________
Colle- Some
Cons- ge Gr- Colle- $75K Less
Hisp- Black Repub- Democ- Indep- Libe- Mode- erva- 3rd ad And ge Or Urb- Subu- Or Than
Total Male Female 18-34 35-49 50-64 65+ White anic /AA Other lican rat endent ral rate tive Clinton Trump Party Higher Less an rban Rural More $75K
______ _____ _______ _____ _____ _____ ____ _____ _____ _____ _____ ______ ______ ______ ______ ______ ______ ________ ______ _____ ______ ______ ____ _____ _____ ____ ____
Unweighted Base 1407 675 732 416 359 364 268 1049 104 173 25 437 526 382 437 549 421 537 505 113 543 864 388 719 300 548 846
Weighted Base 1407 687 720 383 345 382 297 938 208 169 26 450 521 408 385 593 429 547 532 108 481 926 395 742 270 679 704
Fired 505 243 262 146 148 131 80 358 70 53 11 238 124 134 90 179 236 117 300 29 131 374 148 255 102 224 265
36% 35% 36% 38% 43% 34% 27% 38% 34% 31% 41% 53% 24% 33% 23% 30% 55% 21% 57% 27% 27% 40% 37% 34% 38% 33% 38%
Not fired 902 444 458 237 198 251 217 581 138 116 15 213 397 274 296 414 192 430 231 79 351 552 248 487 168 455 439
64% 65% 64% 62% 57% 66% 73% 62% 66% 69% 59% 47% 76% 67% 77% 70% 45% 79% 43% 73% 73% 60% 63% 66% 62% 67% 62%
Sigma 1407 687 720 383 345 382 297 938 208 169 26 450 521 408 385 593 429 547 532 108 481 926 395 742 270 679 704
100% 100% 100% 100% 100% 100% 100% 100% 100% 100% 100% 100% 100% 100% 100% 100% 100% 100% 100% 100% 100% 100% 100% 100% 100% 100% 100%

Page 212
Fielding Period: November 27 - 28, 2018
HCAPS (Filtered on Registered Voters)
Weighted To The U.S. General Adult Population
30 Nov 2018
Table 189
SC12 Should deputy Attorney General Rod Rosenstein be fired or not?
Base: All Respondents
Presidential
Election Candidate
Gender Age Ethnicity Political Party Political Ideology Voted For Education Locale Income
_____________ ______________________ _______________________ ____________________ ____________________ _____________________ _____________ ________________ _________
Colle- Some
Cons- ge Gr- Colle- $75K Less
Hisp- Black Repub- Democ- Indep- Libe- Mode- erva- 3rd ad And ge Or Urb- Subu- Or Than
Total Male Female 18-34 35-49 50-64 65+ White anic /AA Other lican rat endent ral rate tive Clinton Trump Party Higher Less an rban Rural More $75K
______ _____ _______ _____ _____ _____ ____ _____ _____ _____ _____ ______ ______ ______ ______ ______ ______ ________ ______ _____ ______ ______ ____ _____ _____ ____ ____
Unweighted Base 1407 675 732 416 359 364 268 1049 104 173 25 437 526 382 437 549 421 537 505 113 543 864 388 719 300 548 846
Weighted Base 1407 687 720 383 345 382 297 938 208 169 26 450 521 408 385 593 429 547 532 108 481 926 395 742 270 679 704
Fired 584 284 300 166 159 165 95 384 98 70 15 243 184 145 137 223 224 175 286 39 159 424 186 268 130 263 310
41% 41% 42% 43% 46% 43% 32% 41% 47% 41% 57% 54% 35% 35% 36% 38% 52% 32% 54% 36% 33% 46% 47% 36% 48% 39% 44%
Not fired 823 403 420 217 186 217 203 555 110 99 11 208 336 263 249 370 205 372 246 69 322 501 210 474 140 416 395
59% 59% 58% 57% 54% 57% 68% 59% 53% 59% 43% 46% 65% 65% 64% 62% 48% 68% 46% 64% 67% 54% 53% 64% 52% 61% 56%
Sigma 1407 687 720 383 345 382 297 938 208 169 26 450 521 408 385 593 429 547 532 108 481 926 395 742 270 679 704
100% 100% 100% 100% 100% 100% 100% 100% 100% 100% 100% 100% 100% 100% 100% 100% 100% 100% 100% 100% 100% 100% 100% 100% 100% 100% 100%

Page 213
Fielding Period: November 27 - 28, 2018
HCAPS (Filtered on Registered Voters)
Weighted To The U.S. General Adult Population
30 Nov 2018
Table 190
INV0902 Recent news reports say that Rod Rosenstein right after James Comey was fired as director of the FBI suggested secretly
recording President Trump and using the 25th amendment to remove President Trump from office. Does this disqualify
Rosenstein from overseeing the Special Counsel's investigation, or is it not relevant?
Base: All Respondents
Presidential
Election Candidate
Gender Age Ethnicity Political Party Political Ideology Voted For Education Locale Income
_____________ ______________________ _______________________ ____________________ ____________________ _____________________ _____________ ________________ _________
Colle- Some
Cons- ge Gr- Colle- $75K Less
Hisp- Black Repub- Democ- Indep- Libe- Mode- erva- 3rd ad And ge Or Urb- Subu- Or Than
Total Male Female 18-34 35-49 50-64 65+ White anic /AA Other lican rat endent ral rate tive Clinton Trump Party Higher Less an rban Rural More $75K
______ _____ _______ _____ _____ _____ ____ _____ _____ _____ _____ ______ ______ ______ ______ ______ ______ ________ ______ _____ ______ ______ ____ _____ _____ ____ ____
Unweighted Base 1407 675 732 416 359 364 268 1049 104 173 25 437 526 382 437 549 421 537 505 113 543 864 388 719 300 548 846
Weighted Base 1407 687 720 383 345 382 297 938 208 169 26 450 521 408 385 593 429 547 532 108 481 926 395 742 270 679 704
Disqualifies him 716 356 360 204 181 198 132 532 89 61 8 322 177 205 125 289 301 161 413 56 228 487 206 361 148 362 346
51% 52% 50% 53% 53% 52% 44% 57% 43% 36% 30% 71% 34% 50% 32% 49% 70% 29% 78% 52% 47% 53% 52% 49% 55% 53% 49%
It is not relevant 691 331 361 179 164 183 165 406 119 108 18 129 343 203 260 304 127 386 119 52 253 438 189 381 122 318 358
49% 48% 50% 47% 47% 48% 56% 43% 57% 64% 70% 29% 66% 50% 68% 51% 30% 71% 22% 48% 53% 47% 48% 51% 45% 47% 51%
Sigma 1407 687 720 383 345 382 297 938 208 169 26 450 521 408 385 593 429 547 532 108 481 926 395 742 270 679 704
100% 100% 100% 100% 100% 100% 100% 100% 100% 100% 100% 100% 100% 100% 100% 100% 100% 100% 100% 100% 100% 100% 100% 100% 100% 100% 100%

Page 216
Fielding Period: November 27 - 28, 2018
HCAPS (Filtered on Registered Voters)
Weighted To The U.S. General Adult Population
30 Nov 2018
Table 193
SC1103 Should former FBI director James Comey and former Attorney General Loretta Lynch be required to answer a subpoena by the outgoing House Republican leadership to privately testify before
Congress next month about FBI actions in the 2016 campaign, or should they ignore or fight the subpoena?
Base: All Respondents
Presidential
Election Candidate
Gender Age Ethnicity Political Party Political Ideology Voted For Education Locale Income
_____________ ______________________ _______________________ ____________________ ____________________ _____________________ _____________ ________________ _________
Colle- Some
Cons- ge Gr- Colle- $75K Less
Hisp- Black Repub- Democ- Indep- Libe- Mode- erva- 3rd ad And ge Or Urb- Subu- Or Than
Total Male Female 18-34 35-49 50-64 65+ White anic /AA Other lican rat endent ral rate tive Clinton Trump Party Higher Less an rban Rural More $75K
______ _____ _______ _____ _____ _____ ____ _____ _____ _____ _____ ______ ______ ______ ______ ______ ______ ________ ______ _____ ______ ______ ____ _____ _____ ____ ____
Unweighted Base 1407 675 732 416 359 364 268 1049 104 173 25 437 526 382 437 549 421 537 505 113 543 864 388 719 300 548 846
Weighted Base 1407 687 720 383 345 382 297 938 208 169 26 450 521 408 385 593 429 547 532 108 481 926 395 742 270 679 704
Answer 1075 527 547 289 269 301 216 724 163 124 20 394 375 290 265 430 379 378 445 91 368 707 303 575 197 533 528
76% 77% 76% 76% 78% 79% 72% 77% 78% 74% 78% 87% 72% 71% 69% 73% 88% 69% 84% 84% 77% 76% 77% 78% 73% 78% 75%
Ignore or fight 332 159 173 93 77 80 82 215 45 44 6 56 145 118 120 163 49 169 86 18 113 219 92 167 73 146 177
24% 23% 24% 24% 22% 21% 28% 23% 22% 26% 22% 13% 28% 29% 31% 27% 12% 31% 16% 16% 23% 24% 23% 22% 27% 22% 25%
Sigma 1407 687 720 383 345 382 297 938 208 169 26 450 521 408 385 593 429 547 532 108 481 926 395 742 270 679 704
100% 100% 100% 100% 100% 100% 100% 100% 100% 100% 100% 100% 100% 100% 100% 100% 100% 100% 100% 100% 100% 100% 100% 100% 100% 100% 100%

Page 217
Fielding Period: November 27 - 28, 2018
HCAPS (Filtered on Registered Voters)
Weighted To The U.S. General Adult Population
30 Nov 2018
Table 194
SC1104 Should incoming House Democratic leadership be allowed to get President Trump's tax returns and make them public, or should they not be allowed to do so?
Base: All Respondents
Presidential
Election Candidate
Gender Age Ethnicity Political Party Political Ideology Voted For Education Locale Income
_____________ ______________________ _______________________ ____________________ ____________________ _____________________ _____________ ________________ _________
Colle- Some
Cons- ge Gr- Colle- $75K Less
Hisp- Black Repub- Democ- Indep- Libe- Mode- erva- 3rd ad And ge Or Urb- Subu- Or Than
Total Male Female 18-34 35-49 50-64 65+ White anic /AA Other lican rat endent ral rate tive Clinton Trump Party Higher Less an rban Rural More $75K
______ _____ _______ _____ _____ _____ ____ _____ _____ _____ _____ ______ ______ ______ ______ ______ ______ ________ ______ _____ ______ ______ ____ _____ _____ ____ ____
Unweighted Base 1407 675 732 416 359 364 268 1049 104 173 25 437 526 382 437 549 421 537 505 113 543 864 388 719 300 548 846
Weighted Base 1407 687 720 383 345 382 297 938 208 169 26 450 521 408 385 593 429 547 532 108 481 926 395 742 270 679 704
Allowed 882 437 444 256 219 222 185 545 150 140 13 159 449 260 331 406 145 485 189 76 324 557 289 445 148 446 429
63% 64% 62% 67% 63% 58% 62% 58% 72% 83% 50% 35% 86% 64% 86% 68% 34% 89% 36% 70% 67% 60% 73% 60% 55% 66% 61%
Not allowed 525 249 276 127 127 160 112 393 58 29 13 292 72 148 55 187 284 62 342 32 157 369 106 297 122 234 275
37% 36% 38% 33% 37% 42% 38% 42% 28% 17% 50% 65% 14% 36% 14% 32% 66% 11% 64% 30% 33% 40% 27% 40% 45% 34% 39%
Sigma 1407 687 720 383 345 382 297 938 208 169 26 450 521 408 385 593 429 547 532 108 481 926 395 742 270 679 704
100% 100% 100% 100% 100% 100% 100% 100% 100% 100% 100% 100% 100% 100% 100% 100% 100% 100% 100% 100% 100% 100% 100% 100% 100% 100% 100%

Page 218
Fielding Period: November 27 - 28, 2018
HCAPS (Filtered on Registered Voters)
Weighted To The U.S. General Adult Population
30 Nov 2018
Table 195
SC1105 Should House Democrats open new investigations into possible collusion with Russia by the Trump campaign or should they not do so until Special Counsel
Robert Mueller submits his final report?
Base: All Respondents
Presidential
Election Candidate
Gender Age Ethnicity Political Party Political Ideology Voted For Education Locale Income
_____________ ______________________ _______________________ ____________________ ____________________ _____________________ _____________ ________________ _________
Colle- Some
Cons- ge Gr- Colle- $75K Less
Hisp- Black Repub- Democ- Indep- Libe- Mode- erva- 3rd ad And ge Or Urb- Subu- Or Than
Total Male Female 18-34 35-49 50-64 65+ White anic /AA Other lican rat endent ral rate tive Clinton Trump Party Higher Less an rban Rural More $75K
______ _____ _______ _____ _____ _____ ____ _____ _____ _____ _____ ______ ______ ______ ______ ______ ______ ________ ______ _____ ______ ______ ____ _____ _____ ____ ____
Unweighted Base 1407 675 732 416 359 364 268 1049 104 173 25 437 526 382 437 549 421 537 505 113 543 864 388 719 300 548 846
Weighted Base 1407 687 720 383 345 382 297 938 208 169 26 450 521 408 385 593 429 547 532 108 481 926 395 742 270 679 704
Open new investigations 441 221 220 175 125 105 36 254 90 72 6 109 216 107 163 198 80 226 116 32 139 302 165 207 69 204 235
31% 32% 31% 46% 36% 27% 12% 27% 43% 43% 24% 24% 41% 26% 42% 33% 19% 41% 22% 30% 29% 33% 42% 28% 26% 30% 33%
Wait for the Mueller submits 966 466 500 208 220 277 261 685 118 97 20 342 305 301 222 395 349 321 415 76 342 624 231 534 201 475 469
his final report 69% 68% 69% 54% 64% 73% 88% 73% 57% 57% 76% 76% 59% 74% 58% 67% 81% 59% 78% 70% 71% 67% 58% 72% 74% 70% 67%
Sigma 1407 687 720 383 345 382 297 938 208 169 26 450 521 408 385 593 429 547 532 108 481 926 395 742 270 679 704
100% 100% 100% 100% 100% 100% 100% 100% 100% 100% 100% 100% 100% 100% 100% 100% 100% 100% 100% 100% 100% 100% 100% 100% 100% 100% 100%

Page 219
Fielding Period: November 27 - 28, 2018
HCAPS (Filtered on Registered Voters)
Weighted To The U.S. General Adult Population
30 Nov 2018
Table 196
INV511 Do you think the media has been fair or unfair to Donald Trump?
Base: All Respondents
Presidential
Election Candidate
Gender Age Ethnicity Political Party Political Ideology Voted For Education Locale Income
_____________ ______________________ _______________________ ____________________ ____________________ _____________________ _____________ ________________ _________
Colle- Some
Cons- ge Gr- Colle- $75K Less
Hisp- Black Repub- Democ- Indep- Libe- Mode- erva- 3rd ad And ge Or Urb- Subu- Or Than
Total Male Female 18-34 35-49 50-64 65+ White anic /AA Other lican rat endent ral rate tive Clinton Trump Party Higher Less an rban Rural More $75K
______ _____ _______ _____ _____ _____ ____ _____ _____ _____ _____ ______ ______ ______ ______ ______ ______ ________ ______ _____ ______ ______ ____ _____ _____ ____ ____
Unweighted Base 1407 675 732 416 359 364 268 1049 104 173 25 437 526 382 437 549 421 537 505 113 543 864 388 719 300 548 846
Weighted Base 1407 687 720 383 345 382 297 938 208 169 26 450 521 408 385 593 429 547 532 108 481 926 395 742 270 679 704
Fair 739 356 383 205 186 193 155 420 136 133 16 94 442 190 329 327 82 485 81 59 276 463 267 370 102 365 370
53% 52% 53% 54% 54% 51% 52% 45% 65% 79% 60% 21% 85% 47% 85% 55% 19% 89% 15% 55% 57% 50% 68% 50% 38% 54% 53%
Unfair 668 331 337 178 160 188 142 519 72 36 10 356 79 218 56 266 346 62 450 49 205 463 128 372 168 315 334
47% 48% 47% 46% 46% 49% 48% 55% 35% 21% 40% 79% 15% 53% 15% 45% 81% 11% 85% 45% 43% 50% 32% 50% 62% 46% 47%
Sigma 1407 687 720 383 345 382 297 938 208 169 26 450 521 408 385 593 429 547 532 108 481 926 395 742 270 679 704
100% 100% 100% 100% 100% 100% 100% 100% 100% 100% 100% 100% 100% 100% 100% 100% 100% 100% 100% 100% 100% 100% 100% 100% 100% 100% 100%

Page 220
Fielding Period: November 27 - 28, 2018
HCAPS (Filtered on Registered Voters)
Weighted To The U.S. General Adult Population
30 Nov 2018
Table 197
MEDIA1101 Which is closest to your view?
Base: All Respondents
Presidential
Election Candidate
Gender Age Ethnicity Political Party Political Ideology Voted For Education Locale Income
_____________ ______________________ _______________________ ____________________ ____________________ _____________________ _____________ ________________ _________
Colle- Some
Cons- ge Gr- Colle- $75K Less
Hisp- Black Repub- Democ- Indep- Libe- Mode- erva- 3rd ad And ge Or Urb- Subu- Or Than
Total Male Female 18-34 35-49 50-64 65+ White anic /AA Other lican rat endent ral rate tive Clinton Trump Party Higher Less an rban Rural More $75K
______ _____ _______ _____ _____ _____ ____ _____ _____ _____ _____ ______ ______ ______ ______ ______ ______ ________ ______ _____ ______ ______ ____ _____ _____ ____ ____
Unweighted Base 1407 675 732 416 359 364 268 1049 104 173 25 437 526 382 437 549 421 537 505 113 543 864 388 719 300 548 846
Weighted Base 1407 687 720 383 345 382 297 938 208 169 26 450 521 408 385 593 429 547 532 108 481 926 395 742 270 679 704
The White House should be 672 336 336 171 159 201 141 527 69 45 9 360 126 178 93 249 331 99 437 47 209 464 169 351 152 332 323
able to suspend journalists 48% 49% 47% 45% 46% 53% 48% 56% 33% 27% 36% 80% 24% 44% 24% 42% 77% 18% 82% 43% 43% 50% 43% 47% 56% 49% 46%
from the President's Press
Corps if they are
confrontational and
disruptive instead of asking
questions and reporting
Journalists should be able 735 350 384 212 186 181 156 411 139 123 17 90 395 230 293 344 98 448 95 61 273 462 226 390 118 347 382
to engage with the President 52% 51% 53% 55% 54% 47% 52% 44% 67% 73% 64% 20% 76% 56% 76% 58% 23% 82% 18% 57% 57% 50% 57% 53% 44% 51% 54%
and White House officials
freely and in the way they
judge appropriate and should
not be suspended for
challenging officials even
if they are seen as
confrontational or
disruptive
Sigma 1407 687 720 383 345 382 297 938 208 169 26 450 521 408 385 593 429 547 532 108 481 926 395 742 270 679 704
100% 100% 100% 100% 100% 100% 100% 100% 100% 100% 100% 100% 100% 100% 100% 100% 100% 100% 100% 100% 100% 100% 100% 100% 100% 100% 100%

Page 221
Fielding Period: November 27 - 28, 2018
HCAPS (Filtered on Registered Voters)
Weighted To The U.S. General Adult Population
30 Nov 2018
Table 198
QRACE What is your race?
Base: All Respondents
Presidential
Election Candidate
Gender Age Ethnicity Political Party Political Ideology Voted For Education Locale Income
_____________ ______________________ _______________________ ____________________ ____________________ _____________________ _____________ ________________ _________
Colle- Some
Cons- ge Gr- Colle- $75K Less
Hisp- Black Repub- Democ- Indep- Libe- Mode- erva- 3rd ad And ge Or Urb- Subu- Or Than
Total Male Female 18-34 35-49 50-64 65+ White anic /AA Other lican rat endent ral rate tive Clinton Trump Party Higher Less an rban Rural More $75K
______ _____ _______ _____ _____ _____ ____ _____ _____ _____ _____ ______ ______ ______ ______ ______ ______ ________ ______ _____ ______ ______ ____ _____ _____ ____ ____
Unweighted Base 1407 675 732 416 359 364 268 1049 104 173 25 437 526 382 437 549 421 537 505 113 543 864 388 719 300 548 846
Weighted Base 1407 687 720 383 345 382 297 938 208 169 26 450 521 408 385 593 429 547 532 108 481 926 395 742 270 679 704
White 938 478 461 226 199 279 234 938 - - - 369 269 284 237 356 345 286 435 80 334 604 197 527 214 498 421
67% 70% 64% 59% 58% 73% 79% 100% - - - 82% 52% 70% 61% 60% 81% 52% 82% 74% 69% 65% 50% 71% 79% 73% 60%
Black or African American 169 71 98 48 48 38 35 - - 169 - 14 113 40 50 94 25 121 24 7 49 120 77 73 19 62 107
12% 10% 14% 13% 14% 10% 12% - - 100% - 3% 22% 10% 13% 16% 6% 22% 5% 6% 10% 13% 20% 10% 7% 9% 15%
Hispanic, Latino, or Spanish 208 92 116 86 70 37 15 - 208 - - 53 101 51 69 107 32 101 48 14 46 162 100 85 23 69 138
origin 15% 13% 16% 22% 20% 10% 5% - 100% - - 12% 19% 12% 18% 18% 8% 18% 9% 13% 10% 18% 25% 11% 9% 10% 20%
Asian origin (includes 66 33 33 20 22 15 9 - - - - 13 25 25 22 27 16 28 19 5 42 24 16 42 7 41 25
people of Asian Indian, 5% 5% 5% 5% 6% 4% 3% - - - - 3% 5% 6% 6% 5% 4% 5% 4% 4% 9% 3% 4% 6% 3% 6% 3%
Chinese, Korean, Filipino,
and Japanese origin)
Other 26 13 13 2 7 13 4 - - - 26 1 13 8 7 9 9 11 5 3 10 16 5 15 6 11 14
2% 2% 2% 1% 2% 3% 1% - - - 100% * 2% 2% 2% 2% 2% 2% 1% 3% 2% 2% 1% 2% 2% 2% 2%
Sigma 1407 687 720 383 345 382 297 938 208 169 26 450 521 408 385 593 429 547 532 108 481 926 395 742 270 679 704
100% 100% 100% 100% 100% 100% 100% 100% 100% 100% 100% 100% 100% 100% 100% 100% 100% 100% 100% 100% 100% 100% 100% 100% 100% 100% 100%

Page 222
Fielding Period: November 27 - 28, 2018
HCAPS (Filtered on Registered Voters)
Weighted To The U.S. General Adult Population
30 Nov 2018
Table 199
Q410 Which one of the following best describes your employment status?
Base: All Respondents
Presidential
Election Candidate
Gender Age Ethnicity Political Party Political Ideology Voted For Education Locale Income
_____________ ______________________ _______________________ ____________________ ____________________ _____________________ _____________ ________________ _________
Colle- Some
Cons- ge Gr- Colle- $75K Less
Hisp- Black Repub- Democ- Indep- Libe- Mode- erva- 3rd ad And ge Or Urb- Subu- Or Than
Total Male Female 18-34 35-49 50-64 65+ White anic /AA Other lican rat endent ral rate tive Clinton Trump Party Higher Less an rban Rural More $75K
______ _____ _______ _____ _____ _____ ____ _____ _____ _____ _____ ______ ______ ______ ______ ______ ______ ________ ______ _____ ______ ______ ____ _____ _____ ____ ____
Unweighted Base 1407 675 732 416 359 364 268 1049 104 173 25 437 526 382 437 549 421 537 505 113 543 864 388 719 300 548 846
Weighted Base 1407 687 720 383 345 382 297 938 208 169 26 450 521 408 385 593 429 547 532 108 481 926 395 742 270 679 704
Employed full time 612 373 239 188 218 165 41 389 105 73 12 215 216 171 174 250 188 243 260 52 272 340 192 320 100 385 223
44% 54% 33% 49% 63% 43% 14% 41% 50% 43% 48% 48% 41% 42% 45% 42% 44% 44% 49% 48% 56% 37% 49% 43% 37% 57% 32%
Employed part time 155 70 85 64 25 42 24 92 32 18 4 45 69 35 55 67 33 66 53 7 41 114 42 81 32 53 99
11% 10% 12% 17% 7% 11% 8% 10% 15% 11% 17% 10% 13% 9% 14% 11% 8% 12% 10% 7% 8% 12% 11% 11% 12% 8% 14%
Self-employed full time 80 50 31 14 19 31 16 53 3 13 1 16 24 41 19 43 19 31 28 9 29 51 25 34 22 35 44
6% 7% 4% 4% 5% 8% 5% 6% 1% 8% 6% 4% 5% 10% 5% 7% 4% 6% 5% 8% 6% 5% 6% 5% 8% 5% 6%
Not employed, but looking 58 18 41 26 14 12 6 31 9 17 1 11 24 22 15 29 15 24 16 1 13 46 18 28 13 12 47
for work 4% 3% 6% 7% 4% 3% 2% 3% 5% 10% 2% 2% 5% 5% 4% 5% 3% 4% 3% 1% 3% 5% 4% 4% 5% 2% 7%
Not employed and not looking 11 3 8 4 3 4 - 8 1 3 - 3 5 2 2 5 4 3 3 1 3 9 3 6 3 2 8
for work 1% * 1% 1% 1% 1% - 1% * 2% - 1% 1% 1% * 1% 1% 1% 1% * 1% 1% 1% 1% 1% * 1%
Not employed, unable to work 61 24 37 8 18 33 2 42 7 11 1 20 29 12 12 30 19 23 16 4 7 55 15 23 23 8 53
due to a disability or 4% 4% 5% 2% 5% 9% 1% 4% 3% 6% 4% 4% 6% 3% 3% 5% 4% 4% 3% 4% 1% 6% 4% 3% 9% 1% 8%
illness
Retired 264 120 143 - 7 56 201 208 21 29 3 88 103 70 64 99 101 101 101 23 91 172 61 155 48 113 142
19% 18% 20% - 2% 15% 68% 22% 10% 17% 12% 19% 20% 17% 17% 17% 24% 18% 19% 21% 19% 19% 15% 21% 18% 17% 20%
Student 43 17 26 39 2 1 - 27 10 2 - 7 13 20 13 20 10 14 8 1 3 39 16 24 2 20 21
3% 2% 4% 10% 1% * - 3% 5% 1% - 2% 3% 5% 3% 3% 2% 3% 2% 1% 1% 4% 4% 3% 1% 3% 3%
Stay-at-home spouse or 103 5 98 34 36 30 3 74 19 2 3 40 33 26 26 40 37 32 41 8 11 92 16 63 24 45 56
partner 7% 1% 14% 9% 10% 8% 1% 8% 9% 1% 10% 9% 6% 6% 7% 7% 9% 6% 8% 8% 2% 10% 4% 9% 9% 7% 8%
Self-employed part time 19 7 12 5 3 7 4 14 2 1 - 5 4 9 6 10 3 9 5 2 11 8 8 8 3 6 11
1% 1% 2% 1% 1% 2% 1% 1% 1% 1% - 1% 1% 2% 1% 2% 1% 2% 1% 2% 2% 1% 2% 1% 1% 1% 2%
Sigma 1407 687 720 383 345 382 297 938 208 169 26 450 521 408 385 593 429 547 532 108 481 926 395 742 270 679 704
100% 100% 100% 100% 100% 100% 100% 100% 100% 100% 100% 100% 100% 100% 100% 100% 100% 100% 100% 100% 100% 100% 100% 100% 100% 100% 100%

Page 223
Fielding Period: November 27 - 28, 2018
HCAPS (Filtered on Registered Voters)
Weighted To The U.S. General Adult Population
30 Nov 2018
Table 200
D5 The organization you work for is in which of the following?
Base: Employed FT/PT
Presidential
Election Candidate
Gender Age Ethnicity Political Party Political Ideology Voted For Education Locale Income
_____________ ______________________ _______________________ ____________________ ____________________ _____________________ _____________ ________________ _________
Colle- Some
Cons- ge Gr- Colle- $75K Less
Hisp- Black Repub- Democ- Indep- Libe- Mode- erva- 3rd ad And ge Or Urb- Subu- Or Than
Total Male Female 18-34 35-49 50-64 65+ White anic /AA Other lican rat endent ral rate tive Clinton Trump Party Higher Less an rban Rural More $75K
______ _____ _______ _____ _____ _____ ____ _____ _____ _____ _____ ______ ______ ______ ______ ______ ______ ________ ______ _____ ______ ______ ____ _____ _____ ____ ____
Unweighted Base 719 389 330 269 230 173 47 519 60 90 13 247 266 172 246 273 200 275 284 60 334 385 221 369 129 359 357
Weighted Base 767 443 324 252 243 207 65 481 136 91 17 261 284 206 229 317 221 309 314 60 312 455 234 401 132 438 323
Public sector 293 166 127 101 92 77 24 192 41 38 8 92 121 74 91 123 80 115 121 26 116 177 99 141 54 179 110
38% 37% 39% 40% 38% 37% 36% 40% 30% 41% 47% 35% 42% 36% 40% 39% 36% 37% 39% 44% 37% 39% 42% 35% 41% 41% 34%
Private sector 343 222 122 93 112 104 34 220 60 39 6 131 118 90 98 125 120 136 157 27 166 178 106 197 40 209 134
45% 50% 38% 37% 46% 50% 52% 46% 44% 42% 38% 50% 41% 44% 43% 40% 54% 44% 50% 44% 53% 39% 45% 49% 30% 48% 42%
Not-for-profit 56 24 32 20 14 15 6 30 13 8 1 14 23 16 26 21 8 28 19 5 25 31 13 29 14 32 24
7% 5% 10% 8% 6% 7% 10% 6% 9% 9% 7% 5% 8% 8% 11% 7% 4% 9% 6% 9% 8% 7% 6% 7% 10% 7% 7%
Other 34 17 17 18 9 5 1 20 5 3 1 12 11 10 7 23 4 12 8 1 4 30 5 20 9 8 23
4% 4% 5% 7% 4% 3% 2% 4% 4% 4% 6% 4% 4% 5% 3% 7% 2% 4% 2% 2% 1% 7% 2% 5% 7% 2% 7%
Don't know 41 15 26 20 16 5 - 19 17 4 * 11 11 16 7 25 8 18 10 1 2 38 11 15 15 9 32
5% 3% 8% 8% 7% 2% - 4% 13% 4% 2% 4% 4% 8% 3% 8% 4% 6% 3% 1% 1% 8% 5% 4% 12% 2% 10%
Sigma 767 443 324 252 243 207 65 481 136 91 17 261 284 206 229 317 221 309 314 60 312 455 234 401 132 438 323
100% 100% 100% 100% 100% 100% 100% 100% 100% 100% 100% 100% 100% 100% 100% 100% 100% 100% 100% 100% 100% 100% 100% 100% 100% 100% 100%

Page 224
Fielding Period: November 27 - 28, 2018
HCAPS (Filtered on Registered Voters)
Weighted To The U.S. General Adult Population
30 Nov 2018
Table 201
D6 Is anyone in your household a member of a labor union?
Base: All Respondents
Presidential
Election Candidate
Gender Age Ethnicity Political Party Political Ideology Voted For Education Locale Income
_____________ ______________________ _______________________ ____________________ ____________________ _____________________ _____________ ________________ _________
Colle- Some
Cons- ge Gr- Colle- $75K Less
Hisp- Black Repub- Democ- Indep- Libe- Mode- erva- 3rd ad And ge Or Urb- Subu- Or Than
Total Male Female 18-34 35-49 50-64 65+ White anic /AA Other lican rat endent ral rate tive Clinton Trump Party Higher Less an rban Rural More $75K
______ _____ _______ _____ _____ _____ ____ _____ _____ _____ _____ ______ ______ ______ ______ ______ ______ ________ ______ _____ ______ ______ ____ _____ _____ ____ ____
Unweighted Base 1407 675 732 416 359 364 268 1049 104 173 25 437 526 382 437 549 421 537 505 113 543 864 388 719 300 548 846
Weighted Base 1407 687 720 383 345 382 297 938 208 169 26 450 521 408 385 593 429 547 532 108 481 926 395 742 270 679 704
I am a member of a labor 126 81 45 40 40 26 19 93 19 7 3 48 55 19 57 30 39 47 51 18 49 77 43 62 21 79 47
union 9% 12% 6% 11% 12% 7% 7% 10% 9% 4% 11% 11% 11% 5% 15% 5% 9% 9% 10% 17% 10% 8% 11% 8% 8% 12% 7%
Someone else in my household 84 34 50 30 25 21 9 50 16 13 - 25 36 23 30 38 16 44 25 3 28 56 31 37 17 43 42
is a member of a labor union 6% 5% 7% 8% 7% 5% 3% 5% 8% 8% - 6% 7% 6% 8% 6% 4% 8% 5% 3% 6% 6% 8% 5% 6% 6% 6%
Both me and another member 42 24 18 19 16 5 2 18 15 9 - 17 19 6 17 14 11 14 21 2 14 28 14 23 4 32 10
of my household are members 3% 3% 3% 5% 5% 1% 1% 2% 7% 5% - 4% 4% 1% 4% 2% 3% 3% 4% 2% 3% 3% 4% 3% 2% 5% 1%
of a labor union
No one in my household is a 1112 529 583 273 251 325 262 748 152 137 23 342 401 349 271 488 352 428 419 83 380 732 295 601 215 509 583
member of a labor union 79% 77% 81% 71% 73% 85% 88% 80% 73% 81% 89% 76% 77% 85% 70% 82% 82% 78% 79% 77% 79% 79% 75% 81% 80% 75% 83%
Decline to state 43 19 25 21 12 6 4 30 7 4 - 17 10 12 10 23 11 14 15 2 10 33 12 19 13 17 23
3% 3% 3% 5% 4% 1% 1% 3% 3% 2% - 4% 2% 3% 3% 4% 3% 3% 3% 2% 2% 4% 3% 3% 5% 2% 3%
Sigma 1407 687 720 383 345 382 297 938 208 169 26 450 521 408 385 593 429 547 532 108 481 926 395 742 270 679 704
100% 100% 100% 100% 100% 100% 100% 100% 100% 100% 100% 100% 100% 100% 100% 100% 100% 100% 100% 100% 100% 100% 100% 100% 100% 100% 100%

Page 225
Fielding Period: November 27 - 28, 2018
HCAPS (Filtered on Registered Voters)
Weighted To The U.S. General Adult Population
30 Nov 2018
Table 202
Q2146 What is the highest level of education you have completed or the highest degree you have received?
Base: All Respondents
Presidential
Election Candidate
Gender Age Ethnicity Political Party Political Ideology Voted For Education Locale Income
_____________ ______________________ _______________________ ____________________ ____________________ _____________________ _____________ ________________ _________
Colle- Some
Cons- ge Gr- Colle- $75K Less
Hisp- Black Repub- Democ- Indep- Libe- Mode- erva- 3rd ad And ge Or Urb- Subu- Or Than
Total Male Female 18-34 35-49 50-64 65+ White anic /AA Other lican rat endent ral rate tive Clinton Trump Party Higher Less an rban Rural More $75K
______ _____ _______ _____ _____ _____ ____ _____ _____ _____ _____ ______ ______ ______ ______ ______ ______ ________ ______ _____ ______ ______ ____ _____ _____ ____ ____
Unweighted Base 1407 675 732 416 359 364 268 1049 104 173 25 437 526 382 437 549 421 537 505 113 543 864 388 719 300 548 846
Weighted Base 1407 687 720 383 345 382 297 938 208 169 26 450 521 408 385 593 429 547 532 108 481 926 395 742 270 679 704
Less than high school 20 6 14 10 5 5 - 15 - 1 - 5 8 6 5 10 5 7 7 - - 20 1 12 7 6 14
1% 1% 2% 3% 1% 1% - 2% - 1% - 1% 2% 1% 1% 2% 1% 1% 1% - - 2% * 2% 3% 1% 2%
Completed some high school 100 34 66 36 25 23 15 53 28 11 5 24 37 34 24 43 33 38 34 3 - 100 28 44 28 17 83
7% 5% 9% 9% 7% 6% 5% 6% 13% 7% 19% 5% 7% 8% 6% 7% 8% 7% 6% 3% - 11% 7% 6% 10% 3% 12%
High school graduate or 236 101 134 76 65 53 42 145 58 26 1 86 75 69 50 127 59 78 82 10 - 236 76 108 51 53 175
equivalent (e.g., GED) 17% 15% 19% 20% 19% 14% 14% 15% 28% 15% 4% 19% 14% 17% 13% 21% 14% 14% 15% 9% - 25% 19% 15% 19% 8% 25%
Job-specific training 59 17 43 9 10 19 22 46 1 11 - 24 17 17 13 24 23 18 25 7 - 59 13 27 20 16 41
programs after high school 4% 2% 6% 2% 3% 5% 7% 5% 1% 6% - 5% 3% 4% 3% 4% 5% 3% 5% 6% - 6% 3% 4% 7% 2% 6%
Completed some college, but 320 140 180 97 76 98 49 221 49 38 7 95 134 82 88 130 102 121 121 25 - 320 81 175 64 148 167
no degree 23% 20% 25% 25% 22% 26% 16% 24% 23% 23% 27% 21% 26% 20% 23% 22% 24% 22% 23% 23% - 35% 20% 24% 24% 22% 24%
Associate's degree 192 90 101 47 44 57 44 123 27 32 3 64 69 53 47 82 64 76 80 13 - 192 65 92 35 103 89
14% 13% 14% 12% 13% 15% 15% 13% 13% 19% 12% 14% 13% 13% 12% 14% 15% 14% 15% 12% - 21% 16% 12% 13% 15% 13%
College graduate (e.g., 264 164 100 71 66 76 51 183 27 35 5 89 95 80 83 102 79 113 109 21 264 - 77 146 42 168 93
B.A., A.B., B.S.) 19% 24% 14% 19% 19% 20% 17% 20% 13% 20% 20% 20% 18% 20% 22% 17% 18% 21% 20% 20% 55% - 19% 20% 15% 25% 13%
Completed some graduate 33 18 14 7 5 8 12 24 2 2 - 13 10 10 12 9 12 17 12 2 33 - 8 21 3 19 14
school, but no degree 2% 3% 2% 2% 2% 2% 4% 3% 1% 1% - 3% 2% 2% 3% 1% 3% 3% 2% 2% 7% - 2% 3% 1% 3% 2%
Completed graduate school 184 116 68 30 49 43 62 127 17 12 5 50 76 57 63 67 54 79 63 27 184 - 46 117 21 150 29
(e.g., M.S., M.D., Ph.D.) 13% 17% 9% 8% 14% 11% 21% 14% 8% 7% 18% 11% 15% 14% 16% 11% 13% 14% 12% 25% 38% - 12% 16% 8% 22% 4%
Sigma 1407 687 720 383 345 382 297 938 208 169 26 450 521 408 385 593 429 547 532 108 481 926 395 742 270 679 704
100% 100% 100% 100% 100% 100% 100% 100% 100% 100% 100% 100% 100% 100% 100% 100% 100% 100% 100% 100% 100% 100% 100% 100% 100% 100% 100%

Page 226
Fielding Period: November 27 - 28, 2018
HCAPS (Filtered on Registered Voters)
Weighted To The U.S. General Adult Population
30 Nov 2018
Table 203
Q2135 What is your marital status?
Base: All Respondents
Presidential
Election Candidate
Gender Age Ethnicity Political Party Political Ideology Voted For Education Locale Income
_____________ ______________________ _______________________ ____________________ ____________________ _____________________ _____________ ________________ _________
Colle- Some
Cons- ge Gr- Colle- $75K Less
Hisp- Black Repub- Democ- Indep- Libe- Mode- erva- 3rd ad And ge Or Urb- Subu- Or Than
Total Male Female 18-34 35-49 50-64 65+ White anic /AA Other lican rat endent ral rate tive Clinton Trump Party Higher Less an rban Rural More $75K
______ _____ _______ _____ _____ _____ ____ _____ _____ _____ _____ ______ ______ ______ ______ ______ ______ ________ ______ _____ ______ ______ ____ _____ _____ ____ ____
Unweighted Base 1407 675 732 416 359 364 268 1049 104 173 25 437 526 382 437 549 421 537 505 113 543 864 388 719 300 548 846
Weighted Base 1407 687 720 383 345 382 297 938 208 169 26 450 521 408 385 593 429 547 532 108 481 926 395 742 270 679 704
Married or civil union 687 345 342 138 178 205 167 493 87 57 12 270 224 184 173 258 256 240 321 55 301 386 164 392 131 437 235
49% 50% 48% 36% 51% 54% 56% 52% 42% 34% 47% 60% 43% 45% 45% 43% 60% 44% 60% 51% 63% 42% 42% 53% 48% 64% 33%
Single, never married 395 204 191 206 98 68 23 213 91 71 2 86 171 128 126 197 72 184 105 23 90 305 138 192 65 131 262
28% 30% 27% 54% 28% 18% 8% 23% 44% 42% 7% 19% 33% 31% 33% 33% 17% 34% 20% 22% 19% 33% 35% 26% 24% 19% 37%
Divorced 164 67 97 3 33 69 59 123 12 17 7 48 60 49 39 75 49 64 57 7 48 115 44 76 43 50 114
12% 10% 13% 1% 10% 18% 20% 13% 6% 10% 27% 11% 12% 12% 10% 13% 11% 12% 11% 6% 10% 12% 11% 10% 16% 7% 16%
Separated 23 11 12 5 8 6 5 17 - 4 - 10 8 6 7 4 13 6 10 4 4 20 3 15 5 8 14
2% 2% 2% 1% 2% 1% 2% 2% - 2% - 2% 2% 1% 2% 1% 3% 1% 2% 4% 1% 2% 1% 2% 2% 1% 2%
Widowed/Widower 63 24 39 * 1 25 37 45 1 13 4 18 27 16 20 24 19 22 17 11 20 43 18 32 14 20 41
4% 4% 5% * * 7% 12% 5% 1% 8% 16% 4% 5% 4% 5% 4% 4% 4% 3% 10% 4% 5% 4% 4% 5% 3% 6%
Living with partner 74 36 39 30 28 10 7 48 16 7 1 18 29 25 20 35 19 31 20 8 17 57 28 34 12 35 39
5% 5% 5% 8% 8% 3% 2% 5% 8% 4% 2% 4% 6% 6% 5% 6% 4% 6% 4% 8% 4% 6% 7% 5% 5% 5% 5%
Sigma 1407 687 720 383 345 382 297 938 208 169 26 450 521 408 385 593 429 547 532 108 481 926 395 742 270 679 704
100% 100% 100% 100% 100% 100% 100% 100% 100% 100% 100% 100% 100% 100% 100% 100% 100% 100% 100% 100% 100% 100% 100% 100% 100% 100% 100%

Page 227
Fielding Period: November 27 - 28, 2018
HCAPS (Filtered on Registered Voters)
Weighted To The U.S. General Adult Population
30 Nov 2018
Table 204
D9 How many children live in your household?
Base: All Respondents
Presidential
Election Candidate
Gender Age Ethnicity Political Party Political Ideology Voted For Education Locale Income
_____________ ______________________ _______________________ ____________________ ____________________ _____________________ _____________ ________________ _________
Colle- Some
Cons- ge Gr- Colle- $75K Less
Hisp- Black Repub- Democ- Indep- Libe- Mode- erva- 3rd ad And ge Or Urb- Subu- Or Than
Total Male Female 18-34 35-49 50-64 65+ White anic /AA Other lican rat endent ral rate tive Clinton Trump Party Higher Less an rban Rural More $75K
______ _____ _______ _____ _____ _____ ____ _____ _____ _____ _____ ______ ______ ______ ______ ______ ______ ________ ______ _____ ______ ______ ____ _____ _____ ____ ____
Unweighted Base 1407 675 732 416 359 364 268 1049 104 173 25 437 526 382 437 549 421 537 505 113 543 864 388 719 300 548 846
Weighted Base 1407 687 720 383 345 382 297 938 208 169 26 450 521 408 385 593 429 547 532 108 481 926 395 742 270 679 704
None 780 404 375 164 119 253 244 559 78 89 17 239 283 243 203 331 245 299 291 62 268 511 192 429 158 357 409
55% 59% 52% 43% 34% 66% 82% 60% 38% 53% 65% 53% 54% 60% 53% 56% 57% 55% 55% 57% 56% 55% 49% 58% 59% 52% 58%
One 250 124 126 85 70 60 35 163 42 36 2 89 98 59 81 102 67 101 95 17 98 152 83 124 43 115 132
18% 18% 18% 22% 20% 16% 12% 17% 20% 21% 8% 20% 19% 14% 21% 17% 16% 18% 18% 15% 20% 16% 21% 17% 16% 17% 19%
Two 244 114 130 90 91 50 14 146 49 32 1 85 88 66 67 100 78 90 101 19 74 170 78 125 41 145 93
17% 17% 18% 23% 26% 13% 5% 16% 23% 19% 4% 19% 17% 16% 17% 17% 18% 16% 19% 17% 15% 18% 20% 17% 15% 21% 13%
Three 70 28 42 26 32 10 2 40 18 4 3 21 31 14 18 30 21 31 20 7 30 40 17 42 10 29 39
5% 4% 6% 7% 9% 3% 1% 4% 9% 3% 12% 5% 6% 4% 5% 5% 5% 6% 4% 6% 6% 4% 4% 6% 4% 4% 6%
Four or more 64 17 47 18 34 9 3 31 22 8 3 16 20 26 17 30 17 26 25 4 12 52 25 22 17 33 31
5% 2% 7% 5% 10% 2% 1% 3% 10% 5% 10% 4% 4% 6% 4% 5% 4% 5% 5% 4% 2% 6% 6% 3% 6% 5% 4%
Sigma 1407 687 720 383 345 382 297 938 208 169 26 450 521 408 385 593 429 547 532 108 481 926 395 742 270 679 704
100% 100% 100% 100% 100% 100% 100% 100% 100% 100% 100% 100% 100% 100% 100% 100% 100% 100% 100% 100% 100% 100% 100% 100% 100% 100% 100%

Page 228
Fielding Period: November 27 - 28, 2018
HCAPS (Filtered on Registered Voters)
Weighted To The U.S. General Adult Population
30 Nov 2018
Table 205
M12 Which best describes your political ideology?
Base: All Respondents
Presidential
Election Candidate
Gender Age Ethnicity Political Party Political Ideology Voted For Education Locale Income
_____________ ______________________ _______________________ ____________________ ____________________ _____________________ _____________ ________________ _________
Colle- Some
Cons- ge Gr- Colle- $75K Less
Hisp- Black Repub- Democ- Indep- Libe- Mode- erva- 3rd ad And ge Or Urb- Subu- Or Than
Total Male Female 18-34 35-49 50-64 65+ White anic /AA Other lican rat endent ral rate tive Clinton Trump Party Higher Less an rban Rural More $75K
______ _____ _______ _____ _____ _____ ____ _____ _____ _____ _____ ______ ______ ______ ______ ______ ______ ________ ______ _____ ______ ______ ____ _____ _____ ____ ____
Unweighted Base 1407 675 732 416 359 364 268 1049 104 173 25 437 526 382 437 549 421 537 505 113 543 864 388 719 300 548 846
Weighted Base 1407 687 720 383 345 382 297 938 208 169 26 450 521 408 385 593 429 547 532 108 481 926 395 742 270 679 704
Liberal (Net) 385 177 208 120 103 81 82 237 69 50 7 41 280 61 385 - - 277 47 18 159 227 128 208 50 213 171
27% 26% 29% 31% 30% 21% 27% 25% 33% 29% 28% 9% 54% 15% 100% - - 51% 9% 17% 33% 24% 32% 28% 18% 31% 24%
Strong liberal 203 94 109 67 55 40 41 122 37 29 2 19 158 26 203 - - 152 31 8 77 127 72 108 23 113 89
14% 14% 15% 18% 16% 10% 14% 13% 18% 17% 8% 4% 30% 6% 53% - - 28% 6% 7% 16% 14% 18% 15% 9% 17% 13%
Lean liberal 182 84 99 53 48 41 40 114 32 21 5 23 122 36 182 - - 125 16 11 82 100 56 100 27 100 82
13% 12% 14% 14% 14% 11% 14% 12% 15% 12% 20% 5% 23% 9% 47% - - 23% 3% 10% 17% 11% 14% 13% 10% 15% 12%
Moderate 593 269 324 180 141 159 112 356 107 94 9 108 194 269 - 593 - 229 185 51 178 415 185 302 107 248 337
42% 39% 45% 47% 41% 42% 38% 38% 51% 56% 35% 24% 37% 66% - 100% - 42% 35% 47% 37% 45% 47% 41% 39% 36% 48%
Conservative (Net) 429 240 188 82 101 142 103 345 32 25 9 301 47 78 - - 429 40 299 39 144 284 83 232 114 218 196
30% 35% 26% 21% 29% 37% 35% 37% 16% 15% 37% 67% 9% 19% - - 100% 7% 56% 36% 30% 31% 21% 31% 42% 32% 28%
Lean conservative 210 118 92 41 38 68 63 159 17 14 7 127 30 52 - - 210 28 130 22 76 134 42 111 57 111 88
15% 17% 13% 11% 11% 18% 21% 17% 8% 9% 28% 28% 6% 13% - - 49% 5% 24% 20% 16% 14% 11% 15% 21% 16% 12%
Strong conservative 218 122 96 40 64 73 41 186 15 11 2 174 17 26 - - 218 12 169 18 68 150 41 121 57 107 108
16% 18% 13% 11% 19% 19% 14% 20% 7% 7% 9% 39% 3% 6% - - 51% 2% 32% 16% 14% 16% 10% 16% 21% 16% 15%
Sigma 1407 687 720 383 345 382 297 938 208 169 26 450 521 408 385 593 429 547 532 108 481 926 395 742 270 679 704
100% 100% 100% 100% 100% 100% 100% 100% 100% 100% 100% 100% 100% 100% 100% 100% 100% 100% 100% 100% 100% 100% 100% 100% 100% 100% 100%

Page 229
Fielding Period: November 27 - 28, 2018
HCAPS (Filtered on Registered Voters)
Weighted To The U.S. General Adult Population
30 Nov 2018
Table 206
M13 Do you think of yourself as fiscally liberal or conservative?
Base: All Respondents
Presidential
Election Candidate
Gender Age Ethnicity Political Party Political Ideology Voted For Education Locale Income
_____________ ______________________ _______________________ ____________________ ____________________ _____________________ _____________ ________________ _________
Colle- Some
Cons- ge Gr- Colle- $75K Less
Hisp- Black Repub- Democ- Indep- Libe- Mode- erva- 3rd ad And ge Or Urb- Subu- Or Than
Total Male Female 18-34 35-49 50-64 65+ White anic /AA Other lican rat endent ral rate tive Clinton Trump Party Higher Less an rban Rural More $75K
______ _____ _______ _____ _____ _____ ____ _____ _____ _____ _____ ______ ______ ______ ______ ______ ______ ________ ______ _____ ______ ______ ____ _____ _____ ____ ____
Unweighted Base 1407 675 732 416 359 364 268 1049 104 173 25 437 526 382 437 549 421 537 505 113 543 864 388 719 300 548 846
Weighted Base 1407 687 720 383 345 382 297 938 208 169 26 450 521 408 385 593 429 547 532 108 481 926 395 742 270 679 704
Fiscally liberal 263 139 125 101 75 52 36 145 56 41 5 46 170 47 208 48 7 186 49 9 95 169 109 123 32 135 128
19% 20% 17% 26% 22% 14% 12% 15% 27% 24% 18% 10% 33% 11% 54% 8% 2% 34% 9% 8% 20% 18% 28% 17% 12% 20% 18%
Fiscally conservative 700 378 322 153 162 214 171 511 78 67 9 335 169 189 82 250 369 181 382 69 290 410 153 403 144 388 301
50% 55% 45% 40% 47% 56% 58% 54% 37% 40% 36% 75% 32% 46% 21% 42% 86% 33% 72% 64% 60% 44% 39% 54% 53% 57% 43%
Do not lean one way or the 444 170 274 128 109 116 90 282 75 60 12 69 182 172 96 296 53 180 100 30 96 347 133 216 95 156 275
other 32% 25% 38% 34% 32% 30% 30% 30% 36% 36% 46% 15% 35% 42% 25% 50% 12% 33% 19% 28% 20% 37% 34% 29% 35% 23% 39%
Sigma 1407 687 720 383 345 382 297 938 208 169 26 450 521 408 385 593 429 547 532 108 481 926 395 742 270 679 704
100% 100% 100% 100% 100% 100% 100% 100% 100% 100% 100% 100% 100% 100% 100% 100% 100% 100% 100% 100% 100% 100% 100% 100% 100% 100% 100%

Page 230
Fielding Period: November 27 - 28, 2018
HCAPS (Filtered on Registered Voters)
Weighted To The U.S. General Adult Population
30 Nov 2018
Table 207
M14 Do you think of yourself as socially liberal or conservative?
Base: All Respondents
Presidential
Election Candidate
Gender Age Ethnicity Political Party Political Ideology Voted For Education Locale Income
_____________ ______________________ _______________________ ____________________ ____________________ _____________________ _____________ ________________ _________
Colle- Some
Cons- ge Gr- Colle- $75K Less
Hisp- Black Repub- Democ- Indep- Libe- Mode- erva- 3rd ad And ge Or Urb- Subu- Or Than
Total Male Female 18-34 35-49 50-64 65+ White anic /AA Other lican rat endent ral rate tive Clinton Trump Party Higher Less an rban Rural More $75K
______ _____ _______ _____ _____ _____ ____ _____ _____ _____ _____ ______ ______ ______ ______ ______ ______ ________ ______ _____ ______ ______ ____ _____ _____ ____ ____
Unweighted Base 1407 675 732 416 359 364 268 1049 104 173 25 437 526 382 437 549 421 537 505 113 543 864 388 719 300 548 846
Weighted Base 1407 687 720 383 345 382 297 938 208 169 26 450 521 408 385 593 429 547 532 108 481 926 395 742 270 679 704
Socially liberal 491 256 235 152 107 131 100 303 95 58 8 76 285 124 318 140 33 317 88 37 211 280 169 265 57 280 209
35% 37% 33% 40% 31% 34% 34% 32% 46% 34% 29% 17% 55% 30% 82% 24% 8% 58% 17% 34% 44% 30% 43% 36% 21% 41% 30%
Socially conservative 529 276 253 121 132 152 124 383 63 50 9 302 99 124 28 161 339 106 327 36 173 356 120 285 124 265 257
38% 40% 35% 32% 38% 40% 42% 41% 30% 29% 36% 67% 19% 30% 7% 27% 79% 19% 61% 33% 36% 38% 30% 38% 46% 39% 36%
Do not lean one way or the 388 155 233 109 107 99 73 252 50 61 9 72 136 160 39 292 57 124 117 36 98 290 107 192 89 135 238
other 28% 23% 32% 28% 31% 26% 25% 27% 24% 36% 35% 16% 26% 39% 10% 49% 13% 23% 22% 33% 20% 31% 27% 26% 33% 20% 34%
Sigma 1407 687 720 383 345 382 297 938 208 169 26 450 521 408 385 593 429 547 532 108 481 926 395 742 270 679 704
100% 100% 100% 100% 100% 100% 100% 100% 100% 100% 100% 100% 100% 100% 100% 100% 100% 100% 100% 100% 100% 100% 100% 100% 100% 100% 100%

Page 231
Fielding Period: November 27 - 28, 2018
HCAPS (Filtered on Registered Voters)
Weighted To The U.S. General Adult Population
30 Nov 2018
Table 208
S3 Some people had the chance to vote in the last presidential election on November 8, 2016. Others did not. Did you vote
in November's presidential election?
Base: All Respondents
Presidential
Election Candidate
Gender Age Ethnicity Political Party Political Ideology Voted For Education Locale Income
_____________ ______________________ _______________________ ____________________ ____________________ _____________________ _____________ ________________ _________
Colle- Some
Cons- ge Gr- Colle- $75K Less
Hisp- Black Repub- Democ- Indep- Libe- Mode- erva- 3rd ad And ge Or Urb- Subu- Or Than
Total Male Female 18-34 35-49 50-64 65+ White anic /AA Other lican rat endent ral rate tive Clinton Trump Party Higher Less an rban Rural More $75K
______ _____ _______ _____ _____ _____ ____ _____ _____ _____ _____ ______ ______ ______ ______ ______ ______ ________ ______ _____ ______ ______ ____ _____ _____ ____ ____
Unweighted Base 1407 675 732 416 359 364 268 1049 104 173 25 437 526 382 437 549 421 537 505 113 543 864 388 719 300 548 846
Weighted Base 1407 687 720 383 345 382 297 938 208 169 26 450 521 408 385 593 429 547 532 108 481 926 395 742 270 679 704
Yes 1211 616 595 304 305 336 265 814 170 154 19 407 464 324 350 477 384 547 532 108 447 764 347 638 226 619 570
86% 90% 83% 80% 88% 88% 89% 87% 82% 91% 74% 90% 89% 79% 91% 80% 90% 100% 100% 100% 93% 83% 88% 86% 84% 91% 81%
No 196 71 125 78 40 45 32 124 38 15 7 43 56 84 35 116 45 - - - 34 162 48 104 44 61 135
14% 10% 17% 20% 12% 12% 11% 13% 18% 9% 26% 10% 11% 21% 9% 20% 10% - - - 7% 17% 12% 14% 16% 9% 19%
Sigma 1407 687 720 383 345 382 297 938 208 169 26 450 521 408 385 593 429 547 532 108 481 926 395 742 270 679 704
100% 100% 100% 100% 100% 100% 100% 100% 100% 100% 100% 100% 100% 100% 100% 100% 100% 100% 100% 100% 100% 100% 100% 100% 100% 100% 100%

Page 232
Fielding Period: November 27 - 28, 2018
HCAPS (Filtered on Registered Voters)
Weighted To The U.S. General Adult Population
30 Nov 2018
Table 209
S4 Some people had the chance to vote in the 2016 presidential election. Others did not.
Who did you vote for in the 2016 presidential election on November 8, 2016?
Base: Voted In Presidential Election
Presidential
Election Candidate
Gender Age Ethnicity Political Party Political Ideology Voted For Education Locale Income
_____________ ______________________ _______________________ ____________________ ____________________ _____________________ _____________ ________________ _________
Colle- Some
Cons- ge Gr- Colle- $75K Less
Hisp- Black Repub- Democ- Indep- Libe- Mode- erva- 3rd ad And ge Or Urb- Subu- Or Than
Total Male Female 18-34 35-49 50-64 65+ White anic /AA Other lican rat endent ral rate tive Clinton Trump Party Higher Less an rban Rural More $75K
______ _____ _______ _____ _____ _____ ____ _____ _____ _____ _____ ______ ______ ______ ______ ______ ______ ________ ______ _____ ______ ______ ____ _____ _____ ____ ____
Unweighted Base 1179 587 592 331 299 312 237 882 81 154 18 390 464 292 385 424 370 537 505 113 490 689 326 610 243 494 673
Weighted Base 1211 616 595 304 305 336 265 814 170 154 19 407 464 324 350 477 384 547 532 108 447 764 347 638 226 619 570
Hillary Clinton 547 257 290 144 139 131 134 286 101 121 11 27 397 119 277 229 40 547 - - 209 339 192 281 75 263 281
45% 42% 49% 47% 46% 39% 50% 35% 59% 78% 58% 7% 85% 37% 79% 48% 11% 100% - - 47% 44% 55% 44% 33% 43% 49%
Donald Trump 532 292 239 120 140 161 110 435 48 24 5 354 33 142 47 185 299 - 532 - 184 348 131 272 129 288 229
44% 47% 40% 40% 46% 48% 41% 53% 28% 16% 25% 87% 7% 44% 13% 39% 78% - 100% - 41% 46% 38% 43% 57% 46% 40%
Gary Johnson 40 28 12 16 8 6 10 32 7 1 - 14 8 18 5 20 15 - - 40 22 17 6 24 10 20 18
3% 4% 2% 5% 2% 2% 4% 4% 4% 1% - 3% 2% 6% 2% 4% 4% - - 37% 5% 2% 2% 4% 4% 3% 3%
Jill Stein 21 10 11 5 4 10 2 10 5 3 * 1 5 14 9 9 4 - - 21 13 9 10 10 1 13 8
2% 2% 2% 2% 1% 3% 1% 1% 3% 2% 1% * 1% 4% 3% 2% 1% - - 20% 3% 1% 3% 2% 1% 2% 1%
Other 47 24 23 10 12 19 6 38 2 2 3 11 12 19 4 23 21 - - 47 16 32 7 36 4 24 21
4% 4% 4% 3% 4% 6% 2% 5% 1% 2% 15% 3% 3% 6% 1% 5% 5% - - 44% 3% 4% 2% 6% 2% 4% 4%
Prefer not to answer 24 4 19 9 2 10 3 13 7 3 - 1 10 12 7 11 5 - - - 4 19 3 14 7 11 12
2% 1% 3% 3% 1% 3% 1% 2% 4% 2% - * 2% 4% 2% 2% 1% - - - 1% 3% 1% 2% 3% 2% 2%
Sigma 1211 616 595 304 305 336 265 814 170 154 19 407 464 324 350 477 384 547 532 108 447 764 347 638 226 619 570
100% 100% 100% 100% 100% 100% 100% 100% 100% 100% 100% 100% 100% 100% 100% 100% 100% 100% 100% 100% 100% 100% 100% 100% 100% 100% 100%

Page 233
Fielding Period: November 27 - 28, 2018
HCAPS (Filtered on Registered Voters)
Weighted To The U.S. General Adult Population
30 Nov 2018
Table 210
S4A In casting your vote, what was most important to you - the candidate's likeability or their stand on the issues?
Base: Voted In Presidential Election
Presidential
Election Candidate
Gender Age Ethnicity Political Party Political Ideology Voted For Education Locale Income
_____________ ______________________ _______________________ ____________________ ____________________ _____________________ _____________ ________________ _________
Colle- Some
Cons- ge Gr- Colle- $75K Less
Hisp- Black Repub- Democ- Indep- Libe- Mode- erva- 3rd ad And ge Or Urb- Subu- Or Than
Total Male Female 18-34 35-49 50-64 65+ White anic /AA Other lican rat endent ral rate tive Clinton Trump Party Higher Less an rban Rural More $75K
______ _____ _______ _____ _____ _____ ____ _____ _____ _____ _____ ______ ______ ______ ______ ______ ______ ________ ______ _____ ______ ______ ____ _____ _____ ____ ____
Unweighted Base 1179 587 592 331 299 312 237 882 81 154 18 390 464 292 385 424 370 537 505 113 490 689 326 610 243 494 673
Weighted Base 1211 616 595 304 305 336 265 814 170 154 19 407 464 324 350 477 384 547 532 108 447 764 347 638 226 619 570
Likeability 189 105 85 99 57 26 7 118 37 29 * 67 71 49 69 89 32 85 87 15 66 123 100 68 21 94 96
16% 17% 14% 33% 19% 8% 3% 14% 22% 19% 2% 16% 15% 15% 20% 19% 8% 16% 16% 14% 15% 16% 29% 11% 9% 15% 17%
Their stand on the issues 1021 511 510 205 249 310 258 696 133 125 19 340 393 275 282 388 352 462 445 93 381 641 247 570 204 525 474
84% 83% 86% 67% 81% 92% 97% 86% 78% 81% 98% 84% 85% 85% 80% 81% 92% 84% 84% 86% 85% 84% 71% 89% 91% 85% 83%
Sigma 1211 616 595 304 305 336 265 814 170 154 19 407 464 324 350 477 384 547 532 108 447 764 347 638 226 619 570
100% 100% 100% 100% 100% 100% 100% 100% 100% 100% 100% 100% 100% 100% 100% 100% 100% 100% 100% 100% 100% 100% 100% 100% 100% 100% 100%

Page 234
Fielding Period: November 27 - 28, 2018
HCAPS (Filtered on Registered Voters)
Weighted To The U.S. General Adult Population
30 Nov 2018
Table 211
D11 What is your religion?
Base: All Respondents
Presidential
Election Candidate
Gender Age Ethnicity Political Party Political Ideology Voted For Education Locale Income
_____________ ______________________ _______________________ ____________________ ____________________ _____________________ _____________ ________________ _________
Colle- Some
Cons- ge Gr- Colle- $75K Less
Hisp- Black Repub- Democ- Indep- Libe- Mode- erva- 3rd ad And ge Or Urb- Subu- Or Than
Total Male Female 18-34 35-49 50-64 65+ White anic /AA Other lican rat endent ral rate tive Clinton Trump Party Higher Less an rban Rural More $75K
______ _____ _______ _____ _____ _____ ____ _____ _____ _____ _____ ______ ______ ______ ______ ______ ______ ________ ______ _____ ______ ______ ____ _____ _____ ____ ____
Unweighted Base 1407 675 732 416 359 364 268 1049 104 173 25 437 526 382 437 549 421 537 505 113 543 864 388 719 300 548 846
Weighted Base 1407 687 720 383 345 382 297 938 208 169 26 450 521 408 385 593 429 547 532 108 481 926 395 742 270 679 704
Evangelical Protestant 162 83 79 30 33 58 42 113 10 32 - 85 50 27 32 38 92 49 87 8 59 103 41 79 43 68 95
12% 12% 11% 8% 10% 15% 14% 12% 5% 19% - 19% 10% 7% 8% 6% 22% 9% 16% 7% 12% 11% 10% 11% 16% 10% 13%
Non-Evangelical Protestant 126 67 59 18 16 49 44 98 4 22 - 49 37 40 27 49 50 45 63 8 56 70 30 71 25 70 55
9% 10% 8% 5% 5% 13% 15% 10% 2% 13% - 11% 7% 10% 7% 8% 12% 8% 12% 8% 12% 8% 8% 10% 9% 10% 8%
Roman Catholic 353 183 170 91 92 93 77 234 89 13 7 114 150 87 105 159 90 140 136 21 128 226 119 193 41 195 153
25% 27% 24% 24% 27% 24% 26% 25% 43% 8% 28% 25% 29% 21% 27% 27% 21% 26% 26% 20% 26% 24% 30% 26% 15% 29% 22%
Mormon 20 13 7 8 5 2 4 17 - 1 - 10 2 7 3 8 9 3 8 5 11 9 3 13 4 13 7
1% 2% 1% 2% 2% 1% 1% 2% - 1% - 2% * 2% 1% 1% 2% * 2% 5% 2% 1% 1% 2% 1% 2% 1%
Other Christian 281 109 172 92 93 56 40 170 45 53 3 110 82 84 47 136 98 93 112 19 66 215 85 122 74 113 164
20% 16% 24% 24% 27% 15% 14% 18% 22% 32% 10% 25% 16% 21% 12% 23% 23% 17% 21% 17% 14% 23% 21% 16% 27% 17% 23%
Jewish 57 26 31 6 5 17 29 53 2 1 - 15 30 11 25 24 9 31 17 3 36 21 11 44 2 42 15
4% 4% 4% 1% 2% 4% 10% 6% 1% 1% - 3% 6% 3% 6% 4% 2% 6% 3% 3% 7% 2% 3% 6% 1% 6% 2%
Muslim 5 3 2 4 1 - - 2 1 1 - 1 2 1 2 3 - 1 - 2 * 4 1 3 - * 4
* * * 1% * - - * * 1% - * * * 1% * - * - 2% * * * * - * 1%
Hindu 2 2 - 1 1 - - * - - - 1 1 - * 2 - - 2 - 2 * 1 1 - 1 1
* * - * * - - * - - - * * - * * - - * - * * * * - * *
Buddhist 13 7 6 3 2 6 1 5 - 3 3 1 8 4 5 8 - 7 2 3 8 5 4 8 1 10 2
1% 1% 1% 1% 1% 2% * 1% - 2% 10% * 2% 1% 1% 1% - 1% * 3% 2% 1% 1% 1% * 2% *
Atheist/Agnostic 183 113 70 68 46 35 33 120 32 14 2 20 84 73 85 71 27 103 34 24 66 117 36 120 27 110 73
13% 17% 10% 18% 13% 9% 11% 13% 15% 8% 9% 5% 16% 18% 22% 12% 6% 19% 6% 22% 14% 13% 9% 16% 10% 16% 10%
Other 205 80 124 62 50 66 26 125 26 28 11 43 76 73 55 97 52 75 70 15 50 155 64 88 53 56 136
15% 12% 17% 16% 14% 17% 9% 13% 13% 17% 43% 9% 15% 18% 14% 16% 12% 14% 13% 14% 10% 17% 16% 12% 20% 8% 19%
Sigma 1407 687 720 383 345 382 297 938 208 169 26 450 521 408 385 593 429 547 532 108 481 926 395 742 270 679 704
100% 100% 100% 100% 100% 100% 100% 100% 100% 100% 100% 100% 100% 100% 100% 100% 100% 100% 100% 100% 100% 100% 100% 100% 100% 100% 100%

Page 235
Fielding Period: November 27 - 28, 2018
HCAPS (Filtered on Registered Voters)
Weighted To The U.S. General Adult Population
30 Nov 2018
Table 212
D12 How often do you attend religion services, events, or gatherings?
Base: All Respondents
Presidential
Election Candidate
Gender Age Ethnicity Political Party Political Ideology Voted For Education Locale Income
_____________ ______________________ _______________________ ____________________ ____________________ _____________________ _____________ ________________ _________
Colle- Some
Cons- ge Gr- Colle- $75K Less
Hisp- Black Repub- Democ- Indep- Libe- Mode- erva- 3rd ad And ge Or Urb- Subu- Or Than
Total Male Female 18-34 35-49 50-64 65+ White anic /AA Other lican rat endent ral rate tive Clinton Trump Party Higher Less an rban Rural More $75K
______ _____ _______ _____ _____ _____ ____ _____ _____ _____ _____ ______ ______ ______ ______ ______ ______ ________ ______ _____ ______ ______ ____ _____ _____ ____ ____
Unweighted Base 1407 675 732 416 359 364 268 1049 104 173 25 437 526 382 437 549 421 537 505 113 543 864 388 719 300 548 846
Weighted Base 1407 687 720 383 345 382 297 938 208 169 26 450 521 408 385 593 429 547 532 108 481 926 395 742 270 679 704
Daily 44 24 20 27 8 5 5 30 8 6 - 21 18 4 24 10 10 11 24 6 14 30 22 17 5 25 19
3% 3% 3% 7% 2% 1% 2% 3% 4% 4% - 5% 3% 1% 6% 2% 2% 2% 5% 6% 3% 3% 6% 2% 2% 4% 3%
Weekly 338 156 182 84 83 84 87 212 38 67 6 141 110 84 75 129 135 123 158 23 152 186 104 170 64 175 158
24% 23% 25% 22% 24% 22% 29% 23% 18% 40% 23% 31% 21% 21% 19% 22% 31% 22% 30% 21% 32% 20% 26% 23% 24% 26% 22%
A few times per month 166 82 84 59 51 37 18 92 44 24 1 54 64 48 40 82 44 57 66 9 47 119 48 77 41 68 92
12% 12% 12% 15% 15% 10% 6% 10% 21% 14% 2% 12% 12% 12% 10% 14% 10% 11% 12% 9% 10% 13% 12% 10% 15% 10% 13%
Once a month 131 63 68 35 37 32 26 89 21 11 - 49 55 25 28 64 39 51 50 7 45 86 37 68 26 57 74
9% 9% 9% 9% 11% 9% 9% 10% 10% 7% - 11% 11% 6% 7% 11% 9% 9% 9% 6% 9% 9% 9% 9% 10% 8% 10%
Almost never 728 361 366 177 166 223 161 516 98 60 19 185 274 247 219 308 201 304 233 63 223 505 183 410 134 354 362
52% 53% 51% 46% 48% 59% 54% 55% 47% 36% 74% 41% 53% 61% 57% 52% 47% 56% 44% 58% 46% 55% 46% 55% 50% 52% 51%
Sigma 1407 687 720 383 345 382 297 938 208 169 26 450 521 408 385 593 429 547 532 108 481 926 395 742 270 679 704
100% 100% 100% 100% 100% 100% 100% 100% 100% 100% 100% 100% 100% 100% 100% 100% 100% 100% 100% 100% 100% 100% 100% 100% 100% 100% 100%

Page 236
Fielding Period: November 27 - 28, 2018
HCAPS (Filtered on Registered Voters)
Weighted To The U.S. General Adult Population
30 Nov 2018
Table 213
D13 How important or unimportant is religion in your life?
Base: All Respondents
Presidential
Election Candidate
Gender Age Ethnicity Political Party Political Ideology Voted For Education Locale Income
_____________ ______________________ _______________________ ____________________ ____________________ _____________________ _____________ ________________ _________
Colle- Some
Cons- ge Gr- Colle- $75K Less
Hisp- Black Repub- Democ- Indep- Libe- Mode- erva- 3rd ad And ge Or Urb- Subu- Or Than
Total Male Female 18-34 35-49 50-64 65+ White anic /AA Other lican rat endent ral rate tive Clinton Trump Party Higher Less an rban Rural More $75K
______ _____ _______ _____ _____ _____ ____ _____ _____ _____ _____ ______ ______ ______ ______ ______ ______ ________ ______ _____ ______ ______ ____ _____ _____ ____ ____
Unweighted Base 1407 675 732 416 359 364 268 1049 104 173 25 437 526 382 437 549 421 537 505 113 543 864 388 719 300 548 846
Weighted Base 1407 687 720 383 345 382 297 938 208 169 26 450 521 408 385 593 429 547 532 108 481 926 395 742 270 679 704
Very/Somewhat Important 939 409 530 250 227 254 208 620 136 137 10 359 328 240 214 395 330 317 413 54 306 633 277 465 197 427 494
(Net) 67% 60% 74% 65% 66% 66% 70% 66% 65% 81% 39% 80% 63% 59% 55% 67% 77% 58% 78% 50% 64% 68% 70% 63% 73% 63% 70%
Very important 506 198 307 122 122 140 122 313 69 96 9 216 176 109 114 190 201 171 230 28 172 333 164 231 111 230 270
36% 29% 43% 32% 35% 37% 41% 33% 33% 57% 35% 48% 34% 27% 30% 32% 47% 31% 43% 26% 36% 36% 41% 31% 41% 34% 38%
Somewhat important 433 211 222 128 106 113 86 306 67 41 1 143 152 130 100 205 129 146 183 26 134 299 113 234 86 197 224
31% 31% 31% 33% 31% 30% 29% 33% 32% 24% 4% 32% 29% 32% 26% 35% 30% 27% 34% 24% 28% 32% 29% 32% 32% 29% 32%
Very/Somewhat Unimportant 468 277 191 133 118 128 89 319 72 32 16 91 193 168 172 198 99 230 119 54 175 293 118 277 73 252 211
(Net) 33% 40% 26% 35% 34% 34% 30% 34% 35% 19% 61% 20% 37% 41% 45% 33% 23% 42% 22% 50% 36% 32% 30% 37% 27% 37% 30%
Somewhat unimportant 194 109 85 61 44 55 34 131 32 13 4 55 65 70 52 85 57 80 62 20 71 122 58 100 35 100 92
14% 16% 12% 16% 13% 14% 11% 14% 16% 7% 17% 12% 12% 17% 13% 14% 13% 15% 12% 19% 15% 13% 15% 13% 13% 15% 13%
Very unimportant 274 169 106 72 74 73 55 188 40 19 11 36 128 98 120 112 42 151 57 34 104 171 60 177 37 152 118
20% 25% 15% 19% 22% 19% 19% 20% 19% 11% 44% 8% 25% 24% 31% 19% 10% 28% 11% 31% 22% 18% 15% 24% 14% 22% 17%
Sigma 1407 687 720 383 345 382 297 938 208 169 26 450 521 408 385 593 429 547 532 108 481 926 395 742 270 679 704
100% 100% 100% 100% 100% 100% 100% 100% 100% 100% 100% 100% 100% 100% 100% 100% 100% 100% 100% 100% 100% 100% 100% 100% 100% 100% 100%

Page 237
Fielding Period: November 27 - 28, 2018
HCAPS (Filtered on Registered Voters)
Weighted To The U.S. General Adult Population
30 Nov 2018
Table 214
D14 Does anyone in your household own a gun?
Base: All Respondents
Presidential
Election Candidate
Gender Age Ethnicity Political Party Political Ideology Voted For Education Locale Income
_____________ ______________________ _______________________ ____________________ ____________________ _____________________ _____________ ________________ _________
Colle- Some
Cons- ge Gr- Colle- $75K Less
Hisp- Black Repub- Democ- Indep- Libe- Mode- erva- 3rd ad And ge Or Urb- Subu- Or Than
Total Male Female 18-34 35-49 50-64 65+ White anic /AA Other lican rat endent ral rate tive Clinton Trump Party Higher Less an rban Rural More $75K
______ _____ _______ _____ _____ _____ ____ _____ _____ _____ _____ ______ ______ ______ ______ ______ ______ ________ ______ _____ ______ ______ ____ _____ _____ ____ ____
Unweighted Base 1407 675 732 416 359 364 268 1049 104 173 25 437 526 382 437 549 421 537 505 113 543 864 388 719 300 548 846
Weighted Base 1407 687 720 383 345 382 297 938 208 169 26 450 521 408 385 593 429 547 532 108 481 926 395 742 270 679 704
Yes 476 258 218 147 123 122 84 343 50 51 13 209 124 133 106 180 189 140 244 35 148 327 124 225 126 253 214
34% 38% 30% 38% 36% 32% 28% 37% 24% 30% 51% 46% 24% 33% 28% 30% 44% 26% 46% 32% 31% 35% 31% 30% 47% 37% 30%
No 931 429 503 236 222 260 213 595 158 118 13 241 397 275 279 413 239 407 288 74 333 598 271 516 144 427 490
66% 62% 70% 62% 64% 68% 72% 63% 76% 70% 49% 54% 76% 67% 72% 70% 56% 74% 54% 68% 69% 65% 69% 70% 53% 63% 70%
Sigma 1407 687 720 383 345 382 297 938 208 169 26 450 521 408 385 593 429 547 532 108 481 926 395 742 270 679 704
100% 100% 100% 100% 100% 100% 100% 100% 100% 100% 100% 100% 100% 100% 100% 100% 100% 100% 100% 100% 100% 100% 100% 100% 100% 100% 100%

Page 238
Fielding Period: November 27 - 28, 2018
HCAPS (Filtered on Registered Voters)
Weighted To The U.S. General Adult Population
30 Nov 2018
Table 215
Q2145 Which of the following best describes your current primary residence?
I/We live in...
Base: All Respondents
Presidential
Election Candidate
Gender Age Ethnicity Political Party Political Ideology Voted For Education Locale Income
_____________ ______________________ _______________________ ____________________ ____________________ _____________________ _____________ ________________ _________
Colle- Some
Cons- ge Gr- Colle- $75K Less
Hisp- Black Repub- Democ- Indep- Libe- Mode- erva- 3rd ad And ge Or Urb- Subu- Or Than
Total Male Female 18-34 35-49 50-64 65+ White anic /AA Other lican rat endent ral rate tive Clinton Trump Party Higher Less an rban Rural More $75K
______ _____ _______ _____ _____ _____ ____ _____ _____ _____ _____ ______ ______ ______ ______ ______ ______ ________ ______ _____ ______ ______ ____ _____ _____ ____ ____
Unweighted Base 1407 675 732 416 359 364 268 1049 104 173 25 437 526 382 437 549 421 537 505 113 543 864 388 719 300 548 846
Weighted Base 1407 687 720 383 345 382 297 938 208 169 26 450 521 408 385 593 429 547 532 108 481 926 395 742 270 679 704
A house that I/we own 867 455 413 208 208 259 193 623 96 88 18 297 313 240 238 352 277 333 363 69 348 519 197 484 187 517 334
62% 66% 57% 54% 60% 68% 65% 66% 46% 52% 71% 66% 60% 59% 62% 59% 65% 61% 68% 64% 72% 56% 50% 65% 69% 76% 47%
An apartment or condominium 99 49 50 25 17 27 30 59 17 12 1 36 36 26 28 40 32 38 36 9 50 50 41 53 5 55 44
that I/we own 7% 7% 7% 6% 5% 7% 10% 6% 8% 7% 4% 8% 7% 6% 7% 7% 7% 7% 7% 9% 10% 5% 10% 7% 2% 8% 6%
Another type of home that I/ 26 8 18 7 8 3 8 15 9 2 - 11 4 11 2 15 10 8 9 4 1 25 4 11 11 2 23
we own 2% 1% 3% 2% 2% 1% 3% 2% 4% 1% - 2% 1% 3% * 2% 2% 1% 2% 4% * 3% 1% 1% 4% * 3%
A house that I/we rent or 191 83 108 71 63 40 16 121 41 21 1 56 72 61 52 87 53 74 67 11 30 161 55 96 40 52 135
lease 14% 12% 15% 19% 18% 11% 6% 13% 20% 12% 5% 12% 14% 15% 13% 15% 12% 13% 13% 10% 6% 17% 14% 13% 15% 8% 19%
An apartment or condominium 192 85 107 59 41 46 47 103 41 39 3 42 84 60 58 83 52 87 49 11 47 145 92 84 16 50 142
that I/we rent or lease 14% 12% 15% 15% 12% 12% 16% 11% 20% 23% 11% 9% 16% 15% 15% 14% 12% 16% 9% 10% 10% 16% 23% 11% 6% 7% 20%
Another type of home that I/ 21 4 17 9 5 4 2 13 2 4 2 4 8 8 7 11 3 6 5 4 5 16 1 11 9 4 17
we rent or lease 1% 1% 2% 2% 2% 1% 1% 1% 1% 2% 8% 1% 2% 2% 2% 2% 1% 1% 1% 3% 1% 2% * 1% 3% 1% 2%
None of these 10 3 7 4 2 2 1 5 3 2 - 4 3 2 1 6 2 2 3 1 - 10 5 2 2 - 10
1% * 1% 1% 1% 1% * * 1% 1% - 1% * * * 1% 1% * 1% 1% - 1% 1% * 1% - 1%
Sigma 1407 687 720 383 345 382 297 938 208 169 26 450 521 408 385 593 429 547 532 108 481 926 395 742 270 679 704
100% 100% 100% 100% 100% 100% 100% 100% 100% 100% 100% 100% 100% 100% 100% 100% 100% 100% 100% 100% 100% 100% 100% 100% 100% 100% 100%

Page 239
Fielding Period: November 27 - 28, 2018
HCAPS (Filtered on Registered Voters)
Weighted To The U.S. General Adult Population
30 Nov 2018
Table 216
D16 Do you live in a suburban, urban, or rural area?
Base: All Respondents
Presidential
Election Candidate
Gender Age Ethnicity Political Party Political Ideology Voted For Education Locale Income
_____________ ______________________ _______________________ ____________________ ____________________ _____________________ _____________ ________________ _________
Colle- Some
Cons- ge Gr- Colle- $75K Less
Hisp- Black Repub- Democ- Indep- Libe- Mode- erva- 3rd ad And ge Or Urb- Subu- Or Than
Total Male Female 18-34 35-49 50-64 65+ White anic /AA Other lican rat endent ral rate tive Clinton Trump Party Higher Less an rban Rural More $75K
______ _____ _______ _____ _____ _____ ____ _____ _____ _____ _____ ______ ______ ______ ______ ______ ______ ________ ______ _____ ______ ______ ____ _____ _____ ____ ____
Unweighted Base 1407 675 732 416 359 364 268 1049 104 173 25 437 526 382 437 549 421 537 505 113 543 864 388 719 300 548 846
Weighted Base 1407 687 720 383 345 382 297 938 208 169 26 450 521 408 385 593 429 547 532 108 481 926 395 742 270 679 704
Urban 395 203 193 139 92 101 64 197 100 77 5 109 169 113 128 185 83 192 131 23 131 264 395 - - 162 230
28% 30% 27% 36% 27% 26% 21% 21% 48% 46% 18% 24% 32% 28% 33% 31% 19% 35% 25% 21% 27% 29% 100% - - 24% 33%
Suburban 742 377 365 181 188 188 185 527 85 73 15 226 268 229 208 302 232 281 272 71 284 458 - 742 - 430 302
53% 55% 51% 47% 54% 49% 62% 56% 41% 43% 57% 50% 52% 56% 54% 51% 54% 51% 51% 65% 59% 49% - 100% - 63% 43%
Rural 270 108 163 63 65 93 48 214 23 19 6 115 83 66 50 107 114 75 129 15 66 204 - - 270 88 172
19% 16% 23% 17% 19% 24% 16% 23% 11% 11% 25% 26% 16% 16% 13% 18% 27% 14% 24% 14% 14% 22% - - 100% 13% 24%
Sigma 1407 687 720 383 345 382 297 938 208 169 26 450 521 408 385 593 429 547 532 108 481 926 395 742 270 679 704
100% 100% 100% 100% 100% 100% 100% 100% 100% 100% 100% 100% 100% 100% 100% 100% 100% 100% 100% 100% 100% 100% 100% 100% 100% 100% 100%

Page 240
Fielding Period: November 27 - 28, 2018
HCAPS (Filtered on Registered Voters)
Weighted To The U.S. General Adult Population
30 Nov 2018
Table 217
D18 Are you a Citizen of the United States?
Base: All Respondents
Presidential
Election Candidate
Gender Age Ethnicity Political Party Political Ideology Voted For Education Locale Income
_____________ ______________________ _______________________ ____________________ ____________________ _____________________ _____________ ________________ _________
Colle- Some
Cons- ge Gr- Colle- $75K Less
Hisp- Black Repub- Democ- Indep- Libe- Mode- erva- 3rd ad And ge Or Urb- Subu- Or Than
Total Male Female 18-34 35-49 50-64 65+ White anic /AA Other lican rat endent ral rate tive Clinton Trump Party Higher Less an rban Rural More $75K
______ _____ _______ _____ _____ _____ ____ _____ _____ _____ _____ ______ ______ ______ ______ ______ ______ ________ ______ _____ ______ ______ ____ _____ _____ ____ ____
Unweighted Base 1407 675 732 416 359 364 268 1049 104 173 25 437 526 382 437 549 421 537 505 113 543 864 388 719 300 548 846
Weighted Base 1407 687 720 383 345 382 297 938 208 169 26 450 521 408 385 593 429 547 532 108 481 926 395 742 270 679 704
Yes 1401 681 719 378 345 380 297 935 207 168 26 446 520 408 382 592 427 547 529 107 480 920 392 739 270 676 701
100% 99% 100% 99% 100% 100% 100% 100% 100% 100% 100% 99% 100% 100% 99% 100% 100% 100% 100% 99% 100% 99% 99% 100% 100% 100% 100%
No 6 5 1 5 1 1 - 3 1 1 - 4 1 * 4 1 2 - 2 1 1 6 3 3 * 3 3
* 1% * 1% * * - * * * - 1% * * 1% * * - * 1% * 1% 1% * * * *
Sigma 1407 687 720 383 345 382 297 938 208 169 26 450 521 408 385 593 429 547 532 108 481 926 395 742 270 679 704
100% 100% 100% 100% 100% 100% 100% 100% 100% 100% 100% 100% 100% 100% 100% 100% 100% 100% 100% 100% 100% 100% 100% 100% 100% 100% 100%

Page 241
Fielding Period: November 27 - 28, 2018
HCAPS (Filtered on Registered Voters)
Weighted To The U.S. General Adult Population
30 Nov 2018
Table 218
HO1 Do you have health insurance?
Base: All Respondents
Presidential
Election Candidate
Gender Age Ethnicity Political Party Political Ideology Voted For Education Locale Income
_____________ ______________________ _______________________ ____________________ ____________________ _____________________ _____________ ________________ _________
Colle- Some
Cons- ge Gr- Colle- $75K Less
Hisp- Black Repub- Democ- Indep- Libe- Mode- erva- 3rd ad And ge Or Urb- Subu- Or Than
Total Male Female 18-34 35-49 50-64 65+ White anic /AA Other lican rat endent ral rate tive Clinton Trump Party Higher Less an rban Rural More $75K
______ _____ _______ _____ _____ _____ ____ _____ _____ _____ _____ ______ ______ ______ ______ ______ ______ ________ ______ _____ ______ ______ ____ _____ _____ ____ ____
Unweighted Base 1407 675 732 416 359 364 268 1049 104 173 25 437 526 382 437 549 421 537 505 113 543 864 388 719 300 548 846
Weighted Base 1407 687 720 383 345 382 297 938 208 169 26 450 521 408 385 593 429 547 532 108 481 926 395 742 270 679 704
Yes 1296 640 656 336 304 360 297 876 188 152 23 417 492 364 369 531 397 512 493 101 468 828 369 687 241 652 621
92% 93% 91% 88% 88% 94% 100% 93% 90% 90% 89% 93% 95% 89% 96% 89% 93% 94% 93% 93% 97% 89% 93% 93% 89% 96% 88%
No 111 47 64 47 42 22 - 63 20 17 3 34 29 44 17 62 31 35 38 7 13 97 26 55 30 28 83
8% 7% 9% 12% 12% 6% - 7% 10% 10% 11% 7% 5% 11% 4% 11% 7% 6% 7% 7% 3% 11% 7% 7% 11% 4% 12%
Sigma 1407 687 720 383 345 382 297 938 208 169 26 450 521 408 385 593 429 547 532 108 481 926 395 742 270 679 704
100% 100% 100% 100% 100% 100% 100% 100% 100% 100% 100% 100% 100% 100% 100% 100% 100% 100% 100% 100% 100% 100% 100% 100% 100% 100% 100%

Page 242
Fielding Period: November 27 - 28, 2018
HCAPS (Filtered on Registered Voters)
Weighted To The U.S. General Adult Population
30 Nov 2018
Table 219
Q2157 Which of the following income categories best describes your total 2017 household income before taxes?
Base: All Respondents
Presidential
Election Candidate
Gender Age Ethnicity Political Party Political Ideology Voted For Education Locale Income
_____________ ______________________ _______________________ ____________________ ____________________ _____________________ _____________ ________________ _________
Colle- Some
Cons- ge Gr- Colle- $75K Less
Hisp- Black Repub- Democ- Indep- Libe- Mode- erva- 3rd ad And ge Or Urb- Subu- Or Than
Total Male Female 18-34 35-49 50-64 65+ White anic /AA Other lican rat endent ral rate tive Clinton Trump Party Higher Less an rban Rural More $75K
______ _____ _______ _____ _____ _____ ____ _____ _____ _____ _____ ______ ______ ______ ______ ______ ______ ________ ______ _____ ______ ______ ____ _____ _____ ____ ____
Unweighted Base 1407 675 732 416 359 364 268 1049 104 173 25 437 526 382 437 549 421 537 505 113 543 864 388 719 300 548 846
Weighted Base 1407 687 720 383 345 382 297 938 208 169 26 450 521 408 385 593 429 547 532 108 481 926 395 742 270 679 704
Less than $15,000 98 23 75 44 28 19 8 49 25 18 2 28 30 36 17 56 25 26 20 6 5 93 41 30 26 - 98
7% 3% 10% 11% 8% 5% 3% 5% 12% 11% 6% 6% 6% 9% 4% 9% 6% 5% 4% 6% 1% 10% 10% 4% 10% - 14%
$15,000 to $24,999 103 34 69 25 25 31 22 51 34 14 3 23 48 29 24 57 21 32 26 4 10 93 33 40 30 - 103
7% 5% 10% 7% 7% 8% 7% 5% 16% 8% 10% 5% 9% 7% 6% 10% 5% 6% 5% 4% 2% 10% 8% 5% 11% - 15%
$25,000 to $34,999 109 31 78 41 22 20 26 66 19 18 3 23 62 22 31 45 33 53 29 7 10 100 31 51 27 - 109
8% 5% 11% 11% 6% 5% 9% 7% 9% 11% 10% 5% 12% 5% 8% 8% 8% 10% 6% 6% 2% 11% 8% 7% 10% - 16%
$35,000 to $49,999 160 68 92 46 34 43 36 96 25 26 5 50 60 46 37 80 43 77 56 13 35 125 47 80 33 - 160
11% 10% 13% 12% 10% 11% 12% 10% 12% 16% 18% 11% 11% 11% 10% 13% 10% 14% 11% 12% 7% 13% 12% 11% 12% - 23%
$50,000 to $74,999 235 118 117 69 49 61 56 159 34 31 2 72 77 82 61 100 74 92 97 17 76 159 78 101 56 - 235
17% 17% 16% 18% 14% 16% 19% 17% 16% 18% 9% 16% 15% 20% 16% 17% 17% 17% 18% 16% 16% 17% 20% 14% 21% - 33%
$75,000 to $99,999 195 106 89 43 73 43 35 139 25 20 3 71 75 45 68 74 53 86 78 11 70 125 44 122 28 195 -
14% 15% 12% 11% 21% 11% 12% 15% 12% 12% 11% 16% 14% 11% 18% 12% 12% 16% 15% 11% 15% 13% 11% 16% 10% 29% -
$100,000 to $124,999 193 113 80 50 50 52 41 157 17 16 - 72 69 50 63 74 56 83 75 17 74 119 57 100 36 193 -
14% 16% 11% 13% 14% 14% 14% 17% 8% 9% - 16% 13% 12% 16% 13% 13% 15% 14% 16% 15% 13% 14% 13% 13% 28% -
$125,000 to $149,999 103 61 42 32 20 26 26 80 2 11 - 31 41 30 37 32 33 47 34 6 67 36 27 68 8 103 -
7% 9% 6% 8% 6% 7% 9% 8% 1% 7% - 7% 8% 7% 10% 5% 8% 9% 6% 6% 14% 4% 7% 9% 3% 15% -
$150,000 to $199,999 116 75 41 18 27 44 27 84 14 5 5 49 34 32 28 37 51 30 68 10 77 38 22 80 14 116 -
8% 11% 6% 5% 8% 12% 9% 9% 7% 3% 18% 11% 7% 8% 7% 6% 12% 5% 13% 9% 16% 4% 6% 11% 5% 17% -
$200,000 to $249,999 38 25 13 6 5 19 7 23 5 1 1 11 14 11 13 10 14 11 13 3 25 13 8 28 2 38 -
3% 4% 2% 2% 1% 5% 2% 2% 2% 1% 5% 3% 3% 3% 3% 2% 3% 2% 2% 3% 5% 1% 2% 4% 1% 6% -
$250,000 or more 36 26 10 7 10 11 7 15 5 9 2 10 9 15 5 19 11 6 21 8 24 12 4 32 - 36 -
3% 4% 1% 2% 3% 3% 2% 2% 3% 6% 7% 2% 2% 4% 1% 3% 3% 1% 4% 8% 5% 1% 1% 4% - 5% -
Decline to answer 23 8 15 1 4 12 7 20 2 - 1 11 1 11 1 8 14 3 15 4 9 15 3 10 11 - -
2% 1% 2% * 1% 3% 2% 2% 1% - 5% 2% * 3% * 1% 3% 1% 3% 4% 2% 2% 1% 1% 4% - -
Sigma 1407 687 720 383 345 382 297 938 208 169 26 450 521 408 385 593 429 547 532 108 481 926 395 742 270 679 704
100% 100% 100% 100% 100% 100% 100% 100% 100% 100% 100% 100% 100% 100% 100% 100% 100% 100% 100% 100% 100% 100% 100% 100% 100% 100% 100%

Page 243
Fielding Period: November 27 - 28, 2018
HCAPS (Filtered on Registered Voters)
Weighted To The U.S. General Adult Population
30 Nov 2018
Table 220
CA1 Which carrier do you subscribe to for mobile calling and data services?
Base: All Respondents
Presidential
Election Candidate
Gender Age Ethnicity Political Party Political Ideology Voted For Education Locale Income
_____________ ______________________ _______________________ ____________________ ____________________ _____________________ _____________ ________________ _________
Colle- Some
Cons- ge Gr- Colle- $75K Less
Hisp- Black Repub- Democ- Indep- Libe- Mode- erva- 3rd ad And ge Or Urb- Subu- Or Than
Total Male Female 18-34 35-49 50-64 65+ White anic /AA Other lican rat endent ral rate tive Clinton Trump Party Higher Less an rban Rural More $75K
______ _____ _______ _____ _____ _____ ____ _____ _____ _____ _____ ______ ______ ______ ______ ______ ______ ________ ______ _____ ______ ______ ____ _____ _____ ____ ____
Unweighted Base 1407 675 732 416 359 364 268 1049 104 173 25 437 526 382 437 549 421 537 505 113 543 864 388 719 300 548 846
Weighted Base 1407 687 720 383 345 382 297 938 208 169 26 450 521 408 385 593 429 547 532 108 481 926 395 742 270 679 704
AT&T 315 173 142 83 76 84 73 245 24 28 3 122 95 88 84 120 112 113 143 28 143 172 88 175 52 209 102
22% 25% 20% 22% 22% 22% 24% 26% 12% 17% 13% 27% 18% 22% 22% 20% 26% 21% 27% 26% 30% 19% 22% 24% 19% 31% 14%
Verizon 340 178 162 81 75 89 95 272 25 17 10 115 124 97 96 127 116 132 133 23 131 209 82 191 67 192 143
24% 26% 22% 21% 22% 23% 32% 29% 12% 10% 38% 25% 24% 24% 25% 21% 27% 24% 25% 22% 27% 23% 21% 26% 25% 28% 20%
T-Mobile 189 91 99 78 43 40 28 88 57 28 3 52 83 52 64 83 42 76 68 15 59 131 57 102 30 97 92
13% 13% 14% 20% 12% 11% 9% 9% 27% 17% 12% 12% 16% 13% 17% 14% 10% 14% 13% 14% 12% 14% 14% 14% 11% 14% 13%
Sprint 154 72 82 54 28 42 29 77 37 34 2 38 75 40 51 69 34 68 44 14 56 97 43 91 20 70 80
11% 10% 11% 14% 8% 11% 10% 8% 18% 20% 6% 8% 14% 10% 13% 12% 8% 12% 8% 13% 12% 11% 11% 12% 7% 10% 11%
TracFone 45 19 26 5 6 23 12 31 6 6 3 14 19 11 10 16 19 21 13 4 11 35 9 21 15 7 35
3% 3% 4% 1% 2% 6% 4% 3% 3% 3% 11% 3% 4% 3% 3% 3% 4% 4% 3% 4% 2% 4% 2% 3% 6% 1% 5%
MetroPCS 88 35 53 22 39 22 4 28 28 22 2 13 37 36 20 54 14 46 16 1 14 74 44 38 6 20 69
6% 5% 7% 6% 11% 6% 1% 3% 14% 13% 7% 3% 7% 9% 5% 9% 3% 8% 3% 1% 3% 8% 11% 5% 2% 3% 10%
Virgin Mobile 24 4 21 2 4 9 10 20 - 4 - 8 6 11 6 11 7 9 9 2 9 15 8 13 4 8 14
2% 1% 3% * 1% 2% 3% 2% - 3% - 2% 1% 3% 2% 2% 2% 2% 2% 2% 2% 2% 2% 2% 1% 1% 2%
Straight Talk 55 28 27 15 26 10 5 46 8 2 - 29 8 17 10 22 24 4 31 5 12 43 9 20 27 19 33
4% 4% 4% 4% 7% 3% 2% 5% 4% 1% - 6% 2% 4% 2% 4% 6% 1% 6% 5% 3% 5% 2% 3% 10% 3% 5%
Boost Mobile 42 16 26 17 15 8 3 27 6 10 - 15 17 10 9 20 14 18 16 1 5 37 8 21 12 9 33
3% 2% 4% 4% 4% 2% 1% 3% 3% 6% - 3% 3% 2% 2% 3% 3% 3% 3% 1% 1% 4% 2% 3% 5% 1% 5%
Cricket 48 25 24 8 19 19 2 25 12 4 1 15 15 17 10 26 12 19 19 5 7 41 20 12 16 14 34
3% 4% 3% 2% 5% 5% 1% 3% 6% 2% 6% 3% 3% 4% 3% 4% 3% 4% 4% 5% 2% 4% 5% 2% 6% 2% 5%
Consumer Cellular 26 10 16 2 1 7 16 16 2 5 - 6 14 5 6 13 7 14 7 2 9 17 6 13 7 5 20
2% 1% 2% * * 2% 5% 2% 1% 3% - 1% 3% 1% 2% 2% 2% 3% 1% 2% 2% 2% 1% 2% 3% 1% 3%
Net10 4 2 2 2 - 2 - 4 - - - 2 2 - 2 - 2 * 3 - - 4 * 3 - 3 *
* * * * - * - * - - - * * - * - * * 1% - - * * * - 1% *
US Cellular 14 5 9 6 4 3 1 13 1 - - 9 4 1 4 2 8 6 6 - 5 9 3 7 3 5 9
1% 1% 1% 2% 1% 1% * 1% 1% - - 2% 1% * 1% * 2% 1% 1% - 1% 1% 1% 1% 1% 1% 1%
Walmart FamilyMobile 1 * 1 1 - * - 1 - - - 1 * 1 * 1 1 1 - 1 1 1 1 1 - - 1
* * * * - * - * - - - * * * * * * * - * * * * * - - *

Page 244
Fielding Period: November 27 - 28, 2018
HCAPS (Filtered on Registered Voters)
Weighted To The U.S. General Adult Population
30 Nov 2018
Table 220
CA1 Which carrier do you subscribe to for mobile calling and data services?
Base: All Respondents
Presidential
Election Candidate
Gender Age Ethnicity Political Party Political Ideology Voted For Education Locale Income
_____________ ______________________ _______________________ ____________________ ____________________ _____________________ _____________ ________________ _________
Colle- Some
Cons- ge Gr- Colle- $75K Less
Hisp- Black Repub- Democ- Indep- Libe- Mode- erva- 3rd ad And ge Or Urb- Subu- Or Than
Total Male Female 18-34 35-49 50-64 65+ White anic /AA Other lican rat endent ral rate tive Clinton Trump Party Higher Less an rban Rural More $75K
______ _____ _______ _____ _____ _____ ____ _____ _____ _____ _____ ______ ______ ______ ______ ______ ______ ________ ______ _____ ______ ______ ____ _____ _____ ____ ____
Weighted Base 1407 687 720 383 345 382 297 938 208 169 26 450 521 408 385 593 429 547 532 108 481 926 395 742 270 679 704
Other 40 20 20 4 9 16 11 32 2 6 * 8 16 16 9 20 11 14 16 4 13 27 9 24 8 15 26
3% 3% 3% 1% 3% 4% 4% 3% 1% 3% 1% 2% 3% 4% 2% 3% 3% 3% 3% 3% 3% 3% 2% 3% 3% 2% 4%
None of the above 20 10 10 1 1 8 9 15 1 3 2 6 6 7 4 8 8 5 7 3 6 14 9 8 3 6 14
1% 1% 1% * * 2% 3% 2% * 2% 6% 1% 1% 2% 1% 1% 2% 1% 1% 2% 1% 1% 2% 1% 1% 1% 2%
Sigma 1407 687 720 383 345 382 297 938 208 169 26 450 521 408 385 593 429 547 532 108 481 926 395 742 270 679 704
100% 100% 100% 100% 100% 100% 100% 100% 100% 100% 100% 100% 100% 100% 100% 100% 100% 100% 100% 100% 100% 100% 100% 100% 100% 100% 100%

Page 245
Fielding Period: November 27 - 28, 2018
HCAPS (Filtered on Registered Voters)
Weighted To The U.S. General Adult Population
30 Nov 2018
Table 221
CA2 Which internet service provider do you subscribe to for internet connectivity in your home?
Base: All Respondents
Presidential
Election Candidate
Gender Age Ethnicity Political Party Political Ideology Voted For Education Locale Income
_____________ ______________________ _______________________ ____________________ ____________________ _____________________ _____________ ________________ _________
Colle- Some
Cons- ge Gr- Colle- $75K Less
Hisp- Black Repub- Democ- Indep- Libe- Mode- erva- 3rd ad And ge Or Urb- Subu- Or Than
Total Male Female 18-34 35-49 50-64 65+ White anic /AA Other lican rat endent ral rate tive Clinton Trump Party Higher Less an rban Rural More $75K
______ _____ _______ _____ _____ _____ ____ _____ _____ _____ _____ ______ ______ ______ ______ ______ ______ ________ ______ _____ ______ ______ ____ _____ _____ ____ ____
Unweighted Base 1407 675 732 416 359 364 268 1049 104 173 25 437 526 382 437 549 421 537 505 113 543 864 388 719 300 548 846
Weighted Base 1407 687 720 383 345 382 297 938 208 169 26 450 521 408 385 593 429 547 532 108 481 926 395 742 270 679 704
AT&T 262 125 137 91 67 56 49 165 44 42 3 93 91 73 73 117 72 113 95 19 95 167 91 131 40 141 122
19% 18% 19% 24% 19% 15% 16% 18% 21% 25% 10% 21% 17% 18% 19% 20% 17% 21% 18% 17% 20% 18% 23% 18% 15% 21% 17%
Bright House 21 15 5 2 4 9 7 15 1 2 3 7 10 3 10 4 7 12 7 1 12 9 4 16 1 10 10
1% 2% 1% * 1% 2% 2% 2% * 1% 10% 2% 2% 1% 3% 1% 2% 2% 1% 1% 3% 1% 1% 2% * 1% 1%
Cablevision 39 19 20 11 7 12 9 23 9 5 1 5 18 15 6 27 6 15 12 7 14 25 14 20 5 18 21
3% 3% 3% 3% 2% 3% 3% 2% 4% 3% 6% 1% 3% 4% 2% 4% 1% 3% 2% 6% 3% 3% 4% 3% 2% 3% 3%
Charter 81 41 39 22 21 21 16 69 7 2 * 28 29 21 20 24 36 29 27 11 30 50 11 47 23 42 39
6% 6% 5% 6% 6% 6% 6% 7% 3% 1% 2% 6% 6% 5% 5% 4% 8% 5% 5% 11% 6% 5% 3% 6% 8% 6% 6%
Comcast 306 157 149 69 75 83 80 215 37 39 1 94 129 80 103 119 85 134 110 23 102 205 72 196 39 161 139
22% 23% 21% 18% 22% 22% 27% 23% 18% 23% 3% 21% 25% 20% 27% 20% 20% 25% 21% 22% 21% 22% 18% 26% 14% 24% 20%
Cox Cable Communications 69 33 36 19 14 18 17 50 5 4 6 25 25 18 20 23 26 29 32 2 30 38 25 37 7 34 35
5% 5% 5% 5% 4% 5% 6% 5% 2% 2% 24% 5% 5% 4% 5% 4% 6% 5% 6% 2% 6% 4% 6% 5% 2% 5% 5%
Time Warner Cable 154 66 88 31 37 54 32 99 26 16 1 41 61 50 44 67 43 57 60 11 60 94 47 72 34 76 75
11% 10% 12% 8% 11% 14% 11% 11% 13% 9% 3% 9% 12% 12% 11% 11% 10% 10% 11% 10% 13% 10% 12% 10% 13% 11% 11%
Verizon 130 75 56 42 32 34 22 94 12 13 3 38 47 44 39 58 33 52 55 9 60 70 44 73 14 78 51
9% 11% 8% 11% 9% 9% 8% 10% 6% 8% 13% 8% 9% 11% 10% 10% 8% 10% 10% 8% 13% 8% 11% 10% 5% 11% 7%
Frontier 42 25 17 5 16 13 9 21 12 7 - 11 17 13 11 22 10 16 16 1 12 30 6 28 8 21 18
3% 4% 2% 1% 5% 3% 3% 2% 6% 4% - 2% 3% 3% 3% 4% 2% 3% 3% 1% 3% 3% 1% 4% 3% 3% 3%
CenturyLink 51 29 22 12 20 12 7 31 10 8 - 18 18 14 11 23 17 20 19 4 16 35 15 22 14 24 27
4% 4% 3% 3% 6% 3% 2% 3% 5% 5% - 4% 3% 3% 3% 4% 4% 4% 4% 3% 3% 4% 4% 3% 5% 4% 4%
Cincinnati Bell 10 2 8 * 1 4 4 5 - 1 - 2 5 2 5 2 3 5 3 * 4 6 3 4 2 4 3
1% * 1% * * 1% 1% 1% - 1% - * 1% 1% 1% * 1% 1% 1% * 1% 1% 1% 1% 1% 1% *
Mediacom 4 1 3 2 1 - 1 3 - 1 - - 2 2 2 2 - 3 - - * 4 2 1 1 - 4
* * * * * - * * - 1% - - * * 1% * - 1% - - * * 1% * * - 1%
Suddenlink 12 7 5 4 8 - 1 6 5 1 - 9 1 2 1 2 9 1 10 - 1 12 1 8 3 8 5
1% 1% 1% 1% 2% - * 1% 2% 1% - 2% * 1% * * 2% * 2% - * 1% * 1% 1% 1% 1%
Windstream 9 2 6 4 2 2 * 7 - 2 - 1 6 2 3 4 1 5 * 1 * 8 - 4 5 3 4
1% * 1% 1% 1% 1% * 1% - 1% - * 1% * 1% 1% * 1% * 1% * 1% - 1% 2% * 1%

Page 246
Fielding Period: November 27 - 28, 2018
HCAPS (Filtered on Registered Voters)
Weighted To The U.S. General Adult Population
30 Nov 2018
Table 221
CA2 Which internet service provider do you subscribe to for internet connectivity in your home?
Base: All Respondents
Presidential
Election Candidate
Gender Age Ethnicity Political Party Political Ideology Voted For Education Locale Income
_____________ ______________________ _______________________ ____________________ ____________________ _____________________ _____________ ________________ _________
Colle- Some
Cons- ge Gr- Colle- $75K Less
Hisp- Black Repub- Democ- Indep- Libe- Mode- erva- 3rd ad And ge Or Urb- Subu- Or Than
Total Male Female 18-34 35-49 50-64 65+ White anic /AA Other lican rat endent ral rate tive Clinton Trump Party Higher Less an rban Rural More $75K
______ _____ _______ _____ _____ _____ ____ _____ _____ _____ _____ ______ ______ ______ ______ ______ ______ ________ ______ _____ ______ ______ ____ _____ _____ ____ ____
Weighted Base 1407 687 720 383 345 382 297 938 208 169 26 450 521 408 385 593 429 547 532 108 481 926 395 742 270 679 704
Other 120 59 61 31 20 33 36 82 20 10 4 50 32 35 24 42 55 35 55 12 31 90 25 51 45 42 76
9% 9% 9% 8% 6% 9% 12% 9% 10% 6% 17% 11% 6% 9% 6% 7% 13% 6% 10% 11% 6% 10% 6% 7% 17% 6% 11%
None of the above 98 30 68 38 22 32 7 54 20 15 3 29 30 35 13 57 27 22 31 7 13 85 35 33 30 19 76
7% 4% 9% 10% 6% 8% 2% 6% 10% 9% 13% 6% 6% 8% 3% 10% 6% 4% 6% 6% 3% 9% 9% 4% 11% 3% 11%
Sigma 1407 687 720 383 345 382 297 938 208 169 26 450 521 408 385 593 429 547 532 108 481 926 395 742 270 679 704
100% 100% 100% 100% 100% 100% 100% 100% 100% 100% 100% 100% 100% 100% 100% 100% 100% 100% 100% 100% 100% 100% 100% 100% 100% 100% 100%