crosscutting activities in systems engineering and … library/events/2017/crosscutting... ·...
TRANSCRIPT
Crosscutting Activities in Systems
Engineering and Analysis
Travis ShultzEnergy Process and Analysis Team
Systems Engineering & Analysis Directorate
March 20, 2017
2
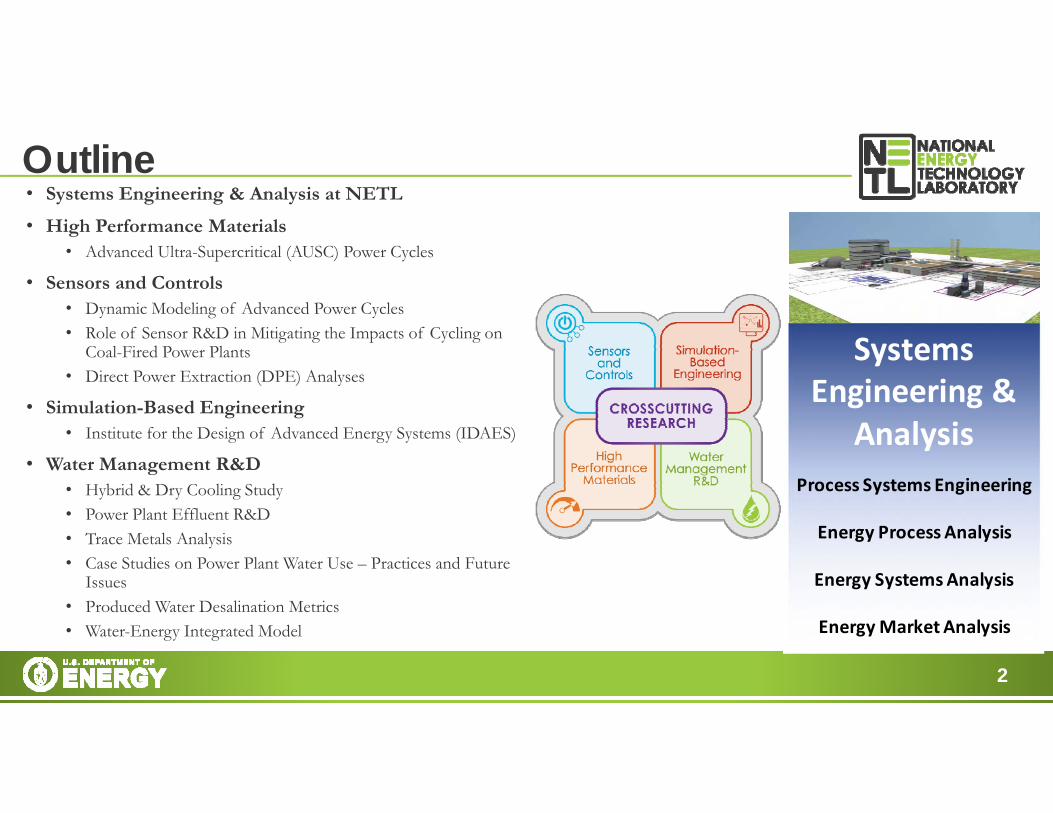
• Systems Engineering & Analysis at NETL
• High Performance Materials • Advanced Ultra-Supercritical (AUSC) Power Cycles
• Sensors and Controls• Dynamic Modeling of Advanced Power Cycles• Role of Sensor R&D in Mitigating the Impacts of Cycling on
Coal-Fired Power Plants• Direct Power Extraction (DPE) Analyses
• Simulation-Based Engineering• Institute for the Design of Advanced Energy Systems (IDAES)
• Water Management R&D• Hybrid & Dry Cooling Study• Power Plant Effluent R&D• Trace Metals Analysis• Case Studies on Power Plant Water Use – Practices and Future
Issues• Produced Water Desalination Metrics• Water-Energy Integrated Model
Outline
Systems Engineering &
AnalysisProcess Systems Engineering
Energy Process Analysis
Energy Systems Analysis
Energy Market Analysis

NETL Systems Engineering & Analysis
Innovative Advanced Energy Systems through Process Systems Engineering
Grid, Infrastructure, and Energy Reliability
Regional and National Energy‐Economy ModelAdvanced Technology Design and Cost Estimation
Life Cycle Analysis

4
• Conduct performance and economic assessments of advanced material-enabled coal-fueled power plants
• Advanced ultrasupercritical (AUSC) Rankine-cycle-based pulverized coal (PC) and oxy-circulating fluidized bed (CFB) plants
• Also find application in supercritical carbon dioxide (sCO2) oxy-CFB plants
• Operating conditions possible due to Ni-based superalloys• Up to 5,000 psi, 1,400 °F (345 bar, 760 °C)• Developed under the AUSC Materials Consortium• Inconel 740 (ASME code approved for use in boilers) and Haynes H282 alloys
• Detailed presentation tomorrow at 3pm – Track B, Session 6• Update on the Techno-Economic Viability of AUSC Systems
High Performance Materials Advanced Ultra-Supercritical (AUSC) Power Cycles
5
• Thermodynamic and economic analyses• Analyses follow NETL Quality Guidelines for Energy Systems Studies (QGESS)• Cost estimates developed at same detail level as NETL’s Cost and Performance
Baseline for Fossil Energy Plants report series; in particular, Volume 1, Bituminous Coal and Natural Gas to Electricity (the “Bituminous Baseline”)
• Bituminous Coal (Illinois #6), generic Midwestern location, ISO ambient conditions• Estimated emissions of Hg, PM, NOx, and SO2 are all at or below the applicable
regulatory limits at the time of preparation for all cases• 550 MW net scale, 85% capacity factor • 2011 $• CCS cases include transport and storage (T&S) in a saline formation• Incorporated results from the literature and in consultation with developers for
advanced technologies
High Performance Materials Advanced Ultra-Supercritical (AUSC) Power Cycles
6
80
90
100
110
120
130
140
150
28 30 32 34 36 38 40 42 44 46 48
CO
E (w
ithou
t T&
S) ($
/MW
h)
Net Plant HHV Efficiency for Coal Plant with Adv. Cycle (%)
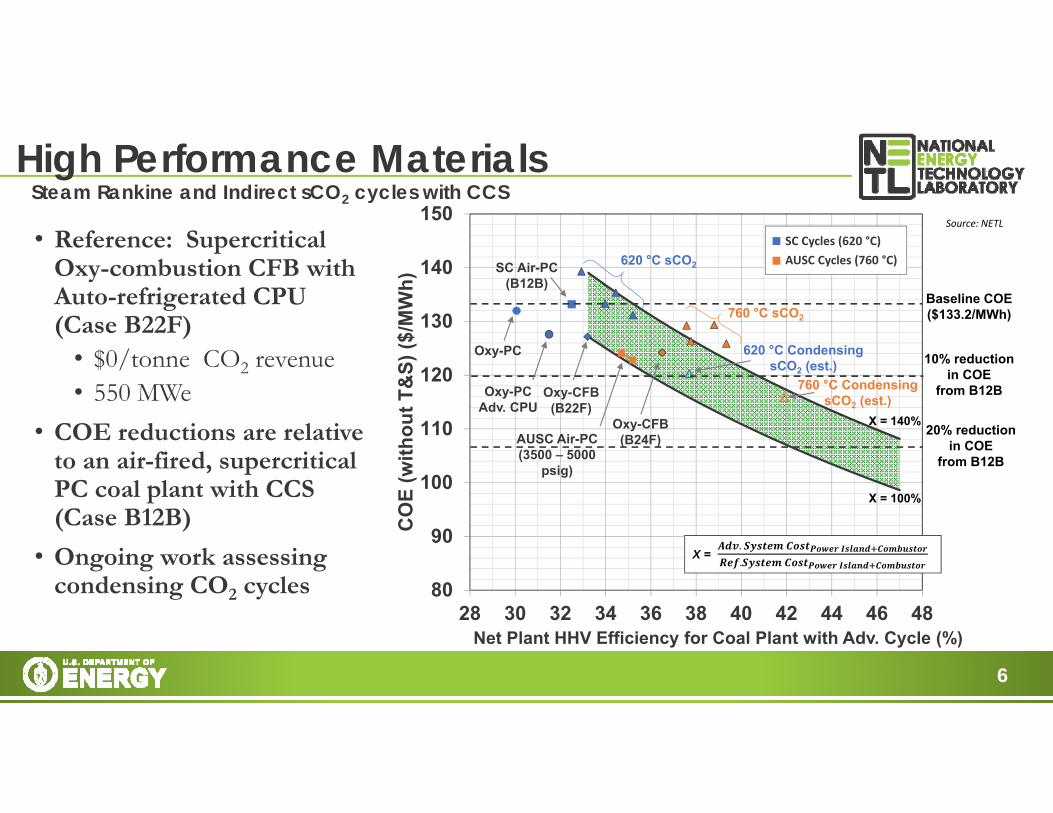
• Reference: Supercritical Oxy-combustion CFB with Auto-refrigerated CPU (Case B22F)
• $0/tonne CO2 revenue• 550 MWe
• COE reductions are relative to an air-fired, supercritical PC coal plant with CCS (Case B12B)
• Ongoing work assessing condensing CO2 cycles
High Performance Materials Steam Rankine and Indirect sCO2 cycles with CCS
Oxy-CFB (B22F)
Source: NETL
10% reduction in COE
from B12B
20% reduction in COE
from B12B
Oxy-PC
SC Air-PC(B12B)
X = 100%
X = 140%
X = . .
620 °C sCO2
760 °C sCO2
760 °C CondensingsCO2 (est.)
Oxy-CFB(B24F)
620 °C CondensingsCO2 (est.)
AUSC Air-PC (3500 – 5000
psig)
Oxy-PCAdv. CPU
SC Cycles (620 °C)AUSC Cycles (760 °C)
Baseline COE($133.2/MWh)

7
• Advance the understanding of thermodynamic and environmental performance, and economics, of fossil energy power system technologies from a sensors and controls perspective, in order to guide R&D, reduce technical risks, and inform key stakeholders.
• DOE’s Supercritical Transformational Electric Power (STEP) Program
• Supercritical CO2 (sCO2) Crosscutting Initiative (CCI) to demonstrate sCO2 Brayton cycle technologies at scale
• DOE announced project award to develop sCO2test facility (October, 2016)
• $80M federal contribution, 20% industry cost share, and 6-year duration
• Managed by team led by GTI, SwRI, and GE Global Research
• Design, build, and operate 10 MWe sCO2 Pilot Plant Test Facility in San Antonio, TX
• Operational in 2020
Sensors and ControlsDynamic Modeling of Advanced Power Cycles
Source: NETL

8
• Operational procedures and controls R&D to reduce technical risk• Startup, shutdown, load follow, plant trips, etc.• Cope with highly nonlinear fluid property changes, especially near the critical point• Cope with high degree of heat recuperation and pressure interactions• Maintain stable, safe operation with CO2 working fluid in supercritical region• Operate commercial cycles with coupled, constant-speed turbomachinery
• Develop control strategies for the dynamic operation of a 10MWe supercritical CO2 recompression Brayton cycle
• Aspen Dynamics® and Aspen Custom Modeler® to develop dynamic system model. • Other software (such as Matlab/Simulink®) may be used for advanced control
implementation.
Sensors and ControlsDynamic Modeling of Advanced Power Cycles
9
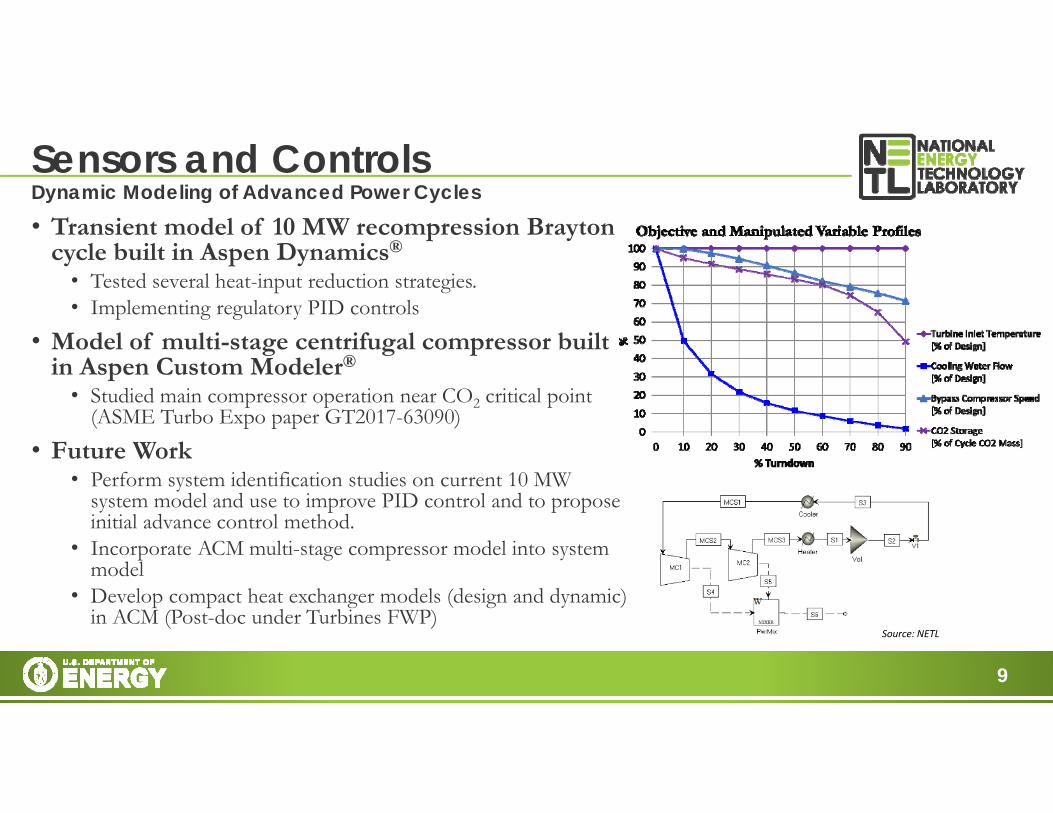
• Transient model of 10 MW recompression Brayton cycle built in Aspen Dynamics®
• Tested several heat-input reduction strategies.• Implementing regulatory PID controls
• Model of multi-stage centrifugal compressor built in Aspen Custom Modeler®
• Studied main compressor operation near CO2 critical point (ASME Turbo Expo paper GT2017-63090)
• Future Work• Perform system identification studies on current 10 MW
system model and use to improve PID control and to propose initial advance control method.
• Incorporate ACM multi-stage compressor model into system model
• Develop compact heat exchanger models (design and dynamic) in ACM (Post-doc under Turbines FWP)
Sensors and ControlsDynamic Modeling of Advanced Power Cycles
Source: NETL

10
• Effects of cycling • Increases Operating and Maintenance (O&M) costs • Lowers efficiency, resulting in increased fuel consumption and emissions• Loss of generating revenue• Decreases remaining useful life due to accumulated damages
• Existing coal-fired power plants built in the 1960’s were designed for baseload operation (high capacity factor)
• Limited tolerance for cyclic operation
Role of Sensor R&D in Mitigating the Impacts of Cycling on Coal-Fired Power PlantsSensors and Controls
Waterwall web cracking
Boiler tube corrosion
Turbine casing damage

11
• Most energy-market models do not account for cycling-induced degradation (heat rate and O&M impacts)
• ANL/NETL used ANL’s EISM energy-market model to examine this issue
• Units accumulate damage due to cycling operation and must retire if too much occurs
• Results indicate coal units retiring much more quickly and on a larger scale than any other models currently show
• Ongoing work will model the impacts of R&D in sensors and controls to mitigate the damage due to different operational modes
• Detailed presentation tomorrow at 3pm – Track A, Session 6
• Scenario Simulations of Potential Cost Savings from R&D in Sensors and Controls for Coal-Fired Power Plants
Role of Sensor R&D in Mitigating the Impacts of Cycling on Coal-Fired Power PlantsSensors and Controls
Electricity generation from selected coal units show sharp drop‐offs in output due to cycling

12
• Collaborated with NETL R&IC Multiphase Modeling team to develop a tool for oxy-coal MHD system design and optimization
• Developed the first pure oxygen-fired coal MHD system performance and cost analysis with CCS• Performance analysis of a baseline oxy-coal DPE system with CCS provides a cost and performance data against which
advanced DPE systems can be compared• Completed balance of plant design, capital cost estimation, and COE analysis
• Issues include: MHD component costs, coal dryer cost, seed makeup cost, 80% capacity factor, and reduced net power output• Large uncertainty in DPE-specific component costs, which are scaled from legacy cost scaling algorithms
Sensors and ControlsDirect Power Extraction (DPE) Analyses
Fuel
13
• Ongoing/Future work • DPE Scoping Study
• Complete a screening analysis of DPE integrations with other power systems to identify promising DPE system combinations that can meet transformational efficiency and cost-of-electricity goals, while providing flexible, modular, and/or low-water power.
• Comparative analysis against baseline study to identify best DPE configurations for more detailed studies • Investigate effects/dependency of electrode/channel wall temperature on baseline oxy-coal DPE system
performance• Optimization of seed recovery process to improve cost & performance (FY17)• Look at alternate fuels (e.g., petcoke), supersonic channels
Sensors and ControlsDirect Power Extraction (DPE) Analyses

14
• Challenges:
• Determining which technologies to pursue and how to optimally integrate them while taking into account their full life cycle environmental footprint and determining their potential in the market.
• Current computational tools and analysis approaches cannot simultaneously address such complex interactions, nor can they address a sufficient number of scenarios in the timeframes required.
• Vison:
• Become the premier resource for the identification, synthesis, optimization and analysis of innovative advanced energy systems at scales ranging from process to system to market.
• Support the transformation of the national energy landscape to meet DOE’s three enduring strategic objectives: energy security, economic competitiveness, and environmental responsibility.
• Integrates NETL’s historic capabilities in Systems Engineering & Analysis
• Impact:
• Rapid integrated identification and assessment of novel energy technologies and their potential impact within complex systems and markets in order to prioritize and direct R&D efforts.
Simulation-Based EngineeringInstitute for the Design of Advanced Energy Systems (IDAES)

15
• Approach: Develop and utilize multi-scale, simulation-based computational tools and models to support design, analysis, optimization, scale-up and troubleshooting.
• Next generation modeling and optimization platform
• Flexible and open modeling environment• Complete provenance information• Supports advanced solvers and computer architecture• Intrusive uncertainty quantification• Process synthesis, integration, and intensification• Process control and dynamics
• Apply emerging models and tools to support internal/external development
• Chemical looping• Novel advanced combustion systems concepts• Carbon capture (via CCSI2)
Simulation-Based EngineeringInstitute for the Design of Advanced Energy Systems (IDAES)
Development Of Innovative Advanced Energy Systems Through Advanced Process Systems Engineering
16
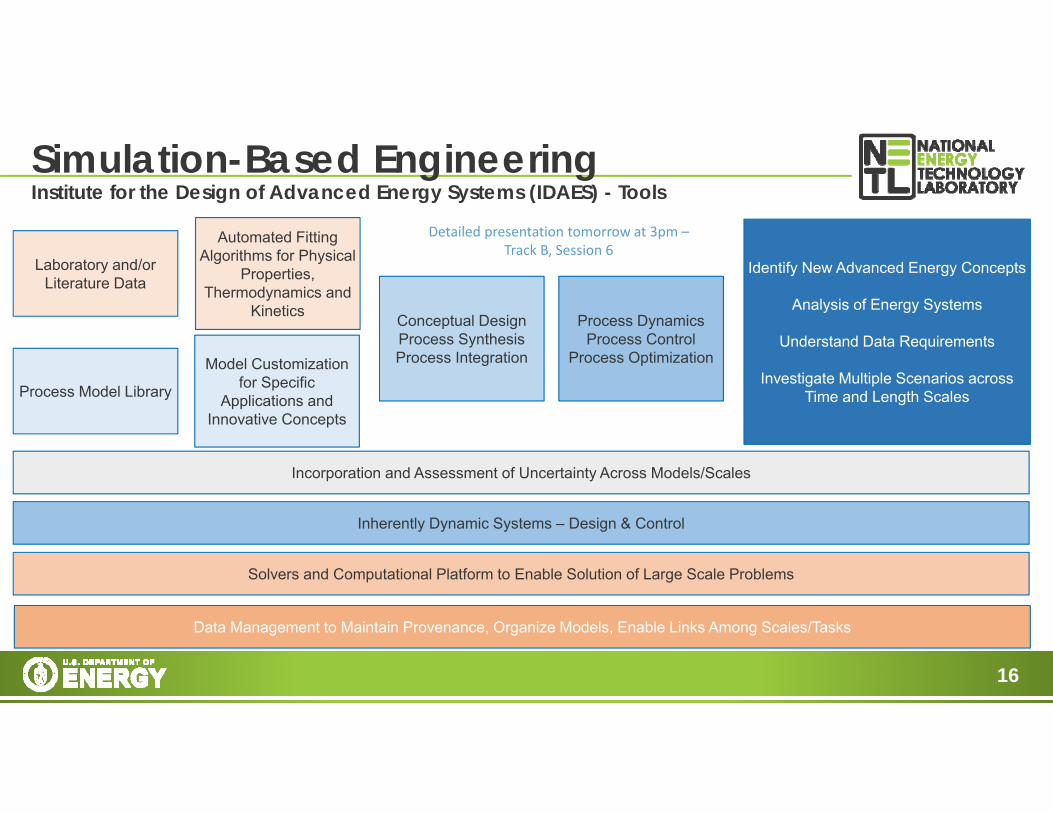
Simulation-Based EngineeringInstitute for the Design of Advanced Energy Systems (IDAES) - Tools
Laboratory and/or Literature Data
Automated Fitting Algorithms for Physical
Properties, Thermodynamics and
Kinetics
Process Model Library
Conceptual Design Process SynthesisProcess Integration
Process DynamicsProcess Control
Process OptimizationModel Customization for Specific
Applications and Innovative Concepts
Identify New Advanced Energy Concepts
Analysis of Energy Systems
Understand Data Requirements
Investigate Multiple Scenarios across Time and Length Scales
Incorporation and Assessment of Uncertainty Across Models/Scales
Inherently Dynamic Systems – Design & Control
Solvers and Computational Platform to Enable Solution of Large Scale Problems
Data Management to Maintain Provenance, Organize Models, Enable Links Among Scales/Tasks
Detailed presentation tomorrow at 3pm –Track B, Session 6

17
Water Management R&D
• Water scarcity, variability, and uncertainty are becoming more prominent in the US
─ Population growth ─ Climate change ─ Precipitation profile redistributions
• Environmental impacts and regulations alter water availability profile
• Strong temporal dependence• Highly localized due to water rights and
other region-specific issues
Water Resources
• Thermoelectric power generation accounts for a majority of water usage for power generation
─ Nearly 52% of surface fresh water withdrawals─ A total of 43% of total water withdrawals
• Vulnerable to physical constraints of water availability and regulations limiting access to it
─ Power plants in the US forced to modulate/shutdown power generation during a recent drought in 2012
─ Can constrain the type and location of power plants that can be built
Power Generation*
Water Resources
• Power required to transport, distribute, and collect water
• Water treatment• Local point-of-end use for water heating etc..,
Energy
• Power Generation (primarily for cooling) • Extraction, Transport, and Processing of
Fuels• Irrigation of biofuels feedstock crops
Water – Energy Dependency is one dimension of the larger Water – Energy - Food Nexus*Sources: 1. US DOE, “The Water – Energy Nexus: Challenges and Opportunities – Overview and Summary,” 2014; 2. IEA, “Water for Energy Resource: Is Energy Becoming a Thirstier Resource,” Excerpt from the World Energy Outlook 2012. 3. NREL, “Water Constraints in an Electric Sector Capacity Expansion Model,” NREL/TP‐6A20‐64270 , 2015.4. “The Energy‐Water‐Food Nexus”, D. L. Keairns, R. C. Darton, and A. Irabien, Annu. Rev. Chem. Biomol. Eng. 2016.7:9.1‐9.24
• Develop tools and metrics that allow for a better understanding of power plant water utilization under potential water constrained futures.
• Inform the direction of the NETL R&D to mitigate the impact of water availability threats on both current and future fossil-fueled electric power generation capacity

18
• Assess the performance and cost impacts of state-of-the-art dry cooling technologies
• Update and expansion of published chapter in NETL’s Cost and Performance Baseline for Fossil Energy Plants: Volume 1, Bituminous Coal and Natural Gas to Electricity, Rev. 2b (the “Bituminous Baseline”)
• Current Rev. 3 (July, 2015) used as new basis• Supercritical pulverized coal (SC PC) and natural gas combined cycle (NGCC) plants,
with and without carbon capture• Expanded matrix of atmospheric conditions• Technology performance and cost in cooperation with Black & Veatch
• Inform water-energy integrated model• Identify R&D opportunities
Water Management R&DHybrid & Dry Cooling Study
19
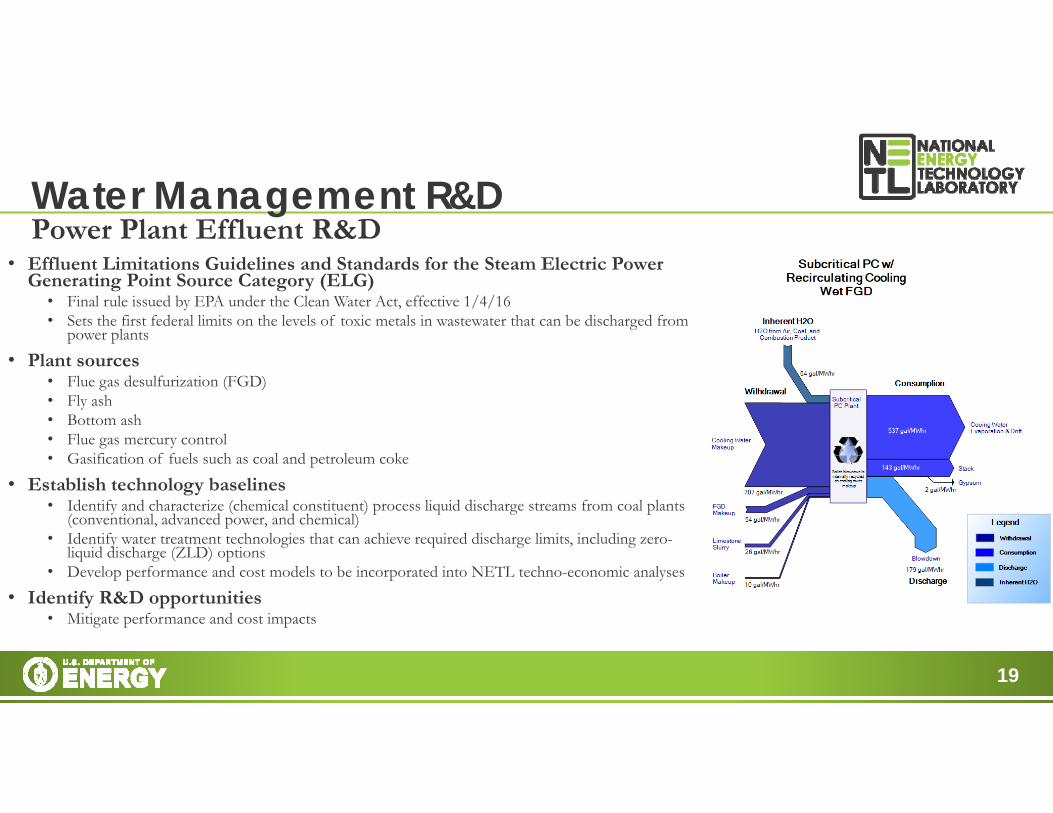
• Effluent Limitations Guidelines and Standards for the Steam Electric Power Generating Point Source Category (ELG)
• Final rule issued by EPA under the Clean Water Act, effective 1/4/16• Sets the first federal limits on the levels of toxic metals in wastewater that can be discharged from
power plants
• Plant sources• Flue gas desulfurization (FGD)• Fly ash• Bottom ash• Flue gas mercury control• Gasification of fuels such as coal and petroleum coke
• Establish technology baselines• Identify and characterize (chemical constituent) process liquid discharge streams from coal plants
(conventional, advanced power, and chemical) • Identify water treatment technologies that can achieve required discharge limits, including zero-
liquid discharge (ZLD) options• Develop performance and cost models to be incorporated into NETL techno-economic analyses
• Identify R&D opportunities • Mitigate performance and cost impacts
Water Management R&DPower Plant Effluent R&D

20
• Complementary to previously-mentioned effluent R&D
• Characterize trace elements in effluent streams from advanced power systems
• “Coal contains the periodic table” – heavy metals content in blowdown from pulverized coal combustion relatively well known
• Conduct literature survey to characterize trace elements in process water streams from IGCC, oxycombustion, CCS, chemical looping, etc.
Water Management R&DTrace Metals Analysis

21
• A collaborative effort between NETL and power plant staff• Develop a report based on their water use practices and future issues and concerns regarding plant water• Conduct several power plants tours
• Primary focus on coal plants• Secondary focus on natural gas combined cycle (NGCC) plants
• Address water use challenges and issues holistically• Measurements• Conditions• Normal and cycling operations• Permits• Disposal• Run off
Water Management R&DCase Studies on Power Plant Water Use – Practices and Future Issues

22
• Detailed system-level analyses will be used to develop metrics for desalination of extracted brines from carbon storage reservoirs to manage plume and pressure or produced water from oil/natural gas production
• Costs, performance, energy, scale, effluent conditions, final conditions
• NETL membrane R&D may also be incorporated into this work
Water Management R&DProduced Water Desalination Metrics

23
• Motivation• Water – Energy interdependency is an important factor that has to be taken into consideration in
the deployment of power generation technologies • Siting considerations• Environmental considerations• Technology considerations• Municipal, Industrial, and Agriculture considerations
• Current energy capacity forecasting tools such as NEMS do not adequately take into account potential water constraints in deployment considerations
• Objectives• Develop tools and metrics that inform electric power generation design choices related to water
availability and the cost of power plant water utilization• Explore electric power technology options and use results to inform R&D• Mitigate the impact of adverse water availability conditions on current and projected future
thermoelectric electric power generation capacity
Water Management R&DWater-Energy Integrated Model

24
Water Management R&DWater-Energy Integrated Model
NEMS
Agricultural Water Demand
ModelRegional Agricultural Water
Demand
Municipal Water Demand ModelRegional MunicipalWater
DemandWaterConsumption.csvWaterDrawFactor.csv
Industrial Water Demand ModelRegional Industrial Water
DemandWaterConsumption.csvWaterDrawFactor.csv
Policy Model
Sandia/NETL: Metrics_HUC8.xlsx (Environmental Water
Constraints)
Macro Economic Model
GDP_Deflators.csv
Population ModelForecasted Population Growth and Movement
Thermal Power Model
EDBPUnitData.csvFuelCode_FuelType.csvGenerationData.csvNewNuclearSites.csvPlantCoolingTech.csvUnitTech_ECPType.csvWaterDrawByTech.csvWaterUseByTech.csv
Financial ModelFinancial RoutinesInvestment.csv
Hydro Power Model
Water Demand and Power Generation from Hydro‐electric Power Plants
Water Demand
Water Supply Data VisualizationGIS Supported
Energy‐Water ModelNETL Model for the
Assessment of Competing Demands
for Water Use Under Alternative Water
Availability Scenarios
Water Demand Over Time
repNonPowerUse.csvrepPowerUse.csv
repWaterUseByHUC.csvWater draw and
consumption in power & non‐power sectors by year, HUC, sector, season & plant
(power only)
Marginal Cost of Water Over Time
repMarginalCost.csvMarginal cost of water by year, HUC and season
Water Supply by Source Over TimerepWaterUseBy HUC.csvWater supply by year, HUC, season and water source
Cooling Technology RetrofitsrepRetrofits.csv
"Replacement" Water for Power
PlantsrepDemandReduction.csvPurchased from agricultureTreated water from brackish
sources
Daily GenerationrepDailyGeneration.csv
Daily power generation by unit and season
Water AvailabilityModel
Regional Surface and Groundwater Availability
median_water_by_HUC2.csvWater_Available.csv
DrawOverlapFactor.csv
Scenario Tool

25
• Sandia Water Availability Data• Original 17 Western States• NETL funding for 31 Eastern States• HUC-8 (Hydrologic Unit Code)
watershed level• Fresh surface, fresh ground, municipal
waste, brackish ground water
Water Management R&DWater-Energy Integrated Model

26
• Prototype Model Design and Data• Time Period: 2012 to 2040• Regions: HUC 8 – Hydrologic Unit
Code (8 digits 2,200 HUs, 700 mi2)• Model Objective Function: Minimize
the total cost of satisfying water demand in each HUC 8
Thermal Power Model
(NEMS)
Regional Water Supply(Sandia Data)
Energy‐Water Model
Water Demand Model
(Sandia Data)
http://energy.sandia.gov/mapping‐water‐availability‐in‐the‐western‐us/
Water Management R&DWater-Energy Integrated Model

27
• Model Design• Multi-period seasonal planning model• Prototype model developed in GAMS (General Algebraic
Modeling System)• Linear programming model
• Optimizes to minimize the cost of satisfying the demand for water• Performs an economic trade-off between purchasing water at
various costs from constrained water sources or spend capital to retrofit power plants with less intensive water cooling technologies
• Appropriated water• Impaired water (waste or bine waters)• Purchase from Ag• Retrofit cooling system to recirculating or dry cooling
Water Management R&DWater-Energy Integrated Model
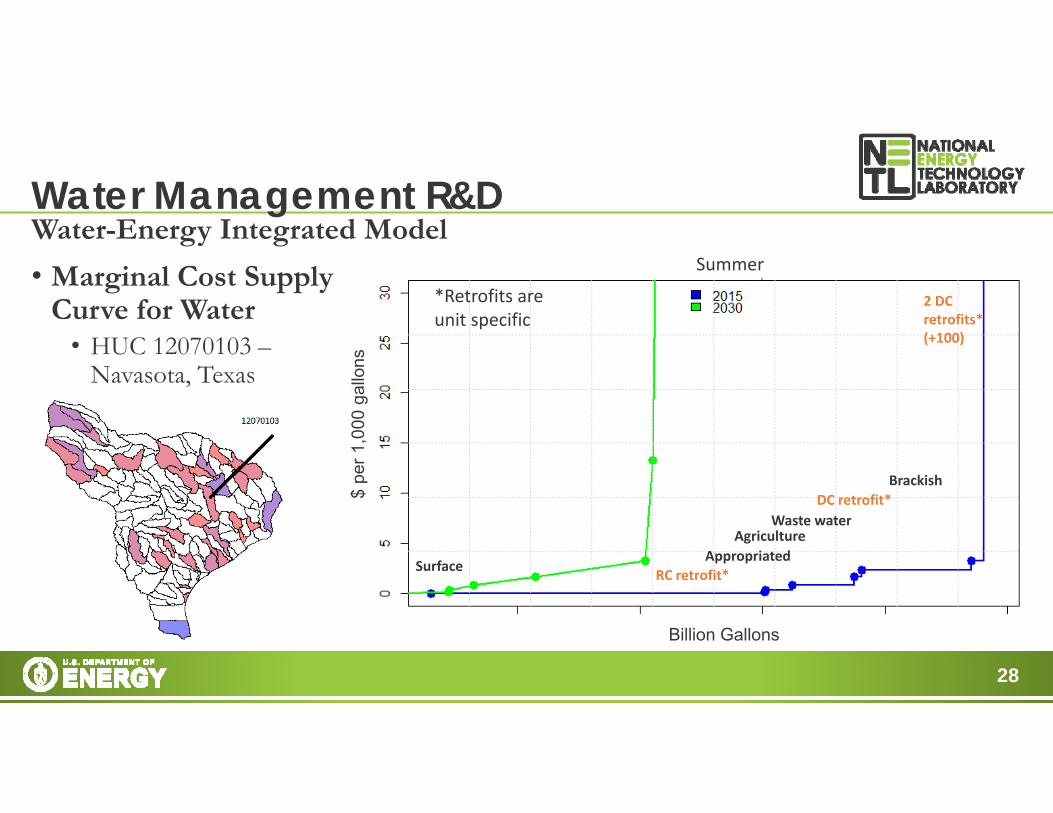
28
• Marginal Cost Supply Curve for Water
• HUC 12070103 –Navasota, Texas
Water Management R&DWater-Energy Integrated Model
Surface RC retrofit*Appropriated
AgricultureWaste water
DC retrofit*Brackish
*Retrofits are unit specific
2 DC retrofits* (+100)
Billion Gallons
Summer
$ pe
r 1,0
00 g
allo
ns
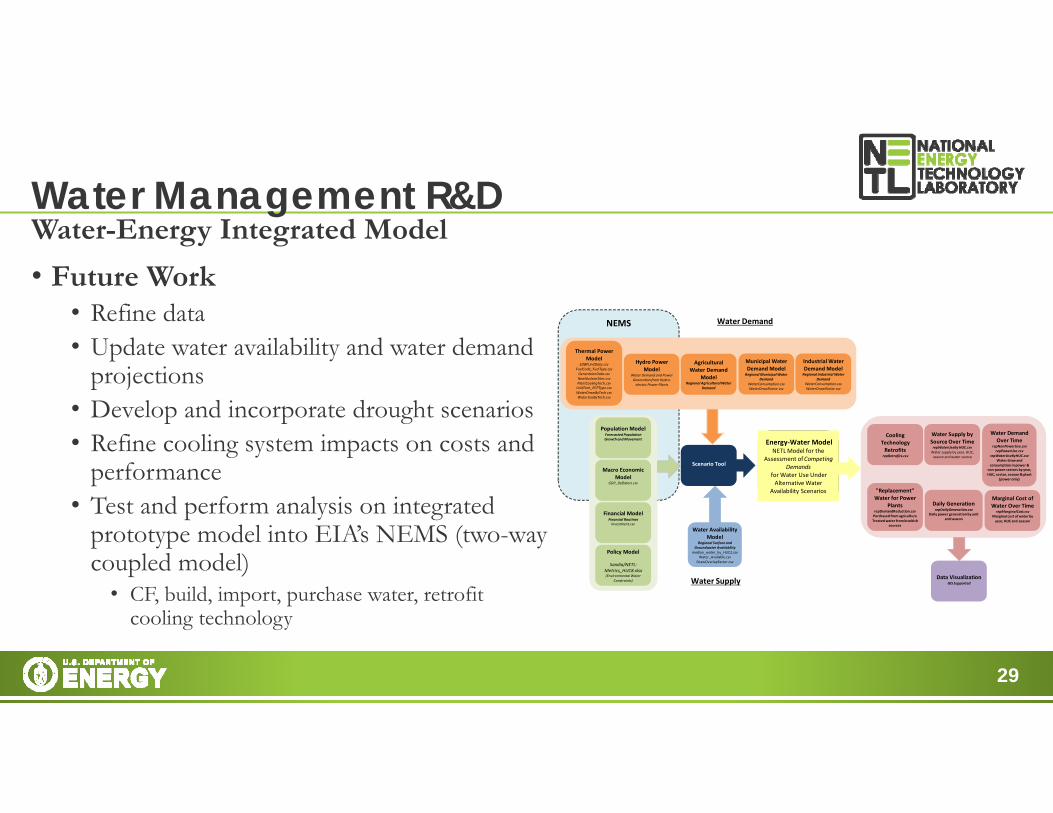
29
• Future Work• Refine data• Update water availability and water demand
projections• Develop and incorporate drought scenarios• Refine cooling system impacts on costs and
performance• Test and perform analysis on integrated
prototype model into EIA’s NEMS (two-way coupled model)
• CF, build, import, purchase water, retrofit cooling technology
Water Management R&DWater-Energy Integrated Model
NEMS
Agricultural Water Demand
ModelRegional Agricultural Water
Demand
Municipal Water Demand Model
Regional MunicipalWater Demand
WaterConsumption.csvWaterDrawFactor.csv
Industrial Water Demand ModelRegional Industrial Water
DemandWaterConsumption.csvWaterDrawFactor.csv
Policy Model
Sandia/NETL: Metrics_HUC8.xlsx (Environmental Water
Constraints)
Macro Economic Model
GDP_Deflators.csv
Population ModelForecasted Population Growth and Movement
Thermal Power Model
EDBPUnitData.csvFuelCode_FuelType.csvGenerationData.csvNewNuclearSites.csvPlantCoolingTech.csvUnitTech_ECPType.csvWaterDrawByTech.csvWaterUseByTech.csv
Financial ModelFinancial RoutinesInvestment.csv
Hydro Power Model
Water Demand and Power Generation from Hydro‐electric Power Plants
Water Demand
Water Supply Data VisualizationGIS Supported
Energy‐Water ModelNETL Model for the
Assessment of Competing Demands
for Water Use Under Alternative Water
Availability Scenarios
Water Demand Over Time
repNonPowerUse.csvrepPowerUse.csv
repWaterUseByHUC.csvWater draw and
consumption in power & non‐power sectors by year, HUC, sector, season & plant
(power only)
Marginal Cost of Water Over Time
repMarginalCost.csvMarginal cost of water by year, HUC and season
Water Supply by Source Over TimerepWaterUseBy HUC.csvWater supply by year, HUC, season and water source
Cooling Technology RetrofitsrepRetrofits.csv
"Replacement" Water for Power
PlantsrepDemandReduction.csvPurchased from agricultureTreated water from brackish
sources
Daily GenerationrepDailyGeneration.csv
Daily power generation by unit and season
Water AvailabilityModel
Regional Surface and Groundwater Availability
median_water_by_HUC2.csvWater_Available.csv
DrawOverlapFactor.csv
Scenario Tool
