cross-platform report - sep 2013 (nielsen)
DESCRIPTION
TRANSCRIPT
V I E W I N GO N D E M A N DTHE CROSS-PLATFORM REPORTSEPTEMBER 2013
THE CROSS-PLATFORM SERIES | Q2 2013
2 Copyright © 2013 The Nielsen Company
Less than 10 years ago, watching TV shows on a television set was as easy
as being at home in time to turn the TV on. I remember having seven VCR
tapes, labeled with each day of the week and I would tape shows on the
days I could not be home.
Much has changed over the past decade, and watching TV shows has
become increasingly easy over a multitude of platforms. As an avid
viewer of shows, this has been a very good development. Digital Video
Recorders (DVRs) allow for easy recording and storing of many shows for
consumption later that night, that week, or for that matter, whenever we
want. Taping entire seasons and “catching up” at a later time has allowed
a flexibility of time-shifting beyond measure. With DVRs now available in
50% of US homes, the related shifts in viewing behaviors continue to be
both an opportunity and a challenge for distributors of content.
As we continue to use this report to highlight the shifts in video
consumption by age and ethnicity, we’ve also chosen to highlight a
distribution platform that while not new, has only recently started to
make a mark. This quarter, we will take a closer look at Video On Demand
(VOD) as we explore the potential opportunity this platform offers.
WELCOME
DOUNIA TURRILL
SVP INSIGHTS, NIELSEN
D O U N I A
3THE CROSS-PLATFORM REPORT | Q2 2013
In the midst of developments for time-shifting and increased penetration
of mobile devices which enable video consumption, one technology has
grown seemingly unnoticed; Video On Demand (VOD). Set-top box VOD
is currently available in approximately 60% of television households, up
from 37% in 2008. The fact, however, is that this technology has been
available for close to a decade through certain cable providers. VOD offers
the opportunity to time-shift and catch up on shows through a single
platform delivered to the consumer from cable or satellite providers
without the need for extra hardware.
The reason this technology has taken so long to rise to the surface of
awareness is two-fold. First as a nascent technology delivered by the
program providers the interface was often cumbersome and difficult
for the consumer to use. Second, the program distributors were wary of
delivering content outside of their window of monetization if measurement
could not account for the audience deliveries. Because of these issues,
VOD content was often populated with old shows, or past seasons of
shows.
OVER THE PAST YEAR, NOT ONLY HAS ACCESS TO VOD BECOME MUCH MORE USER FRIENDLY BUT NETWORKS HAVE BEEN MORE APT TO EXPERIMENT WITH RECENTLY TELECAST CONTENT AND MULTIPLE EPISODES FROM THE CURRENT SEASON.
This pivot has in large part been facilitated by the ability to include and
break out viewing from the VOD play to the current episode of a show if
aired within the seven day window of an original telecast. In fact, if the
content on VOD includes the same national commercials as the television
airing of a show, the viewing from the first three days are included in the
Live+ 3 Day Commercial (C3) rating in the same way Nielsen credits DVR
playback.
This has been a big development for networks and advertisers who
both need to show that viewing is occurring and also that ads are being
viewed. In another flavor of VOD content distribution and monetization,
networks are able to provide shows to consumers with fewer commercials
but also fast-forward disabled. With measurement of this particular type
of Video On Demand, this creates another opportunity for all the players
in the ecosystem. Cable and satellite providers can now offer DVR-like
capabilities to their consumers in an easy fashion, and networks have an
additional opportunity to deliver content to consumers who in turn have
an expanded choice for viewing when, where and how they want.
4 Copyright © 2013 The Nielsen Company
VIDEO ON DEMANDWith VOD now available in 60% of US television households, content providers are able to deliver their programs in yet
another consumer friendly way allowing viewers an opportunity to sample new shows they might have otherwise missed
or catch up on shows they love. In light of this expanded opportunity to deliver content, we provide different options for
measurement and therefore monetization of this content.
RECENTLY TELECAST VODDefined as programming that is delivered on the VOD platform within 7 days of the original telecast of a show, with
the same commercial load. Delivered this way, the viewing contributes to the linear telecast of the program for 7 days,
including the Live+3 Day Commercial (C3) rating.
VOD, CROSS-PLATFORMDefined as programming that is delivered on the VOD platform in a format that is different or outside the 7 day window
of the linear telecast of an episode. Measurement of this content is not included in the linear rating of a program either
because it is available outside the 7 day window or because it does not have the same commercial load.
5THE CROSS-PLATFORM REPORT | Q2 2013
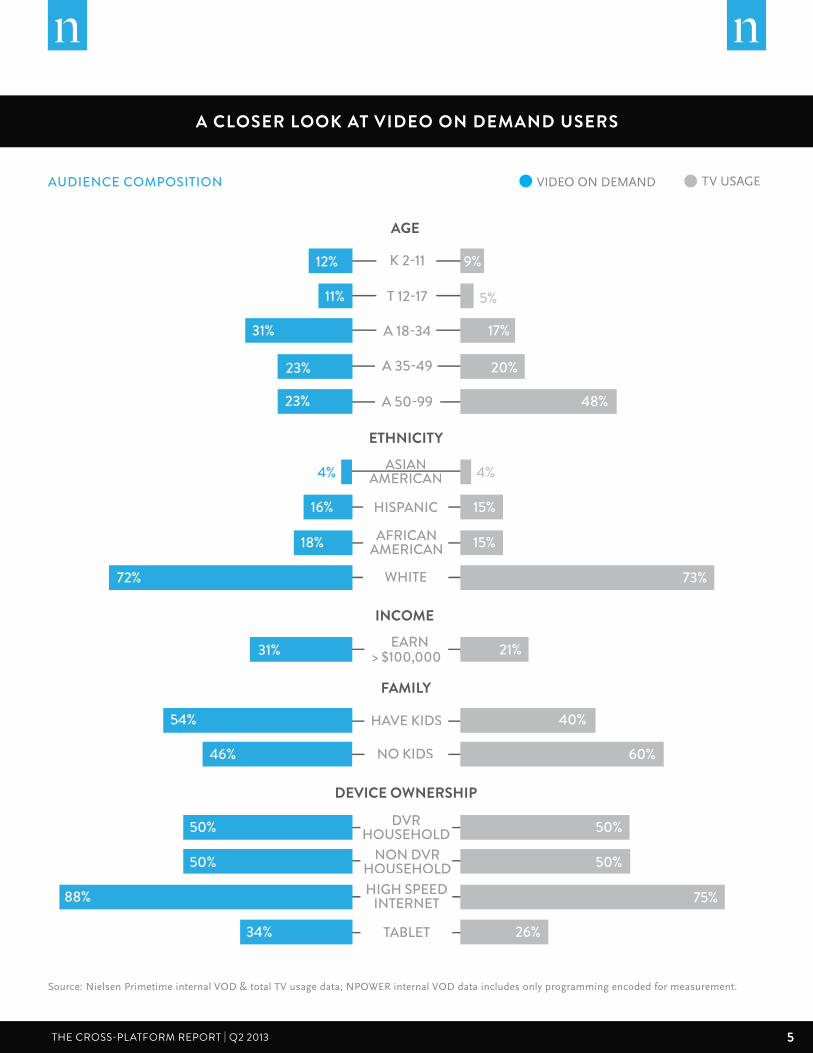
A CLOSER LOOK AT VIDEO ON DEMAND USERS
ASIANAMERICAN
ETHNICITY
HISPANIC
AFRICAN AMERICAN
WHITE
18%
72%
16%
DVRHOUSEHOLD
NON DVRHOUSEHOLD
DEVICE OWNERSHIP
HIGH SPEEDINTERNET
TABLET
50%
88%
34%
50%
K 2-11
AGE
T 12-17
A 18-34
A 35-49
12%
31%
23%
A 50-9923%
11%
EARN > $100,000
INCOME
31%
HAVE KIDS
FAMILY
76%
54%
NO KIDS
76%
15%
73%
15%
50%
75%
26%
50%
9%
17%
20%
48%
4%4%
5%
21%
40%
60%46%
VIDEO ON DEMAND TV USAGEAUDIENCE COMPOSITION
Source: Nielsen Primetime internal VOD & total TV usage data; NPOWER internal VOD data includes only programming encoded for measurement.
6 Copyright © 2013 The Nielsen Company
GENERALDOCUMENTARY
FEATURE FILM
GENERAL DRAMA
P18-34VIDEO ON DEMAND TIME-SHIFTED
52% 42%
26% 34%
8% 6%
P50+ P18-34
51%40%
2% 0%
17%
P50+
8%
FEATUREFILM
GENERALDRAMA
GENERALDOCUMENTARY
PARTICIPATIONVARIETY
COMEDYVARIETY
GENERALVARIETY
OFFICIALPOLICE
SCIENCEFICTION
SITUATIONCOMEDY
POPULARMUSIC
52 *
3
29
48
147
126 71 11 21 31
5002
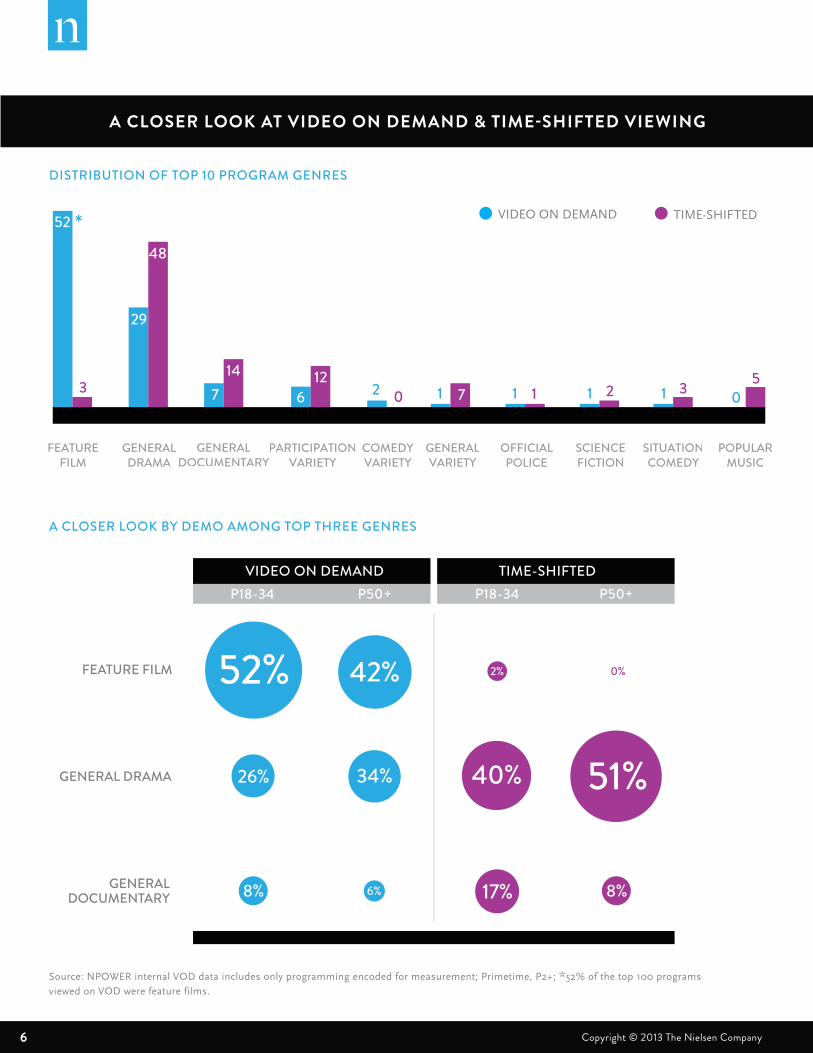
A CLOSER LOOK AT VIDEO ON DEMAND & TIME-SHIFTED VIEWING
DISTRIBUTION OF TOP 10 PROGRAM GENRES
A CLOSER LOOK BY DEMO AMONG TOP THREE GENRES
VIDEO ON DEMAND TIME-SHIFTED
Source: NPOWER internal VOD data includes only programming encoded for measurement; Primetime, P2+; *52% of the top 100 programs viewed on VOD were feature films.
7THE CROSS-PLATFORM REPORT | Q2 2013
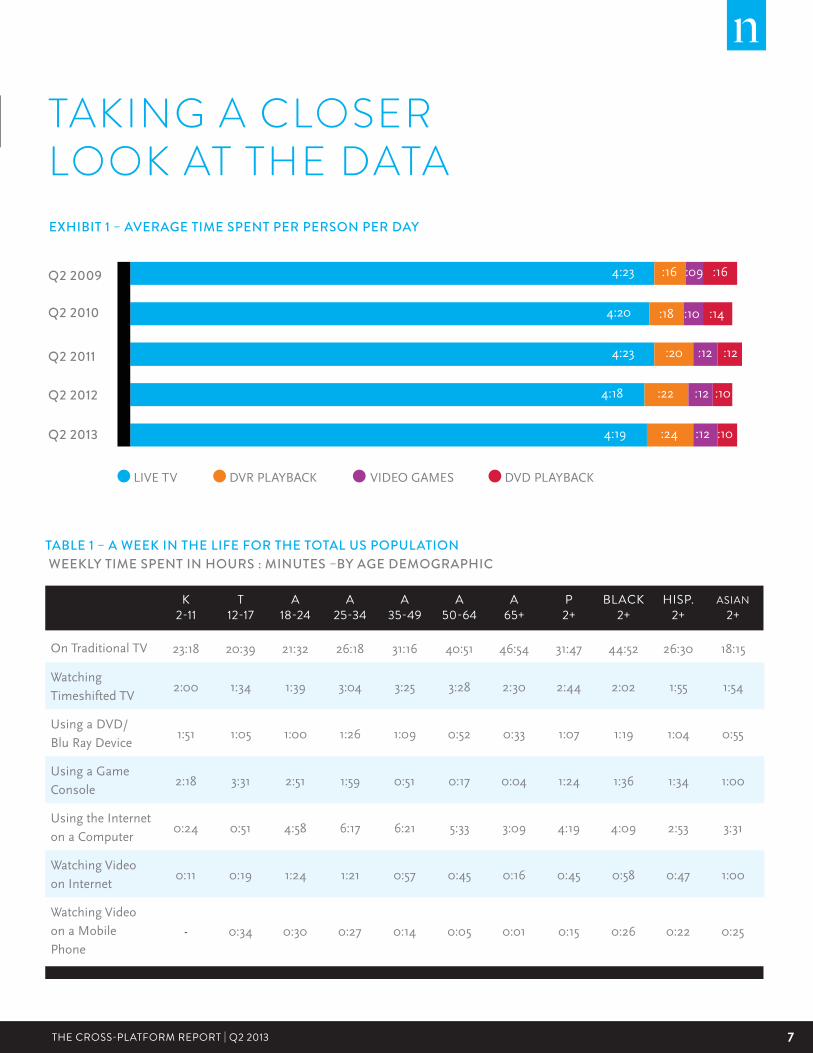
TAKING A CLOSER LOOK AT THE DATA
TABLE 1 – A WEEK IN THE LIFE FOR THE TOTAL US POPULATION WEEKLY TIME SPENT IN HOURS : MINUTES –BY AGE DEMOGRAPHIC
K2-11
T12-17
A18-24
A25-34
A35-49
A50-64
A65+
P2+
BLACK2+
HISP.2+
ASIAN2+
On Traditional TV 23:18 20:39 21:32 26:18 31:16 40:51 46:54 31:47 44:52 26:30 18:15
Watching
Timeshifted TV 2:00 1:34 1:39 3:04 3:25 3:28 2:30 2:44 2:02 1:55 1:54
Using a DVD/
Blu Ray Device1:51 1:05 1:00 1:26 1:09 0:52 0:33 1:07 1:19 1:04 0:55
Using a Game
Console2:18 3:31 2:51 1:59 0:51 0:17 0:04 1:24 1:36 1:34 1:00
Using the Internet
on a Computer 0:24 0:51 4:58 6:17 6:21 5:33 3:09 4:19 4:09 2:53 3:31
Watching Video
on Internet 0:11 0:19 1:24 1:21 0:57 0:45 0:16 0:45 0:58 0:47 1:00
Watching Video
on a Mobile
Phone - 0:34 0:30 0:27 0:14 0:05 0:01 0:15 0:26 0:22 0:25
4:23
4:20
4:23
4:18
4:19
:16
:18
:20
:22
:24
:09
:10
:12
:12
:12
:16
:14
:12
:10
:10
Q2 2009
Q2 2010
Q2 2011
Q2 2012
Q2 2013
EXHIBIT 1 – AVERAGE TIME SPENT PER PERSON PER DAY
LIVE TV DVR PLAYBACK VIDEO GAMES DVD PLAYBACK
8 Copyright © 2013 The Nielsen Company
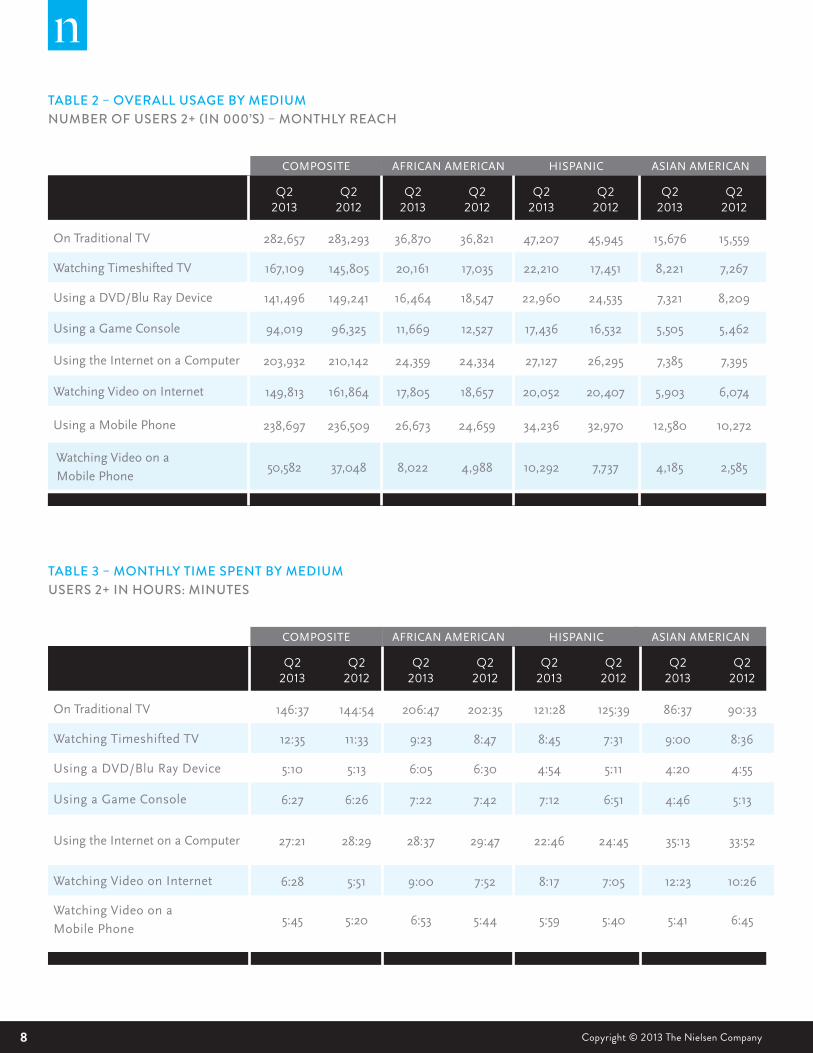
TABLE 2 – OVERALL USAGE BY MEDIUM NUMBER OF USERS 2+ (IN 000’S) – MONTHLY REACH
Q22013
Q22012
Q22013
Q22012
Q22013
Q22012
Q22013
Q22012
On Traditional TV 282,657 283,293 36,870 36,821 47,207 45,945 15,676 15,559
Watching Timeshifted TV 167,109 145,805 20,161 17,035 22,210 17,451 8,221 7,267
Using a DVD/Blu Ray Device 141,496 149,241 16,464 18,547 22,960 24,535 7,321 8,209
Using a Game Console 94,019 96,325 11,669 12,527 17,436 16,532 5,505 5,462
Using the Internet on a Computer 203,932 210,142 24,359 24,334 27,127 26,295 7,385 7,395
Watching Video on Internet 149,813 161,864 17,805 18,657 20,052 20,407 5,903 6,074
Using a Mobile Phone 238,697 236,509 26,673 24,659 34,236 32,970 12,580 10,272
Watching Video on a
Mobile Phone50,582 37,048 8,022 4,988 10,292 7,737 4,185 2,585
AFRICAN AMERICAN HISPANIC ASIAN AMERICANCOMPOSITE
TABLE 3 – MONTHLY TIME SPENT BY MEDIUMUSERS 2+ IN HOURS: MINUTES
Q22013
Q22012
Q22013
Q22012
Q22013
Q22012
Q22013
Q22012
On Traditional TV 146:37 144:54 206:47 202:35 121:28 125:39 86:37 90:33
Watching Timeshifted TV 12:35 11:33 9:23 8:47 8:45 7:31 9:00 8:36
Using a DVD/Blu Ray Device 5:10 5:13 6:05 6:30 4:54 5:11 4:20 4:55
Using a Game Console 6:27 6:26 7:22 7:42 7:12 6:51 4:46 5:13
Using the Internet on a Computer 27:21 28:29 28:37 29:47 22:46 24:45 35:13 33:52
Watching Video on Internet 6:28 5:51 9:00 7:52 8:17 7:05 12:23 10:26
Watching Video on a
Mobile Phone5:45 5:20 6:53 5:44 5:59 5:40 5:41 6:45
AFRICAN AMERICAN HISPANIC ASIAN AMERICANCOMPOSITE
9THE CROSS-PLATFORM REPORT | Q2 2013
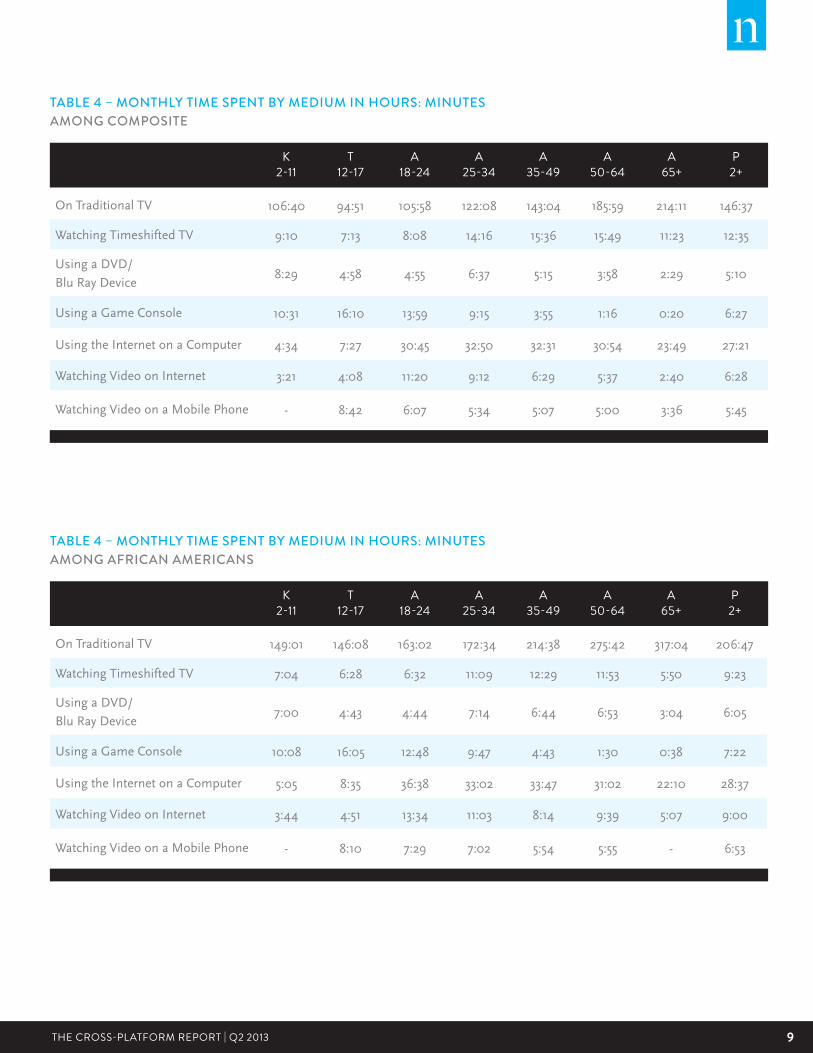
TABLE 4 – MONTHLY TIME SPENT BY MEDIUM IN HOURS: MINUTES AMONG COMPOSITE
K2-11
T12-17
A18-24
A25-34
A35-49
A50-64
A65+
P2+
On Traditional TV 106:40 94:51 105:58 122:08 143:04 185:59 214:11 146:37
Watching Timeshifted TV 9:10 7:13 8:08 14:16 15:36 15:49 11:23 12:35
Using a DVD/
Blu Ray Device8:29 4:58 4:55 6:37 5:15 3:58 2:29 5:10
Using a Game Console 10:31 16:10 13:59 9:15 3:55 1:16 0:20 6:27
Using the Internet on a Computer 4:34 7:27 30:45 32:50 32:31 30:54 23:49 27:21
Watching Video on Internet 3:21 4:08 11:20 9:12 6:29 5:37 2:40 6:28
Watching Video on a Mobile Phone - 8:42 6:07 5:34 5:07 5:00 3:36 5:45
TABLE 4 – MONTHLY TIME SPENT BY MEDIUM IN HOURS: MINUTES AMONG AFRICAN AMERICANS
K2-11
T12-17
A18-24
A25-34
A35-49
A50-64
A65+
P2+
On Traditional TV 149:01 146:08 163:02 172:34 214:38 275:42 317:04 206:47
Watching Timeshifted TV 7:04 6:28 6:32 11:09 12:29 11:53 5:50 9:23
Using a DVD/
Blu Ray Device7:00 4:43 4:44 7:14 6:44 6:53 3:04 6:05
Using a Game Console 10:08 16:05 12:48 9:47 4:43 1:30 0:38 7:22
Using the Internet on a Computer 5:05 8:35 36:38 33:02 33:47 31:02 22:10 28:37
Watching Video on Internet 3:44 4:51 13:34 11:03 8:14 9:39 5:07 9:00
Watching Video on a Mobile Phone - 8:10 7:29 7:02 5:54 5:55 - 6:53
10 Copyright © 2013 The Nielsen Company
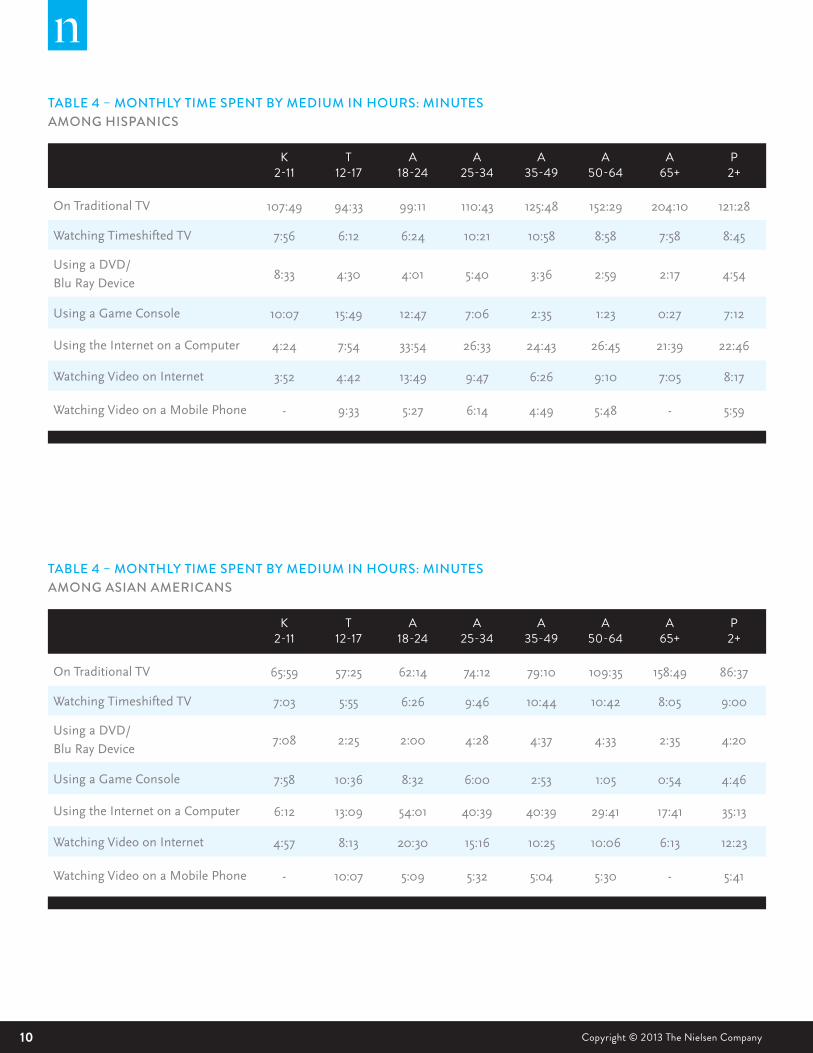
TABLE 4 – MONTHLY TIME SPENT BY MEDIUM IN HOURS: MINUTES AMONG ASIAN AMERICANS
K2-11
T12-17
A18-24
A25-34
A35-49
A50-64
A65+
P2+
On Traditional TV 65:59 57:25 62:14 74:12 79:10 109:35 158:49 86:37
Watching Timeshifted TV 7:03 5:55 6:26 9:46 10:44 10:42 8:05 9:00
Using a DVD/
Blu Ray Device7:08 2:25 2:00 4:28 4:37 4:33 2:35 4:20
Using a Game Console 7:58 10:36 8:32 6:00 2:53 1:05 0:54 4:46
Using the Internet on a Computer 6:12 13:09 54:01 40:39 40:39 29:41 17:41 35:13
Watching Video on Internet 4:57 8:13 20:30 15:16 10:25 10:06 6:13 12:23
Watching Video on a Mobile Phone - 10:07 5:09 5:32 5:04 5:30 - 5:41
TABLE 4 – MONTHLY TIME SPENT BY MEDIUM IN HOURS: MINUTES AMONG HISPANICS
K2-11
T12-17
A18-24
A25-34
A35-49
A50-64
A65+
P2+
On Traditional TV 107:49 94:33 99:11 110:43 125:48 152:29 204:10 121:28
Watching Timeshifted TV 7:56 6:12 6:24 10:21 10:58 8:58 7:58 8:45
Using a DVD/
Blu Ray Device8:33 4:30 4:01 5:40 3:36 2:59 2:17 4:54
Using a Game Console 10:07 15:49 12:47 7:06 2:35 1:23 0:27 7:12
Using the Internet on a Computer 4:24 7:54 33:54 26:33 24:43 26:45 21:39 22:46
Watching Video on Internet 3:52 4:42 13:49 9:47 6:26 9:10 7:05 8:17
Watching Video on a Mobile Phone - 9:33 5:27 6:14 4:49 5:48 - 5:59
11THE CROSS-PLATFORM REPORT | Q2 2013
STREAMING QUINTILE
# OF PERSONS
(000)
STREAM INTERNET TV
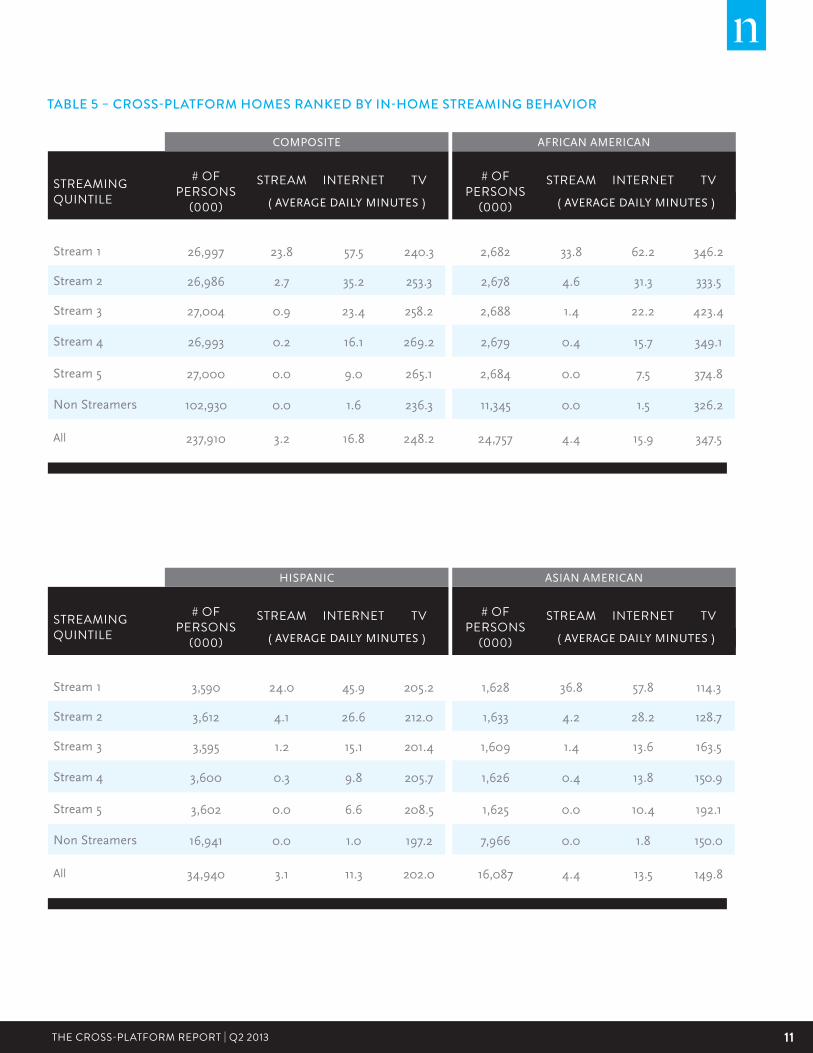
Stream 1 26,997 23.8 57.5 240.3
Stream 2 26,986 2.7 35.2 253.3
Stream 3 27,004 0.9 23.4 258.2
Stream 4 26,993 0.2 16.1 269.2
Stream 5 27,000 0.0 9.0 265.1
Non Streamers 102,930 0.0 1.6 236.3
All 237,910 3.2 16.8 248.2
COMPOSITE
( AVERAGE DAILY MINUTES )
TABLE 5 – CROSS-PLATFORM HOMES RANKED BY IN-HOME STREAMING BEHAVIOR
# OF PERSONS
(000)
STREAM INTERNET TV
2,682 33.8 62.2 346.2
2,678 4.6 31.3 333.5
2,688 1.4 22.2 423.4
2,679 0.4 15.7 349.1
2,684 0.0 7.5 374.8
11,345 0.0 1.5 326.2
24,757 4.4 15.9 347.5
( AVERAGE DAILY MINUTES )
AFRICAN AMERICAN
STREAMING QUINTILE
# OF PERSONS
(000)
STREAM INTERNET TV
Stream 1 3,590 24.0 45.9 205.2
Stream 2 3,612 4.1 26.6 212.0
Stream 3 3,595 1.2 15.1 201.4
Stream 4 3,600 0.3 9.8 205.7
Stream 5 3,602 0.0 6.6 208.5
Non Streamers 16,941 0.0 1.0 197.2
All 34,940 3.1 11.3 202.0
HISPANIC
( AVERAGE DAILY MINUTES )
# OF PERSONS
(000)
STREAM INTERNET TV
1,628 36.8 57.8 114.3
1,633 4.2 28.2 128.7
1,609 1.4 13.6 163.5
1,626 0.4 13.8 150.9
1,625 0.0 10.4 192.1
7,966 0.0 1.8 150.0
16,087 4.4 13.5 149.8
( AVERAGE DAILY MINUTES )
ASIAN AMERICAN
12 Copyright © 2013 The Nielsen Company
INTERNET QUINTILE
# OF PERSONS
(000)
STREAM INTERNET TV
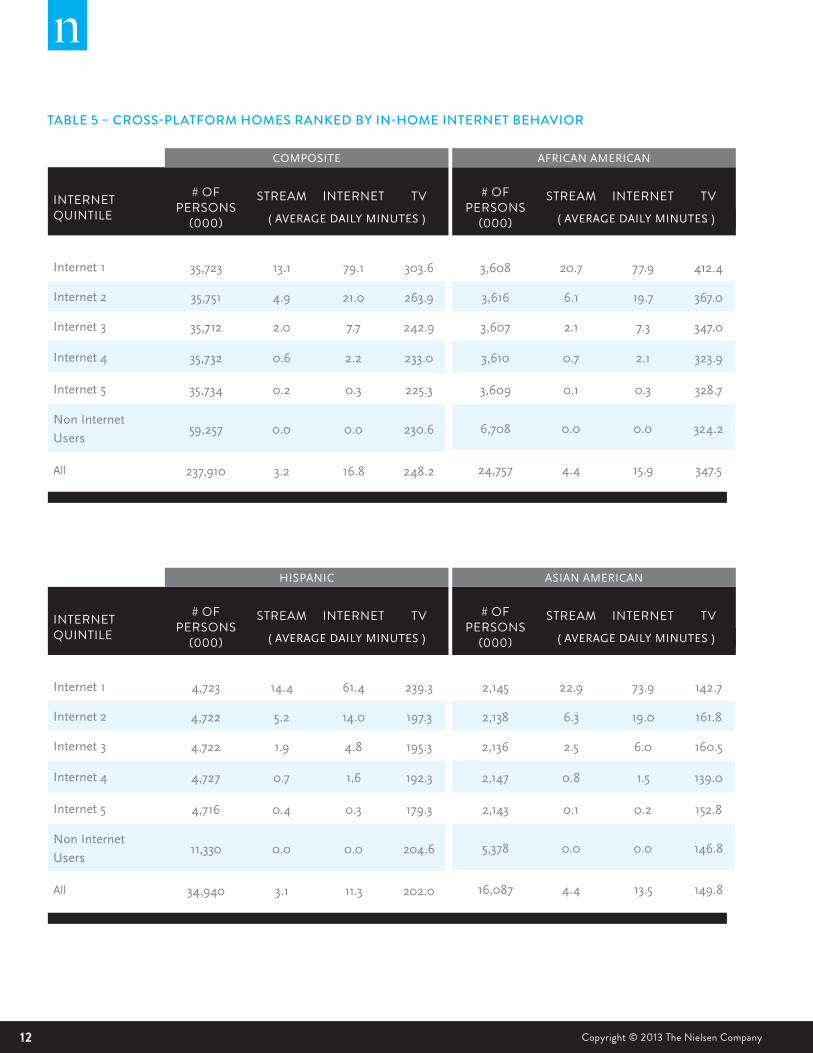
Internet 1 35,723 13.1 79.1 303.6
Internet 2 35,751 4.9 21.0 263.9
Internet 3 35,712 2.0 7.7 242.9
Internet 4 35,732 0.6 2.2 233.0
Internet 5 35,734 0.2 0.3 225.3
Non Internet
Users59,257 0.0 0.0 230.6
All 237,910 3.2 16.8 248.2
COMPOSITE
( AVERAGE DAILY MINUTES )
TABLE 5 – CROSS-PLATFORM HOMES RANKED BY IN-HOME INTERNET BEHAVIOR
# OF PERSONS
(000)
STREAM INTERNET TV
3,608 20.7 77.9 412.4
3,616 6.1 19.7 367.0
3,607 2.1 7.3 347.0
3,610 0.7 2.1 323.9
3,609 0.1 0.3 328.7
6,708 0.0 0.0 324.2
24,757 4.4 15.9 347.5
( AVERAGE DAILY MINUTES )
AFRICAN AMERICAN
INTERNET QUINTILE
# OF PERSONS
(000)
STREAM INTERNET TV
Internet 1 4,723 14.4 61.4 239.3
Internet 2 4,722 5.2 14.0 197.3
Internet 3 4,722 1.9 4.8 195.3
Internet 4 4,727 0.7 1.6 192.3
Internet 5 4,716 0.4 0.3 179.3
Non Internet
Users11,330 0.0 0.0 204.6
All 34,940 3.1 11.3 202.0
HISPANIC
( AVERAGE DAILY MINUTES )
# OF PERSONS
(000)
STREAM INTERNET TV
2,145 22.9 73.9 142.7
2,138 6.3 19.0 161.8
2,136 2.5 6.0 160.5
2,147 0.8 1.5 139.0
2,143 0.1 0.2 152.8
5,378 0.0 0.0 146.8
16,087 4.4 13.5 149.8
( AVERAGE DAILY MINUTES )
ASIAN AMERICAN
13THE CROSS-PLATFORM REPORT | Q2 2013
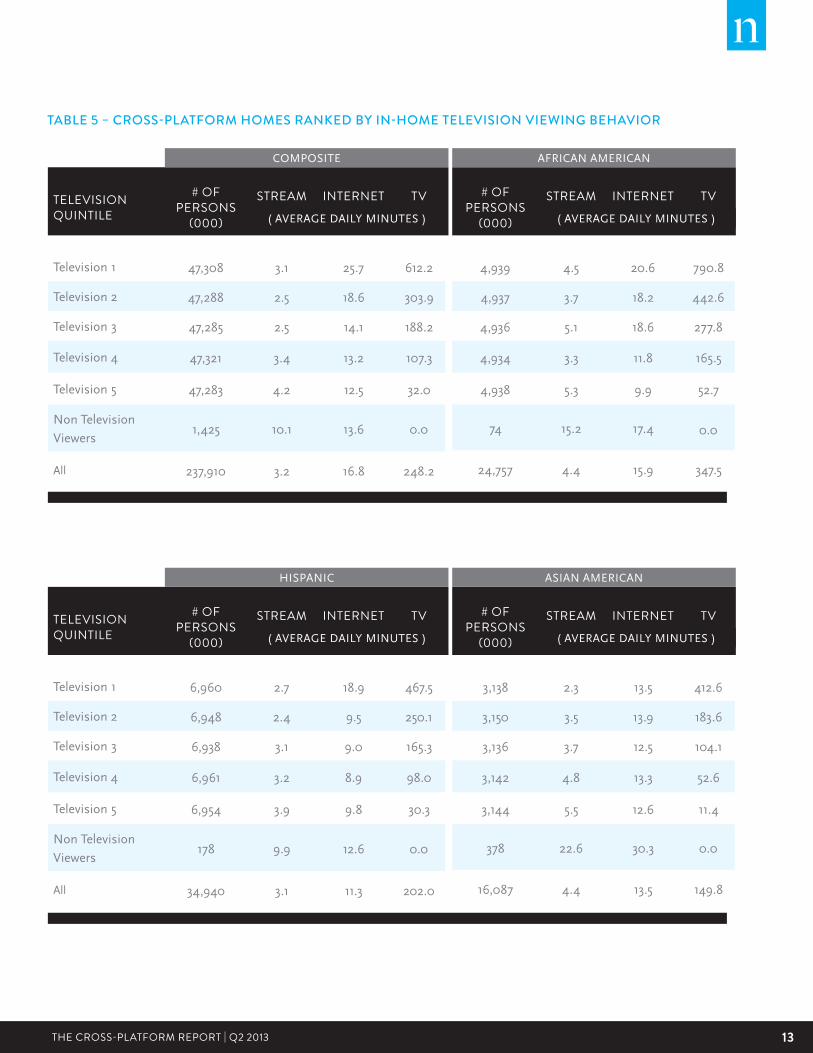
TELEVISION QUINTILE
# OF PERSONS
(000)
STREAM INTERNET TV
Television 1 47,308 3.1 25.7 612.2
Television 2 47,288 2.5 18.6 303.9
Television 3 47,285 2.5 14.1 188.2
Television 4 47,321 3.4 13.2 107.3
Television 5 47,283 4.2 12.5 32.0
Non Television
Viewers1,425 10.1 13.6 0.0
All 237,910 3.2 16.8 248.2
COMPOSITE
( AVERAGE DAILY MINUTES )
TABLE 5 – CROSS-PLATFORM HOMES RANKED BY IN-HOME TELEVISION VIEWING BEHAVIOR
# OF PERSONS
(000)
STREAM INTERNET TV
4,939 4.5 20.6 790.8
4,937 3.7 18.2 442.6
4,936 5.1 18.6 277.8
4,934 3.3 11.8 165.5
4,938 5.3 9.9 52.7
74 15.2 17.4 0.0
24,757 4.4 15.9 347.5
( AVERAGE DAILY MINUTES )
AFRICAN AMERICAN
TELEVISION QUINTILE
# OF PERSONS
(000)
STREAM INTERNET TV
Television 1 6,960 2.7 18.9 467.5
Television 2 6,948 2.4 9.5 250.1
Television 3 6,938 3.1 9.0 165.3
Television 4 6,961 3.2 8.9 98.0
Television 5 6,954 3.9 9.8 30.3
Non Television
Viewers178 9.9 12.6 0.0
All 34,940 3.1 11.3 202.0
HISPANIC
( AVERAGE DAILY MINUTES )
# OF PERSONS
(000)
STREAM INTERNET TV
3,138 2.3 13.5 412.6
3,150 3.5 13.9 183.6
3,136 3.7 12.5 104.1
3,142 4.8 13.3 52.6
3,144 5.5 12.6 11.4
378 22.6 30.3 0.0
16,087 4.4 13.5 149.8
( AVERAGE DAILY MINUTES )
ASIAN AMERICAN
14 Copyright © 2013 The Nielsen Company
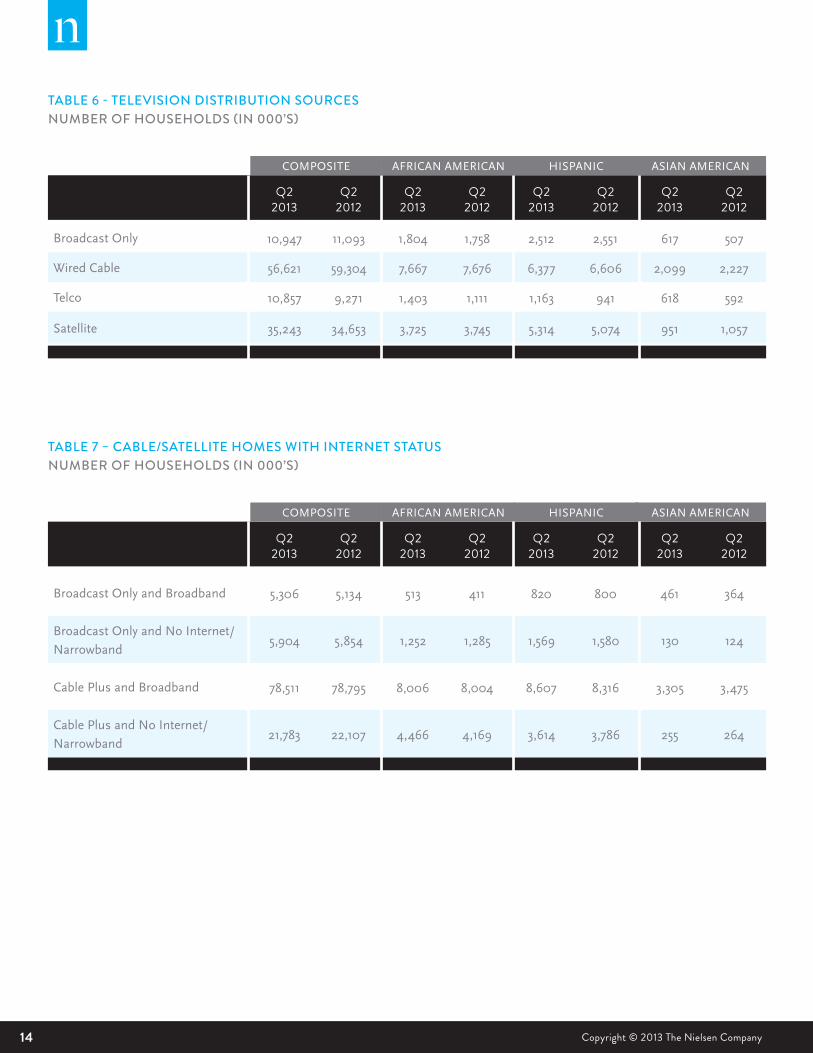
TABLE 6 - TELEVISION DISTRIBUTION SOURCESNUMBER OF HOUSEHOLDS (IN 000’S)
Q22013
Q22012
Q22013
Q22012
Q22013
Q22012
Q22013
Q22012
Broadcast Only 10,947 11,093 1,804 1,758 2,512 2,551 617 507
Wired Cable 56,621 59,304 7,667 7,676 6,377 6,606 2,099 2,227
Telco 10,857 9,271 1,403 1,111 1,163 941 618 592
Satellite 35,243 34,653 3,725 3,745 5,314 5,074 951 1,057
AFRICAN AMERICAN HISPANIC ASIAN AMERICANCOMPOSITE
TABLE 7 – CABLE/SATELLITE HOMES WITH INTERNET STATUSNUMBER OF HOUSEHOLDS (IN 000’S)
Q22013
Q22012
Q22013
Q22012
Q22013
Q22012
Q22013
Q22012
Broadcast Only and Broadband 5,306 5,134 513 411 820 800 461 364
Broadcast Only and No Internet/
Narrowband5,904 5,854 1,252 1,285 1,569 1,580 130 124
Cable Plus and Broadband 78,511 78,795 8,006 8,004 8,607 8,316 3,305 3,475
Cable Plus and No Internet/
Narrowband21,783 22,107 4,466 4,169 3,614 3,786 255 264
AFRICAN AMERICAN HISPANIC ASIAN AMERICANCOMPOSITE
15THE CROSS-PLATFORM REPORT | Q2 2013
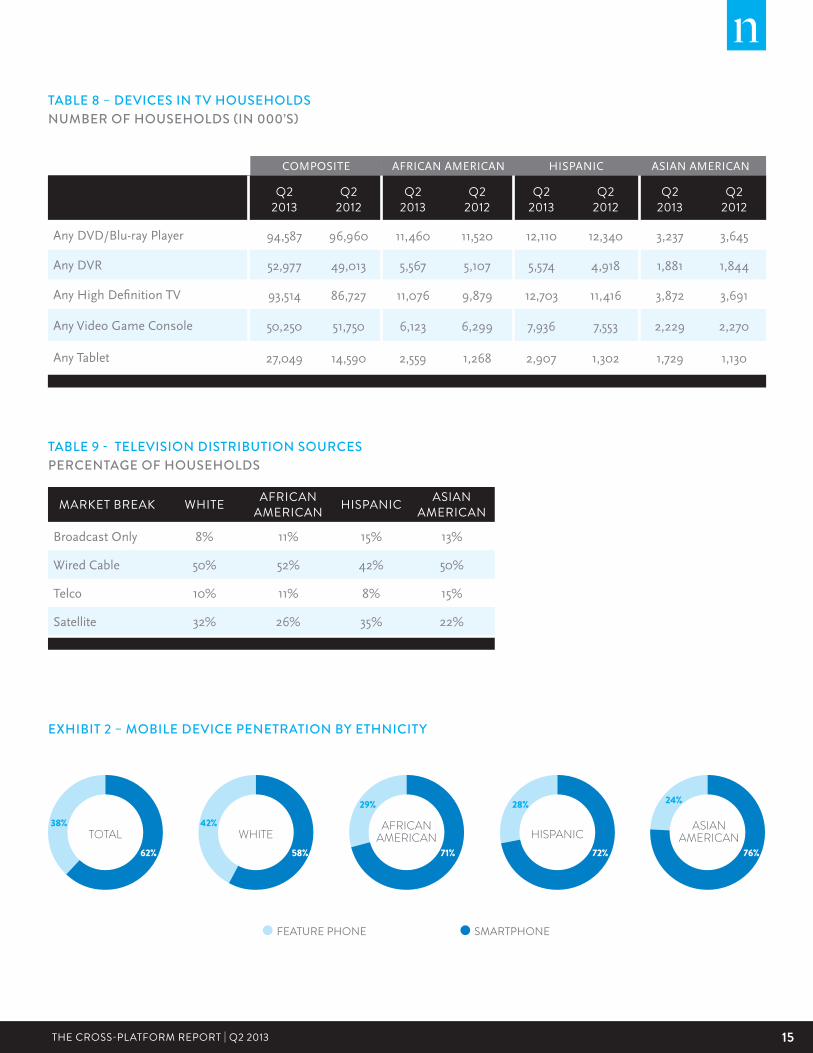
TABLE 8 – DEVICES IN TV HOUSEHOLDS NUMBER OF HOUSEHOLDS (IN 000’S)
Q22013
Q22012
Q22013
Q22012
Q22013
Q22012
Q22013
Q22012
Any DVD/Blu-ray Player 94,587 96,960 11,460 11,520 12,110 12,340 3,237 3,645
Any DVR 52,977 49,013 5,567 5,107 5,574 4,918 1,881 1,844
Any High Defi nition TV 93,514 86,727 11,076 9,879 12,703 11,416 3,872 3,691
Any Video Game Console 50,250 51,750 6,123 6,299 7,936 7,553 2,229 2,270
Any Tablet 27,049 14,590 2,559 1,268 2,907 1,302 1,729 1,130
AFRICAN AMERICAN HISPANIC ASIAN AMERICANCOMPOSITE
EXHIBIT 2 – MOBILE DEVICE PENETRATION BY ETHNICITY
TOTAL38%
62%
WHITE42%
58%
AFRICANAMERICAN
29%
71%
24%
76%
HISPANIC
28%
72%
ASIANAMERICAN
SMARTPHONEFEATURE PHONE
TABLE 9 - TELEVISION DISTRIBUTION SOURCES PERCENTAGE OF HOUSEHOLDS
MARKET BREAK WHITE AFRICANAMERICAN HISPANIC ASIAN
AMERICAN
Broadcast Only 8% 11% 15% 13%
Wired Cable 50% 52% 42% 50%
Telco 10% 11% 8% 15%
Satellite 32% 26% 35% 22%
16 Copyright © 2013 The Nielsen Company
SOURCING & METHODOLOGIES
GLOSSARY
TV HOUSEHOLD: Nielsen now defines a TV household as a home with at least one
operable TV/monitor with the ability to deliver video via traditional means of antennae,
cable STB or Satellite receiver and /or with a broadband connection.
TRADITIONAL TV: Watching live or timeshifted content on a television set delivered by
broadcast signal or a paid TV subscription.
WIRED CABLE: Traditional cable delivered through wires to your home.
TELCO: A paid TV subscription delivered fiber-optically via a traditional telephony provider.
SATELLITE: A paid TV subscription where the signal is distributed to an orbiting
satellite. The amplified signal is then re-transmitted to the home and received via a dish.
(Sometimes also referred to as “dish”).
BROADBAND: A paid, high-speed Internet access delivered via DSL, Cable Internet
through cable provider, Fiber-Optic Service, U-Verse, Satellite Internet, Data Card (aircard
that connects to a cellular phone network) or PC tethered to cell phone (cellular phone
network).
NARROWBAND: A household that accesses the Internet via a telephone line (often
referred to as dial up).
BROADCAST ONLY: A mode of television content delivery that does not involve satellite
transmission or cables (ie—a paid service). Also commonly referred to as “Over-the-air.”
TELEVISION METHODOLOGY
On Traditional TV includes Live usage plus any playback viewing within the measurement
period. Timeshifted TV is playback primarily on a DVR but includes playback from VOD,
DVD recorders, server based DVR’s and services like Start Over. In response to these
services continued growth, for Q2 2012 forward this report will no longer feature the “only
in homes with DVRs,” which was limited to physical DVR presence.
On Traditional TV reach includes those viewing at least one minute within the
measurement period. This includes Live viewing plus any playback within the measurement
period. Second Quarter 2013 Television data is based on the following measurement
interval: 4/1/13-06/30/13. As of February 2011, DVR Playback has been incorporated into
the Persons Using Television (PUT) Statistic.
Metrics for Using a DVD/Blu Ray Device and Using a Game Console are based on when
these devices are in use for any purpose, not just for accessing media content. For
example, Using a Game Console will also include time when the game console is being
used to play video games.
17THE CROSS-PLATFORM REPORT | Q2 2013
ONLINE METHODOLOGY
In July 2011 an improved hybrid methodology was introduced in Nielsen’s NetView and
VideoCensus product. This methodology combines a census level accounting of page
views and video streams where Nielsen measurement tags have been deployed in order to
project audience and behavior to the full universe of all Internet users. For VideoCensus, the
portion of the total video streams calibrated by census data, previously allocated to Home/
Work computers, are now allocated to other devices and locations such as smartphones
and viewing outside of home and work. This change affects both “Watching Video on the
Internet” and “Using the Internet” figures. Beginning in Q1 2012, Cross-Platform metrics are
derived from the new hybrid panel. Year over year trends are available beginning in Q3 2012.
Data should not be trended to previous quarters’ published editions.
Hours:minutes for Internet and video use are based on the universe of persons who used
the Internet/watched online video. All Internet figures are weekly or monthly averages over
the course of the quarter. All “Using the Internet on a Computer” metrics are derived from
Nielsen NetView product, while all “Watching Video on the Internet” metrics are derived
from Nielsen VideoCensus product. Watching video on the Internet is a subset of Using the
Internet on a computer.
Due to the release of the Chrome browser v.19 in May 2012, some Nielsen NetView data for
a small number of sites that have extensive use of HTTPS is under reported for May and
June 2012. A solution has been implemented for July 2012 reporting. This affects the “Using
the Internet on a Computer” and “Internet” time spent figures provided in this report for
current quarter data.
May 2012 volume metrics were affected for two YouTube channel entities. As of June 2012,
YouTube Partner reporting became available through Nielsen VideoCensus featuring May
2012 data. YouTube Partner data is reported as individual channels under the YouTube
brand in Nielsen VideoCensus. Data for each YouTube partner is aggregated across two
entity levels, the broadest as Nielsen VideoCensus channel entity and the more granular
being Nielsen VideoCensus client-defined entity. This affects the “watching video on the
Internet” and “stream” numbers in this report for current quarter data.
Due to a processing error, YouTube brand-level stream and duration metrics have been
inflated since May 2012, which impacted “Watching Video on Internet”. The current
report contains the corrected metrics for this quarter. However, because of an additional
processing issue that occurred in Q2 2012 (above note), the prior year data could not be
restated and this report contains the originally released data points for Q2 2012. Future
editions of the report will contain the restated year over year comparisons. Data should not
be trended to previous quarters’ published editions.
MOBILE METHODOLOGY
Mobile video user projection, time spent and composition data are based on survey
analysis of past 30 day use during the period. The mobile video audience figures in this
report include mobile phone users (aged 13+) who access mobile video through any means
(including mobile Web, subscription based,downloads and applications). Beginning in
Q1 2012, data reflect enhanced methodology for calculating the Total Minutes spent
watching video on a mobile phone. Total Minutes = (median#sessions)*(mean#minutes).
All previous quarter/year metrics have been recalculated with new methodology. Data are
trendable within this version of the report, but not to previous quarters’ published editions.
Nielsen’s mobile survey reports mobile video usage for those users 13 and older. Thus, 12-17
is T13-17 for all mobile data.
18 Copyright © 2013 The Nielsen Company
SOURCING
TABLES 1, 2, 3, 4 - A WEEK IN THE LIFE, OVERALL USAGE BY MEDIUM, MONTHLY TIME SPENT BY MEDIUM IN HOURS:MINUTES USERS 2+, MONTHLY TIME SPENT BY MEDIUM IN HOURS: MINUTES
Source: Traditional TV, Timeshifted TV, DVD, Game Consoles 04/01/13 - 06/30/13 via
Nielsen NPOWER/NPM Panel, Online 04/01/13 - 06/30/13 via Nielsen Netview and
Nielsen VideoCensus, Mobile 04/01/13 - 06/30/13 via Nielsen Mobile Video Report/
Mobile Insights.
Table 1 is based on the total US population whether or not they have the technology.
Tables 2-4 are based on users of each medium.
TABLE 5 – CROSS-PLATFORM HOMES RANKED BY IN-HOME STREAMING BEHAVIOR
Source: 04/01/13 - 06/30/13 via Nielsen NPOWER/Cross-Platform Homes Panel for P2+.
The quintiles for the ethnic breaks will be based on ethnic behavior within the ethnic
break itself as opposed to Composite Q1 2013 going forward. April and May “Stream” data
included in this quarter would be impacted by the processing issue detailed above in the
online methodology section.
TABLE 6, 7, 8–TELEVISION DISTRIBUTION SOURCES, CABLE/SATELLITE HOMES WITH INTERNET STATUS, DEVICES IN TV HOUSEHOLDS
Source: Based on the Universe Estimates for the 15th of each month within the quarter via
Nielsen NPOWER/NPM Panel.
TABLE 9 - TELEVISION DISTRIBUTION SOURCES - PERCENTAGE OF HOUSEHOLDS
Source: Based on the scaled installed counts for 04/01/13-06/30/13 via Nielsen
NPOWER/NPM Panel.
EXHIBIT 1 – AVERAGE TIME SPENT PER PERSONPER DAY
Source: Daily time spent based on ratings, 04/01/13 - 06/30/13 vs. corresponding quarters
in prior years via Nielsen NPOWER/NPM Panel.
19THE CROSS-PLATFORM REPORT | Q2 2013
EXHIBIT 2 – MOBILE DEVICE PENETRATION BY ETHNICITY
Source: Mobile 04/01/13 - 06/30/13 via Nielsen Mobile Insights.
SPOTLIGHT ON VOD
AUDIENCE COMPOSITIONVOD AUDIENCE VERSUS TOTAL TV AUDIENCE
Source: Distribution of viewing based on projections. VOD: RT VOD and CP VOD – includes
programming encoded for measurement. PUT: prime. 05/27/13-08/04/13
DISTRIBUTION OF TOP 10 PROGRAM GENRES AMONG TOP 100 SHOWS VIEWED ON VOD VERSUS TOP 100 TIME-SHIFTED SHOWS, A CLOSER LOOK BY DEMO AMONG TOP THREE GENRES
Top 100 programs ranked on VOD projections by P2+ (RT VOD and CP VOD – includes
programming encoded for measurement) and top 100 broadcast and cable prime programs
ranked on Live+7 lift based on linear only projections. Program distribution by genre within
the top 100. 05/27/13-08/04/13
ABOUT NIELSENNielsen Holdings N.V. (NYSE: NLSN) is a global information and measurement company
with leading market positions in marketing and consumer information, television and
other media measurement, online intelligence, mobile measurement, trade shows
and related properties. Nielsen has a presence in approximately 100 countries, with
headquarters in New York, USA and Diemen, the Netherlands.
For more information, visit www.nielsen.com.
Copyright © 2013 The Nielsen Company. All rights reserved. Nielsen and the Nielsen logo
are trademarks or registered trademarks of CZT/ACN Trademarks, L.L.C. Other product
and service names are trademarks or registered trademarks of their respective companies.
13/6894

20