cross-over seismology : blurring the line between passive and active source experiments diego quiros...
TRANSCRIPT

Cross-over Seismology : Blurring the line between passive and active source
experiments
Diego QuirosCornell University

Dense Arrays
Virginia5 km5000 m spacing200 m spacing

Aftershock Imaging with Dense Arrays (AIDA)-Virginia
5 km
~ Broadband Deployment Dense Array Deployment
5 km

Aftershock Imaging with Dense Arrays (AIDA)-Virginia
•Lower detection threshold•More accurate hypocentral locations•More accurate and detailed velocity structure•High resolution 3D reflection imaging
VSPInterferometry
Dense Array Deployment

Seismic imaging with earthquakes – VSP*
*Vertical Seismic Profiling

3D Seismic imaging with individual earthquakes
L1 L2
L1perspective L2
perspective
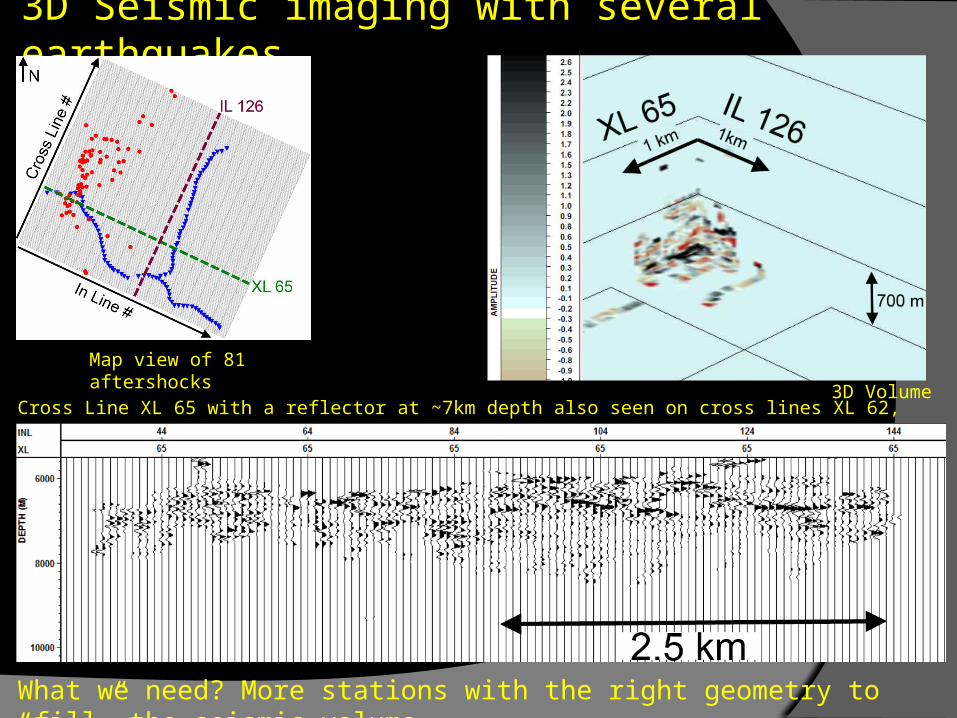
3D Seismic imaging with several earthquakes
Cross Line XL 65 with a reflector at ~7km depth also seen on cross lines XL 62, 63, 66, 67
Map view of 81 aftershocks 3D Volume
What we need? More stations with the right geometry to “fill” the seismic volume

What do we need for 3D Seismic?
………………….
………………….
………………….
………………….
………………….
………………….
………………….
………………….
………………….
………………….
………………….
………………….
dBG Earth Sciences B.V.
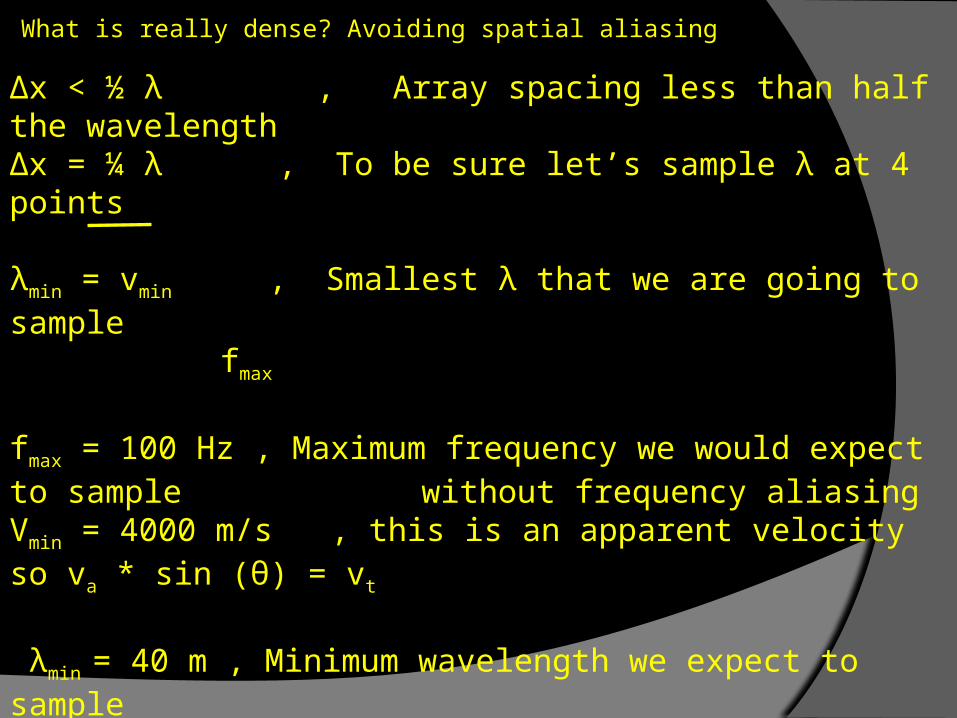
What is really dense? Avoiding spatial aliasing
Δx < ½ λ , Array spacing less than half the wavelengthΔx = ¼ λ , To be sure let’s sample λ at 4 points
λmin = vmin , Smallest λ that we are going to sample fmax
fmax = 100 Hz , Maximum frequency we would expect to sample without frequency aliasingVmin = 4000 m/s , this is an apparent velocity so va * sin (θ) = vt
λmin = 40 m , Minimum wavelength we expect to sample
Δx = 10 m , So 10 m station spacing to avoid spatial aliasing
This means that for a 20 km x 20 km survey we would need
4 million stations!! Let’s get realistic what could we do?

A more realistic survey!!
fmax = 50 Hz , Maximum frequency we would expect to sample without frequency aliasingVmin = 5000 m/s , this is an apparent velocity so va * sin (θ) = vt
λmin = 100 m , Minimum wavelength we expect to sample
Δx = 100 m , Station spacing to keep things doable! This means that for a 10 km x 10 km survey we would need
10 k stations!! How much data?Team of 5 deploys 100 stations in ~ 1 day
1 month continuous recording @ 100 Hz sampling?1 Stn recording 1 hr = 1410 KB (this is for a single trace SEGY file)
10 k Stns recording 1 month ~ 9.5 TB sounds right?

Active or Passive ?
Can’t tell! Continuous recording
Tim
e
Stn #
SEGY world
Mseed, SAC
Seamless two-way exchange betweenformats
Why?i.e. USArray processed with industry methods

Acknowledgments
Cornell: Larry Brown, Anastasija Cabolova, Chen Chen, Rowena
Lohman
Virginia Tech: Kathy Davenport, John Hole, Liang Han, Martin
Chapman
USGS: Walter Mooney
Software: Vista3D & Omni3D (Schlumberger) , Matlab (MathWorks)

AIDA - Maine
10 km
Hypocenter depth solutions for the single Aftershock recorded during AIDA-ME using subsets of stations (i.e. subarrays) to test improvement with increasing number of stations
Upper Hemisphere F.M.

Ambient Noise
1 km
Ithaca, NY Road noise experiment
Sample of dataset
Cross-correlation w/ virtual sourceat station 29 (red flag)
Active Source
Virtual Source
NE SW NE SW NE SWNE SW

Montserrat – Active & Passive
5 km
Designed as a controlled source experimentit recorded air gun shots located all around the island
Originally we used all air gun shots treating them as ambient noise and cross correlated
Inland Coast Inland Coast

Lessons from Dense Arrays
Continuous recording means we collect controlled source, earthquakes (passive) and noise (cars)
Apply industry techniques to passive data to generate 3D reflection images is feasible with appropriate surveys
Need to seamlessly convert between mseed, SAC, SEGY (variants)