cross-national evidence on generic … cross-national evidence on generic pharmaceuticals: pharmacy...
TRANSCRIPT

1
CROSS-NATIONAL EVIDENCE ON GENERIC PHARMACEUTICALS:
PHARMACY VS. PHYSICIAN-DRIVEN MARKETS:
Patricia M. Danzon
Michael F. Furukawa
March 2011
Earlier versions of this paper were presented at the 2010 American Society of Health Economics
meetings and the 2009 Harvard Law School conference on Legal and Regulatory Issues in
Pharmaceutical Research and Development. This research was supported in part by the Merck
Foundation Program on Pharmaceutical Policy Issues to the University of Pennsylvania. The
analysis is based on data obtained under license from the IMS Health Incorporated MIDAS™
database. We would like to thank IMS Health and Pfizer Inc. for making the data available. The
opinions expressed are those of the authors and do not necessarily reflect the opinions of the
research sponsors or the National Bureau of Economic Research. © 2011 by Patricia M.
Danzon and Michael F. Furukawa. All rights reserved.

2
Cross-National Evidence on Generic Pharmaceuticals: Pharmacy vs. Physician-Driven Markets Patricia M. Danzon and Michael F. Furukawa
March 2011
JEL No. I11,I18,K2,L5,L65
ABSTRACT
This paper examines the role of regulation and competition in generic markets. Generics offer
large potential savings to payers and consumers of pharmaceuticals. Whether the potential
savings are realized depends on the extent of generic entry and uptake and the level of generic
prices. In the US, the regulatory, legal and incentive structures encourage prompt entry,
aggressive price competition and patient switching to generics. Key features are that pharmacists
are authorized and incentivized to switch patients to cheap generics. By contrast, in many other
high and middle income countries, generics traditionally competed on brand rather than price
because physicians rather than pharmacies are the decision-makers. Physician-driven generic
markets tend to have higher generic prices and may have lower generic uptake, depending on
regulations and incentives.
This paper uses IMS data to analyze generic markets in the US, Canada, France, Germany, UK,
Italy, Spain, Japan, Australia, Mexico, Chile, Brazil over the period 1998-2009. We estimate a 3-
equation model for number of generic entrants, generic prices and generic volume shares. We
find little effect of originator defense strategies, significant differences between unbranded and
unbranded generics, variation across countries in volume response to prices. Policy changes
adopted to stimulate generic uptake and reduce generic prices have been successful in some EU
countries.
Keywords: pharmaceuticals, generics, competition, regulation, comparative health care
systems
Patricia M. Danzon
Health Care Systems Department
The Wharton School
University of Pennsylvania
204 Colonial Penn Center
3641 Locust Walk
Philadelphia, PA 19104
and NBER
Michael F. Furukawa
Department of Information Systems
W. P. Carey School of Business
Arizona State University
P.O. Box 874606
Tempe, AZ 85287-4606

3
I. Introduction
Pharmaceutical markets in the US are characterized by relatively high prices while drugs
are on patent, followed by rapid generic entry and low generic prices once patents expire.1 In
2009, generics accounted for 69 percent of prescriptions but only 16 percent of sales, because
generic erosion is rapid and generic prices are low, relative to originator prices in the US. By
contrast, generic penetration is slower and generic prices are higher, both absolutely and relative
to originator prices, in many other countries, implying only modest savings from generics for
payers and patients. These modest generic savings are prima facie surprising. Post-patent entry
should in theory be profitable for generic producers and appealing for customers, because
generics can largely free-ride on the R&D and informational investments made by originator
firms, thereby realizing much lower cost structures. Generic markets are also by definition
unpatented and therefore potentially more competitive than originator markets.
This paper argues that these cross-national differences in generic shares and prices reflect
differences in regulatory and reimbursement policies that drive countries to have either
pharmacy-driven or physician-driven generic markets. The US is a prototypical pharmacy-driven
generic market, in which pharmacists are the key decision-maker for generics, because they are
legally authorized to substitute a generic unless the physician explicitly requires the brand, which
is rare. US pharmacies have financial incentives to prefer cheaper generics and brand is
irrelevant for substitutable (AB-rated) generics that by regulation are certified to be
bioequivalent to the originator. Generics are therefore unbranded and compete on price for the
business of highly-price conscious pharmacies. Centralized purchasing by large chain
pharmacies has intensified generic competition in the US. Tiered co-payment structures have
encouraged patients to accept generics. However, pharmacies decide which generic to dispense
and patients, payers/PBMs and physicians usually play no role in choosing one generic
manufacturer over another (except for drugs dispensed through the mail, for which the PBMs
operate and dispense from their own pharmacies). The UK and Canada resemble the US
1Although all WTO countries recognize a 20 year product patent, from date of filing, effective patent life
for pharmaceuticals is typically shorter but differs across countries. Most countries provide for some
patent term restoration to compensate for due to time lost during R&D, and a data exclusivity period
during which generics may not reference the originator data for regulatory approval. Patents may also be
challenged prior to expiry, and this is increasingly common in the US (see below). The effective patent
life post launch is the net result of all these factors.

4
pharmacy-driven generic model in some respects, but with important differences, notably in
Canada which regulates generic prices rather than relying on competition.
By contrast, the regulation/reimbursement structure for generics in many other countries
has traditionally given less authority and fewer or even perverse incentives to pharmacies. In
particular, substitution was only permitted if the physician prescribed by chemical name (which
is uncommon except in the UK), and pharmacy dispensing fees that increased with the price of
the drug discouraged substitution of cheaper products, even if permitted. In markets where
physicians are decision-makers and have little incentive to be price-sensitive (unless they are
personally at risk for drug costs), generics compete on brand rather than price. These branded
generics promote to physicians who prescribe by brand, whether generic or originator. Among
major EU markets, France, Spain, Italy and Germany were traditionally physician-driven,
branded generic markets. Latin America also has physician-driven, branded generic markets,
with the added feature that many of these branded generics are “similar” that have not met
bioequivalence standards to the originator and are therefore of uncertain quality. Branded
generics in physician-driven generic markets are predicted to be higher priced and have lower
market shares than unbranded generics in pharmacy-driven generic markets.
During the 2000s, all the major EU countries adopted policy changes to reduce prices
and/or increased generic uptake and thereby increase generic savings. In 1989 Germany adopted
generic reference pricing, to encourage competition in off-patent products, and expanded the
system to include on-patent products in 2005. France, Italy and Spain adopted variants of generic
reference pricing in the early 2000s.2 Although such RP systems usually induce originators to cut
prices to the RP, whether they create strong incentives for generic competition below the initial
RP depends critically on rules and incentives for pharmacy substitution. Most of these countries
have also expanded authorization for pharmacy substitution and modified dispensing fees to
incentivize generic use. Since 2007, German sickness funds have contracted directly with generic
companies, using competitive bidding to drive price competition and capture the resulting
savings for payers.
Latin American markets were also traditionally physician-driven, branded generic
markets, but with “similares” or copy products that were launched before patent regimes were
2 Under generic reference pricing, the payer sets a single reference price (RP) as a maximum
reimbursement for all generically equivalent products, leaving the patient to pay any excess of the
manufacturer’s price over the RP.
5
enforced and were not required to meet bioequivalence standards. Brazil and Mexico have
established regulatory frameworks to authorize true generics that meet bioequivalence standards,
but many similares remain on the market. Pharmacy substitution is not legally authorized, in part
because many generics are not equivalent. In practice, patients often purchase drugs without a
prescription, in which case pharmacists may advise on substitution. Because generic quality is
uncertain, brand plays an important role in generic choice. Thus although patients generally pay
out-of-pocket for outpatient drugs and are presumably price sensitive, quality uncertainty leads
to competition on brand and undermines competition on price.
Japan is unique among our sample countries in that traditionally physicians and hospitals
dispensed the drugs that they prescribe. Branded generics were the norm, and price competition
was discouraged because the dispensing physician’s margin tended to be higher on high-priced
products. Unbranded generics had little presence in Japan until recent reforms.
This paper examines the performance of generic markets in 10 countries (the US, the UK,
Germany, France and Spain, Italy, Japan, Canada, Brazil and Mexico) over the period 1998-
2009. Our analysis draws on data from IMS Health Inc. on the universe of drug sales in these
countries. Our data permit both between-country comparison of branded vs. unbranded generic
markets and within-country comparison over time, to estimate effects of the policy changes. We
estimate a model for three dimensions of generic markets: any entry and number of generic
manufacturers; generic prices, relative to baseline originator prices; and generic volume share.
We examine how each of these dimensions of generic markets changed over time as a measure
of net policy change effects.
We also examine the effects of originator generic defense strategies, including licensing
competing branded products and launching new formulations prior to patent expiry. Theory and
prior evidence suggest that co-branding may be effective in physician-driven, branded generic
markets (for Italy, see Pammoli et al. 2002; for Germany, see Appelt, 2009, 2010); however,
such strategies are less likely to be effective in pharmacy-driven, unbranded generics market.
Launching new formulations prior to patent expiry on older formulations may be a rational
strategy in both market types, depending on reimbursement rules. Originator strategies to deter
generic entry have been the focus of the EU Generics Inquiry.
Our empirical evidence confirms that generic price competition is greater in pharmacy-
driven markets than in physician-driven markets, provided that pharmacies face financial
6
incentives to prefer cheaper products. Branded generics, which predominate in physician-driven
markets are less price competitive than unbranded generics that predominate in pharmacy-driven
markets, as predicted. Our results confirm previous evidence that generic entry is related to
market size; however, differences across countries in number of generic competitors is not
explained by overall market size, plausibly because the extent of price competition, cost
structures and profit margins also differ. We find little evidence that originator defense strategies
are successful on average, except that launch of delayed release formulations does deter generic
shares in the US. Recent changes in generic regimes in four previously physician-driven,
branded generic markets of the EU (Spain, France, Italy and Germany) have had significant
effects, with unbranded generics gaining share. However, these countries still lag the US and UK
in speed of generic penetration.
II. Generic Regulation and Reimbursement
Table 1 summarizes regulatory and reimbursement characteristics of our sample
countries. This is an oversimplification of the complex regimes and changes over time in each
country. More detail is in Appendix 1. As a rough characterization, we assume that the US, the
UK, and Canada are primarily pharmacy-driven generics markets, and physician-driven markets
include France, Germany, Italy, Spain at the start of our period, plus Japan, Brazil, and Mexico.
France, Germany, Italy, and Spain implemented multiple policy changes in the 2000s to
stimulate generic uptake and/or reduce prices. The UK changed its rules for setting generic
reimbursement in 2005. Brazil and Mexico encouraged bioequivalence testing and the growth of
unbranded generics. The US experienced some growth in early (Paragraph 4) challenges and the
2003 Medicare Modernization Act reduced the incentives for originators to list late patents by
permitting only one 30 month stay per molecule. Some Canadian provinces reduced the
regulated prices on generics. We test for changes over time in each of our markets.
Note that patents may be challenged in any country, but the US is unique in rewarding
successful challenges, by granting a 180 day market exclusivity to the first generic to
successfully challenge an originator patent (a paragraph 4 certification).3 During this 180 days,
3 The 1984 Waxman-Hatch Act’s Abbreviated New Drug Application (ANDA) process permits generic approval
with evidence of bioequivalence, once the originator’s patent and other exclusivities have expired or been
successfully challenged.
7
the originator may market an authorized generic (licensed under the originator’s NDA), but no
other ANDA-approved generics can enter. These paragraph 4 and associated 180-day
exclusivities have reportedly become increasingly common since the late 1990s, which is
expected to result in higher generic prices during the first two quarters post launch in the US.
Greater use of paragraph 4 may also result in earlier generic entry over time in the US, unless it
is offset by increased originator use of mechanisms for patent and exclusivity extensions.
III. Previous Literature (to be updated)
Several previous studies have examined generic entry and price competition in the US.
Models of number of entrants focus on the role of fixed costs relative to market size and have
consistently found that generic entry is related to market size (for example, Scott Morton, 1999;
Saha et al., 2006) and that generic prices are inversely related to number of generic competitors
in the US (Grabowski and Vernon, 1992; Saha et al., 2006). Most previous studies do not focus
on or even recognize the role of pharmacies as key decision-makers in US generic markets. For
example, several papers hypothesize that originator firms may use promotion to deter generic
penetration but find no effects, which is unsurprising in the contexts where pharmacy
substitution is the norm, such that detailing to physicians is likely to be a waste of money.
Several recent papers have examined generic uptake in other countries. Hollis (2003)
reports on anti-competitive effects of strategic licensing of brand-controlled “pseudo-generics” in
Canada, which are found to deter generic entry. Magazzini et al. (2004) examine generic entry in
the US, the UK, Germany and France using sales data from July 1987-December 1998 on major
molecules with patent expiry 1986-1996.4 Using a Tobit estimator applied to pooled panel data
for the four countries, they conclude that market share of licensed products (defined as products
launched within 3 years of patent expiry) is negatively related to unbranded generic market share
whereas number of different brand names has a positive effect. Possible reasons for these
apparently contradictory findings are not explored. Appelt (2009) provides evidence of
originator licensing strategies prior to patent expiry and branded generics’ use of trade marks to
enhance brand competition in Germany’s branded generic market. Reiffen and Ward (2005)
estimate potential effects of a similar phenomenon in the US; however, their data are from the
4 They regress market share of unbranded drugs on lagged market share of licensed products in an
uncensored Tobit model that includes markets with no generics. The negative coefficient may be
dominated by the observations with zero generic share (for which the relationship is necessarily negative)
and it is unclear whether it would hold in the subset of market with generic entry.
8
early 1990s and they acknowledge that such entry is rare. Hudson (2000) examines generic entry
and erosion of brand shares in four markets (US, UK, Germany and Japan); however his data are
from the early 1990s which predates the more recent growth in generic erosion in the US and
pro-generic policy changes in other countries. Moreno-Torres et al. (2009) provide detailed
evidence on generic entry in Spain. Ghislandi et al. (2005) and Garattini and Ghislandi (2006)
discuss recent changes in Italy.
Our paper adds to these country-specific studies by providing a consistent analysis and
comparison across 12 different countries and over a more recent time period that includes
experience after the recent reforms in several countries. Our approach is also the first to focus on
the importance of pharmacy substitution and pharmacy incentives in creating pharmacy-driven
rather than physician-driven generic markets, which in turn focuses competition on price rather
than brand.
IV. Data
The data for this study are from the IMS MIDAS database of sales of all drugs over the
period 1998-2009 in 10 countries, including the major EU markets, three major Latin American
markets, the US, Canada and Japan. Within this universe of products, we define the sample of
molecules potentially subject to generic entry as molecules with global age (years since first
global launch of the molecule) between 8 and 20. This window was selected based on the
assumption that product patents are filed at roughly the same date in all countries, that R&D
(discovery, preclinical and clinical trials and regulatory review) typically absorbs at least 8 of the
20 year patent term, and that most countries offer patent extensions or supplementary protection
certificates for up to 5 years to compensate for this loss.5 This age range encompasses the ages
with greatest generic entry, although entry in most countries spans a longer age range. We define
the lag in generic entry of product i in country j as months from first originator launch of that
product in country j, recognizing that this lag may reflect legal barriers as well as economic
factors. Appendix A summarizes major differences across countries in regulatory and
reimbursement barriers to generic entry.
Our analysis focuses on single molecule prescription drugs in the retail pharmacy
channel. We exclude combination products, for which global age and hence generic eligibility
5 Defining products eligible for generic entry by expiry date of all listed patents is not appropriate, even if
we had the data, because generic companies increasingly challenge listed patents prior to their expiry.
9
are ambiguous. We exclude biologics because they are ineligible for the standard abbreviated
generic approval procedures in the US and most other countries.6 We also excluded
miscellaneous therapeutic categories (hospital solutions, diagnostic agents, various) and unusual
forms (non-human use, use unknown). IMS assigns each product into one of five license
categories: originator brand, licensee, branded generic, unbranded generic, or “Patent not
assigned”.7 Our analysis is at the level of the presentation (molecule-form-strength) because
pharmacy substitution is authorized only within presentation. All price and sales data are
adjusted to 2009 values using country-specific producer price indexes (PPIs) as the best available
measure of input costs. Most analysis is in local currency units, but where prices are converted to
US dollars we use 2009 exchange rates.
Although this IMS database is more comprehensive and more detailed than the data used
in previous studies, certain limitations must be noted. First, the IMS categorization of generics as
branded or unbranded is the best available but may nevertheless be an imperfect indicator for
whether products compete primarily on brand or price. Second, the products designated as
generics in some countries, notably Brazil and Mexico, include copy products (similars), some of
which entered early in the originator life, due to lack -- or weak enforcement -- of product patent
regimes.8 Third, the IMS data do not designate which generics have met bioequivalence tests and
hence are more likely to be considered substitutes by physicians, pharmacists and patients than
those that lack a bioequivalence certification. Fourth, when a merger occurs between two firms,
IMS consolidates their separate data retroactively. Our data may therefore potentially undercount
the number of generic competitors, particularly in the earlier years.
V. Empirical Framework and Methods
6 Abbreviated approval procedures for biosimilars have been outlined in the EU and US in the late 2000s.
Although a few biosimilars have been launched, their higher regulatory costs and lower substitutability
make them very different from chemical generics analyzed here. 7 We used the corporation and molecule age to reassign products with Patent Not Assigned into branded
generic or unbranded generic status. 8 We excluded from these calculations the small number of generic launches that reportedly occurred
within 5 years of the originator launch, except in countries where such early launch dates are plausible
due to late adoption of patent regimes (Brazil, Mexico, Italy, and Spain). For other countries, we
reassigned the license status of these implausibly early generics from branded generic to licensed brand
and included them as licensees in all other analysis. We also exclude generics for which no originator is
present in any year of our data.
10
Our descriptive and regression analyses focus on the main components that contribute to
overall generic savings: whether and when generic entry occurs; number of branded and
unbranded generic competitors; prices and generic volume shares. The analysis is at the level of
the presentation, defined by molecule, 4-digit anatomical therapeutic class, formulation and
strength, because pharmacy substitution of generics is authorized only between presentations
with the same molecule, formulation and strength. We postulate a four equation model for the
any generic entry for the ith presentation in country j in year t; number of generic firms,
conditional on entry; generic or originator price (relative to baseline originator price); and
generic volume share:
Gijt = f1( Rijt-2, ; Dijt-2; Fij; Zjt; Mij; u1) (1)
Nijt = f2 ( Rijt-2 ; Dijt-2; Fij; Zj; Mij; u2) (2)
Pijt = g (Nijt b; Nijt
u; Fij; Zj; u3) (3)
Sijt = h (Pijt; Nt b; Nt
u; F; Z; u4) (4)
where G is an indicator for Any Generic entrant in the presentation-country-year, N is
number of generic manufacturers, conditional on entry, P is price, S is generic volume share; Rijt-
2 is molecule sales in the presentation-country lagged 2 quarters; D ijt-2 measures (lagged)
originator defense strategies; F includes indicators for non-oral forms; Z indicates time periods;
and M is molecule-specific characteristics. We now discuss the rationale for each equation and
variable measurement:
1. Any Generic and Number of Generics
Sales (R) We postulate the same model for entry of Any Generic and Number of Generics,
conditional on entry, but allow parameter estimates to differ. Following Bresnahan and Reiss
(1991), Scott Morton (1999, 2000) and others, equations (1) and (2) hypothesize that generic
entry and number of generic competitors in a presentation-market depend on the market size (R,
gross sales). Market size is measured by annual sales at manufacturer prices in the retail and
hospital channels combined, lagged two quarters.9 Costs of entry differ by formulation (F), with
higher manufacturing and regulatory costs for intravenous, topical, and other complex forms
compared to simple oral solids (tablets and capsules).
9 The appropriate lag for the Originator sales variable depends on when generic firms make entry
decisions. If potential entrants accurately project market sales at the time they are likely to enter, our two
quarter lagged revenue measure should reasonably characterize the expected relative market size that was
relevant to generic decisions to undertake entry.

11
Originator Defense Strategies (D) To test for effects of originator defense strategies on
generic entry, we include Number of Licensees, Number of New Formulations launched just
prior to patent expiry, and OTC share, all lagged two quarters. Originator are expected to have
incentives to launch branded licensees to pre-empt other generics in physician-driven generic
markets with brand competition, but not in price-competitive, pharmacy-driven markets such as
the US.10
Incentives to launch improved formulations, such as extended release forms, may exist
in both pharmacy and physician-driven markets, because generic substitution is only permitted
within a formulation. Originators have incentives to launch new formulations close to patent
expiry of older forms if the new forms receive some additional patent or regulatory exclusivity
and can be reimbursed at prices above the price of the older formulations. Such conditions exist
in the US, where aggressive marketing can successfully switch physicians/patients to the new,
protected forms and away from the patent-expiring form which faces generic entry. However,
launching new formulations is less likely to be profitable in countries where reference pricing or
similar reimbursement rules limit reimbursement for all formulations of a molecule to the lowest
price per daily dose for that molecule. Finally, for molecules that meet regulatory requirements
for patient self-medication, originators may launch an over-the-counter (OTC) formulation to
preempt generic competition in the Rx formulation after patent expiry.
Molecule age and launch (M) and form (F) Molecule Global Age (months since global
launch) is included as a proxy for unobserved patent term. Country-specific Molecule Launch
Lag (months from global launch to first launch in country j) is a proxy for country-specific data
exclusivities that usually run from the originator’s country-specific launch. Both Molecule
Global Age and Country Launch Lag are expected to be positively associated with generic
entry.11
Global Diffusion (number of countries in our sample in which the molecule is launched)
is an indicator for availability of foreign sources for generic inputs or finished products and
possibly economies of scale; it is expected to be positively associated with entry. A vector of
10
In the US, several originator firms in the early 1990s launched their own generic products to compete
with true generics; however this strategy simply accelerated the downward pressure on generic prices and
was abandoned. Originator launch of generics in the US is now confined to “authorized generics”
launched during the 180 day exclusivity period awarded to paragraph IV challengers, when prices remain
high due to limited generic competition.
11 Generic lag may reflect cross-national differences in patent extensions and barriers to
challenges and data exclusivities, in additional to financial incentives for generic entry.

12
indicators controls for formulations that are expected to be less attractive to generic entry than
the referent oral solid forms, due to either higher manufacturing or regulatory costs.12
Regulatory Changes (Z) Entry incentives depend on regulatory and reimbursement
provisions, which differ by country and over time within country. Since several countries
changed multiple policies affecting generics over the 2000s, we use two indicator variables for
years 2002-2005 and 2006-2009 to measure the combined effects of country-specific policy
changes. The referent period is 1998-2001.
We report probit estimates for the Any Generic equation and use a negative binomial
estimator for the Number of Generics equation. Results are robust to alternative estimation
methods, including OLS and zero-inflated negative binomial models.
2. Normalized Generic Price
Our measure of generic price Pijtg for presentation i in country j in period t is the volume-
weighted average generic price for all generic versions of presentation ijt, normalized by the
earliest originator price for presentation i in country j in our dataset. This normalization permits
comparison of trends over time and across molecules for products with very different absolute
price levels. It is also independent of exchange rates and changes in the originator price.13
Number of generic competitors (N) Under standard models of competition, normalized
generic price is expected to be inversely related to number of generic competitors, with greater
effect for unbranded competitors (Nu) than for branded competitors (N
b). The effect of generic
competitors on price is expected to be greater in countries with pharmacy-driven vs. physician-
driven markets.14
Regulatory Changes (Z) and Formulation (F) Time period indicators are included to capture
regulatory changes that affected generic prices/reimbursement directly, such as the change in
12 We do not estimate a hazard model for generic launch because defining the starting
point is conceptually problematic, given that patents can be challenged, and empirically
infeasible because we lack data on expected patent expiries and data exclusivities.
13
Several previous papers use the contemporaneous generic/brand price ratio, which may confound
changes in the numerator and the denominator. 14
N can be treated as predetermined in the price equation due to the regulatory lag in getting market
authorization. In the US, this takes at least a couple of years.

13
reimbursement rules in the UK, reference pricing in France, or sickness fund contracting in
Germany. Formulation indicators control for cost differences.
3. Normalized Originator Price
We estimate a similar model of normalized originator price PijtO, also normalized to the
earliest originator price for the same presentation in the dataset. Frank and Salkever (1992, 1997)
and Regan (2008) have argued that originators pursue a segmentation strategy that leads to
increased originator price in response to generic competition. Although this may have been an
optimal strategy in the 1990s in the US, this may no longer be true in the 2000s, given the
growth of insurance plans that require patients to pay the difference between the generic co-pay
and the originator price. In most other countries, including the UK, price regulatory systems
usually disallow originator price increases and reductions may be mandated. In countries with
generic reference pricing, such as Germany and France, although pricing above the reference
price is permitted in theory, in practice originators usually cut price to the reference price
because demand is very elastic above the reference price. Thus normalized originator prices are
expected to be flat or declining after generic entry in most countries. The US is a possible
exception, as is Mexico, where price regulation is weakly enforced.
4. Generic Volume Share
Generic volume share is expected to be inversely related to generic price in pharmacy-
driven markets. In physician-driven markets, price sensitivity is expected to be weaker,
especially for branded generics and before reforms to stimulate price sensitivity. We estimate eq.
4 with both OLS and 2SLS, in which generic price is treated as endogenous using the hospital
price and an indicator for chronic medications as instruments. Endogeneity is expected in
countries where generic prices are competitively determined (the US, UK). For other countries
where generic prices are set by regulation or constrained through RP reimbursement, generic
prices may be less responsive to market conditions, in which case OLS estimation may be
appropriate. We include number of branded and unbranded competitors, generic age (months
since first generic launch in country j), formulation and molecule effects as control variables, as
well as time dummies to capture regulatory changes.

14
VI. Results
A. Descriptive Analysis
We first characterize the cross-national differences in generic markets using graphic analysis
to compare generic entry, generics prices and shares across countries. For some variables, we
compare starting (1998-2001) and ending (2006-2009) values, hereafter referred to as 2001 and
2009. For other variables, we show average values over the entire period to conserve space, but
note that this masks the initial heterogeneity and the changes over time, which are discussed
later. Descriptive statistics are in Table A1.
1. Generic Entry and Number of Generics
All countries experienced an increase in the percent of molecules in the 820 year cohort with
generic entry over the 2000s decade. France had the largest percentage increase from 7 to 25
percent. Brazil has the highest generic presence, with 41 percent of eligible molecules with a
generic, plausibly due to pre-patent copy products.
Figure 2 shows the mean age or effective patent life of the originator at first generic entry for
the molecule (Generic launch lag).15
The low initial values in 2000 for Spain (8.1 years) and Italy
(8.7 years) may reflect originator-initiated (“authorized”) generics that do not represent a true
generic challenge to effective patent life. Over time, generic launch lags decline in some
countries, including France, Germany and the UK, reflecting more rapid entry possibly in
response to pro-generic policies. Generic launch lags increased in Italy, Spain, Brazil and
Mexico, possibly reflecting fewer copy products as enforcement of IP improved. In the US the
mean generic lag increased minimally, from 11.2 in 2001 to 11.4 in 2009. This suggests that any
increase in Paragraph 4 patent challenges was on average offset by relatively generous
exclusivity extensions for new formulations etc., compared to say Canada, where mean generic
lag dropped to only 9.4 years.
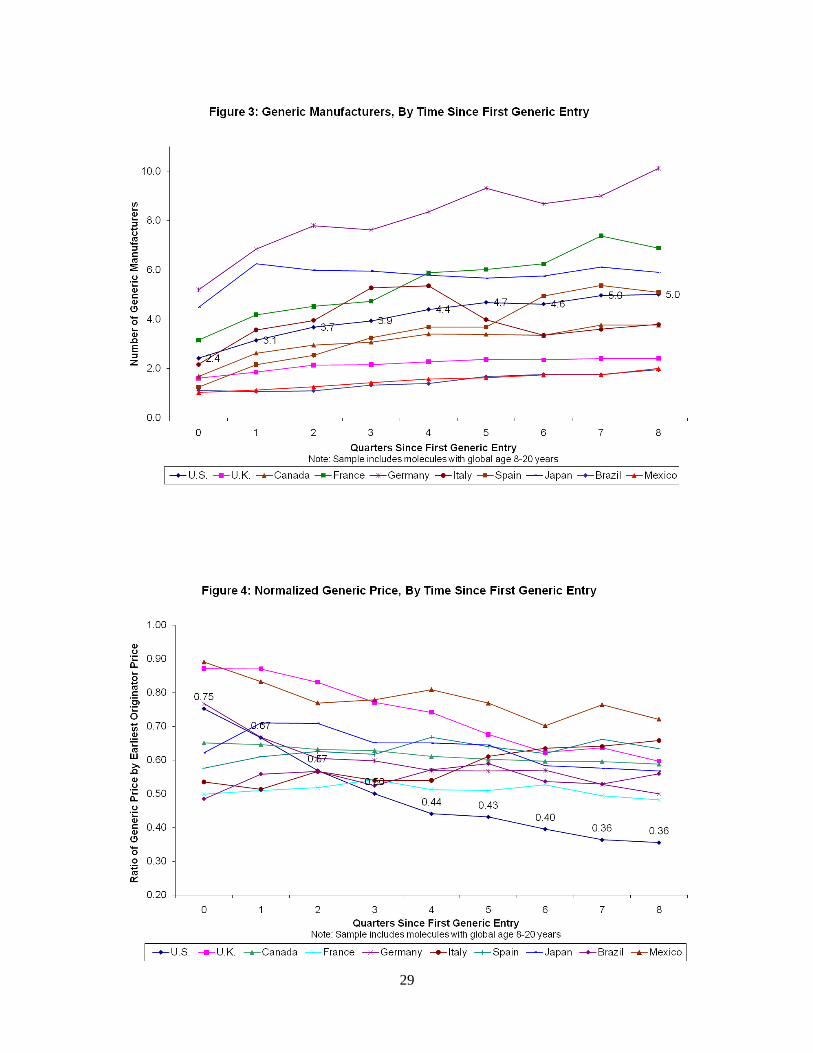
Once generic entry occurs, in most countries the number of generic manufacturers
increases initially and then reaches a plateau roughly two years from first generic entry (Figure
3). Germany has the most generics per presentation, reaching 8 by quarter 5, followed by France,
Japan and Spain at 5-6, all traditionally branded generic markets. By contrast, the US averages 4-
15
A small number of generic launches reportedly occurred within 5 years of the originator launch. We
treated such early launch dates as implausible and excluded them from these calculations in all countries
except Brazil, Chile, Mexico, Italy, and Spain, which had late or weak patent enforcement.

15
5 generics per presentation. Although Brazil and Mexico have a high proportion of molecules
with generic presence, they have relatively few (1-2) generics per presentation.
This evidence of more generics per presentation in countries other than the US is prima
facie surprising because the US has larger sales, by value or volume, than other countries (Table
2-3). Country-specific studies (e.g. Scott Morton, 1999) have consistently found a strong
relationship between number of generic entrants and sales, consistent with standard entry models
with fixed costs (Bresnahan and Reiss, 1991). This cross-national evidence indicates that the
gross sales value necessary to attract generic entry is lower in countries with higher expected
generic prices and less price-competitive markets, presumably because margins are higher.
To provide evidence on this, Table 3 shows median annual sales per generic
manufacturer and price per dose at 2 years since generic entry, overall and by number of generics
per presentation. All other countries (except Japan) have lower overall average gross sales per
generic manufacturer and higher average price per dose than the US, followed by the UK.16
Price
per dose is relatively high ($0.88) in the US for presentations with only one generic, which
would include primarily P4 exclusive markets, but for the typical presentation with at least 4
generics, the US average price ($0.23) is lower than all other countries except the UK ($0.22).
Conversely, Canada has the highest generic prices and lowest sales per manufacturer, plausibly
due to regulatory barriers to price competition. The decline in average generic price with number
of manufacturers is greater in the US and the UK than in other countries – indeed, the
relationship is positive or flat in Canada, Italy, Japan and Mexico. This evidence is consistent
with the branded and/or price-regulated generic markets being less price competitive than the US
and UK, enabling generics firms to survive on lower gross sales per presentation than is feasible
in the more price competitive US or UK markets.17
Figure 4 shows the life-cycle of normalized generic prices by quarter since first generic
entry.18
In the US, generic prices are initially 75 percent of baseline originator price, consistent
16
Japanese price are lower on a per dose basis partly because average grams of active ingredient per dose
is lower than in most other countries (Danzon and Furukawa, 2008). 17
These IMS prices may be upward biased for true transactions prices in countries where off-invoice
discounts to pharmacies are common. These discounts average over 30 percent in the US (CBO, 2005).
The fact that gross sales per generic are smaller in other countries than in the US makes it unlikely that
any unobserved discounts are greater in other countries than the US. 18
Recall that normalization is to the earliest originator price available, which is invariant over time for
each presentation. Although these baseline originator prices are observed at different originator ages,
including some that post-date generic entry, given the stability of originator prices (see Figure 5) this

16
with limited competition during the paragraph 4 exclusivity period. Thereafter, generic prices
drop rapidly to 36 percent of baseline originator price after two years. The UK, Germany and
Mexico also have declining generic prices after generic entry but at higher levels – declining
after two years to 60 percent of the originator price in the UK, 55 percent in Germany and 75
percent in Mexico. In all other countries, generic prices are relatively flat over time, at 50-70
percent of baseline originator prices, despite entry of more competitors shown in Figure 3. This
evidence of relatively high normalized price levels that are flat over time despite competitive
entry is consistent with the hypothesis of weak price competition in branded generic, physician-
driven generic markets, despite multiple generic competitors per presentation.
Figure 5 shows that normalized originator prices are generally stable in response to
generic entry, but at different levels reflecting different regulatory regimes. In the US, the mean
normalized originator price is 1.24 at generic entry, reflecting the increase in real originator
prices over time prior to patent expiration that is common in the US. However, whereas some
earlier studies found that originator prices increase in response to generic entry (Frank and
Salkever, 1997, Regan, 2008), our results show a modest decline in originator prices after
generic entry in the US from 1.24 to 1.13, possibly reflecting the shrinking size of the brand
loyal market in recent years. In Germany and France, originator prices decline by 20 and 13
percent, respectively, in the 2 years post generic entry, plausibly reflecting the incentive of
originators to cut prices to the reference price in these countries. In most other countries
originator prices are stable over the two years following generic entry, between 70-90 percent of
baseline prices (except 60 percent for Italy), consistent with regulatory constraints on price
increases and some mandatory cuts. .
Conditional on generic entry, generic adoption is the most rapid and reaches the highest peak
in the US (92 percent), followed by Canada (75 percent) (Figure 6). High generic penetration in
Canada, despite its high regulated generic prices, may reflect off-invoice discounting to
pharmacies that is not captured by payers or in the IMS data. Canada has recently taken steps to
change this system ( ). The UK also has relatively rapid generic adoption due to pharmacy
substitution incentives. In Germany the rapid generic adoption presumably reflect both drug
should not matter. Moreover the normalization is invariant over time for a given presentation, so does not
affect measures of generic price change over time.

17
budgets for physicians and requirements for generic substitution adopted during the 2000s. Japan
and Italy have the lowest generic shares (under 40 percent).
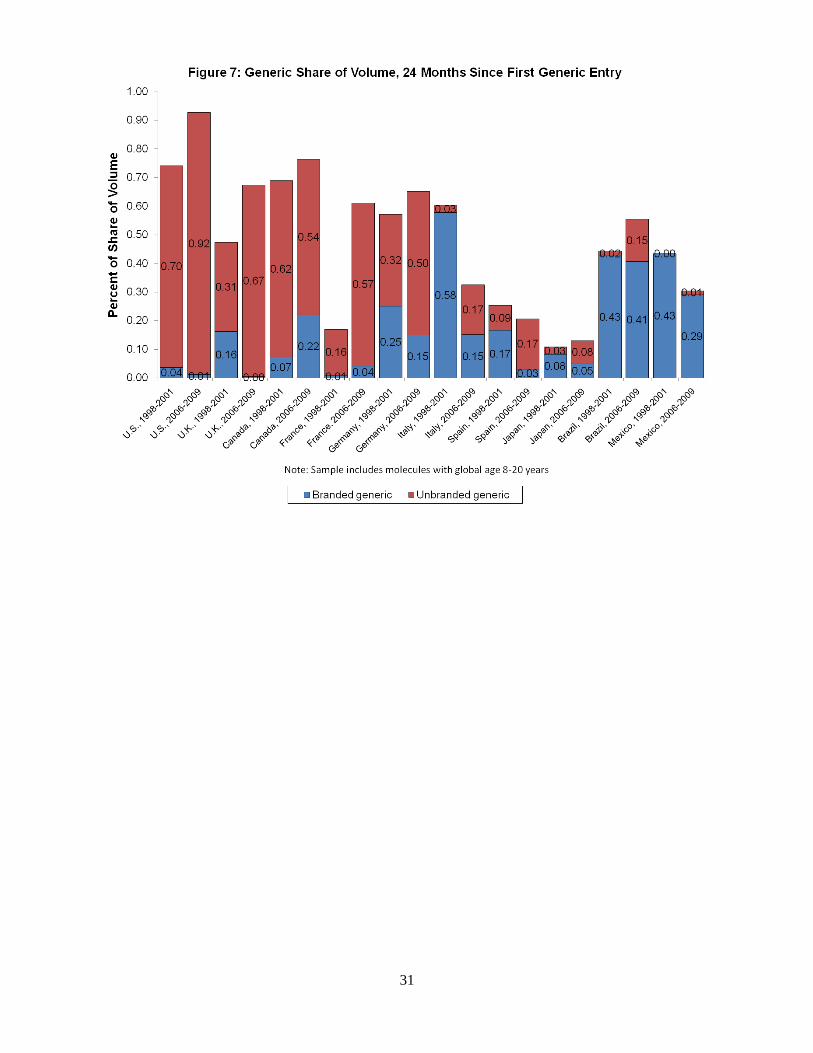
Over the 2000s most countries experienced growth in generic uptake, primarily due to
growth in unbranded generics (Figure 7). Of the four EU countries that adopted significant pro-
generic policy changes – France, Germany, Italy and Spain – all started with relatively high
branded generic shares in 2000 but achieved growth in unbranded and total generic penetration
over time, except Italy, where growth in unbranded share is more than offset by decline in
branded generic share. Although at the start of the period only the US, Canada and the UK had
predominantly unbranded generics, by the end this was also true for France, Germany and Spain.
By contrast, Brazil and Mexico remain predominantly branded, and Japan is roughly evenly split,
but with a very low generic share.
B. Multivariate Regression
Appendix Tables A2-5 report the full regression analysis of determinants of generic entry,
generic and originator prices and generic market shares, for branded and unbranded generics
combined, to conserve space. Summary Tables 4-7 report key coefficients, including coefficients
with branded and unbranded generics measured separately. We estimate separate equations for
each country, to permit all coefficients to vary across countries. The unit of observation is the
country-quarter-presentation (molecule-formulation-strength). We report marginal effects with
robust standard errors and clustering by molecule to address unobserved molecule-specific
effects. Some explanatory variables are lagged two quarters. To address the potential
endogeneity of price in the volume share equations for countries with strong generic price
competition (especially the US and UK), we also estimated two-stage least squares (2SLS) via
generalized method of moments (GMM). Instrumental variables are generic price in the hospital
channel and an indicator for therapeutic classes that treat chronic conditions. These results are
reported below the OLS estimates in Table 4.
1. Any Generic and Number of Generics
The probability of Any Generic and Number of Generic manufacturers conditional on
entry are both positively related to lagged log sales in almost all countries (Table 4), consistent
with standard theories of entry and evidence from previous studies. The exception is that Any
Entry is not significantly related to sales the US, suggesting that even small markets attract
18
generic entry. In the traditionally physician-driven branded generic markets of France, Germany,
Spain and Italy, the responsiveness of entry to sales is higher for unbranded generics than for
branded generics, as expected if unbranded generics are typically lower priced and therefore
need larger volume to break even.
The evidence in Tables A2 and A3 suggests that proliferation of licensee brands by the
originator does deter entry of any generic in Italy, consistent with Magazzini et al. (2004), but
not in other countries.19
There is no support for the hypothesis that licensees reduce the number
of generics, conditional on entry, in any country. Thus this more recent evidence conflicts with
earlier findings for Canada (Hollis, 2003) and Germany (Appelt, 2009), possibly because a brand
saturation strategy becomes ineffective as a generic entry deterrent as generic markets become
more unbranded and pharmacy-driven, as competition shifts to price rather than brand.20
The originator defense strategy of launching alternative formulations shortly prior to
patent expiry deters any generic entry in the US and also reduces number of generic entrants in
the US and Canada, but not in other countries. This evidence that launching new formulations is
uniquely effective in the US is consistent with the hypothesis that US reimbursement systems
facilitate both switching patients and higher prices for these new forms, compared to price-
regulated markets which may reimburse new formulations at the same price as older versions of
the same molecule under reference pricing.
Extended release, IV, topical and other complex formulations are much less likely to
attract generic entry than oral solids in multiple countries, plausibly due to higher manufacturing
costs. OTC market share of the presentation does not deter Any Generic entry but does reduce
number of generic entrants in the US, plausibly because OTC prices are relatively cheap in the
US and hence offer consumers a viable alternative to generic Rx versions, although the OTC
forms are not covered by insurance. OTC effects are also negative for France. Hospital share of
sales is negatively related to Any Generic and Number of Generics in most countries.21
This
suggests that hospitals markets are less attractive to generics than retail pharmacy sales, possibly
19
The marginally significant negative coefficient on licensees in the Any Generic equation for the US is
probably spurious. Licensee proliferation is irrational in a market dominated by pharmacy substitution.
The mean number of licensees in the US (0.42) compared to Italy (0.76) and Germany (0.86) confirms
that this is a less common strategy in the US than in physician-driven, branded generic markets. 20
The significantly positive licensee coefficients for Number of Generics in Spain and Brazil may reflect
coding error, given that licensees in these countries are often local branded generics manufacturers. 21
The IMS data do not report hospital sales for the Latin American countries.

19
because originators give large price discounts to hospitals in most countries, including countries
with regulated retail prices.22
Molecule Global Age is positively related to Probability and Number of Generics,
confirming that this variable is a rough proxy for unobserved patent terms. Delay in originator
launch is negatively related to Any Generic and Number of Generics in the US, with less
consistent effects in other countries, suggesting that data exclusivities that run from country-
specific molecule launch are a more binding barrier to generic entry in the US. Global
Availability of a molecule is positively associated with Number of Generics in Canada,
Germany, Spain, Brazil and Mexico, suggesting that availability of foreign supplies of active
ingredients and finished product facilitates generic entry in these countries, where many generics
are local firms who rely on foreign suppliers of active pharmaceutical ingredients (APIs).
Relative to 2000, the year indicators show increased probability of Any Generic in the
US, the UK, France and Germany by 2009, and increased Number of Generics, conditional on
entry, in France, Italy, Spain (marginally significant), Brazil and Mexico. This increase in
generic entry in the major EU markets is consistent with the intent of their policy reforms to
encourage generic presence and uptake.
2. Prices
Normalized Generic Prices Previous studies of US generic markets have consistently
shown that generic prices decline with number of generic competitors. Whether price
competition works as effectively for branded generics and physician-driven generics markets and
how this has changed over time are important empirical questions addressed in Table A4,
summarized in Table 5.
Normalized generic prices are negatively related to number of unbranded generics in
most countries, and unbranded generics are more effective at reducing prices than branded
generics in Germany, Italy, Spain, Brazil and Mexico, as predicted. Prices are unrelated to
number of competitors in France, suggesting that the reference price system and other
regulations may have blunted price competition. In Japan, generic prices are negatively related
only to branded generics, possibly because unbranded generics are still uncommon. Unbranded
22
Scott-Morton (1997) found a positive relation between hospital share and generic entry. Magazzini et
al. (2004) found a negative relation between hospital share and unbranded generic share in a regression
that pooled 4 countries, in which the US observations likely dominated, in which case our finding is
consistent with theirs.

20
and branded generics have similar and large negative effects on price (0.076 and 0.097 percent,
respectively) in the UK, where aggressive pharmacy substitution plausibly forces both branded
and unbranded generics to compete on price. In Canada an additional branded or unbranded
generic reduces generic price by only 0.01 percent, plausibly due to regulation of generic prices
that applies to both unbranded and branded generics. In Mexico generic prices are positively
related to number of branded suppliers.
Normalized Originator Prices Consistent with our graphical analysis, multivariate
regression analysis shows no evidence that originator prices increase with number of generics in
the US, contrary to segmentation theory and previous evidence (Frank and Salkever, 1997;
Regan 2008). The measured effect for number of unbranded generics is negative but very small
(0.006) and only marginally significant in the US. By contrast, originator prices are negatively
related to the number of unbranded generics whereas number of branded generics has no effect
in France, Italy and Spain. This suggests that the reference pricing systems in these countries
have brought down originator prices and, together with other measures, have encouraged the
entry of unbranded generics that compete on price.
3. Generic Volume Shares
Table 6 reports effects of generic prices on generic volume shares for OLS and 2SLS-
GMM estimators. The 2SLS estimates pass tests for instrument validity and overidentification in
all countries. Endogeneity of generic prices is plausible in the US and the UK, where generic
prices are unregulated and generics compete on price to gain market share. For other countries
where generic prices are either regulated or constrained by reference pricing, and competition
focused on brand rather than price at least initially, prices are less endogenous to share, and OLS
results may be plausible. For most countries the OLS and 2SLS results are similar, with 2SLS
showing slightly more negative share elasticities than OLS, especially in Canada.23
Generic volume shares are significantly negatively related to generic prices in the US, the
UK and Canada, the three countries with pharmacy-driven generic markets throughout the
period, and also in France and Germany, which adopted measures to stimulate switching to
cheaper generics over the 2000s. The estimated elasticity of volume with respect to price for
Canada is much more negative using 2SLS (-1.114) than OLS (-0.228), which suggests that the
23
For Brazil and Mexico, 2SLS cannot be estimated due to lack of data on hospital price which is used as
an instrument.
21
hospital generic price we use as an instrument is a more accurate indicator of the true ex-
manufacturer price to pharmacists, net of unobserved discounts, than the official retail price
reported in the IMS retail data.
Generic price has no significant effect on generic share in the Italy, Spain and Japan. The
lack of price sensitivity is unsurprising in Japan, because physicians’ absolute dispensing
margins tend to increase with drug price. Lack of price sensitivity in Italy and Spain may reflect
reference price reimbursement systems that encourage originators to drop their price to the
reference price, thereby eliminating financial incentive for physicians/patients/pharmacists to
prefer generics. The estimated OLS effect of generic price on share is positive in Mexico, despite
its predominantly self-pay market. This is consistent with the hypothesis that consumers
purchase on brand rather than price when quality is uncertain due to lack bioequivalence
requirements (Danzon, Mulcahy and Towse, 2010).
Generic shares are also positively related to Generic Age (years since generic entry),
consistent with standard diffusion models. Controlling for price, generic shares are positively
related to number of generic manufacturers in most countries; however, we treat this primarily as
a control variable due to the possibility of endogeneity.
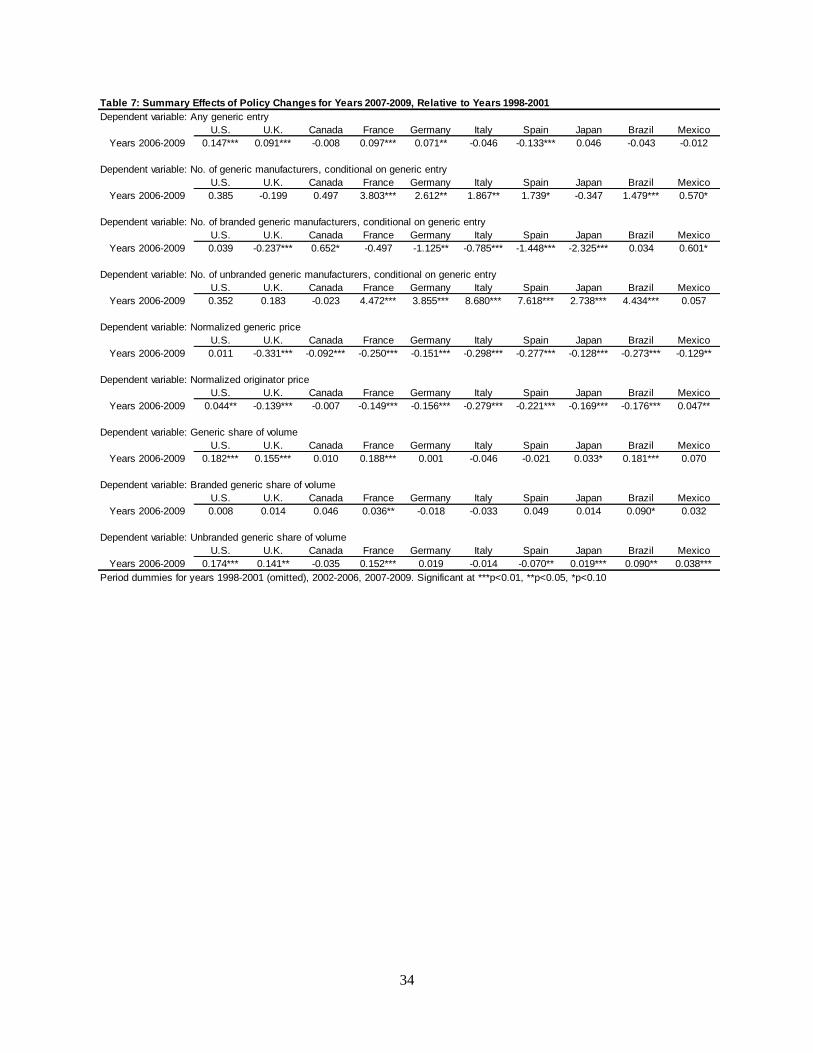
4. Effects of Policy Changes
To provide a rough measure of the changes in generic markets due to policy changes and
other factors over our time period, the regressions include two indicator variables, for years
2002-2005 and years 2006-2009, with the initial period 1998-2001 as the referent. Table 7
reports the coefficients on the 2006-2009 indicators, with tests for significance of change relative
to the initial period.
The probability of Any Generic has increased significantly in the US24
, the UK, France
and Germany, all of which have adopted measures to promote generic entry. Number of generic
manufacturers per presentation, conditional on entry, has increased significantly in France,
Germany, Italy and Brazil, with positive but less significant effects in Spain and Mexico.
Interestingly, the number of branded generic manufacturers has declined significantly in the UK,
Germany, Italy, Spain and Japan, while the number of unbranded generic manufacturers has
increased significantly in all countries except the US, UK and Canada, which had strong
24
The US 2003 MMA limited originator incentives to use patent proliferation to deter generic entry, by
permitting only one 30 month stay per product.

22
unbranded generic presence and pharmacy-driven markets initially, and Mexico. Thus the policy
changes have clearly had some success in promoting entry of unbranded generics.
Normalized generic prices have declined in all countries except in the US, which already
had very low prices. The large decline in UK generic prices plausibly reflects the changes in
generic reimbursement adopted in 2005. Normalized originator prices declined in all countries
except the US and Mexico, where they increased, and Canada with no change.
Generic share of volume, conditional on generic presence, has increased significantly in
the US, UK, France, (Japan) and Brazil. With the exception of Brazil, this generic share growth
is due almost entirely to unbranded generics, which have also had very modest share growth in
Japan. Thus the policy changes in the EU countries appear to have increased the number of
generics and their market share, with greatest growth (18.8 percent) in France. The US and the
UK have also seen 18.2 and 15.5 percent, respectively, increase in generic market shares. The
largest decline in generic prices was in the UK (33 percent), followed by France, Italy, Spain and
Brazil (25-27 percent).
VII. Savings from Generics
Payer savings from generics depends on the generic-originator price difference and on the
share of prescriptions that are dispensed generically.25
We calculate the percent savings from
generic price, volume and as a share of total drug spending in 1998-2001 and 2006-2009,
calculated as follows (where Q denotes units, P denotes price, superscripts O and G denote
originator and generic, respectively): Percent savings in volume, PG Q
G/( P
G Q
G +P
O Q
O), is the
generic share of units for molecules in our 8-20 year cohort, weighted by their respective prices;
Percent savings in price, (PO– P
G )* Q
G /P
GQ
G , measures the counterfactual percent increase in
cost if all generically-dispensed units were sold as originators; Total percent savings, (PO– P
G )*
QG/(P
O* Q
G + P
O* Q
O), measures how much higher expenditure would be if there were no
generics for drugs in the 8-20 year cohort. A Total savings measure calculates the generic
savings for the 8-20 year cohort as a percent of total expenditure on all drugs. The estimates for
each time period and country are in Table 8, which also reports the change in savings between
the early and later periods.
25
In theory lower generic prices might induce increased utilization. In practice US evidence indicates no
increase in utilization, plausibly because any positive price response is offset by the decline in promotion
that occurs in markets with pharmacy substitution and unbranded generics.

23
Savings from low generic prices are far greater in the US than in any other country in
2001, but by 2009 the UK prices yield similar savings and the UK therefore has the greatest
increase in price savings over the period. Of course, these estimates are sensitive to the originator
prices, which are relatively high in the US, but the US generic prices are also absolutely low
relative to other countries (Table 3).
The generic share of unit volume increased most in France, from 7 percent in 2001 to 55
percent in 2009. As of 2009, generic shares of the 8-20 year cohort total volume are higher in
Canada, the UK, France and Germany than in the US, because although the US has the highest
generic penetration conditional on generic entry, Canada, France and Germany on average have
earlier generic entry, presumably due to fewer patent extensions for originators. Thus although
P4 challenges have shortened expected patent life for some drugs, originators in the US on
average lose less volume share to generics than originators in these other countries in the 8-20
year phase of originator life. Relatively high originator prices in the denominator also reduce this
measure for the US.
The total generic savings on the 8-20 year cohort are highest in the UK and the US,
which would have spent 272 percent and 238 percent more, respectively, on these drugs, in the
absence of generics. Canada, France and Germany would have spent 43-55 percent more, in the
absence of generics. Among the EU countries which made major changes, only France has
significant increase in savings (39.3 percentage points) from 1998-2009. In Germany savings on
price and total savings appear to have declined, even though volume share increased; however,
price savings in Germany may be understated if the discounts granted directly to sickness funds
are not reflect in IMS price data. Spain has modest declines in price and volume savings.
Generic savings as a share of total drug spending is under 10 percent in all countries
except Japan. Because this measure is heavily influenced by the level of on-patent prices which
reflect very different policies and policy objectives, it is less relevant as a measure of savings
achieved by policies to encourage generics than the measures which focus on savings from the 8-
20 year cohort.
Conclusions
Cross-national differences in policies towards generics have resulted in major differences
in generic entry, generic prices and generic market shares, and in whether generic markets are
24
pharmacy-driven with unbranded generics, as in the US and UK, or physician driven with
branded generics, as has traditionally been the norm in most other countries. Over the last
decade, policies adopted in France, Spain, Italy and Germany to increase generic uptake and
price-competitiveness have resulted in some growth in the share of unbranded generics in these
countries. Reference pricing policies may have stunted the growth of generic shares and price
competition, although to the extent that they also reduce originator prices, they reduce the
savings from generic adoption. As of 2009, the policy changes appear to have been most
effective in France, which experienced a large increase in generic penetration and some
reduction in generic prices, with at most modest incremental savings in Italy, Spain and
Germany. The UK’s policies to reduce generic reimbursement prices have also achieved very
significant price savings and increased generic penetration. Although the data do not permit
precise measurement of individual policy effects, these results are consistent with the hypothesis
that policies to shift generic markets from physician-driven, branded generics towards pharmacy
drive, unbranded generics, can potentially yield significant savings to payers, provided that these
policies are appropriate designed such that payers rather than pharmacies capture most of the
savings.
25
References
Appelt, S., 2009. Early entries and trademarks – barriers to generic entry in the German
pharmaceutical industry? Working paper.
Bresnahan, T.F., Reiss, P.C., 1991. Entry and competition in concentrated markets. Journal of
Political Economy 99, 977-1009.
Cavazzani, P., Rajagopal, 2010. Market analysis of growing competition in pharmaceutical
industry. International Journal of Business Competition and Growth 1, 31-44.
Caves, R.E., Whinston, M.D., Hurwitz, M.A., 1991. Patent expiration, entry, and competition in
the US pharmaceutical industry. Brookings Papers on Economic Activity: Microeconomics
1991, 1-48.
Danzon, P.M., Chao, L.W., 2000. Does regulation drive out competition in pharmaceutical
markets. Journal of Law & Economics 43, 311-357.
Danzon, P.M., Furukawa, M.F., 2003. Prices and availability of pharmaceuticals: evidence from
nine countries. Health Affairs w3, 521-536.
Danzon, P.M., Furukawa, M.F., 2008. International prices and availability of pharmaceuticals in
2005. Health Affairs 27, 221-233.
Ellison, G., Ellison, S.F., 2007. Strategic entry deterrence and the behavior of pharmaceutical
incumbents prior to patent expiration. Working Paper.
Ferrandiz, J.M., 1999. The impact of generic goods in the pharmaceutical industry. Health
Economics, 8, 599-612.
Frank, R.G., Salkever, D.S., 1992. Pricing, patent loss and the market for pharmaceuticals.
Southern Economic Journal 59, 165-179.
Frank, R.G., Salkever, D.S., 1997. Generic entry and the pricing of pharmaceuticals. Journal of
Economics & Management Strategy 6, 75-90.
Garattini, L., Fabrizio, T., 2000. A comparative analysis of generic markets in five European
countries. Health Policy 51:149-162.
Garattini, L., Cornago, D., De Compardri, P., 2007. Pricing and reimbursement of in-patent
drugs in seven European countries: a comparative analysis. Health Policy 82, 330-339.
Garrattini, L., Ghislandi, S., 2006. Off-patent drugs in Italy: a short-sighted view? European
Journal of Health Economics 7, 79-83.

26
Gorecki, P.K., 1987. Barriers to entry in the Canadian pharmaceutical industry. Journal of Health
Economics 6, 59-72.
Grabowski, H., Kyle, M., 2007. Generic competition and market exclusivity periods in
pharmaceuticals. Managerial and Decision Economics 28, 491-502.
Grabowski, H., Vernon, J.M., 1992. Brand loyalty, entry, and price competition in
pharmaceuticals after the 1984 Drug Act. Journal of Law & Economics 35, 331-350.
Grabowski, H., Vernon, J., 1996. Longer Patents for increased generic competition in the U.S.:
The Waxman-Hatch Act after one decade. Pharmacoeconomics, 10, 110-123.
Hollis, A., 2003. The anti-competitive effects of brand-controlled "pseudo-generics" in the
Canadian pharmaceutical market. Canadian Public Policy/Analyse de Politiques 29, 21-32.
Hudson, J., 2001. Generic take-up in the pharmaceutical market following patent expiry: a multi-
country study. International Review of Law and Economics 20, 205-221.
Hurwitz, M.A., Caves, R.E., 1988. Persuasion or information? promotion and the shares of brand
name and generic pharmaceuticals. Journal of Law & Economics 31, 299-320.
Jones, J.C., Potashnik, T., Zhang, A., 2001. Patents, brand-generic competition and the pricing of
ethical drugs in Canada: some empirical evidence from British Columbia, 1981-1994. Applied
Economics 33, 947-956.
Kanavos, P., 2007. Do generics offer significant savings to the UK National Health Service?
Current Medical Research and Opinion 23, 105-116.
Kanavos, P., Costa-Font, J., Seeley, E., 2008. Competition in off-patent drug markets: issues,
regulatiojn and evidence. Economic Policy 23, 499-544.
Lopez-Casasnovas, G.,Puig-Junoy, J., 2000. Review of the literature on reference pricing. Health
Policy 54, 87-123.
Magazzini, L., Pammoli, F., Riccaboni, M., 2004. Dynamic competition in pharmaceuticals:
patent expiry, generic penetration and industry structure. European Journal of Health Economics
5, 175-182.
McRae, J.J., Tapon, F., 1985. Some empirical evidence on post-patent barriers to entry in the
Canadian pharmaceutical industry. Journal of Health Economics 4, 43-61.
Moreno-Torres, I., Puig-Junoy, J., Borrell, J.R., 2009. Generic entry into the regulated Spanish
pharmaceutical market. Review of Industrial Organization 34, 373-388.
Pammoli, F., Magazzini, L., Orsenigo, L., 2002. The intensity of competition after patent expiry
in pharmaceuticals: a cross-country analysis. Revue D’Economie Industrielle 99, 107-131.

27
Reiffen, D., Ward, M.E., 2005. Generic drug industry dynamics. Review of Economics and
Statistics 87, 37-49.
Saha, A., Grabowski, H., Birnbaum, H., Greenberg, P., Bizan, O., 2006. Generic competition in
the US pharmaceutical industry. International Journal of the Economics of Business 13, 15-38.
Scott Morton, F., 1999. Entry decisions in the generic pharmaceutical industry. RAND Journal of
Economics 30, 421-440.
Scott Morton, F., 2000. Barriers to entry, brand advertising, and generic entry in the US
pharmaceuticalindustry. International Journal of Industrial Organization 18, 1085-1104.
Suh, D.C., Manning, W.G., Schondelmeyer, S., Hadsall, R.S., 2000. Effect of multi-source entry
on price competition after patent expiration in the pharmaceutical industry. Health Services
Research 35, 529-547.
U.S. Congressional Budget Office, 2005. Prices for brand-name drugs under selected federal
programs. Washington D.C.: Congressional Budget Office.

28
29

30
31

32
Table 2: Pharmaceutical Sales and Unit Volume
U.S. U.K. Canada France Germany Italy Spain Japan Brazil Mexico
Sales
Total market $326,438 $24,001 $21,564 $51,742 $52,615 $31,731 $26,375 $111,732 $21,731 $13,992
Retail market1 160,840 12,165 11,701 16,672 16,218 10,135 13,410 38,239 5,877 4,260
Generic market 40,459 4,662 5,307 4,228 6,845 2,875 3,734 9,510 3,562 1,843
Sample cohort2 83,333 3,852 3,966 5,101 4,515 2,841 3,219 14,923 797 763
Generic market 6,324 615 953 654 1,126 264 414 354 354 88
Unit volume
Total market 505,325 114,274 79,097 147,957 158,167 66,998 71,519 339,007 124,123 62,118
Retail market1 170,899 45,738 31,764 39,630 39,317 28,335 35,026 135,878 20,394 7,649
Generic market 128,555 31,540 25,500 19,264 30,357 13,125 17,246 76,733 14,424 4,627
Sample cohort2 41,574 9,107 5,234 9,219 9,898 7,461 7,689 28,563 2,258 750
Generic market 18,215 5,150 1,991 2,260 6,313 1,212 2,223 1,545 1,331 178
Generic % sales
Retail market1 25.2 38.3 45.4 25.4 42.2 28.4 27.8 24.9 60.6 43.3
Sample cohort2 7.6 16.0 24.0 12.8 24.9 9.3 12.9 2.4 44.4 11.6
Generic % volume
Retail market1 75.2 69.0 80.3 48.6 77.2 46.3 49.2 56.5 70.7 60.5
Sample cohort243.8 56.5 38.0 24.5 63.8 16.2 28.9 5.4 58.9 23.8
Sales ($USD) and unit volume are reported in millions for the 12 months ending June 2009. 1Retail market excludes combination products,
biologics, OTC, and hospital channel. 2Sample cohort includes molecules with global age 8-20 years.
Table 3: Market Size and Generic Entry
Median annual sales ($USD, M, 2009 exchange rates) and mean generic price per dose ($USD) at 24-27 months since generic entry
U.S. U.K. Canada France Germany Italy Spain Japan Brazil Mexico
Per generic manufacturer
Annual sales 3.99 2.88 1.11 2.00 1.02 2.66 1.96 4.03 1.87 1.16
Price per dose 0.36 0.37 0.57 0.39 0.38 0.49 0.43 0.30 0.49 1.00
1 generic manufacturer
Annual sales 2.41 2.06 1.58 2.50 5.40 5.49 3.67 1.59 2.30 1.09
Price per dose 0.88 0.44 0.51 0.67 0.93 0.56 0.60 0.27 0.49 0.92
2 or 3 generic manufacturers
Annual sales 11.02 5.22 3.25 3.94 1.76 2.24 5.72 8.27 8.39 3.01
Price per dose 0.47 0.47 0.59 0.30 0.40 0.24 0.44 0.31 0.47 1.32
4+ generic manufacturers
Annual sales 34.0 18.0 6.11 20.4 11.37 13.4 16.66 50.3 5.30 6.88
Price per dose 0.23 0.22 0.57 0.40 0.32 0.52 0.37 0.32 0.45 1.03
n/a, no cases in sample. Sample includes oral-solid presentations only.

33
Table 4: Effects of Market Size on Any Generic Entry and No. of Generic Manufacturers
Dependent variable: Any generic entry
U.S. U.K. Canada France Germany Italy Spain Japan Brazil Mexico
lnSales 0.003 0.028*** 0.024*** 0.020*** 0.043*** 0.033*** 0.036*** 0.039*** 0.055*** 0.008
Dependent variable: No. of generic manufacturers, conditional on generic entry
U.S. U.K. Canada France Germany Italy Spain Japan Brazil Mexico
lnSales 0.715*** 0.340*** 0.566*** 1.588*** 2.581*** 0.663*** 0.981*** 1.825*** 1.115*** 0.421***
Dependent variable: No. of branded generic manufacturers, conditional on generic entry
U.S. U.K. Canada France Germany Italy Spain Japan Brazil Mexico
lnSales 0.003 0.017 0.211*** 0.223** 0.904*** 0.279*** 0.210** 1.392*** 0.937*** 0.397***
Dependent variable: No. of unbranded generic manufacturers, conditional on generic entry
U.S. U.K. Canada France Germany Italy Spain Japan Brazil Mexico
lnSales 0.712*** 0.312*** 0.352*** 1.437*** 1.804*** 1.124** 1.196*** 0.501*** 0.338*** 0.083**
Table 5: Effects of No. of Generic Manufacturers on Normalized Generic and Originator Price
U.S. U.K. Canada France Germany Italy Spain Japan Brazil Mexico
GenMfrBrand 0.029 -0.097*** -0.014** -0.014 -0.009** 0.002 -0.006 -0.010*** -0.006** 0.038*
GenMfrUnbr -0.043*** -0.076*** -0.011** -0.006 -0.015*** -0.043*** -0.013*** 0.001 -0.012** -0.080**
U.S. U.K. Canada France Germany Italy Spain Japan Brazil Mexico
GenMfrBrand 0.107 -0.024 -0.020** -0.001 -0.017* 0.000 -0.002 -0.004*** -0.010*** 0.005
GenMfrUnbr -0.006* -0.004 -0.001 -0.013*** -0.006 -0.031*** -0.017*** -0.003*** -0.010* -0.010
Dependent variable: Generic share of volume
U.S. U.K. Canada France Germany Italy Spain Japan Brazil Mexico
GenPrice1 -0.144*** -0.228*** -0.382*** -0.262* -0.202** 0.039 -0.068 0.050 -0.346*** 0.140**
GenPrice2 -0.207*** -0.224*** -1.111*** -0.425** -0.371*** 0.002 -0.019 0.038 n/a n/a
Table 6: Effects of Normalized Generic Price on Generic Share of Volume
Marginal effects from Probit and Negative-Binomial regressions, clustered by molecule; robust standard errors in brackets,
significant at ***p<0.01, **p<0.05, *p<0.10
Marginal effects from 1OLS and 22SLS-GMM regressions, clustered by molecule; robust standard errors in brackets, significant at
***p<0.01, **p<0.05, *p<0.10. n/a, instrumental variables not available.
Marginal effects from OLS regressions, clustered by molecule; robust standard errors in brackets, significant at ***p<0.01, **p<0.05,
Dependent variable: Normalized generic price
Dependent variable: Normalized originator price
34
Dependent variable: Any generic entry
U.S. U.K. Canada France Germany Italy Spain Japan Brazil Mexico
Years 2006-2009 0.147*** 0.091*** -0.008 0.097*** 0.071** -0.046 -0.133*** 0.046 -0.043 -0.012
Dependent variable: No. of generic manufacturers, conditional on generic entry
U.S. U.K. Canada France Germany Italy Spain Japan Brazil Mexico
Years 2006-2009 0.385 -0.199 0.497 3.803*** 2.612** 1.867** 1.739* -0.347 1.479*** 0.570*
Dependent variable: No. of branded generic manufacturers, conditional on generic entry
U.S. U.K. Canada France Germany Italy Spain Japan Brazil Mexico
Years 2006-2009 0.039 -0.237*** 0.652* -0.497 -1.125** -0.785*** -1.448*** -2.325*** 0.034 0.601*
Dependent variable: No. of unbranded generic manufacturers, conditional on generic entry
U.S. U.K. Canada France Germany Italy Spain Japan Brazil Mexico
Years 2006-2009 0.352 0.183 -0.023 4.472*** 3.855*** 8.680*** 7.618*** 2.738*** 4.434*** 0.057
Dependent variable: Normalized generic price
U.S. U.K. Canada France Germany Italy Spain Japan Brazil Mexico
Years 2006-2009 0.011 -0.331*** -0.092*** -0.250*** -0.151*** -0.298*** -0.277*** -0.128*** -0.273*** -0.129**
Dependent variable: Normalized originator price
U.S. U.K. Canada France Germany Italy Spain Japan Brazil Mexico
Years 2006-2009 0.044** -0.139*** -0.007 -0.149*** -0.156*** -0.279*** -0.221*** -0.169*** -0.176*** 0.047**
Dependent variable: Generic share of volume
U.S. U.K. Canada France Germany Italy Spain Japan Brazil Mexico
Years 2006-2009 0.182*** 0.155*** 0.010 0.188*** 0.001 -0.046 -0.021 0.033* 0.181*** 0.070
Dependent variable: Branded generic share of volume
U.S. U.K. Canada France Germany Italy Spain Japan Brazil Mexico
Years 2006-2009 0.008 0.014 0.046 0.036** -0.018 -0.033 0.049 0.014 0.090* 0.032
Dependent variable: Unbranded generic share of volume
U.S. U.K. Canada France Germany Italy Spain Japan Brazil Mexico
Years 2006-2009 0.174*** 0.141** -0.035 0.152*** 0.019 -0.014 -0.070** 0.019*** 0.090** 0.038***
Period dummies for years 1998-2001 (omitted), 2002-2006, 2007-2009. Significant at ***p<0.01, **p<0.05, *p<0.10
Table 7: Summary Effects of Policy Changes for Years 2007-2009, Relative to Years 1998-2001

35
Table 8: Savings from Generics
U.S. U.K. Canada France Germany Italy Spain Japan Brazil Mexico
P1: Years 1998-2001 4.439 0.556 1.358 0.578 1.109 0.085 0.375 0.750 0.490 0.222
P2: Years 2002-2005 3.051 0.798 0.718 0.648 0.710 0.135 0.326 0.658 0.927 0.355
P3: Years 2006-2009 4.554 4.091 0.796 0.790 0.807 0.148 0.192 0.664 1.353 1.194
% diff. P3-P1 0.115 3.535 -0.562 0.212 -0.302 0.063 -0.183 -0.085 0.863 0.973
U.S. U.K. Canada France Germany Italy Spain Japan Brazil Mexico
P1: Years 1998-2001 0.372 0.430 0.463 0.070 0.562 0.234 0.440 0.033 0.364 0.254
P2: Years 2002-2005 0.542 0.635 0.659 0.302 0.662 0.231 0.408 0.044 0.608 0.291
P3: Years 2006-2009 0.521 0.664 0.691 0.549 0.621 0.240 0.393 0.064 0.719 0.285
% diff. P3-P1 0.150 0.234 0.228 0.479 0.059 0.007 -0.047 0.031 0.355 0.031
U.S. U.K. Canada France Germany Italy Spain Japan Brazil Mexico
P1: Years 1998-2001 1.651 0.239 0.629 0.041 0.623 0.020 0.165 0.025 0.178 0.056
P2: Years 2002-2005 1.655 0.507 0.473 0.196 0.470 0.031 0.133 0.029 0.564 0.103
P3: Years 2006-2009 2.375 2.715 0.550 0.433 0.501 0.036 0.076 0.043 0.972 0.340
% diff. P3-P1 0.724 2.476 -0.079 0.393 -0.122 0.016 -0.090 0.018 0.794 0.284
U.S. U.K. Canada France Germany Italy Spain Japan Brazil Mexico
P1: Years 1998-2001 0.025 0.008 0.048 0.001 0.052 0.002 0.032 0.002 0.028 0.004
P2: Years 2002-2005 0.065 0.061 0.035 0.010 0.062 0.003 0.018 0.003 0.079 0.007
P3: Years 2006-2009 0.201 0.235 0.053 0.029 0.049 0.003 0.007 0.005 0.063 0.020
% diff. P3-P1 0.176 0.227 0.005 0.028 -0.003 0.001 -0.026 0.003 0.035 0.016
Percent savings in prices
Percent share of unit volume
Total percent savings from generics, for the 8-20 year cohort
Total percent savings from generics, relative to total market
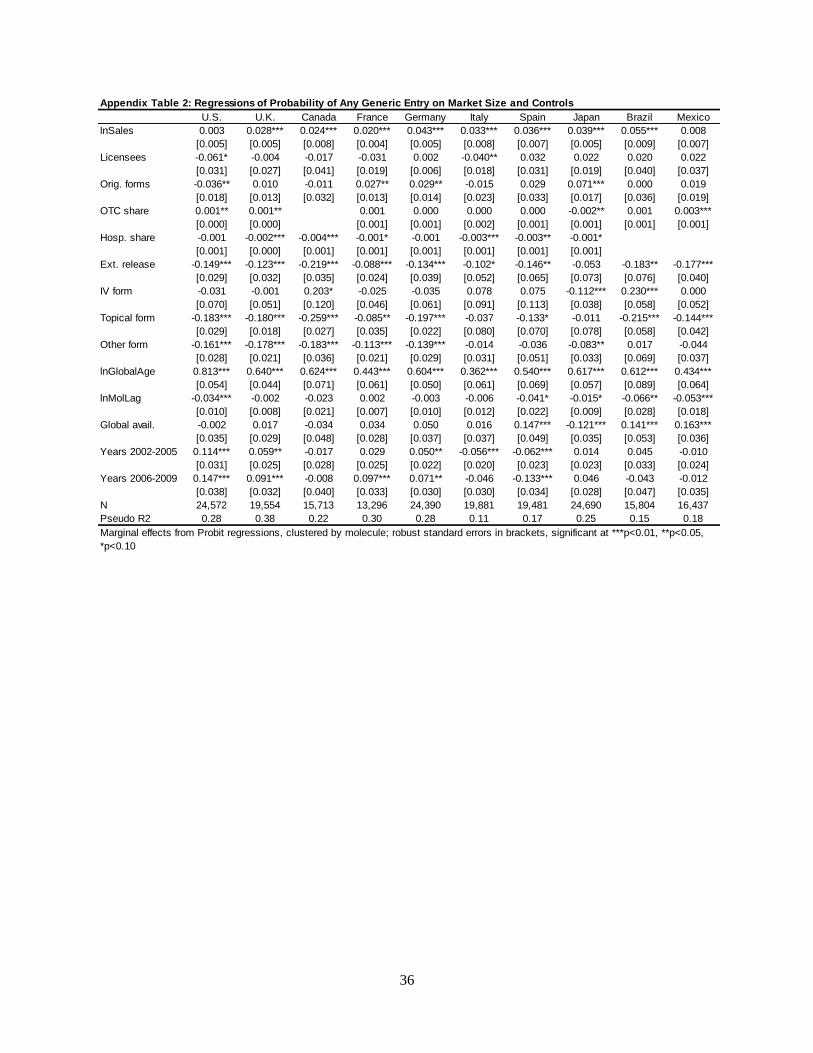
36
Appendix Table 2: Regressions of Probability of Any Generic Entry on Market Size and Controls
U.S. U.K. Canada France Germany Italy Spain Japan Brazil Mexico
lnSales 0.003 0.028*** 0.024*** 0.020*** 0.043*** 0.033*** 0.036*** 0.039*** 0.055*** 0.008
[0.005] [0.005] [0.008] [0.004] [0.005] [0.008] [0.007] [0.005] [0.009] [0.007]
Licensees -0.061* -0.004 -0.017 -0.031 0.002 -0.040** 0.032 0.022 0.020 0.022
[0.031] [0.027] [0.041] [0.019] [0.006] [0.018] [0.031] [0.019] [0.040] [0.037]
Orig. forms -0.036** 0.010 -0.011 0.027** 0.029** -0.015 0.029 0.071*** 0.000 0.019
[0.018] [0.013] [0.032] [0.013] [0.014] [0.023] [0.033] [0.017] [0.036] [0.019]
OTC share 0.001** 0.001** 0.001 0.000 0.000 0.000 -0.002** 0.001 0.003***
[0.000] [0.000] [0.001] [0.001] [0.002] [0.001] [0.001] [0.001] [0.001]
Hosp. share -0.001 -0.002*** -0.004*** -0.001* -0.001 -0.003*** -0.003** -0.001*
[0.001] [0.000] [0.001] [0.001] [0.001] [0.001] [0.001] [0.001]
Ext. release -0.149*** -0.123*** -0.219*** -0.088*** -0.134*** -0.102* -0.146** -0.053 -0.183** -0.177***
[0.029] [0.032] [0.035] [0.024] [0.039] [0.052] [0.065] [0.073] [0.076] [0.040]
IV form -0.031 -0.001 0.203* -0.025 -0.035 0.078 0.075 -0.112*** 0.230*** 0.000
[0.070] [0.051] [0.120] [0.046] [0.061] [0.091] [0.113] [0.038] [0.058] [0.052]
Topical form -0.183*** -0.180*** -0.259*** -0.085** -0.197*** -0.037 -0.133* -0.011 -0.215*** -0.144***
[0.029] [0.018] [0.027] [0.035] [0.022] [0.080] [0.070] [0.078] [0.058] [0.042]
Other form -0.161*** -0.178*** -0.183*** -0.113*** -0.139*** -0.014 -0.036 -0.083** 0.017 -0.044
[0.028] [0.021] [0.036] [0.021] [0.029] [0.031] [0.051] [0.033] [0.069] [0.037]
lnGlobalAge 0.813*** 0.640*** 0.624*** 0.443*** 0.604*** 0.362*** 0.540*** 0.617*** 0.612*** 0.434***
[0.054] [0.044] [0.071] [0.061] [0.050] [0.061] [0.069] [0.057] [0.089] [0.064]
lnMolLag -0.034*** -0.002 -0.023 0.002 -0.003 -0.006 -0.041* -0.015* -0.066** -0.053***
[0.010] [0.008] [0.021] [0.007] [0.010] [0.012] [0.022] [0.009] [0.028] [0.018]
Global avail. -0.002 0.017 -0.034 0.034 0.050 0.016 0.147*** -0.121*** 0.141*** 0.163***
[0.035] [0.029] [0.048] [0.028] [0.037] [0.037] [0.049] [0.035] [0.053] [0.036]
Years 2002-2005 0.114*** 0.059** -0.017 0.029 0.050** -0.056*** -0.062*** 0.014 0.045 -0.010
[0.031] [0.025] [0.028] [0.025] [0.022] [0.020] [0.023] [0.023] [0.033] [0.024]
Years 2006-2009 0.147*** 0.091*** -0.008 0.097*** 0.071** -0.046 -0.133*** 0.046 -0.043 -0.012
[0.038] [0.032] [0.040] [0.033] [0.030] [0.030] [0.034] [0.028] [0.047] [0.035]
N 24,572 19,554 15,713 13,296 24,390 19,881 19,481 24,690 15,804 16,437
Pseudo R2 0.28 0.38 0.22 0.30 0.28 0.11 0.17 0.25 0.15 0.18
Marginal effects from Probit regressions, clustered by molecule; robust standard errors in brackets, significant at ***p<0.01, **p<0.05,
*p<0.10

37
Appendix Table 3: Regressions of No. of Generic Manufacturers on Market Size and Controls
U.S. U.K. Canada France Germany Italy Spain Japan Brazil Mexico
lnSales 0.715*** 0.340*** 0.566*** 1.588*** 2.581*** 0.663*** 0.981*** 1.825*** 1.115*** 0.421***
[0.086] [0.043] [0.100] [0.188] [0.263] [0.196] [0.189] [0.181] [0.156] [0.079]
Licensees 0.468 -0.192 -0.246 -0.600 0.059 0.267 1.321** -0.148 0.903* 0.217
[0.503] [0.135] [0.368] [0.503] [0.163] [0.487] [0.593] [0.403] [0.486] [0.287]
Orig. forms -0.548*** 0.148 -0.583*** 0.636 0.663 0.778 0.784 0.164 0.412 0.343*
[0.205] [0.115] [0.221] [0.414] [0.420] [0.495] [0.657] [0.359] [0.411] [0.196]
OTC share -0.013* -0.001 -0.025** 0.026*** -0.002 0.040*** 0.012 0.023 0.009
[0.008] [0.002] [0.010] [0.007] [0.013] [0.010] [0.022] [0.016] [0.012]
Hosp. share -0.016* -0.008** -0.045*** -0.054 -0.150*** -0.031 -0.027 -0.042**
[0.009] [0.004] [0.013] [0.036] [0.038] [0.020] [0.028] [0.017]
Ext. release -3.291*** -0.188 -1.761*** -0.704 -1.009 2.432** -2.710*** -0.640 -2.354*** -1.317***
[0.289] [0.365] [0.396] [1.329] [1.484] [1.142] [0.865] [2.306] [0.316] [0.185]
IV form -2.145*** -0.637** -0.123 -3.149* 1.365 2.586 -1.151 -0.540 1.076 0.015
[0.556] [0.248] [0.961] [1.623] [2.830] [1.729] [1.467] [1.539] [0.980] [0.522]
Topical form -2.269*** -0.559*** -1.606*** 1.647 -8.072*** -0.966** -2.417*** -1.964** -1.010 -1.360***
[0.655] [0.149] [0.293] [2.218] [0.481] [0.464] [0.900] [0.998] [1.086] [0.338]
Other form -1.420*** -0.324 -1.630*** -2.122** -5.745*** -0.723 -2.143** -1.530** -0.643 -1.264***
[0.474] [0.262] [0.418] [0.991] [0.702] [0.455] [0.967] [0.616] [0.691] [0.243]
lnGlobalAge 4.695*** 1.582** 3.218*** 5.587 11.097*** 4.587*** 7.204*** 2.382* 2.721*** 2.459***
[0.999] [0.615] [0.887] [3.711] [2.913] [1.395] [1.757] [1.395] [1.048] [0.822]
lnMolLag -0.327** 0.036 -0.759*** -0.359 -0.207 -0.357 -1.221* 0.031 -0.965*** -0.489***
[0.149] [0.058] [0.215] [0.222] [0.336] [0.273] [0.687] [0.226] [0.317] [0.159]
Global avail. 0.759 0.180 0.885** 0.903 2.594*** -0.427 2.177** 0.184 1.168*** 1.064***
[0.546] [0.270] [0.391] [0.801] [0.957] [0.716] [0.917] [0.769] [0.426] [0.319]
Years 2002-2005 -0.622 -0.175 0.493 1.138 0.825 -0.172 0.355 -1.082*** 1.332*** 0.375*
[0.524] [0.345] [0.371] [1.782] [0.977] [0.354] [0.542] [0.358] [0.313] [0.223]
Years 2006-2009 0.385 -0.199 0.497 3.803*** 2.612** 1.867** 1.739* -0.347 1.479*** 0.570*
[0.528] [0.389] [0.468] [1.295] [1.292] [0.826] [0.925] [0.528] [0.500] [0.318]
N 5,665 3,580 4,137 1,544 5,203 3,290 5,775 5,962 6,115 3,726
Marginal effects from Negative-Binomial regressions, clustered by molecule; robust standard errors in brackets, significant at ***p<0.01,
**p<0.05, *p<0.10
Appendix Table 4: Regressions of Normalized Generic Prices on No. of Generic Manufacturers and Controls
U.S. U.K. Canada France Germany Italy Spain Japan Brazil Mexico
GenMfrBrand 0.029 -0.097*** -0.014** -0.014 -0.009** 0.002 -0.006 -0.010*** -0.006** 0.038*
[0.043] [0.033] [0.005] [0.009] [0.004] [0.004] [0.004] [0.002] [0.002] [0.020]
GenMfrUnbr. -0.043*** -0.076*** -0.011** -0.006 -0.015*** -0.043*** -0.013*** 0.001 -0.012** -0.080**
[0.005] [0.014] [0.005] [0.004] [0.003] [0.006] [0.002] [0.002] [0.005] [0.037]
Ext. release 0.084 0.224*** 0.074** -0.019 0.031 0.036 0.142*** -0.047 0.041 0.383***
[0.067] [0.074] [0.029] [0.020] [0.033] [0.043] [0.033] [0.034] [0.051] [0.087]
IV form -0.099 0.140*** 0.027 -0.138** 0.240*** -0.074 -0.028 0.126*** 0.052* -0.094*
[0.070] [0.048] [0.042] [0.057] [0.043] [0.073] [0.040] [0.033] [0.029] [0.055]
Topical form 0.200** 0.278*** 0.016 0.343*** 0.115** -0.069 0.069*** 0.112** 0.222** 0.061
[0.089] [0.040] [0.038] [0.039] [0.050] [0.051] [0.025] [0.049] [0.094] [0.086]
Other form 0.076 0.178** -0.060 -0.061** 0.198*** 0.063* 0.058 0.165*** 0.071** 0.070
[0.072] [0.068] [0.040] [0.027] [0.075] [0.034] [0.035] [0.034] [0.030] [0.079]
lnGlobalAge -0.156 -0.542*** 0.060 0.026 -0.385*** -0.003 -0.200*** -0.353*** -0.059 -0.215*
[0.109] [0.115] [0.057] [0.046] [0.066] [0.074] [0.052] [0.064] [0.050] [0.117]
lnMolLag 0.013 0.029* -0.013 -0.002 0.021 -0.014 0.016 0.001 0.016 -0.028
[0.015] [0.015] [0.011] [0.008] [0.013] [0.014] [0.012] [0.006] [0.014] [0.026]
Global avail. 0.015 -0.079 0.033 0.000 0.005 0.009 -0.056*** 0.068*** -0.084*** -0.016
[0.042] [0.048] [0.028] [0.033] [0.040] [0.044] [0.021] [0.024] [0.025] [0.055]
Years 2002-2005 0.011 -0.097*** -0.055** -0.040* -0.026 -0.126*** -0.114*** -0.049*** -0.246*** -0.058
[0.036] [0.031] [0.027] [0.023] [0.029] [0.023] [0.018] [0.017] [0.017] [0.041]
Years 2006-2009 0.011 -0.331*** -0.092*** -0.250*** -0.151*** -0.298*** -0.277*** -0.128*** -0.273*** -0.129**
[0.043] [0.045] [0.031] [0.034] [0.042] [0.032] [0.023] [0.023] [0.027] [0.056]
N 5,097 3,369 3,820 1,522 4,768 2,922 5,236 5,672 4,671 2,814
R-squared 0.32 0.44 0.10 0.55 0.54 0.62 0.67 0.35 0.54 0.15
Marginal effects from OLS regressions, clustered by molecule; robust standard errors in brackets, significant at ***p<0.01, **p<0.05,

38
U.S. U.K. Canada France Germany Italy Spain Japan Brazil Mexico
GenPrice -0.144*** -0.228*** -0.382*** -0.262* -0.202** 0.039 -0.068 0.050 -0.346*** 0.140**
[0.039] [0.053] [0.115] [0.135] [0.083] [0.165] [0.124] [0.093] [0.102] [0.068]
GenMfrBrand 0.022 0.063* 0.031*** 0.017 0.010* -0.004 0.030*** 0.005** 0.011*** 0.026***
[0.023] [0.033] [0.010] [0.016] [0.006] [0.009] [0.007] [0.002] [0.004] [0.009]
GenMfrUnbr. 0.009*** 0.095*** 0.036*** 0.035*** 0.019*** 0.021 0.007** 0.003* 0.023*** 0.008
[0.003] [0.020] [0.010] [0.007] [0.003] [0.014] [0.003] [0.002] [0.007] [0.020]
Ext. release -0.087* -0.070 0.109* 0.052 -0.043 0.183 -0.086 0.131 -0.093 -0.051
[0.044] [0.069] [0.061] [0.047] [0.092] [0.136] [0.115] [0.138] [0.099] [0.066]
IV form -0.174*** -0.279*** 0.040 -0.161 0.079 0.153 0.001 0.148*** -0.086 -0.048
[0.034] [0.105] [0.068] [0.169] [0.084] [0.100] [0.097] [0.040] [0.056] [0.078]
Topical form 0.017 -0.156*** 0.023 -0.151*** 0.091 -0.003 0.019 -0.211*** 0.068
[0.032] [0.041] [0.076] [0.046] [0.084] [0.218] [0.022] [0.057] [0.083]
Other form -0.046 -0.239*** 0.056 -0.187*** 0.075 0.088 0.001 0.131*** -0.048 -0.006
[0.037] [0.041] [0.055] [0.062] [0.057] [0.077] [0.060] [0.048] [0.063] [0.070]
lnGlobalAge 0.056 0.142 0.099 0.040 -0.076 0.137 -0.006 -0.149 -0.237** 0.116
[0.060] [0.114] [0.069] [0.102] [0.101] [0.152] [0.110] [0.104] [0.100] [0.110]
lnMolLag 0.012* -0.014 -0.024 -0.003 0.021* 0.012 -0.011 0.000 0.099** 0.010
[0.007] [0.015] [0.015] [0.018] [0.011] [0.023] [0.034] [0.005] [0.038] [0.026]
lnGenAge 0.091*** 0.092*** 0.077*** 0.102*** 0.115*** 0.041 0.099*** 0.042*** 0.140*** 0.090***
[0.011] [0.016] [0.020] [0.013] [0.015] [0.030] [0.016] [0.014] [0.021] [0.024]
Global avail. -0.037* 0.000 0.047 -0.039 0.018 -0.101 -0.040 0.038 0.015 -0.004
[0.021] [0.048] [0.044] [0.033] [0.032] [0.064] [0.048] [0.027] [0.049] [0.060]
Years 2002-2005 0.136*** 0.177*** 0.032 0.039 0.036 0.030 0.002 0.028* 0.065* 0.051
[0.027] [0.056] [0.031] [0.041] [0.033] [0.056] [0.035] [0.015] [0.036] [0.038]
Years 2006-2009 0.182*** 0.155*** 0.010 0.188*** 0.001 -0.046 -0.021 0.033* 0.181*** 0.070
[0.027] [0.059] [0.033] [0.044] [0.049] [0.078] [0.050] [0.019] [0.052] [0.050]
N 5,097 3,369 3,680 1,514 4,566 2,922 5,236 5,385 4,671 2,814
R-squared 0.47 0.57 0.35 0.68 0.52 0.15 0.31 0.13 0.45 0.25
Appendix Table 5: Regressions of Generic Share of Volume on Normalized Generic Price, No. of Generic Manufacturers
and Controls
Marginal effects from OLS regressions, clustered by molecule; robust standard errors in brackets, significant at ***p<0.01, **p<0.05,