cross-media measurement-€¦ · total us 5.2 100 0.18 100 ... cambridge/nielsen 2011 media demand...
TRANSCRIPT
CROSS-MEDIA MEASUREMENT-
Where do we
go from here?

The Changing Way
People Watch
Television
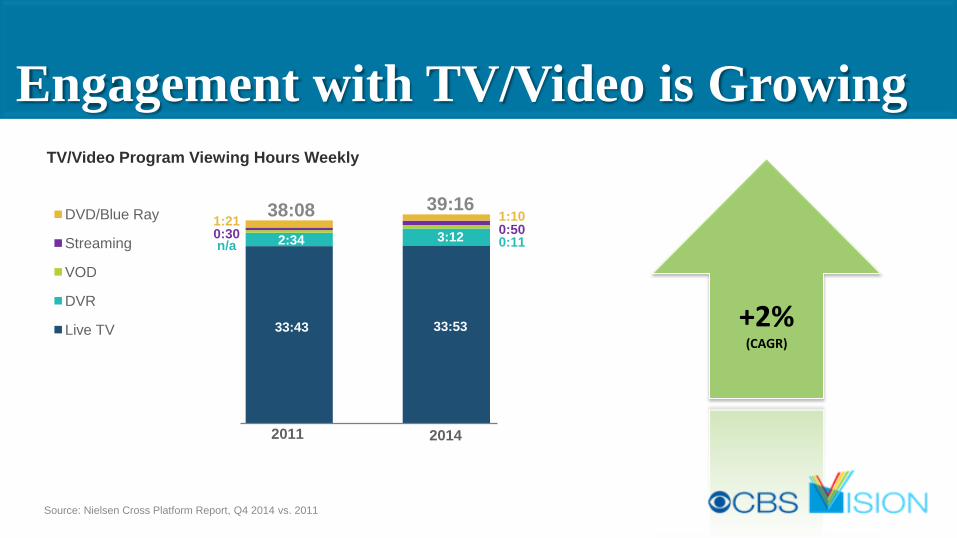
Engagement with TV/Video is Growing
+2% (CAGR)
TV/Video Program Viewing Hours Weekly
DVD/Blue Ray
Streaming
VOD
DVR
Live TV 33:53
3:12
38:08
33:43
2:34 n/a 0:30 1:21
39:16
Source: Nielsen Cross Platform Report, Q4 2014 vs. 2011
2014 2011
0:11 0:50 1:10
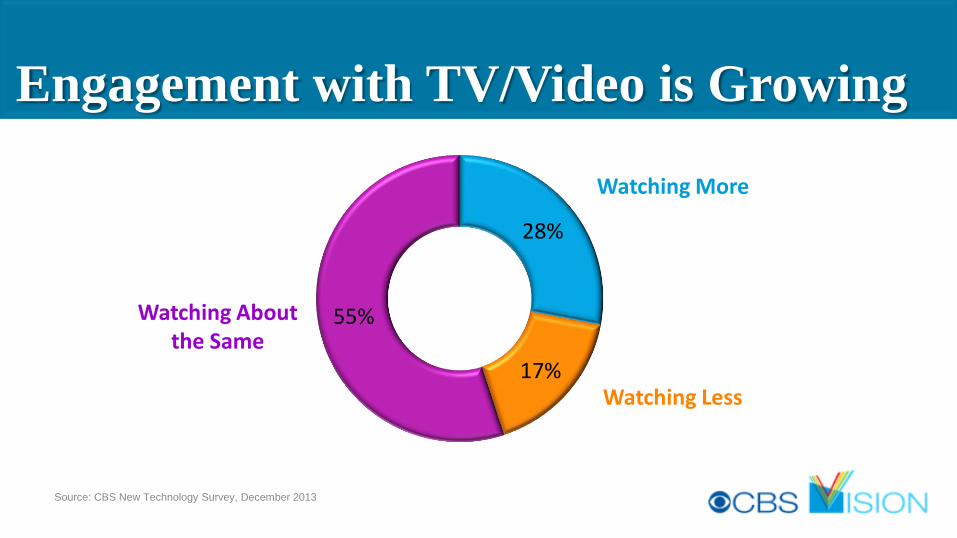
Engagement with TV/Video is Growing
Source: CBS New Technology Survey, December 2013
28%
17%
55%
Watching More
Watching Less
Watching About the Same
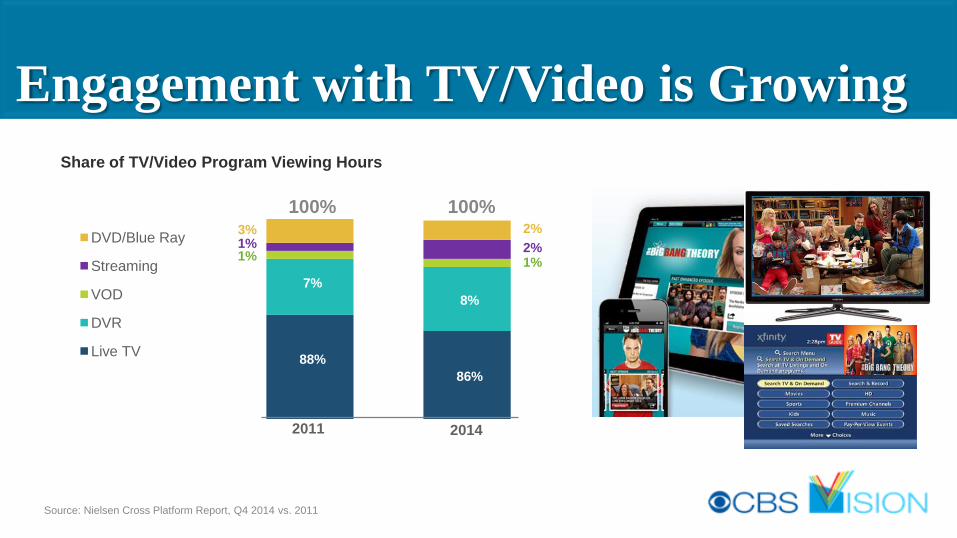
Engagement with TV/Video is Growing
30:08
2:27
31:41
1:47 DVD/Blue Ray
Streaming
VOD
DVR
Live TV
86%
100%
88%
1% 1% 3%
100%
2014 2011
1% 2%
2%
7%
8%
Share of TV/Video Program Viewing Hours
Source: Nielsen Cross Platform Report, Q4 2014 vs. 2011
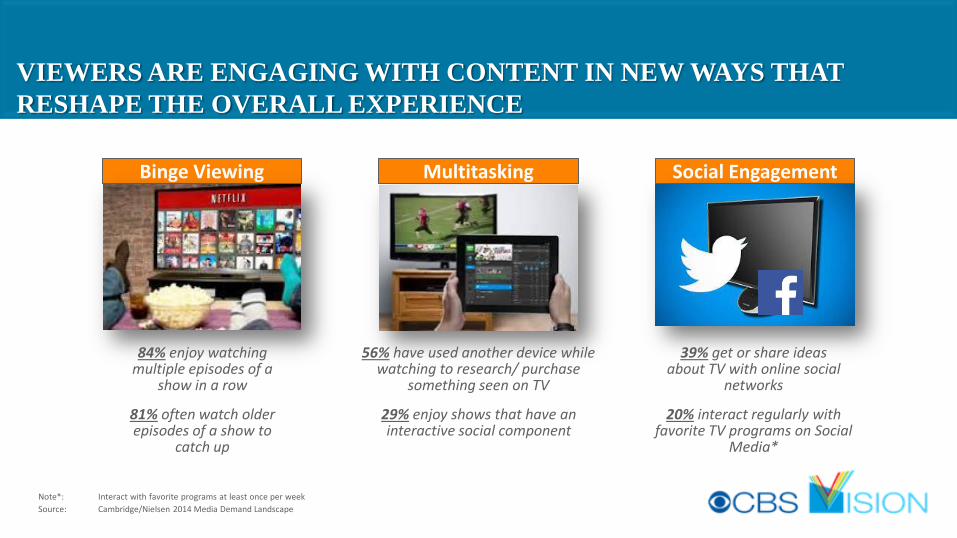
VIEWERS ARE ENGAGING WITH CONTENT IN NEW WAYS THAT
RESHAPE THE OVERALL EXPERIENCE
Note*: Interact with favorite programs at least once per week
Source: Cambridge/Nielsen 2014 Media Demand Landscape
Binge Viewing
81% often watch older episodes of a show to
catch up
84% enjoy watching multiple episodes of a
show in a row
29% enjoy shows that have an interactive social component
Multitasking
56% have used another device while watching to research/ purchase
something seen on TV
20% interact regularly with favorite TV programs on Social
Media*
Social Engagement
39% get or share ideas about TV with online social
networks
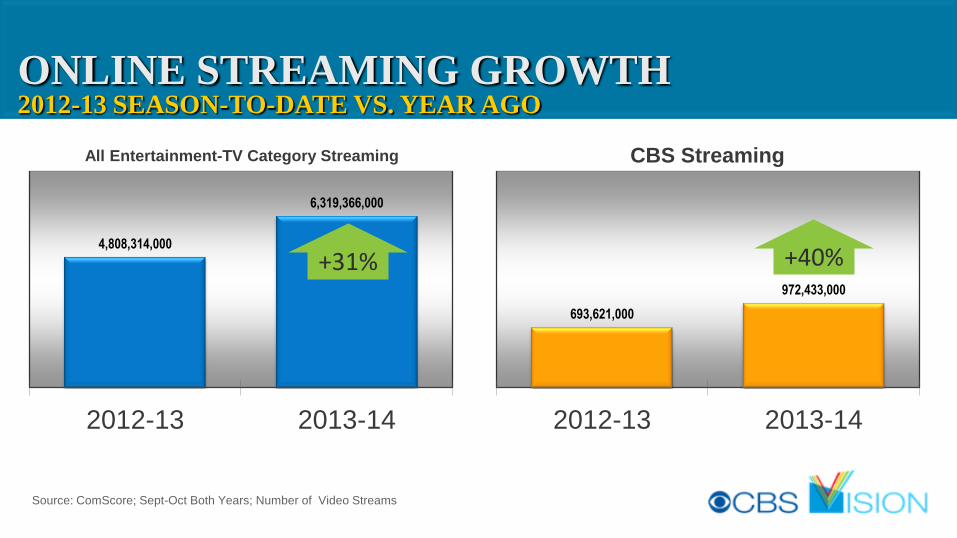
Source: ComScore; Sept-Oct Both Years; Number of Video Streams
ONLINE STREAMING GROWTH 2012-13 SEASON-TO-DATE VS. YEAR AGO
4,808,314,000
6,319,366,000
2012-13 2013-14
693,621,000
972,433,000
2012-13 2013-14
All Entertainment-TV Category Streaming CBS Streaming
+31% +40%
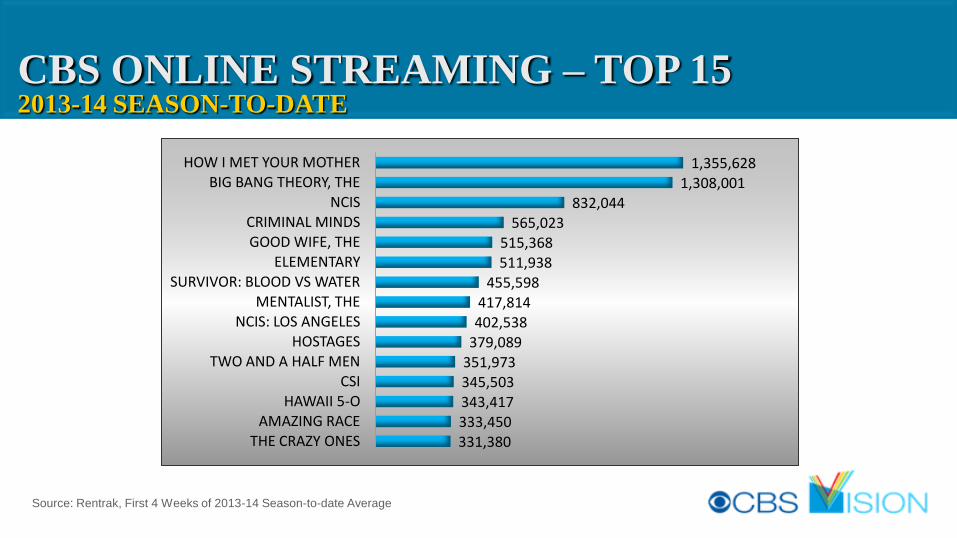
331,380 333,450 343,417 345,503 351,973 379,089 402,538 417,814
455,598 511,938 515,368
565,023 832,044
1,308,001 1,355,628
THE CRAZY ONES AMAZING RACE
HAWAII 5-O CSI
TWO AND A HALF MEN HOSTAGES
NCIS: LOS ANGELES MENTALIST, THE
SURVIVOR: BLOOD VS WATER ELEMENTARY
GOOD WIFE, THE CRIMINAL MINDS
NCIS BIG BANG THEORY, THE
HOW I MET YOUR MOTHER
CBS ONLINE STREAMING – TOP 15 2013-14 SEASON-TO-DATE
Source: Rentrak, First 4 Weeks of 2013-14 Season-to-date Average
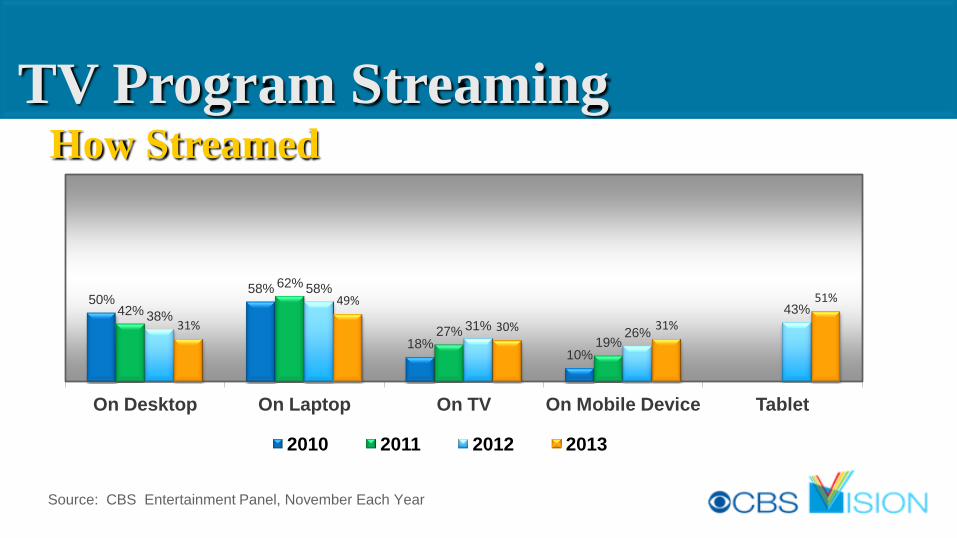
TV Program Streaming How Streamed
50% 58%
18% 10%
42%
62%
27% 19%
38%
58%
31% 26%
43%
31%
49%
30% 31%
51%
On Desktop On Laptop On TV On Mobile Device Tablet
2010 2011 2012 2013
Source: CBS Entertainment Panel, November Each Year
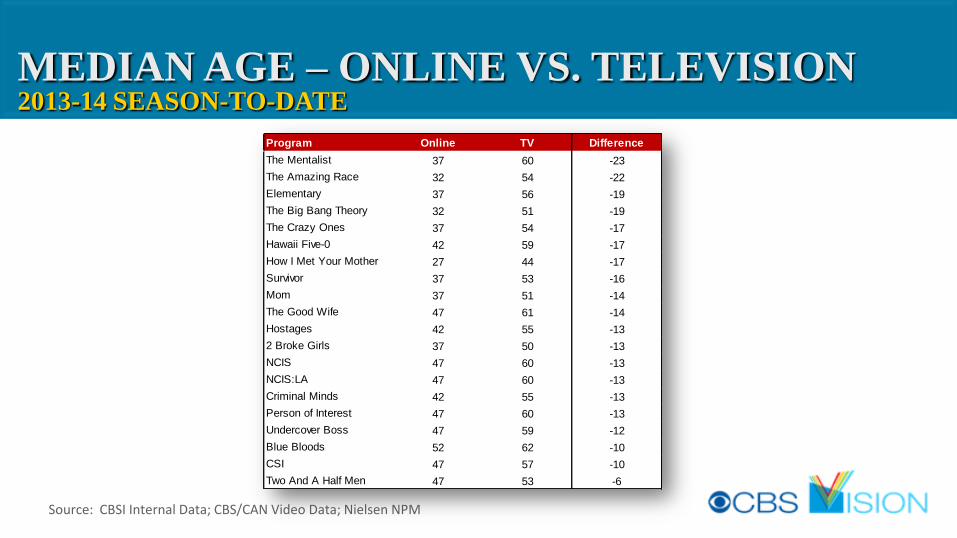
MEDIAN AGE – ONLINE VS. TELEVISION 2013-14 SEASON-TO-DATE
Source: CBSI Internal Data; CBS/CAN Video Data; Nielsen NPM
Program Online TV Difference
The Mentalist 37 60 -23
The Amazing Race 32 54 -22
Elementary 37 56 -19
The Big Bang Theory 32 51 -19
The Crazy Ones 37 54 -17
Hawaii Five-0 42 59 -17
How I Met Your Mother 27 44 -17
Survivor 37 53 -16
Mom 37 51 -14
The Good Wife 47 61 -14
Hostages 42 55 -13
2 Broke Girls 37 50 -13
NCIS 47 60 -13
NCIS:LA 47 60 -13
Criminal Minds 42 55 -13
Person of Interest 47 60 -13
Undercover Boss 47 59 -12
Blue Bloods 52 62 -10
CSI 47 57 -10
Two And A Half Men 47 53 -6
Source: Rentrak, 9/23/13-11/24/13 vs. 9/24/12-11/25/12; Time Spent in Minutes
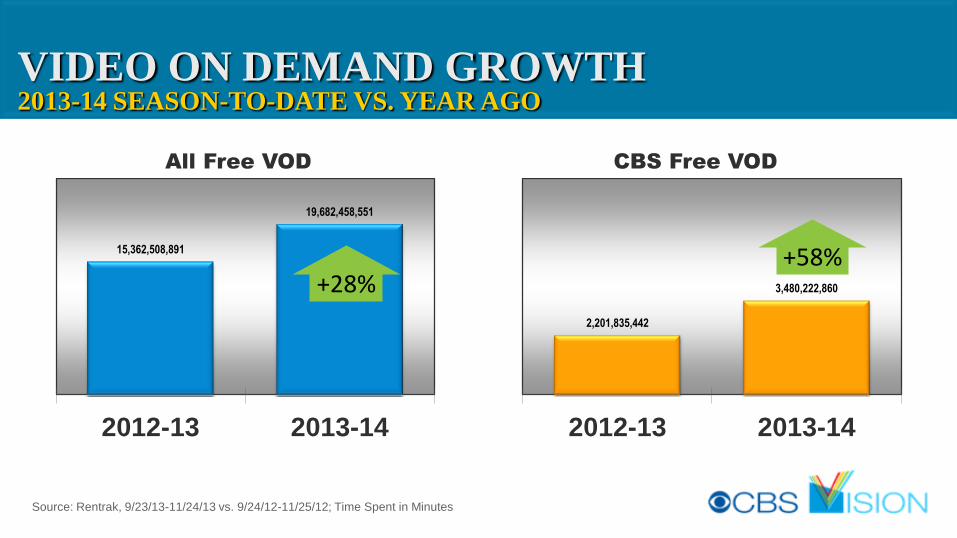
VIDEO ON DEMAND GROWTH 2013-14 SEASON-TO-DATE VS. YEAR AGO
15,362,508,891
19,682,458,551
2012-13 2013-14
2,201,835,442
3,480,222,860
2012-13 2013-14
All Free VOD CBS Free VOD
+58% +28%
Source: CBSi Data Warehouse, 2013-14 Season-to-date Average
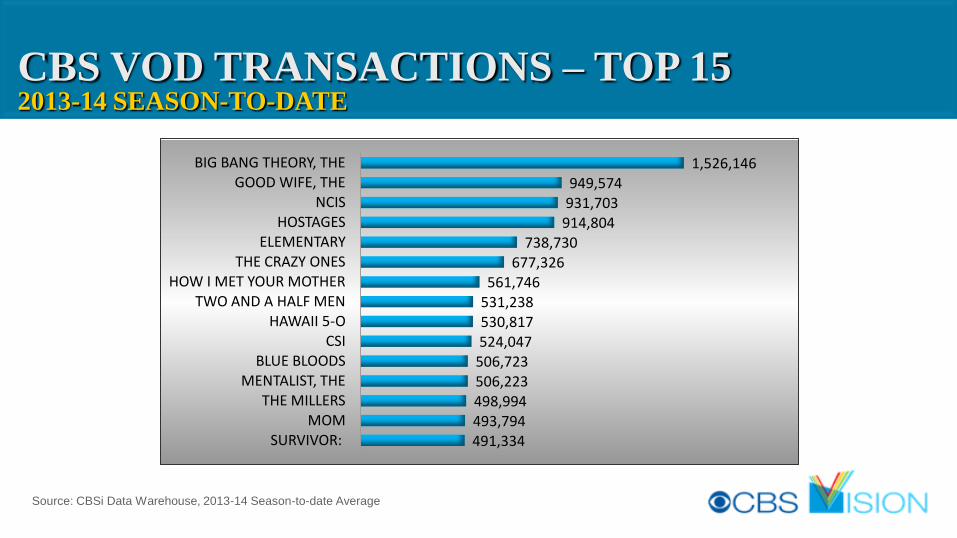
CBS VOD TRANSACTIONS – TOP 15 2013-14 SEASON-TO-DATE
491,334 493,794 498,994 506,223 506,723 524,047 530,817 531,238 561,746
677,326 738,730
914,804 931,703 949,574
1,526,146
SURVIVOR: MOM
THE MILLERS MENTALIST, THE
BLUE BLOODS CSI
HAWAII 5-O TWO AND A HALF MEN
HOW I MET YOUR MOTHER THE CRAZY ONES
ELEMENTARY HOSTAGES
NCIS GOOD WIFE, THE
BIG BANG THEORY, THE
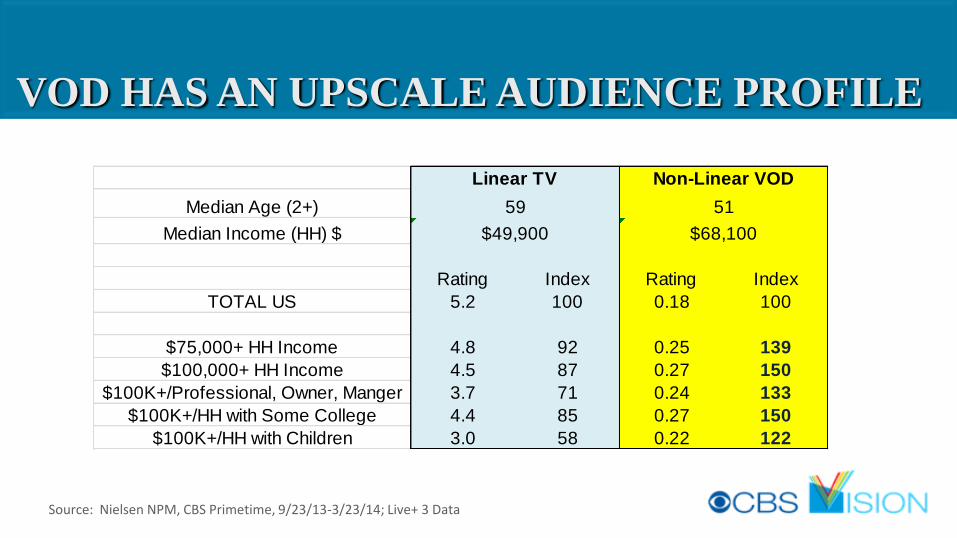
VOD HAS AN UPSCALE AUDIENCE PROFILE
Median Age (2+)
Median Income (HH) $
Rating Index Rating Index
TOTAL US 5.2 100 0.18 100
$75,000+ HH Income 4.8 92 0.25 139
$100,000+ HH Income 4.5 87 0.27 150
$100K+/Professional, Owner, Manger 3.7 71 0.24 133
$100K+/HH with Some College 4.4 85 0.27 150
$100K+/HH with Children 3.0 58 0.22 122
$49,900
59 51
Linear TV Non-Linear VOD
$68,100
Source: Nielsen NPM, CBS Primetime, 9/23/13-3/23/14; Live+ 3 Data
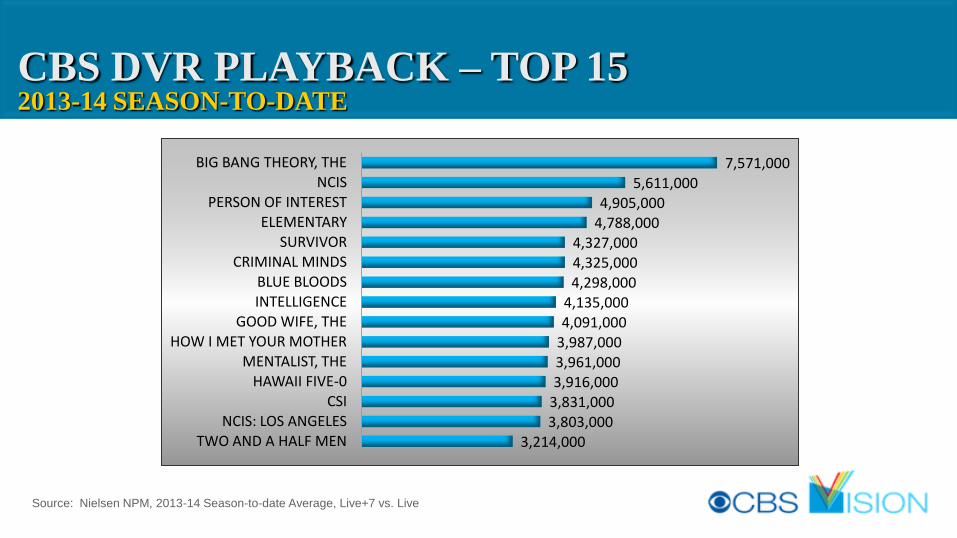
3,214,000 3,803,000 3,831,000 3,916,000 3,961,000 3,987,000 4,091,000 4,135,000
4,298,000 4,325,000 4,327,000
4,788,000 4,905,000
5,611,000 7,571,000
TWO AND A HALF MEN NCIS: LOS ANGELES
CSI HAWAII FIVE-0
MENTALIST, THE HOW I MET YOUR MOTHER
GOOD WIFE, THE INTELLIGENCE BLUE BLOODS
CRIMINAL MINDS SURVIVOR
ELEMENTARY PERSON OF INTEREST
NCIS BIG BANG THEORY, THE
CBS DVR PLAYBACK – TOP 15 2013-14 SEASON-TO-DATE
Source: Nielsen NPM, 2013-14 Season-to-date Average, Live+7 vs. Live
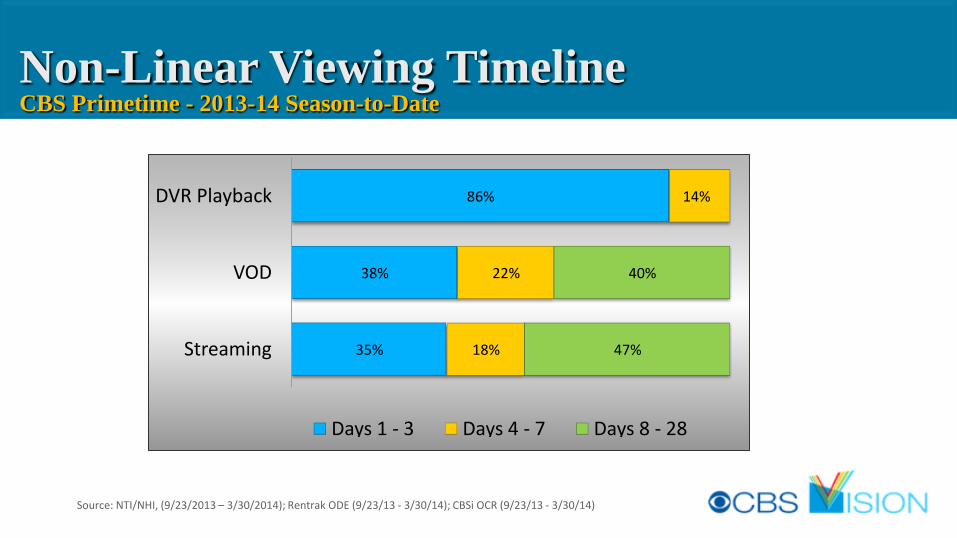
35%
38%
86%
18%
22%
14%
47%
40%
Streaming
VOD
DVR Playback
Days 1 - 3 Days 4 - 7 Days 8 - 28
Non-Linear Viewing Timeline CBS Primetime - 2013-14 Season-to-Date
Source: NTI/NHI, (9/23/2013 – 3/30/2014); Rentrak ODE (9/23/13 - 3/30/14); CBSi OCR (9/23/13 - 3/30/14)
OnDemandCommercialRatings
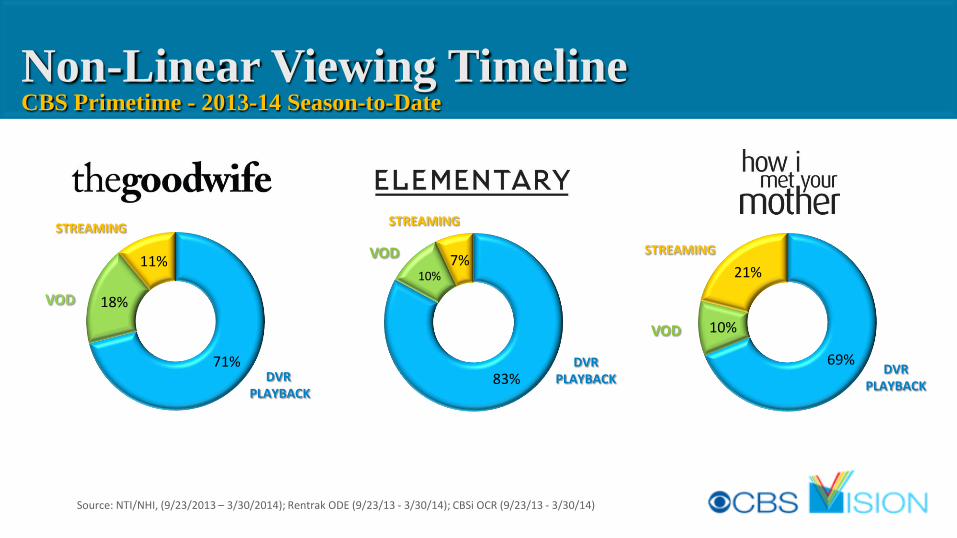
Non-Linear Viewing Timeline CBS Primetime - 2013-14 Season-to-Date
Source: NTI/NHI, (9/23/2013 – 3/30/2014); Rentrak ODE (9/23/13 - 3/30/14); CBSi OCR (9/23/13 - 3/30/14)
71%
18%
11%
VOD
STREAMING
DVR PLAYBACK
83%
10% 7% VOD
STREAMING
DVR PLAYBACK
69%
10%
21%
VOD
STREAMING
DVR PLAYBACK

MEDIA DEMAND LANDSCAPE 2014
INSIGHTS AND OPPORTUNITIES
Nee
d S
tate
s
Demand Segments
Thrill of the Game
Action & Suspense
Friends & Family
Authentic & Inspirational
Lighthearted Fun
Convenient Catch-Up
Stimulate & Explore
Relax & Unwind
Keep Me Informed
Media Trendsetters
TV Traditionalists
Engaged Streamers
Program Passionates
TV Sports Fans TV Moderators Digital
Selectives
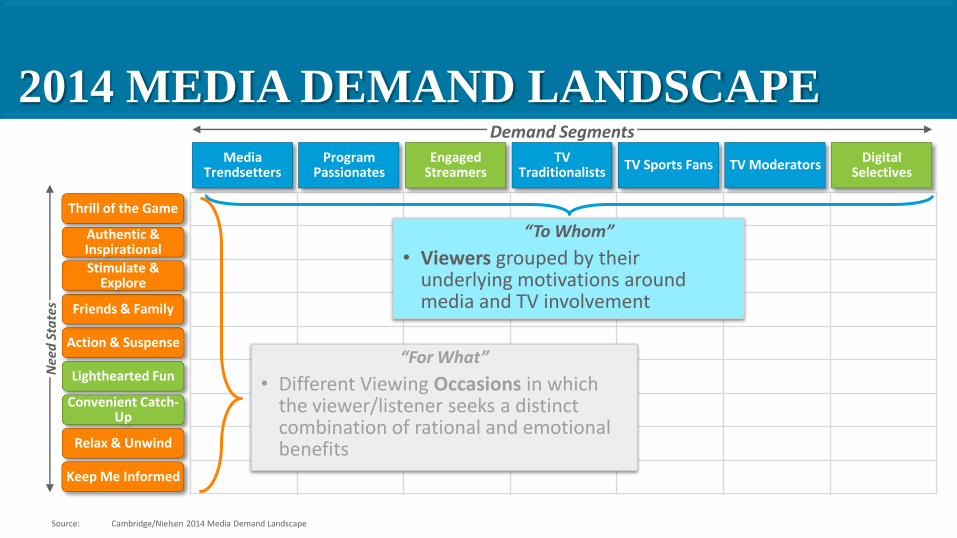
2014 MEDIA DEMAND LANDSCAPE
Source: Cambridge/Nielsen 2014 Media Demand Landscape
“To Whom”
• Viewers grouped by their underlying motivations around media and TV involvement
“For What”
• Different Viewing Occasions in which the viewer/listener seeks a distinct combination of rational and emotional benefits
Source: Cambridge/Nielsen 2011 Media Demand Landscape; Nielsen Fusion
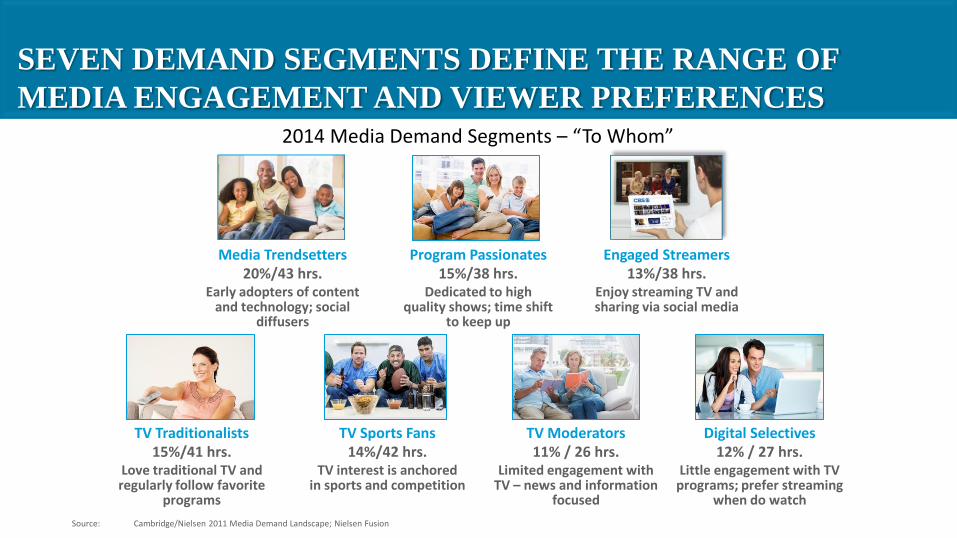
Media Trendsetters 20%/43 hrs.
Early adopters of content and technology; social
diffusers
Program Passionates 15%/38 hrs.
Dedicated to high quality shows; time shift
to keep up
Engaged Streamers 13%/38 hrs.
Enjoy streaming TV and sharing via social media
TV Traditionalists 15%/41 hrs.
Love traditional TV and regularly follow favorite
programs
TV Sports Fans 14%/42 hrs.
TV interest is anchored in sports and competition
TV Moderators 11% / 26 hrs.
Limited engagement with TV – news and information
focused
Digital Selectives 12% / 27 hrs.
Little engagement with TV programs; prefer streaming
when do watch
SEVEN DEMAND SEGMENTS DEFINE THE RANGE OF
MEDIA ENGAGEMENT AND VIEWER PREFERENCES 2014 Media Demand Segments – “To Whom”
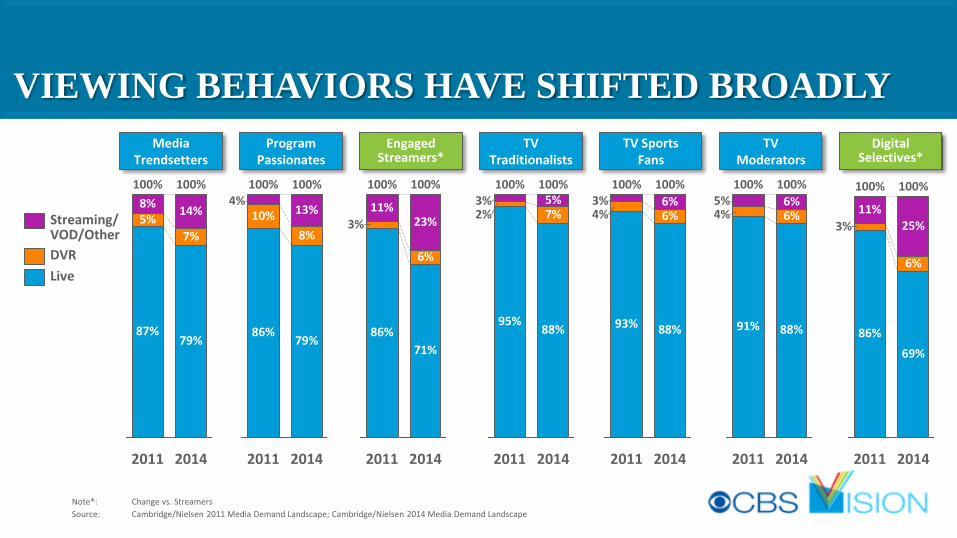
VIEWING BEHAVIORS HAVE SHIFTED BROADLY
Note*: Change vs. Streamers
Source: Cambridge/Nielsen 2011 Media Demand Landscape; Cambridge/Nielsen 2014 Media Demand Landscape
2014
100%
79%
7%
14%
2011
100%
87%
5% 8%
TV Traditionalists
TV Sports Fans
Program Passionates
Media Trendsetters
Engaged Streamers*
TV Moderators
Digital Selectives*
2014
100%
79%
8%
13%
2011
100%
86%
10% 4%
2014
100%
71%
6%
23%
2011
100%
86%
3%
11%
100%
88%
7% 5%
2011
100%
95%
2% 3%
2014 2014
100%
88%
6% 6%
2011
100%
93%
4% 3%
2014
100%
88%
6% 6%
2011
100%
91%
4% 5%
11%
2014
100%
69%
6%
25%
2011
100%
86%
3%
Live
DVR
Streaming/ VOD/Other
The Advertiser
Perspective
From Wikipedia, the free encyclopedia: In digital marketing, programmatic marketing campaigns are automatically triggered by any type of event and deployed according to a set of rules applied by software and algorithms. Human skills are still needed in programmatic campaigns as the campaigns and rules are planned beforehand and established by marketers
PROGRAMMATIC MARKETING
REAL-TIME BIDDING From Wikipedia, the free encyclopedia: Jump to: navigation, search Real-time bidding (RTB) refers to the means by which ad inventory is bought and sold on a per-impression basis, via programmatic instantaneous auction, similar to financial markets.[1] With real-time bidding, advertising buyers bid on an impression and, if the bid is won, the buyer’s ad is instantly displayed on the publisher’s site.[2] Real-time bidding lets advertisers manage and optimize ads from multiple ad-networks by granting the user access to a multitude of different networks, allowing them to create and launch advertising campaigns, prioritize networks and allocate backfill
percentages[clarify].[3]
HARNESSING THE FULL POWER OF TELEVISION ADVERTISING
• Re-tool Marketing and Media Mix Models
• Measure Long term Advertising Effects
• Improve targeting
• Measure the Message
• Dynamic ROI Tracking
• Pre-testing
• Adaptive Models
CBS LOCAL CROSS-MEDIA MEASUREMENT
PROOF OF CONCEPT:
INITIAL FINDINGS
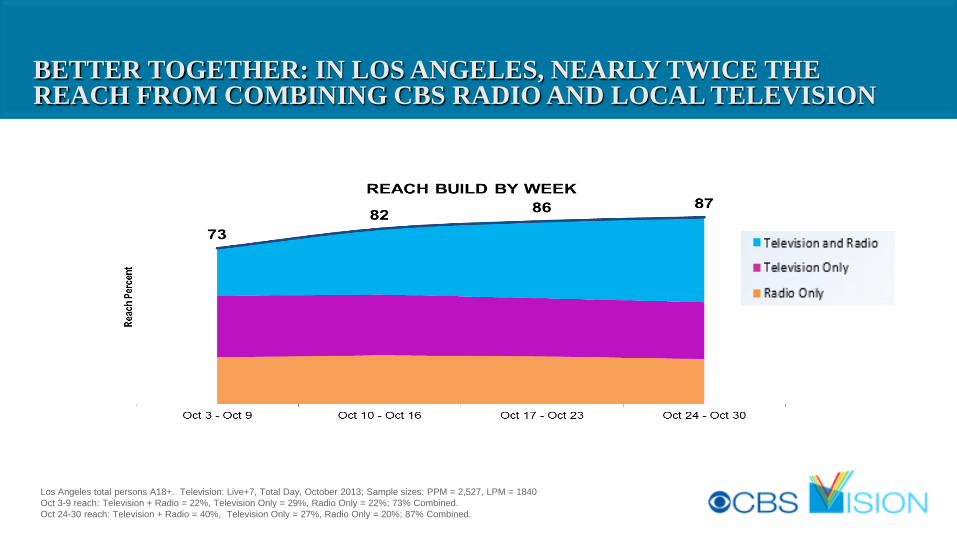
BETTER TOGETHER: IN LOS ANGELES, NEARLY TWICE THE REACH FROM COMBINING CBS RADIO AND LOCAL TELEVISION
Los Angeles total persons A18+. Television: Live+7, Total Day, October 2013; Sample sizes: PPM = 2,527, LPM = 1840
Oct 3-9 reach: Television + Radio = 22%, Television Only = 29%, Radio Only = 22%; 73% Combined.
Oct 24-30 reach: Television + Radio = 40%, Television Only = 27%, Radio Only = 20%; 87% Combined.
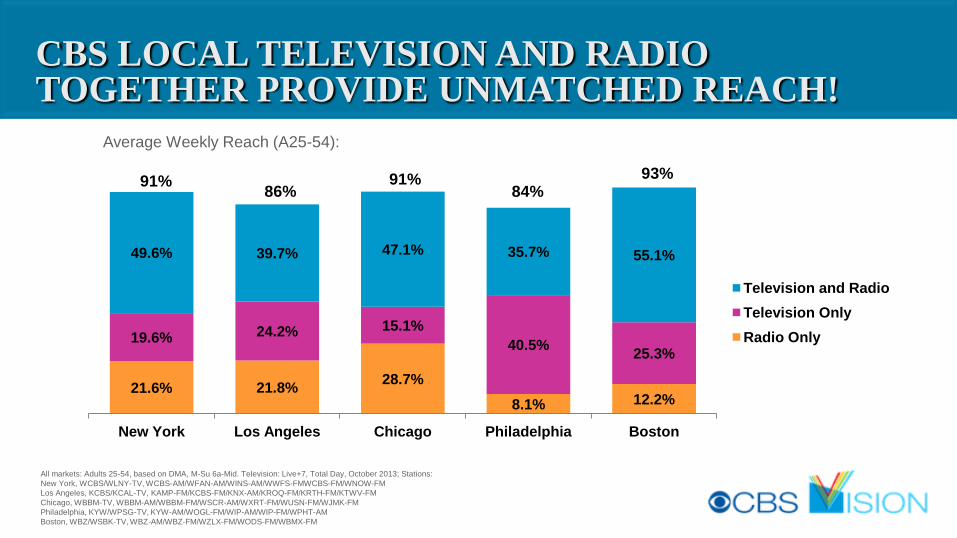
CBS LOCAL TELEVISION AND RADIO TOGETHER PROVIDE UNMATCHED REACH!
All markets: Adults 25-54, based on DMA, M-Su 6a-Mid. Television: Live+7, Total Day, October 2013; Stations:
New York, WCBS/WLNY-TV, WCBS-AM/WFAN-AM/WINS-AM/WWFS-FMWCBS-FM/WNOW-FM
Los Angeles, KCBS/KCAL-TV, KAMP-FM/KCBS-FM/KNX-AM/KROQ-FM/KRTH-FM/KTWV-FM
Chicago, WBBM-TV, WBBM-AM/WBBM-FM/WSCR-AM/WXRT-FM/WUSN-FM/WJMK-FM
Philadelphia, KYW/WPSG-TV, KYW-AM/WOGL-FM/WIP-AM/WIP-FM/WPHT-AM
Boston, WBZ/WSBK-TV, WBZ-AM/WBZ-FM/WZLX-FM/WODS-FM/WBMX-FM
21.6% 21.8% 28.7%
8.1% 12.2%
19.6% 24.2% 15.1%
40.5% 25.3%
49.6% 39.7% 47.1% 35.7% 55.1%
New York Los Angeles Chicago Philadelphia Boston
Television and Radio
Television Only
Radio Only
91% 86%
91% 84%
93%
Average Weekly Reach (A25-54):
CROSS-MEDIA MEASUREMENT-
Where do we
go from here?
THANK YOU