cross curricular methodology maths and...
TRANSCRIPT

Bridge of Weir Primary School
Gryffe High School
Houston Primary School
Cross Curricular
Methodology
Maths and Numeracy
Contents
Place Value
Addition
Subtraction
Multiplication
Division
Time
Scientific Notation
Ratio
Percentages
Equations and Formulae
Statistical Graphs
S1 and S2 Maths Course Summary

Introduction This is the 2nd Edition of the Numeracy and Maths methodology document. The aim of this document is to promote the use of common methodologies in numeracy and mathematics across the school in order to improve the educational experience of pupils. Bridge of Weir and Houston Primaries have also been aware of the Maths Department’s methodologies in certain topics for a number of years and have been involved in ongoing discussions and development so that this document reflects joint Primary and High school approaches and methodologies. It is hoped that this awareness raising will result in all teachers adopting the same approaches thus improving consistency of teaching across the curriculum. The document also attempts to raise awareness as to when certain topics are covered by the Maths department, as it may well be the case that it is not the Maths department that introduces a particular topic for the first time in High School. Hopefully this document will help you, or at least encourage you to consult with the Maths Department. The process is intended to be a collegiate one and your comments, contributions and questions are always welcome.
Place Value
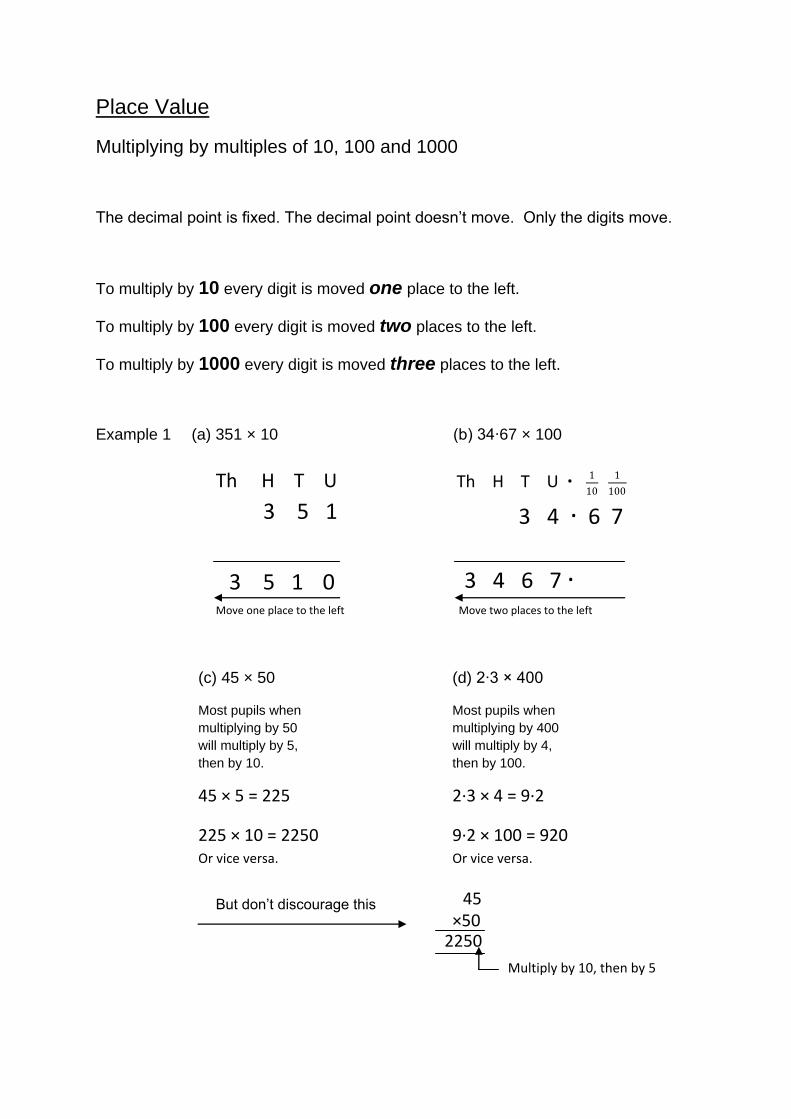
Multiplying by multiples of 10, 100 and 1000
The decimal point is fixed. The decimal point doesn’t move. Only the digits move.
To multiply by 10 every digit is moved one place to the left.
To multiply by 100 every digit is moved two places to the left.
To multiply by 1000 every digit is moved three places to the left.
Example 1 (a) 351 × 10 (b) 34∙67 × 100
Th H T U ∙ 1
10
1
100
1
100
3 4 6 7 ∙
Th H T U
3 5 1 0 Move one place to the left Move two places to the left
3 4 ∙ 6 7
7
3 5 1
(c) 45 × 50
Most pupils when
multiplying by 50
will multiply by 5,
then by 10.
(d) 2∙3 × 400
Most pupils when
multiplying by 400
will multiply by 4,
then by 100.
45 × 5 = 225
225 × 10 = 2250
2∙3 × 4 = 9∙2
9∙2 × 100 = 920
But don’t discourage this
45 ×50
2250
Multiply by 10, then by 5
Or vice versa. Or vice versa.

Dividing by multiples of 10, 100 and 1000
To divide by 10 every digit is moved one place to the right.
To divide by 100 every digit is moved two places to the right.
To divide by 1000 every digit is moved three places to the right
Example 1 (a) 351 ÷ 10 (b) 34∙67 ÷ 100
Some pupils have great difficulty grasping the process of moving digits and find it
easier to “move the decimal point”.
It was agreed (Primary and High school) that teachers should use their professional
judgement as to when the “moving point” should be resorted to.
Th H T U ∙ 1
10
1
100
Th H T U ∙ 1
10
1
100
1
1000
1
10000
3 5 1
3 4 ∙ 6 7
7 0 ∙ 3 4 6 7 3 5 ∙ 1
Move one place to the right Move two places to the right
(c) 45 ÷ 50
Most pupils when
dividing by 50 will
divide by 5, and
then by 10.
45 ÷ 5 = 9
9 ÷ 10 = 0∙9
Or vice versa.
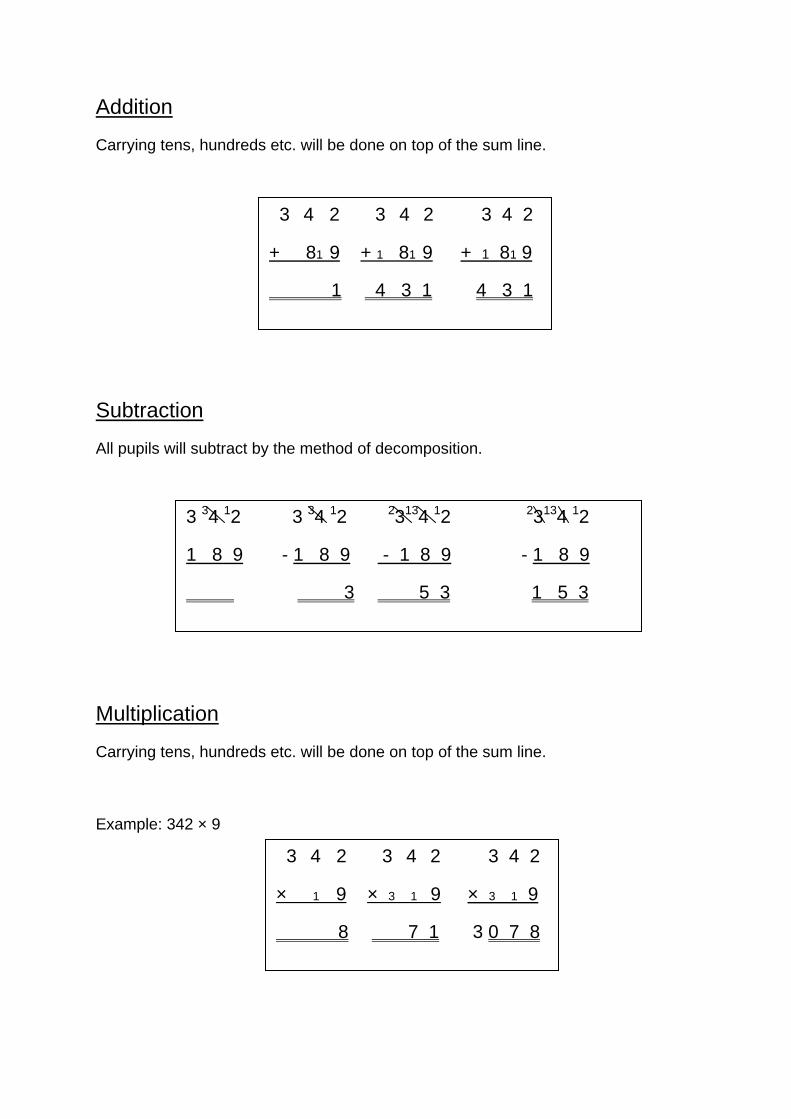
Addition
Carrying tens, hundreds etc. will be done on top of the sum line.
Subtraction
All pupils will subtract by the method of decomposition.
Multiplication
Carrying tens, hundreds etc. will be done on top of the sum line.
Example: 342 × 9
3 4 2 3 4 2 3 4 2
+ 81 9 + 1 81 9 + 1 81 9
1 4 3 1 4 3 1
3 4 2 3 4 2 3 4 2
× 1 9 × 3 1 9 × 3 1 9
8 7 1 3 0 7 8
3 34 12 3 34 12 23134 12 23134 12
1 8 9 - 1 8 9 - 1 8 9 - 1 8 9
3 5 3 1 5 3

Division
Example: 342 ÷ 4
Time
12 hour clock times should be written with am/pm and dot between hours and
minutes e.g.
3.12am 10.15am 7.35pm
24 hour clock times should be written with four numbers with space between hours
and minutes e.g.
03 12 10 15 19 35
Calculation of time duration
Use horizontal line broken into stages of time. Stages are broken into minutes
and/or hours depending on duration.
In Gryffe we encourage to go to the next hour, then hours, then remaining minutes:
09 15 10 00 15 00 15 34
45min + 5 hrs + 34mins = 5hrs79mins = 6hrs19mins
But pupils can decide on stages e.g.
09 15 09 30 10 00 15 00 15 34
15min + 30min + 5hrs + 34mins = 5hrs79mins = 6hrs19mins
Maths Timeline: S1 March/April and S2 March/April. Also S3.
4 3 34 22 ∙ 20
8 5 ∙ 5
4 3 34 22
8
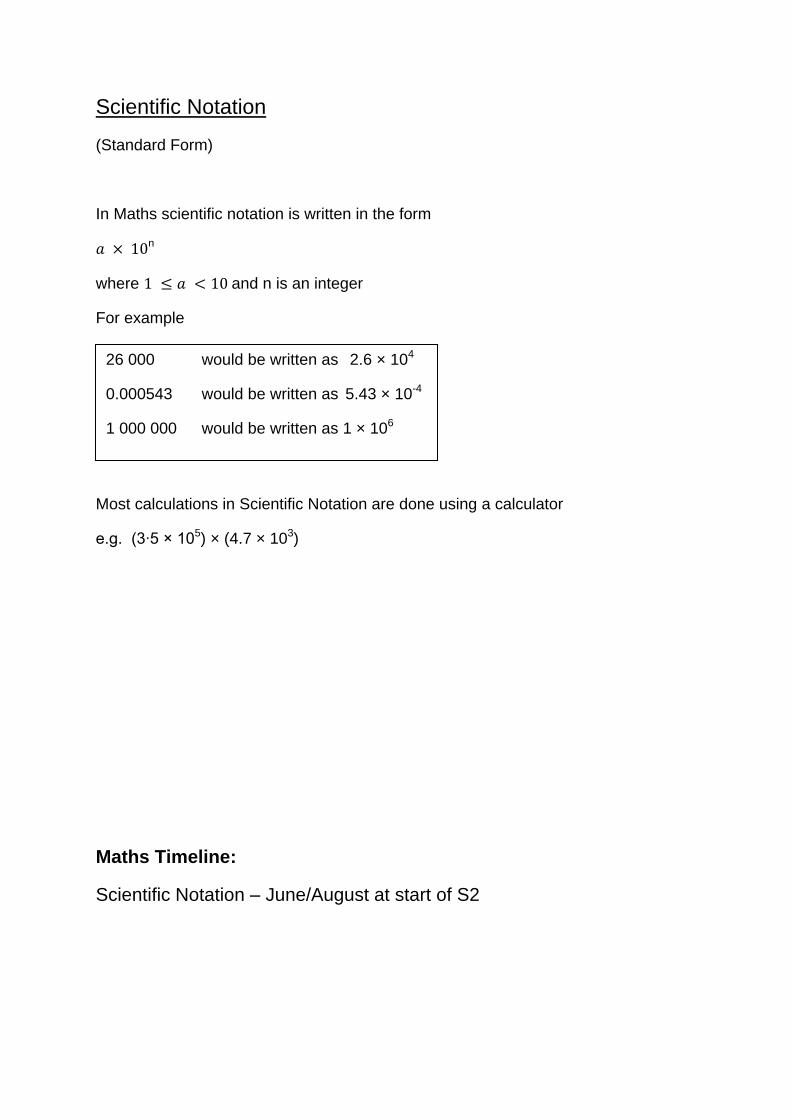
Scientific Notation
(Standard Form)
In Maths scientific notation is written in the form
𝑎 × 10n
where 1 ≤ 𝑎 < 10 and n is an integer
For example
Most calculations in Scientific Notation are done using a calculator
e.g. (3∙5 × 105) × (4.7 × 103)
Maths Timeline:
Scientific Notation – June/August at start of S2
26 000 would be written as 2.6 × 10⁴
0.000543 would be written as 5.43 × 10⁻⁴
1 000 000 would be written as 1 × 10⁶
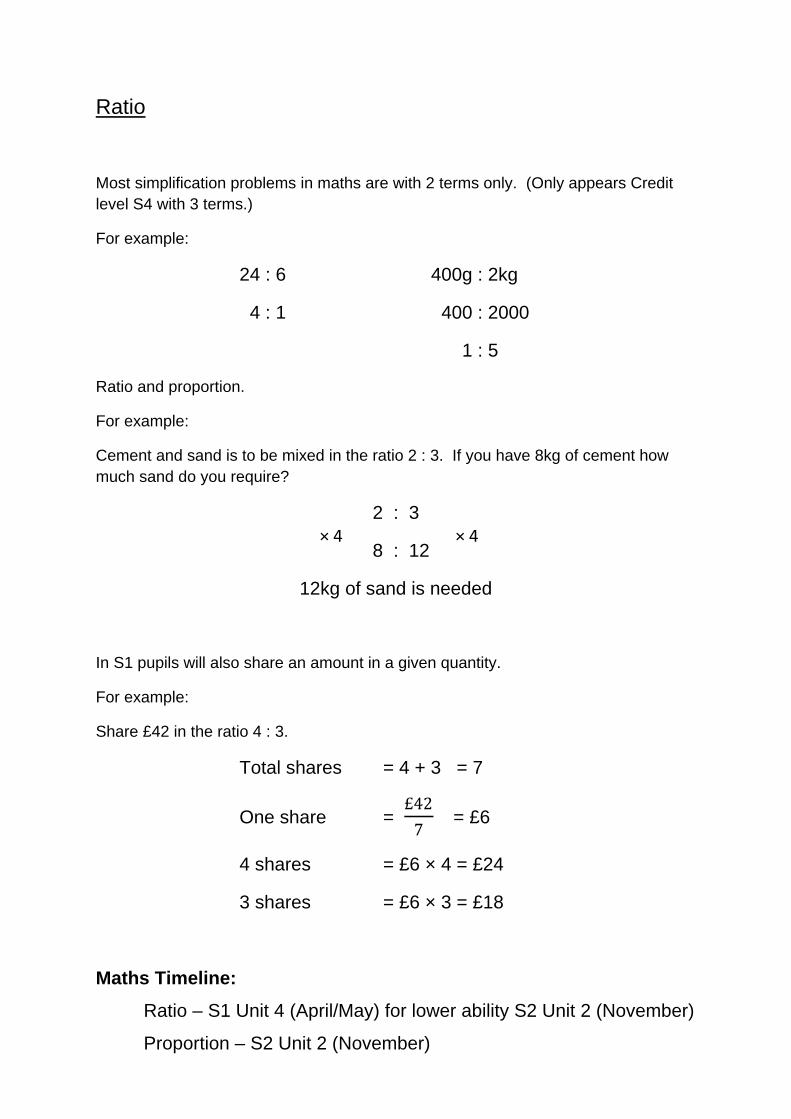
Ratio
Most simplification problems in maths are with 2 terms only. (Only appears Credit
level S4 with 3 terms.)
For example:
24 : 6 400g : 2kg
4 : 1 400 : 2000
1 : 5
Ratio and proportion.
For example:
Cement and sand is to be mixed in the ratio 2 : 3. If you have 8kg of cement how
much sand do you require?
2 : 3
8 : 12
12kg of sand is needed
In S1 pupils will also share an amount in a given quantity.
For example:
Share £42 in the ratio 4 : 3.
Total shares = 4 + 3 = 7
One share = £42
7 = £6
4 shares = £6 × 4 = £24
3 shares = £6 × 3 = £18
Maths Timeline:
Ratio – S1 Unit 4 (April/May) for lower ability S2 Unit 2 (November)
Proportion – S2 Unit 2 (November)
× 4 × 4
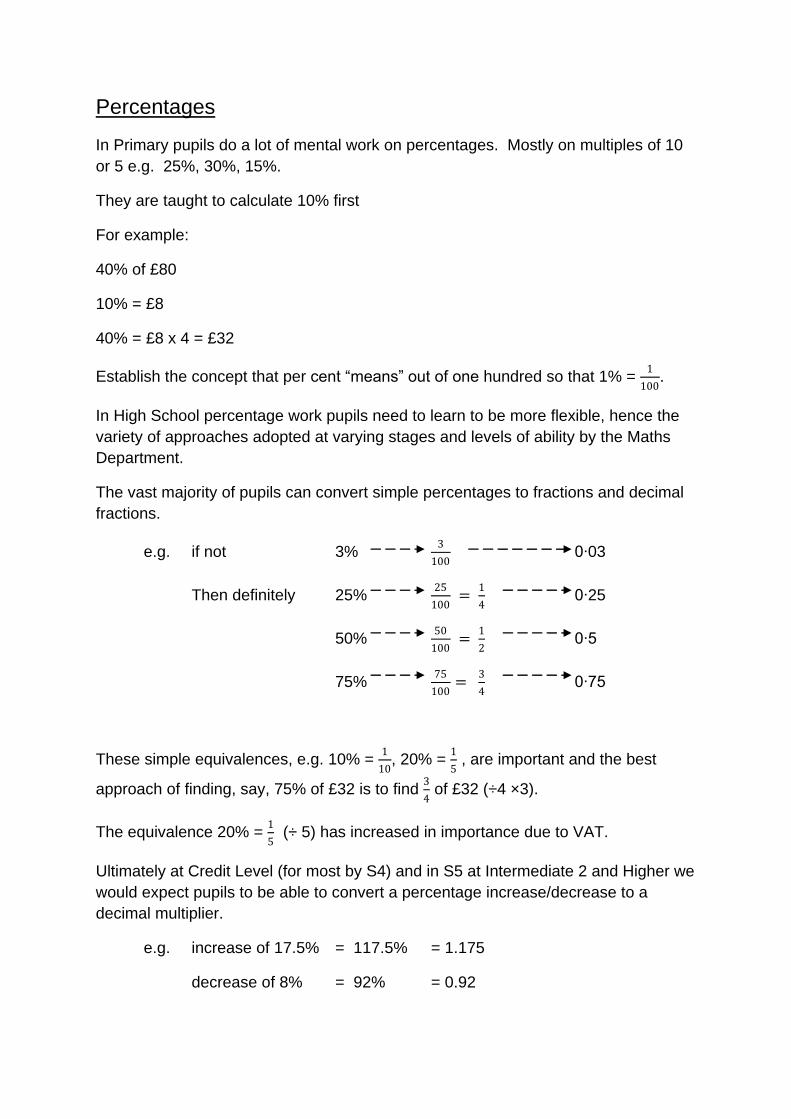
Percentages
In Primary pupils do a lot of mental work on percentages. Mostly on multiples of 10
or 5 e.g. 25%, 30%, 15%.
They are taught to calculate 10% first
For example:
40% of £80
10% = £8
40% = £8 x 4 = £32
Establish the concept that per cent “means” out of one hundred so that 1% = 1
100.
In High School percentage work pupils need to learn to be more flexible, hence the
variety of approaches adopted at varying stages and levels of ability by the Maths
Department.
The vast majority of pupils can convert simple percentages to fractions and decimal
fractions.
e.g. if not 3% 3
100 0∙03
Then definitely 25% 25
100 =
1
4 0∙25
50% 50
100 =
1
2 0∙5
75% 75
100=
3
4 0∙75
These simple equivalences, e.g. 10% = 1
10, 20% =
1
5 , are important and the best
approach of finding, say, 75% of £32 is to find 3
4 of £32 (÷4 ×3).
The equivalence 20% = 1
5 (÷ 5) has increased in importance due to VAT.
Ultimately at Credit Level (for most by S4) and in S5 at Intermediate 2 and Higher we
would expect pupils to be able to convert a percentage increase/decrease to a
decimal multiplier.
e.g. increase of 17.5% = 117.5% = 1.175
decrease of 8% = 92% = 0.92
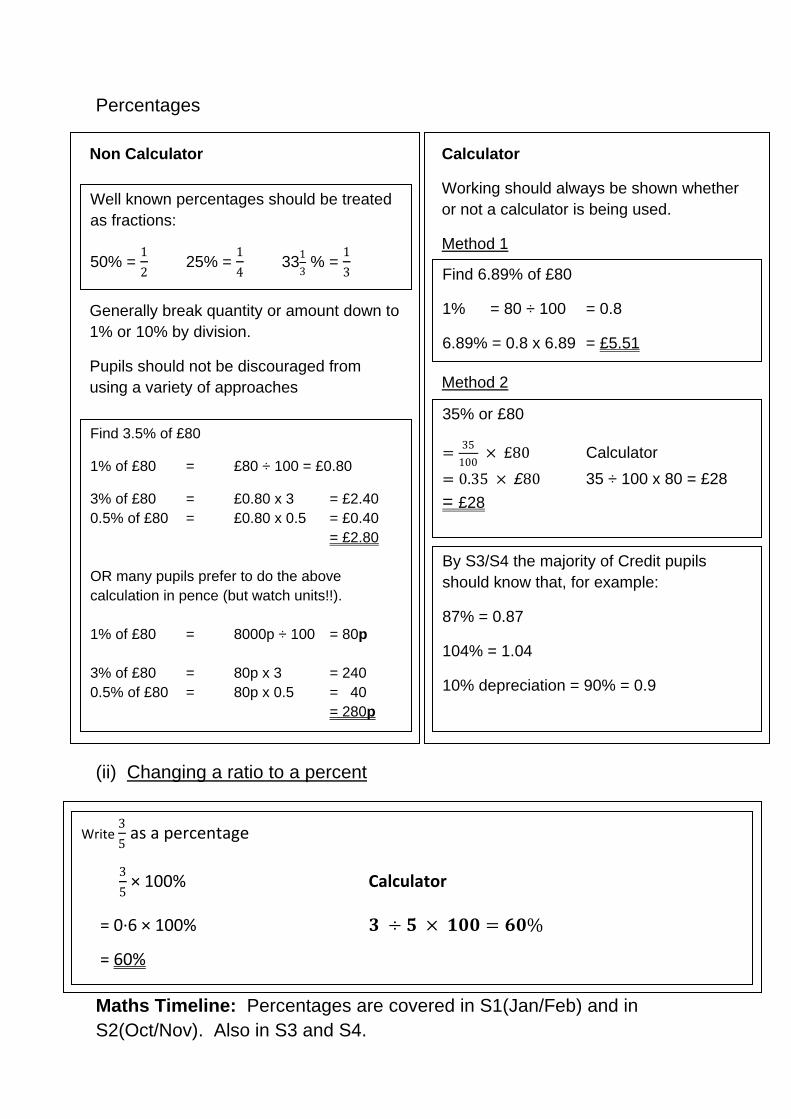
Percentages
(ii) Changing a ratio to a percent
Percentages as a topic is covered in S1 and S2 Maths after pupils have
Maths Timeline: Percentages are covered in S1(Jan/Feb) and in
S2(Oct/Nov). Also in S3 and S4.
Well known percentages should be treated
as fractions:
50% = 1
2 25% =
1
4 33
1
3 % =
1
3
Type equation here. etc
Non Calculator
Generally break quantity or amount down to
1% or 10% by division.
Pupils should not be discouraged from
using a variety of approaches
Find 3.5% of £80
1% of £80 = £80 ÷ 100 = £0.80
3% of £80 = £0.80 x 3 = £2.40
0.5% of £80 = £0.80 x 0.5 = £0.40
= £2.80
OR many pupils prefer to do the above
calculation in pence (but watch units!!).
1% of £80 = 8000p ÷ 100 = 80p
3% of £80 = 80p x 3 = 240
0.5% of £80 = 80p x 0.5 = 40
= 280p
Calculator
Working should always be shown whether
or not a calculator is being used.
Method 1
Find 6.89% of £80
1% = 80 ÷ 100 = 0.8
6.89% = 0.8 x 6.89 = £5.51
Method 2
35% or £80
=35
100 × £80 Calculator
= 0.35 × £80 35 ÷ 100 x 80 = £28
= £28
By S3/S4 the majority of Credit pupils
should know that, for example:
87% = 0.87
104% = 1.04
10% depreciation = 90% = 0.9
Write
3
5 as a percentage
3
5 × 100% Calculator
= 0∙6 × 100% 𝟑 ÷ 𝟓 × 𝟏𝟎𝟎 = 𝟔𝟎%
= 60%

Equations and Formulae
In the Maths Department in Gryffe High school we use the “balancing”
approach to solve equations as described on the subsequent pages.
This approach extends to use in all areas. For example, with
Pythagoras (as shown), Trigonometry, and in changing the subject of a
formula ) (also shown).
Setting out of solutions is important. Work should be clear.
Formula
Substitution
Answer with units
The equal symbols should be in a vertical line, one below the other.
=
=
=
Maths Timeline:
Equations - October/November S1
- June/October/November S2 and continuously thereafter.

Equations
Equations are solved by the balancing approach
Example 1
2x + 1 = 5 -1 -1
Subtract 1 from both sides
2x = 4
2x = 4 Divide both sides by 2 2 2
x = 2
Example 2 2x - 1 = 5 +1 +1
Add 1 to both sides
2x = 6
2x = 6 Divide both sides by 2
2 2
x = 3 Example 3 Equations with fractions
1
3 x = 7
3 x 1
3 x = 7 x 3 “Remove” fraction by multiplying
both sides by denominator
x = 21
Note that the = signs form a vertical line to clearly delineate the Left
Hand Side and Right Hand Side of the equation.
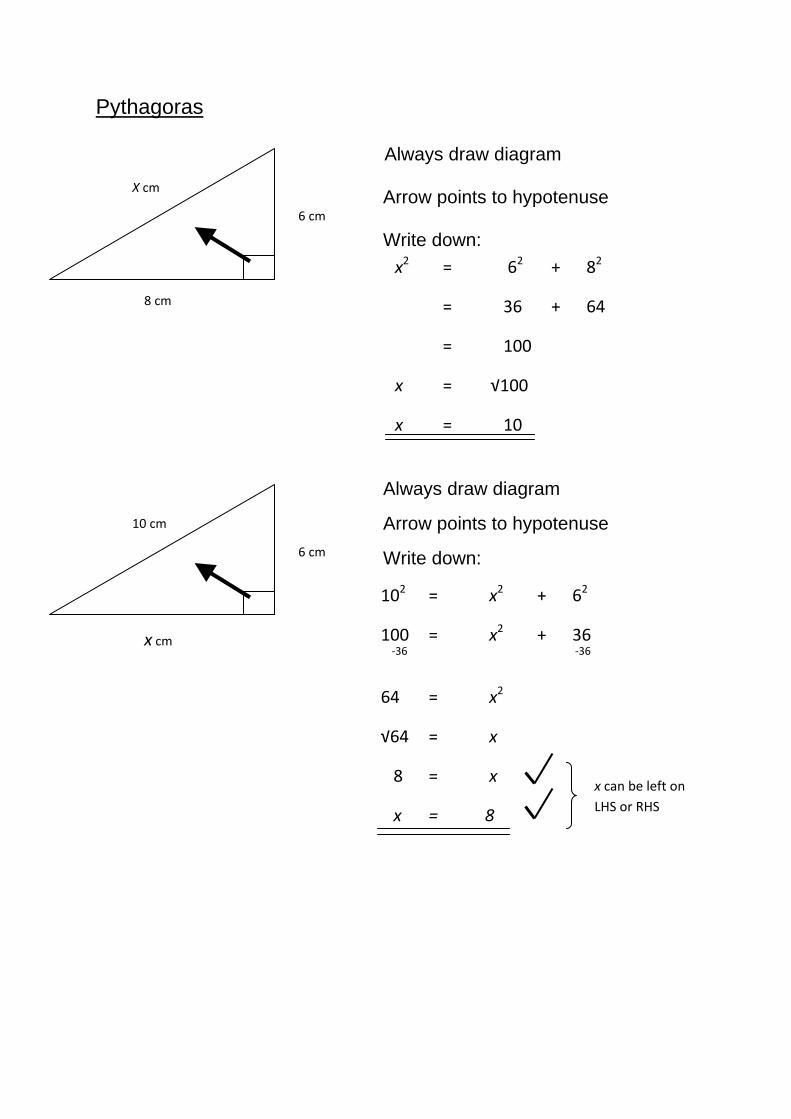
Pythagoras
Always draw diagram
Arrow points to hypotenuse Write down:
Always draw diagram
Arrow points to hypotenuse
Write down:
8 cm
X cm
6 cm
x cm
10 cm
6 cm
x2 = 62 + 82
= 36 + 64
= 100
x = √100
x = 10
102 = x2 + 62
100 = x2 + 36 -36 -36
64 = x2
√64 = x
8 = x
x = 8
x can be left on
LHS or RHS
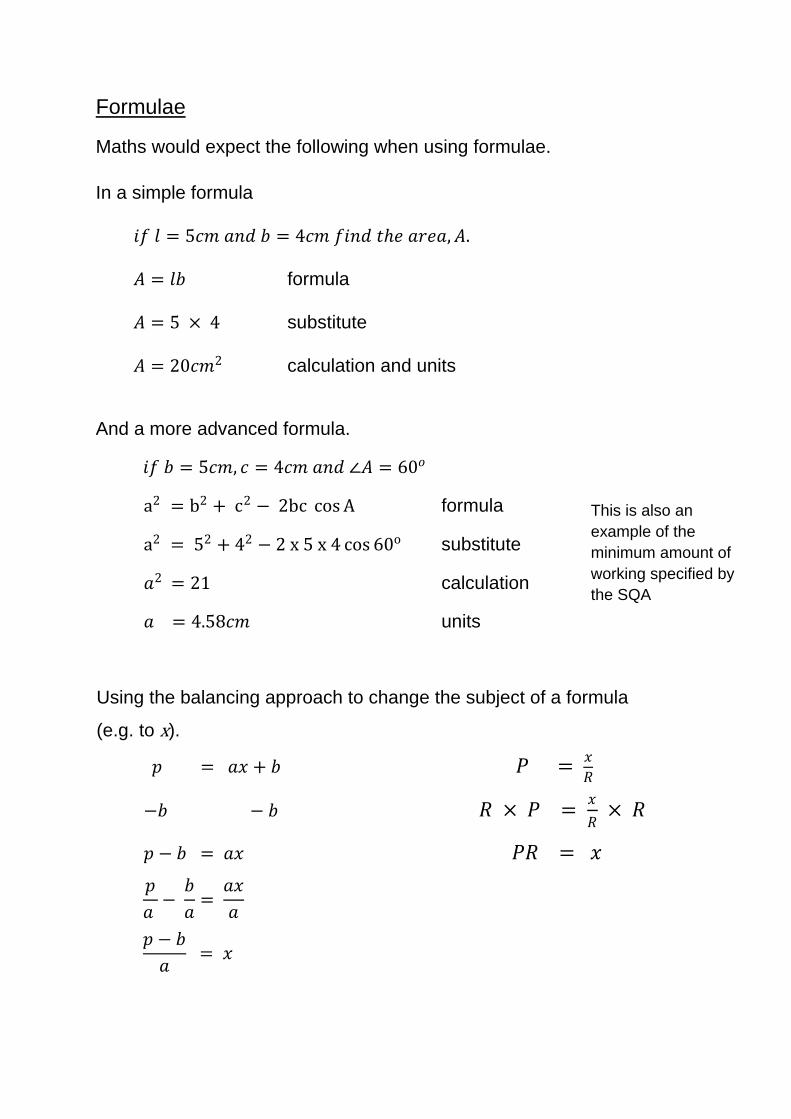
Formulae
Maths would expect the following when using formulae. In a simple formula
𝑖𝑓 𝑙 = 5𝑐𝑚 𝑎𝑛𝑑 𝑏 = 4𝑐𝑚 𝑓𝑖𝑛𝑑 𝑡ℎ𝑒 𝑎𝑟𝑒𝑎,𝐴. 𝐴 = 𝑙𝑏 formula 𝐴 = 5 × 4 substitute
𝐴 = 20𝑐𝑚2 calculation and units
And a more advanced formula.
𝑖𝑓 𝑏 = 5𝑐𝑚, 𝑐 = 4𝑐𝑚 𝑎𝑛𝑑 ∠𝐴 = 60𝑜
a2 = b2 + c2 − 2bc cos A formula
a2 = 52 + 42 − 2 x 5 x 4 cos 60o substitute
𝑎2 = 21 calculation
𝑎 = 4.58𝑐𝑚 units
Using the balancing approach to change the subject of a formula
(e.g. to x).
𝑝 = 𝑎𝑥 + 𝑏 𝑃 = 𝑥
𝑅
−𝑏 − 𝑏 𝑅 × 𝑃 = 𝑥
𝑅 × 𝑅
𝑝 − 𝑏 = 𝑎𝑥 𝑃𝑅 = 𝑥
𝑝
𝑎 −
𝑏
𝑎=
𝑎𝑥
𝑎
𝑝 − 𝑏
𝑎 = 𝑥
This is also an
example of the
minimum amount of
working specified by
the SQA
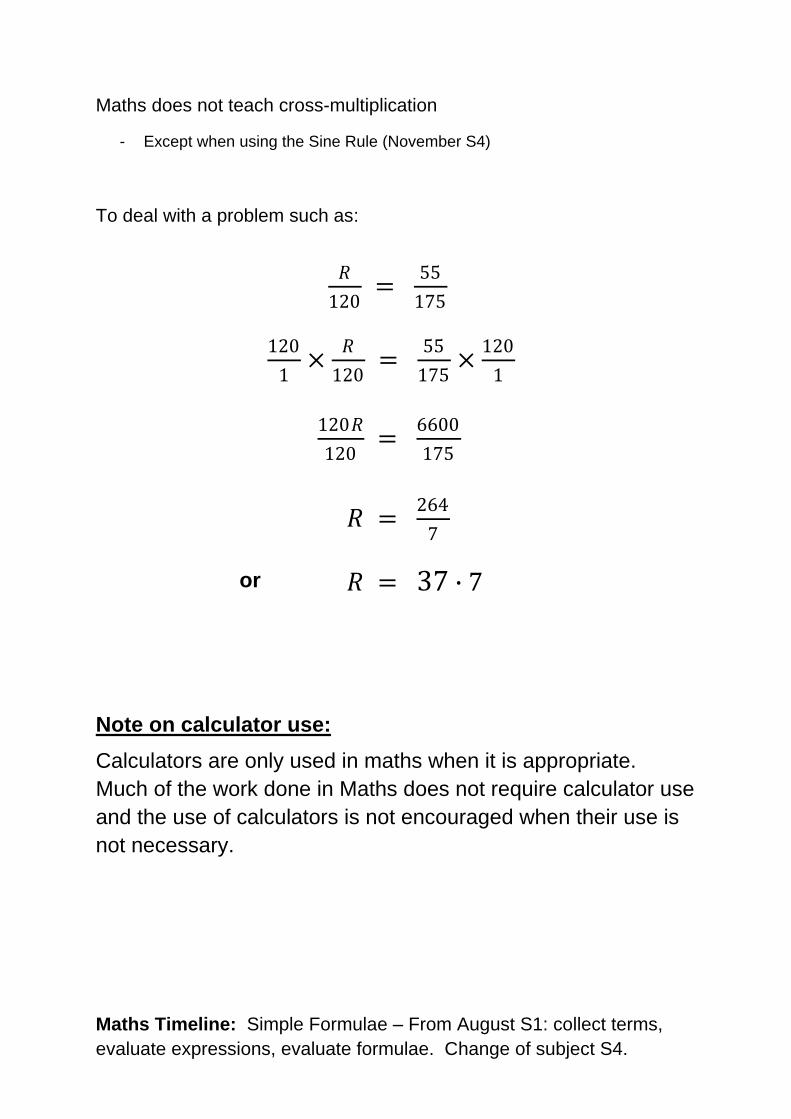
Maths does not teach cross-multiplication
- Except when using the Sine Rule (November S4)
To deal with a problem such as:
or
Note on calculator use:
Calculators are only used in maths when it is appropriate.
Much of the work done in Maths does not require calculator use
and the use of calculators is not encouraged when their use is
not necessary.
Maths Timeline: Simple Formulae – From August S1: collect terms,
evaluate expressions, evaluate formulae. Change of subject S4.
𝑅
120 =
55
175
120
1×
𝑅
120 =
55
175×
120
1
120𝑅
120 =
6600
175
𝑅 = 264
7
𝑅 = 37 ∙ 7
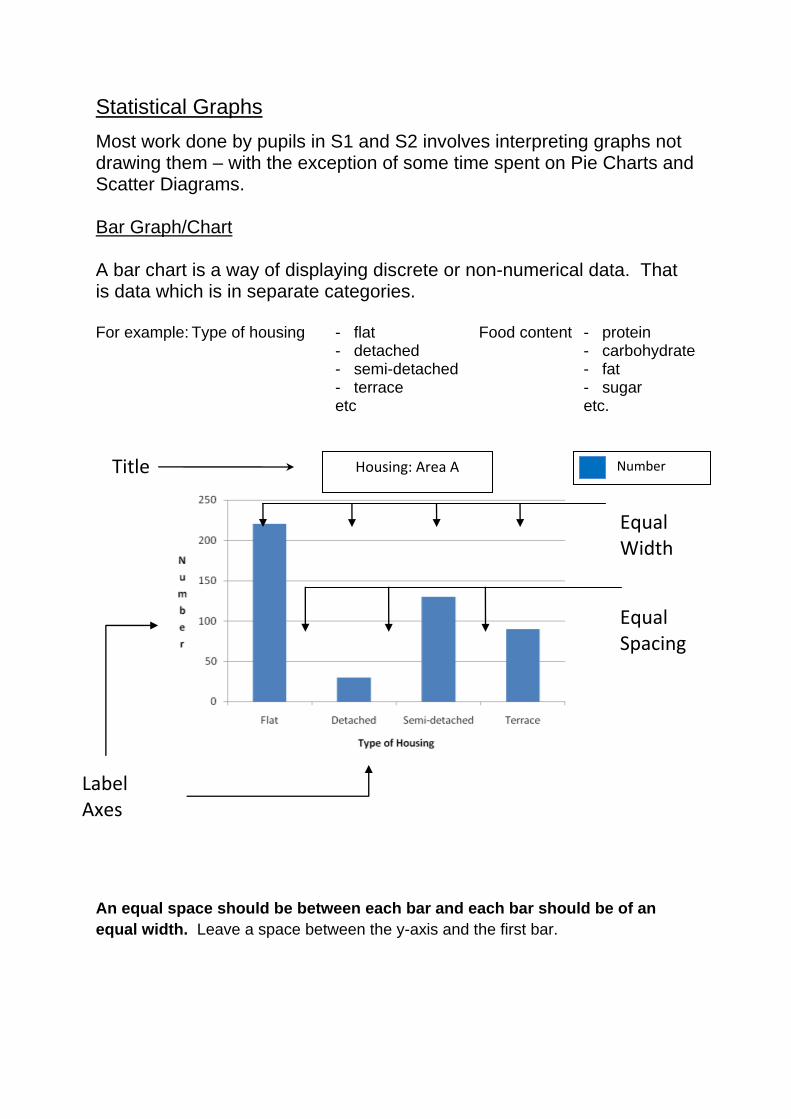
Statistical Graphs
Most work done by pupils in S1 and S2 involves interpreting graphs not drawing them – with the exception of some time spent on Pie Charts and Scatter Diagrams. Bar Graph/Chart A bar chart is a way of displaying discrete or non-numerical data. That is data which is in separate categories. For example: Type of housing - flat Food content - protein
- detached - carbohydrate - semi-detached - fat - terrace - sugar etc etc.
An equal space should be between each bar and each bar should be of an
equal width. Leave a space between the y-axis and the first bar.
Housing: Area A Number
Equal Width
Equal Spacing
Title
Label Axes

Histogram
A Histogram is often confused with a bar chart. More appropriately used
when data is continuous.
Continuous data are data that have no precise fixed value and are
usually measured to within a range. Such data includes height
(measurable to the nearest unit, a millimetre for example).
Data displayed in a histogram can be grouped.
As with a bar chart a histogram should have a title and appropriate x and
y-axis labels.
There should be no space between each bar. Each bar should be of an
equal width.
Maths Timeline
Bar Graphs – Information Handling – February S1 and December S2
Pupil Absence
Pupil Height
8
8
Number of
Pupils
7
Number of
Pupils
7
6
6
5
5
4
4
3
3
2
2
1
1
0
0
0-4 5-9 10-14 15-19 20-24
0-4 5-9 10-14 15-19 20-24
Number of days absent
Height (CM)

Line graphs compare two quantities (or variables). Each variable is plotted along an
axis.
A line graph should have a title and appropriate x and y-axis labels.
Pie Charts
A pie chart is a way of displaying discrete or non-numerical data.
A pie chart uses fractions or percentages to compare data.
In the construction of pie charts the maths department uses protractors and fractions
of 360°. A whole circle is then split into sectors representing those fractions.
A pie chart needs a title and a key.
T emp e r a t u r e C°
Time
37.50%
12.50%
21.90%
28.10%Banana
Orange
Apple
Pear
Favourite Fruit
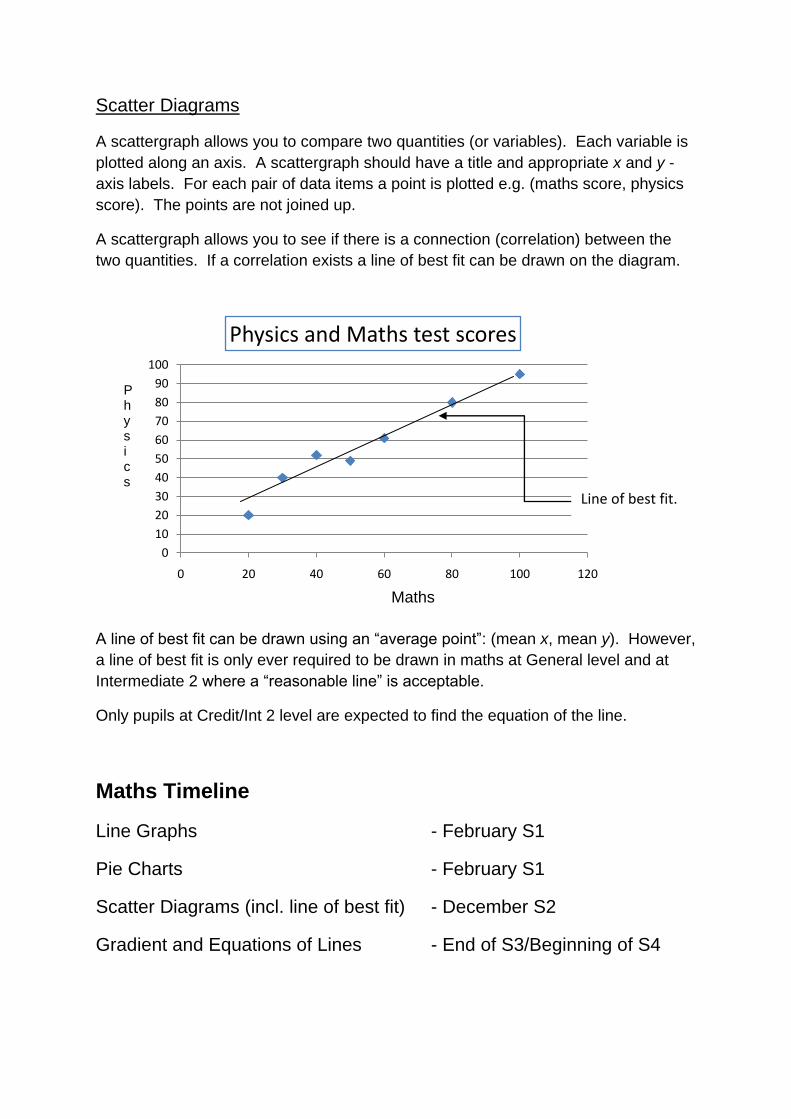
Scatter Diagrams
A scattergraph allows you to compare two quantities (or variables). Each variable is
plotted along an axis. A scattergraph should have a title and appropriate x and y -
axis labels. For each pair of data items a point is plotted e.g. (maths score, physics
score). The points are not joined up.
A scattergraph allows you to see if there is a connection (correlation) between the
two quantities. If a correlation exists a line of best fit can be drawn on the diagram.
A line of best fit can be drawn using an “average point”: (mean x, mean y). However,
a line of best fit is only ever required to be drawn in maths at General level and at
Intermediate 2 where a “reasonable line” is acceptable.
Only pupils at Credit/Int 2 level are expected to find the equation of the line.
Maths Timeline
Line Graphs - February S1
Pie Charts - February S1
Scatter Diagrams (incl. line of best fit) - December S2
Gradient and Equations of Lines - End of S3/Beginning of S4
0
10
20
30
40
50
60
70
80
90
100
0 20 40 60 80 100 120
Physics and Maths test scores
P h y s i c s
Maths
Line of best fit.
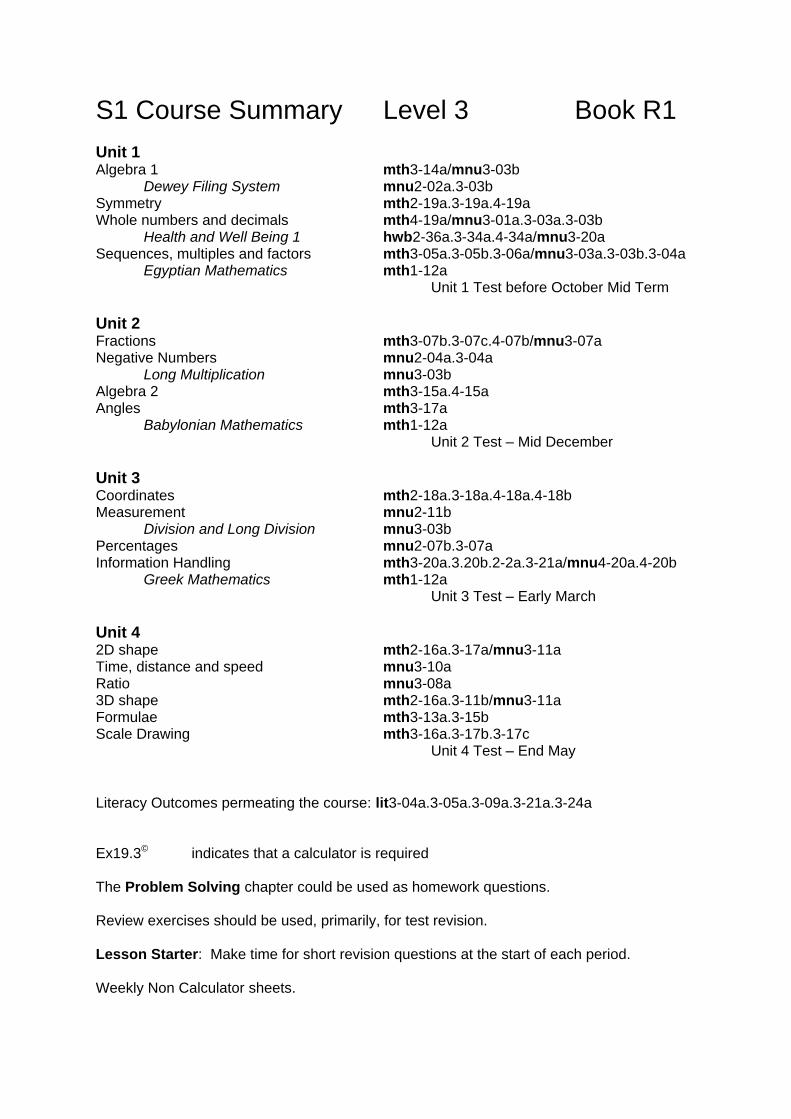
S1 Course Summary Level 3 Book R1
Unit 1 Algebra 1 mth3-14a/mnu3-03b Dewey Filing System mnu2-02a.3-03b Symmetry mth2-19a.3-19a.4-19a Whole numbers and decimals mth4-19a/mnu3-01a.3-03a.3-03b Health and Well Being 1 hwb2-36a.3-34a.4-34a/mnu3-20a Sequences, multiples and factors mth3-05a.3-05b.3-06a/mnu3-03a.3-03b.3-04a Egyptian Mathematics mth1-12a
Unit 1 Test before October Mid Term
Unit 2 Fractions mth3-07b.3-07c.4-07b/mnu3-07a Negative Numbers mnu2-04a.3-04a Long Multiplication mnu3-03b Algebra 2 mth3-15a.4-15a Angles mth3-17a Babylonian Mathematics mth1-12a
Unit 2 Test – Mid December
Unit 3 Coordinates mth2-18a.3-18a.4-18a.4-18b Measurement mnu2-11b Division and Long Division mnu3-03b Percentages mnu2-07b.3-07a Information Handling mth3-20a.3.20b.2-2a.3-21a/mnu4-20a.4-20b Greek Mathematics mth1-12a
Unit 3 Test – Early March Unit 4 2D shape mth2-16a.3-17a/mnu3-11a Time, distance and speed mnu3-10a Ratio mnu3-08a 3D shape mth2-16a.3-11b/mnu3-11a Formulae mth3-13a.3-15b Scale Drawing mth3-16a.3-17b.3-17c Unit 4 Test – End May
Literacy Outcomes permeating the course: lit3-04a.3-05a.3-09a.3-21a.3-24a Ex19.3© indicates that a calculator is required The Problem Solving chapter could be used as homework questions. Review exercises should be used, primarily, for test revision. Lesson Starter: Make time for short revision questions at the start of each period. Weekly Non Calculator sheets.

S2 Course Summary Level 3/4 Book R2
Unit1 Algebra 1 mth3-14a Sets of numbers mnu2-04a.3-04a/mth3-05b.4-06a.4-06b Area mnu3-11a/mth2-16a.3-11a.3-17a. Health and Well Being 2 hwb Decimals and significant figures mnu3-01a.3-03a/mth3-03b.4-03b. Formulae and sequences mnu3-03a.3-03b/mth3-06a.3-14a. Chinese Mathematics Unit 1 test middle/end of September
Unit 2 Fractions and Percentages mnu2-07b.3-07a Algebra 2 mth3-15a.4-15a Enlarging and Reducing mth3-17c.4-17c Proportion mnu3-08a.4-08a Unit 2 test middle of November Unit 3 Information Handling mnu3-20a.4-20a/mth3-20b.4-20b Algebra 3 mth3-15a.4-14a.4-14b.4-15a Circle mth4-16b Probability mnu3-22a.4-22a Unit 3 test end of January Unit 4 Time, Distance and Speed mnu3-10a.4-10b Pythagoras’ Theorem mth3-15a.4-16a Straight Line Graphs mth4-13b.4-13d Angles and Scale Drawing mth3-16a.3-17b.3-17c Unit 4 test end of March Literacy Outcomes permeating the course: lit3-04a.3-05a.3-09a.3-21a.3-24a
Ex 19.3© indicators that a calculator is required. The Problem Solving chapter could be used as homework questions. Review exercises should be used, primarily, for test revision. Make time for revision, short questions at the start of each period, and test revision. Weekly Non Calculator sheets.