cross-cultural generalizability of psychopathic...
TRANSCRIPT

Cross-cultural Generalizability of Psychopathic
Personality Disorder:
Differences Between Individualistic Versus
Collectivistic Cultures
by
Yan Lin Lim
B.A. (Hons), The University of Melbourne, 2009
Thesis Submitted in Partial Fulfillment of the
Requirements for the Degree of
Master of Arts
in the
Department of Psychology
Faculty of Arts
Yan Lin Lim 2016
SIMON FRASER UNIVERSITY
Spring 2016

ii
Approval
Name: Yan Lin Lim
Degree: Master of Arts
Title: Cross-cultural Generalizability of Psychopathic Personality Disorder: Differences Between Individualistic Versus Collectivistic Cultures
Examining Committee: Chair: Robert McMahon, PhD Professor
Stephen D. Hart, PhD Senior Supervisor Professor
Kevin Douglas, PhD Supervisor Professor
Andrew Ryder, PhD External Examiner Associate Professor Department of Psychology Concordia University
Date Defended/Approved:
April 4, 2016

iii
Ethics Statement
iv
Abstract
Research on Psychopathic Personality Disorder (PPD) has hitherto focused
predominantly on White North Americans. The extent to which the current
conceptualization of PPD can be extrapolated to other cultures remains a question. The
main purpose of this study was to investigate the generalizability of the construct of PPD,
as defined using the Comprehensive Assessment of Psychopathic Personality (CAPP;
see Cooke, Hart, Logan, & Michie, 2013), across individualistic versus collectivistic (IND-
COL) cultures. Specifically, the measurement equivalence of CAPP self-ratings across
IND-COL cultures was examined using Means and Covariance Structure (MACS) analysis
in a sample of 775 undergraduates. IND-COL was measured four ways at three levels:
the individual cultural orientation level, the perceived cultural context, and the syndromal
levels of nationality and ethnicity. Results showed general configural invariance for a 3-
factor solution for the CAPP, indicating the construct of PPD was conceptually similar
across IND-COL groups. There was, however, some indication of a lack of metric and
scalar invariance, depending on how IND-COL was operationalized. Implications for
understanding the pan-cultural core of PPD and future cross-cultural research on PPD are
discussed.
Keywords: Psychopathy; CAPP; Cross-culture; Individualism-Collectivism; Measurement Equivalence; Means and Covariance Structure Analysis

v
Dedication
To my family, for all the sacrifices you
made to allow me this amazing opportunity.

vi
Acknowledgements
I am indebted to the countless people who have supported me throughout my
graduate studies.
First of all, I would like to express my immense gratitude to Stephen Hart. For
taking me under your wings, guiding me through this maze that is graduate school, working
with me on the mind-boggling statistics, and for being infinitely patient with me – I sincerely
thank you. You are truly an inspiration and in more ways than one, and I am ever thankful
for the privilege to work with and learn from you. I look forward to the next few years (and
the “very exciting” dissertation ).
To Kevin Douglas, formalities dictate I should thank you for the edits and feedback
on the proposal and the draft. But more than that, thank you for being such a supportive
and encouraging presence always. To Randy Kropp, Lisa Brown, Kelly Watt, and Laura
Guy, thank you for always looking out for me in so many ways over the past few years.
I would also like to thank all friends at SFU who had made graduate school more
enjoyable and less painful. Thank you for being on this amazing journey with me—I could
not have asked for better people to go through graduate school with. To Alana, thank you
for being a friend, a mentor, and most importantly, family when I am 8000 miles away from
home. To Brigitte & Rick, thank you for always welcoming me to your home and supplying
me with endless cheese.
I would also like to thank my friends who have constantly encouraged and
supported me, tolerated me while I go missing-in-action. For all the weddings, birthdays,
and births that I’ve missed, thank you for being most understanding and I’m sorry I am
such a bad friend. In particular, to Sylvia Pung, Jonathan Ong, Samuel Lin and Elaine
Tan, I can’t wait to hear about all the updates in your lives.
Finally, to my family, thank you for always believing in me and wanting only the
very best for me.

vii
Table of Contents
Approval .......................................................................................................................... ii Ethics Statement ............................................................................................................ iii Abstract .......................................................................................................................... iv Dedication ....................................................................................................................... v Acknowledgements ........................................................................................................ vi Table of Contents .......................................................................................................... vii List of Tables .................................................................................................................. ix List of Figures................................................................................................................. xi
Chapter 1. Introduction ............................................................................................. 1 1.1. Cultural Shaping of PPD ......................................................................................... 2
1.1.1. Variations in Behavioral Manifestation of Underlying Traits ....................... 2 1.1.2. Variations in Prevalence of the PPD Traits ................................................ 3 1.1.3. Variations in Impairments Associated with PPD Traits ............................... 5 1.1.4. Variations in Basic Psychological and Neurobiological Processes ............. 6
1.2. Conceptual and Methodological Issues in Cross-Cultural Research ....................... 7 1.2.1. Measuring Culture ..................................................................................... 7 1.2.2. Unpacking Culture: Individualism-Collectivism ........................................... 8 1.2.3. Culture as a Multi-Level Construct ........................................................... 11 1.2.4. Measuring PPD Across Cultures ............................................................. 11
1.3. Assessing Cross-Cultural Equivalence of PPD ..................................................... 14 1.3.1. Differential Item Functioning (DIF) and Differential Test Functioning
(DTF) ....................................................................................................... 15 1.3.2. Mean and Covariance Structure (MACS) Analysis ................................... 17
1.4. The Current Study ................................................................................................ 20
Chapter 2. Method ................................................................................................... 22 2.1. Participants ........................................................................................................... 22 2.2. Procedure ............................................................................................................. 22 2.3. Materials ............................................................................................................... 23
2.3.1. Demographic Variables ........................................................................... 23 2.3.2. Psychopathic Traits Measure ................................................................... 23
Comprehensive Assessment of Psychopathic Personality (CAPP). ..................... 23 2.3.3. Cultural Measures ................................................................................... 24
Shortened INDCOL Scale (ATT). ........................................................................... 24 Normative IND-COL Scale (NORM). ..................................................................... 24 Hofstede’s country IDV index (IDV). ...................................................................... 25
2.4. Data Analytic Plan ................................................................................................ 25 2.4.1. MACS Analysis ........................................................................................ 25 2.4.2. Multiple Regression ................................................................................. 28

viii
Chapter 3. Results ................................................................................................... 29 3.1. Data Screening and Preliminary Analyses ............................................................ 29
3.1.1. Ethnicity and Correlational Analyses of Cultural Measures ...................... 29 3.2. Exploratory and Confirmatory Factor Analysis ...................................................... 31 3.3. Measurement Invariance across Normative IND-COL Groups .............................. 34
3.3.1. DOM Factor ............................................................................................. 34 Configural Invariance (M1). .................................................................................... 34 Metric Invariance (M2). ........................................................................................... 34 Scalar Invariance (M3). ........................................................................................... 35
3.3.2. DA Factor ................................................................................................ 39 3.3.3. DIS Factor ............................................................................................... 41 3.3.4. CAPP Total .............................................................................................. 42 3.3.5. Discussion ............................................................................................... 43
3.4. Measurement Invariance across Attitudinal IND-COL Groups .............................. 44 3.4.1. Discussion ............................................................................................... 50
3.5. Measurement Invariance across Ethnic Groups.................................................... 50 3.5.1. Discussion ............................................................................................... 58
3.6. Additional Exploratory Analyses ........................................................................... 58 3.7. Multiple Regression Analyses ............................................................................... 62
Chapter 4. General Discussion ............................................................................... 66 4.1. Cross-Cultural Generalizability of the CAPP ......................................................... 66
4.1.1. Effects at Item Level ................................................................................ 67 4.1.1.1 Items with Non-Uniform DIF..................................................................... 67 4.1.1.2 Items with Uniform DIF ............................................................................ 70
4.2. Cultural Influences ................................................................................................ 71 4.3. Strengths and Limitations ..................................................................................... 73
4.3.1. Use of Undergraduate Sample ................................................................ 73 4.3.2. Use of Self-Report Measures ................................................................... 74 4.3.3. Other Limitations ..................................................................................... 76 4.3.4. Future Directions for Cross-Cultural PPD Research: Etic-Emic
Approaches ............................................................................................. 76
References 78

ix
List of Tables
Table 3.1. Means and standard deviations of ATT and NORM IND-COL and Hofstede’s .............................................................................................. 30
Table 3.2. Factor Loadings from Derivative Sample ................................................ 32
Table 3.3. Descriptive Statistics and Alpha Coefficients of DOM, DA, DIS .............. 34
Table 3.4. Descriptive Statistics and Alpha Coefficients of DOM, DA, DIS by Median-split NORM IND-COL Groups .................................................... 36
Table 3.5. Results of Measurement Invariance tests for DOM, DA, and DIS factors across N-IND and N-COL groups. .............................................. 37
Table 3.6. Factor Loadings and Intercepts for the Partial Scalar Invariant Model for DOM across N-IND and N-COL groups. ................................. 38
Table 3.7. Factor Loadings and Intercepts for the Partial Scalar Invariant Model for DA across N-IND and N-COL groups. .................................... 40
Table 3.8. Factor Loadings and Intercepts for the Partial Scalar Invariant Model for DIS across N-IND and N-COL groups. ................................... 42
Table 3.9. Descriptive Statistics and Alpha Coefficients of DOM, DA, DIS by Median-split ATT IND-COL Groups ........................................................ 46
Table 3.10. Results of Measurement Invariance tests for DOM, DA, and DIS factors across ATT-IND and ATT-COL groups. ...................................... 47
Table 3.11. Factor Loadings and Intercepts for the Partial Scalar Invariant Model for DOM across A-IND and A-COL groups. ................................. 48
Table 3.12. Factor Loadings and Intercepts for the Partial Scalar Invariant Model for DA across A-IND and A-COL groups. ..................................... 48
Table 3.13. Factor Loadings and Intercepts for the Partial Scalar Invariant Model for DIS across A-IND and A-COL groups. .................................... 49
Table 3.14. Descriptive Statistics and Alpha Coefficients of DOM, DA, DIS for Caucasians and East Asians .................................................................. 54
Table 3.15. Results of Measurement Invariance tests for DOM, DA, and DIS factors between Caucasians and East Asians. ....................................... 55
Table 3.16. Factor Loadings and Intercepts for the Partial Scalar Invariant Model for DOM in Caucasians and East Asians. .................................... 56
Table 3.17. Factor Loadings and Intercepts for the Partial Scalar Invariant Model for DA in Caucasians and East Asians. ....................................... 56
Table 3.18. Factor Loadings and Intercepts for the Partial Scalar Invariant Model for DIS in Caucasians and East Asians. ...................................... 57

x
Table 3.19. Parameter Estimates Associated with DIF Items on the DOM scale. ..................................................................................................... 60
Table 3.20. Parameter Estimates Associated with DIF Items on the DA scale. ......... 60
Table 3.21. Parameter Estimates Associated with DIF Items on the DIS scale. ........ 61
Table 3.22. Zero-order correlations between the three INDCOL measures and CAPP Total and Factor Scores. ............................................................. 62
Table 3.23. Hierarchical regression analysis for culture measures predicting CAPP Total Scores. ............................................................................... 64
Table 3.24. Hierarchical regression analysis for culture measures predicting CAPP factor Scores. .............................................................................. 65

xi
List of Figures
Figure 1.1. The Comprehensive Assessment of Psychopathic Personality (CAPP) ................................................................................................... 13
Figure 3.1. Plot of the Item Functioning for Aggressive showing non-uniform DIF (dMACS = .67) across NORM IND and COL groups........................ 38
Figure 3.2. Plot of the Test Functioning for DOM across NORM IND and COL groups showing little DTF (dDTF = .07). ................................................. 39
Figure 3.3. Plot of the Item Functioning for Suspicious showing uniform DIF (dMACS = .48) across NORM IND and COL groups. ............................. 41
Figure 3.4. Plot of the Test Functioning for DOM, DA, and DIS subscales across latent trait PPD. ........................................................................... 43
Figure 3.5. Plot of the Test Functioning for the DA subscale showing non-uniform DTF (dDTF = .40) across ATT IND and COL groups. ................ 49
Figure 3.6. Plot of the Test Functioning for the DIS subscale showing non-uniform DTF (dDTF = .22) for Caucasians and East Asians against the invariant plots for DOM and DA. ........................................... 57

1
Chapter 1. Introduction
Psychopathic personality disorder (PPD), also known as antisocial or dissocial
personality disorder, comprises symptoms related to behavioral deviance, egocentricity,
unemotionality, and interpersonal disturbances. Importantly, it is a known risk factor for
serious criminality and violence (Leistico, Salekin, DeCoster, & Rogers, 2008; Salekin,
Rogers, & Sewell, 1996) and represents serious economic and social costs to the
individual sufferers, their victims, and the community (Cooke, 1996). Although our
understanding and assessment of PPD have improved substantially over the last thirty
years, we know little about its cross-cultural generalizability; research on PPD has hitherto
focused predominantly on White North American males. This is particularly concerning
given the grave implications PPD has for individual liberty and public safety around the
world. Offenders labelled as psychopaths are often thought to be more dangerous and
untreatable, and this label has been used to justify their longer incarceration, exclusion
from treatment, denial of parole, and other constraints on their liberty (Lloyd, Clark, &
Forth, 2010; Lyon & Ogloff, 2000). To ignore potential cultural differences and assume
measurements of PPD are equally meaningful across different cultural and ethnic groups
is unethical and discriminatory.
Historical and anthropological research have traced the existence of PPD among
the Inuit of northwest Alaska and the Yoruba of Nigeria (Arrigo & Shipley, 2001; Murphy,
1976). This suggests the disorder is more than a phenomenon of industrialized Western
societies (Cooke, 1996). However, the extent to which the current conceptualization of
PPD and its association with violence and criminality can be extrapolated to other cultures
remains a question. Although studies comparing North American and European samples
have generally found structural invariance for PPD, and showed positive associations
between PPD and violence (Cooke, Michie, Hart, & Clark, 2005a; Hare, Clark, Grann, &
Thornton, 2000), inferences concerning its cross-cultural validity can at best be made only
across industrialized Western societies. Even between Europe and North America,

2
differences not attributable to raters have been found, particularly with the interpersonal
features of the disorder (Cooke et al., 2005a; Cooke, 1996; Mokros et al., 2011). Moreover,
a recent meta-analysis indicated stronger associations between PPD and violence in
Canadian and European samples than in American samples (Leistico et al., 2008). Indeed,
studies have found differential predictive associations with violence for the different ethnic
groups even on an intra-national level (Asscher et al., 2014; Kosson, Smith, & Newman,
1990; McCoy & Edens, 2006; Walsh & Kosson, 2007). Specifically, in a recent study by
Walsh (2012), PPD was found to be more strongly predictive of violence among European
American than among African Americans, and it was not at all predictive of violence for
Latino Americans.
In the handful of studies that have investigated PPD outside the Western world,
cross-cultural variations of the disorder were even more pronounced. Compared to North
Americans, symptoms related to deficient emotional experience among East Europeans
and Middle Easterners were more discriminatory than were symptoms related to arrogant
and deceitful interpersonal style (Shariat et al., 2010; Wilson, Abramowitz, Vasilev,
Bozgunov, & Vassileva, 2014). In a Japanese study, differences in the factorial structure
of the Psychopathic Personality Inventory-Revised (PPI-R; Lilienfeld & Widows, 2005)
were observed, supporting that the manifestation of psychopathy is shaped, in part, by the
social environment (Yokota, 2012).
1.1. Cultural Shaping of PPD
In the following sections, I will discuss the multitude of ways culture can influence
and shape the presentation, prevalence, and level of impairments associated with PPD.
1.1.1. Variations in Behavioral Manifestation of Underlying Traits
According to the cultural facilitation model, because different socialization and
enculturation experiences are likely to differentially facilitate the expression of certain traits
while suppressing others (Cooke, Michie, Hart, & Clark, 2005b; Cross & Markus, 1999),

3
there would be cross-cultural differences in the way PPD manifested. This is akin to the
finding that the people of Asian heritage tend to express depression in somatic terms,
rather than psychological symptoms of feeling sad or blue that is more commonly reported
by people of European heritage (Kleinman, 1977; Ryder, Ban, & Chentsova-Dutton, 2011).
Hare (1998) himself acknowledged that the behavioral manifestation of the disorder is
dependent on the societal and cultural context, and he conceded that “it is more difficult
to determine how psychopaths express themselves in societies that are highly structured
and in which there are strong traditions to conform to group standards” (p. 105).
Indeed, differences in interpersonal and affective items were noted when
comparing Iranian samples to North American samples, and these differences were
thought to be due to an Iranian cultural practice known as taarof (Shariat et al., 2010). This
culture of taarof meant that being superfluously agreeable and charming is culturally
accepted and even encouraged in Iran (Shariat et al., 2010).
1.1.2. Variations in Prevalence of the PPD Traits
Cultural variations may also exist at the levels of the traits and not just the different
manifestation of the traits. Culture may promote and engender certain culturally valued
trait to the extent that there may be greater levels of that trait in the population. This can
be seen as a variant of the cultural facilitation model, except instead of culture influencing
the expressions of the traits, here, culture directly influences the levels of the traits through
culturally-shaped feedback loops (Ryder, Dere, Sun, & Chentsova-Dutton, 2014).
Importantly, as Ryder argued, the higher levels of the trait may still cause dysfunctions
and thus should still be considered pathological, even if having high levels of the traits are
considered normal in the particular culture (Ryder, Dere, et al., 2014). In this sense then,
the culture itself is a causative factor for the personality disorder. Evidence for this
proposition may be deduced from the differences in the rates of crime, especially of violent
crimes, across North America, European, and East Asia countries, as well as the
differences in the rates of personality disorders, particularly antisocial personality disorder
(Cooke, 1996; Harrendorf, Heiskanen, & Malby, 2010).

4
Another set of evidence that support this idea of cultural variations in prevalence
of different personality traits comes from the a series of global studies on the five-factor
model (FFM; McCrae & Costa, 1997). These studies support the idea that countries do
have meaningful and characteristic personality profiles, and the European and North
American aggregate personality profiles were distinct from those of Asian and African
nations (Allik & McCrae, 2004; McCrae, 2002; Schmitt, Allik, McCrae, & Benet-Martinez,
2007). Specifically, European and North American cultures were higher in extraversion
and openness to experience, and lower in agreeableness than Asian and African cultures
(Allik & McCrae, 2004; Schmitt et al., 2007). The two Western cultures also had greater
variabilities, which reflect a greater heterogeneity within their populations, than the Asian
and African cultures (McCrae, 2002; Schmitt et al., 2007). The latter two had smaller
variability in general, including smaller gender differences (Costa, Terracciano, & McCrae,
2001; McCrae, 2002). Taken together, these studies suggest cultures that have similar
heritage or history shared more similar personality profiles than cultures that are less
similar (Allik & McCrae, 2004; Schmitt et al., 2007) and support the notion that cultures
can, and do, have an impact on the prevalence of certain personality traits.
Consider this information in light of the literature linking the FFM to PPD. Lynam
and colleagues (e.g., Derefinko & Lynam, 2007; Lynam & Miller, 2014; Lynam, 2002;
Miller, Lynam, Widiger, & Leukefeld, 2001; Miller & Lynam, 2012) have studied PPD from
a FFM perspective. According to them, PPD can be conceptualized as a constellation of
low agreeableness across all six facets; low conscientiousness across dutifulness, self-
discipline, and deliberation; low neuroticism across self-consciousness, anxiety,
depression, and vulnerability, but high across impulsiveness and angry hostility; high
extraversion across excitement seeking and assertiveness, but low in warmth; and finally
high in openness to actions but low in openness to feelings (Lynam, 2002; Miller et al.,
2001). Given the above findings that Asian and African cultures generally had higher levels
of agreeableness and lower levels of extraversion and openness to experience, one
should expect lower levels of PPD in Asian and African cultures.

5
1.1.3. Variations in Impairments Associated with PPD Traits
In contrast, cultural variations may exist at the level of impairment associated with
the traits, the differences in the level of traits notwithstanding. Culture shapes personal
and social reactions to extreme traits that may or may not lead to dysfunction, and
therefore have an impact on whether the personality style would be considered disordered
(Ryder, Dere, et al., 2014). As such, some traits may be more normative within certain
cultures and may not become problematic until they become more extreme (Ryder, Dere,
et al., 2014). For instance, in Iran, being superficial and charming is not pathological and
there are no impairments associated with those traits because of taarof whereas it was
hypothesized that being superficial and charming in North American may cause some
problems for the individual (Shariat et al., 2010). In addition, previous studies have found
PPD not to be associated with violence and criminality in the same way in certain sub-
groups (Skeem, Edens, Camp, & Colwell, 2004; Walsh, Swogger, & Kosson, 2004; Walsh,
2012).
Seeing as individualistic societies generally tolerate, and even facilitate, low to
moderate levels of PPD traits (Cooke, 1996)—unlike collectivistic societies that may
actually act to suppress them—I postulate that PPD will be associated with greater
dysfunction at lower levels of the traits in collectivistic societies. Some evidence for this
come from a study by Caldwell-Harris and Ayçiçegi (2006) that found idiocentric
personality styles were associated with poorer psychological and social outcomes,
including greater engagement in antisocial and criminal behaviors, among the Turkish
students, but not among the American students. Instead, idiocentric personality styles
were associated with better psychological adjustment among the American students and,
surprisingly, not with antisocial or borderline personality. These variations in societal
reactions to the traits might explain the very high discrimination parameters of lack of
empathy and lack of remorse in the Iranian sample (Shariat et al., 2010), which may
indicate impairments are likely present even at lower levels of these two items. As the
authors pointed out, Iran is a collectivistic society which likely values interpersonal
relationships and thus may be more sensitive to even the slightest deviations in terms of
“selfish” emotions like lack of empathy and lack of remorse (Shariat et al., 2010).
6
1.1.4. Variations in Basic Psychological and Neurobiological Processes
A fundamental assumption that underpins the study of personality disorder is that
the basic psychological processes, such as cognitive structure, emotions, motivations, and
personality, are universal (Norenzayan & Heine, 2005). However, recent studies have
shown this to be untrue: the way people think, feel, and experience themselves and the
world around them differ in very fundamental ways as a function of their culture (Nisbett,
Peng, Choi, & Norenzayan, 2001; Rule, Freeman, & Ambady, 2013). Even the FFM, which
has been proposed as a framework for studying PPD (Lynam & Widiger, 2007), has been
shown not to be universal. This has led to the development of newer models of
personalities like the HEXACO (Ashton & Lee, 2007) as well as other cultural-specific
models like the Chinese Personality, which has a slightly different factor structure, a
stronger focus on interpersonal relations, and a different underlying conceptualization of
the self (F.M. Cheung et al., 1996; F.M. Cheung, Cheung, & Jianxin, 2004). In fact, cross-
cultural studies have shown personality traits, compared to social identities, are less
central to people from collectivistic cultures (Sul, Choi, & Kang, 2012).
The emerging area of cultural neuroscience has shown these cultural differences
to be evident in the brain itself. Culture interacts with the genes and the environment to
assert different behavior and adaptive traits and shapes the brain structure and function
in different ways (Chiao, Cheon, Pornpattanangkul, Mrazek, & Blizinsky, 2013). What this
means is the research on the neurobiology and etiology of PPD that has been done almost
exclusively with White males may not translate across cultures. Specifically, individualism-
collectivism, power distance, and strength of identification with one’s racial group have
been found to modulate the neural bases of social and emotional behaviors, including
amygdala response to emotional faces, empathy, pain perception and experiences, moral
decision making—processes that are fundamental to our understanding of PPD (Chiao et
al., 2008, 2013; Harenski, Harenski, & Kiehl, 2014). Indeed, laboratory findings of
diminished punishment learning and deficient response modulation found in Caucasian
psychopathic inmates have not been replicated with African American males inmates
(Kosson et al., 1990; Lorenz & Newman, 2002).

7
1.2. Conceptual and Methodological Issues in Cross-Cultural Research
1.2.1. Measuring Culture
Given the clinical and legal interests in PPD around the world (Felthous & Saß,
2007), there are potentially grave implications associated with the use and misuse of PPD
assessment instruments and the misdiagnosis of the disorder. The need for a more
nuanced and sophisticated understanding of culture and PPD cannot be understated.
Unfortunately, there are various methodological considerations in cross-cultural research
that can make it extremely cumbersome and unfulfilling. Good cross-cultural studies are
arduous and resource-intensive. Not only is the definition of PPD controversial (see
Skeem & Cooke, 2010a, 2010b and Hare & Neumann, 2010), the conceptualization of
culture itself is also polemical (Fischer, 2009; Kuper, 1999; Rohner, 1984); there is no one
accepted definition of culture in psychology, anthropology, or sociology today. Broadly,
culture has been understood as a set of shared beliefs, norms, values, customs, and
behaviors unique to a particular group and is learned through socialization processes
(Fischer, 2009). However, even with this definition, it is still difficult to actually
operationalize and measure culture. Previous studies on cross-cultural PPD have largely
used nationality (e.g., Cooke, Hart, & Michie, 2004; Cooke et al., 2005a; Cooke, 1995;
Hare et al., 2000; Mokros et al., 2011; Neumann, Schmitt, Carter, Embley, & Hare, 2012;
Shariat et al., 2010; Wilson et al., 2014; Yokota, 2012) or ethnicity (e.g., Olver, Neumann,
Wong, & Hare, 2013; Skeem, Edens, Camp, & Colwell, 2004; Skeem, Edens, Sanford, &
Colwell, 2003; Walsh, 2012) to index culture. Although valid, these approaches of using
country as culture and ethnicity as culture have been criticized by cross-cultural/cultural
scholars as being overly simplistic (Chirkov, Lynch, & Niwa, 2005; D. Cohen, 2013;
Kitayama, 2002; Matsumoto & Yoo, 2006; Ryder et al., 2011).
There are also a few methodologically issues. For studies using country as culture,
it is unclear how this grouping variable is defined: does it refer to the country of birth,
residence, or citizenship? One study showed the associations between culture and the
variables of interest were significantly different depending on whether culture was defined

8
as country of birth, country of residence, or national citizenship (Crotts & Litvin, 2003).
Although for the majority of participants their country of birth, country of residence, and
national citizenship will the same, there is a growing substantial minority for whom these
are different. In fact, according to a recent census, 21% of the Canadian population and
13% of the United States population is foreign-born (Statistics Canada, 2013). Likewise,
for those studies that looked at PPD across the different ethnic groups, they did not specify
if ethnicity was coded based on self-identification, ancestral heritage, or official
documents. There were also no explanations for how participants with mixed ethnicities
were coded. More importantly, these approaches take culture as static and assume a high
level of cultural homogeneity within the group, which is untenable especially in today’s
highly globalized world where national and ethnic boundaries are becoming increasingly
permeable and fluid (Chirkov et al., 2005; Kirmayer, 2006; Oyserman, Coon, &
Kemmelmeier, 2002; Poortinga & van Hemert, 2001). It ignores the heterogeneity that
might exist within national and ethnic groups that is due to important differences in regional
affiliation, level of ethnic/cultural identification, and levels of acculturation (Chirkov et al.,
2005; Matsumoto & Yoo, 2006).
More importantly, using such simplistic proxy indicators does not actually explain
the between group differences in any meaningful or empirically justifiable way (Kao, Hsu,
& Clark, 2004; Kitayama, 2002; Ryder et al., 2011). Despite that cultural contextualization
is by definition necessary to understand PDs (Alarcon, 1996), many of these studies only
minimally examined the context of the different cultural groups they studied, if at all. As
systematic exploration of the cultural contexts was never part of the study design,
explanations for observed differences can only be post-hoc, conjectural, and untested.
1.2.2. Unpacking Culture: Individualism-Collectivism
Instead, cross-cultural researchers recommend directly assessing the cultural
differences that underlie these more arbitrary categories of race, nationality, or ethnicity
(Betancourt & López, 1993; Matsumoto & Yoo, 2006; Poortinga & van de Vijver, 1987;
Soares, Farhangmehr, & Shoham, 2007; Triandis, 1993). Such designs are known as
“unpacking” studies where culture as an unspecified (or poorly specified) variable is

9
clarified and “unpacked” by examining and explicitly testing the cultural dimension that is
thought to cause the observed difference (Fischer, 2009; Matsumoto & Yoo, 2006;
Poortinga & van de Vijver, 1987). The trade-off with using such broad multi-faceted
construct is that measurement of cultural dimension with fidelity becomes difficult
(Oyserman et al., 2002; Singelis, Triandis, Bhawuk, & Gelfand, 1995); it will be less reliable
than measurements of nationality or ethnicity. Nevertheless, as Cronbach (1990) argued,
it is better to obtain rough information about all the important aspects of the broad
construct than in precisely measuring only narrow elements of it in such situations.
One fundamental and widely studied dimension that accounts for major cultural
differences between the East and the West is Individualism-Collectivism (IND-COL;
Hofstede, 1980; Oyserman, Coon, & Kemmelmeier, 2002; Triandis, 2000). IND-COL
refers to the way individual and societies are organized vis-à-vis one another and whether
the individual or the group is seen as the basic unit of reference. Individualism (IND) can
be broadly understood as a cluster of values, beliefs, and attitudes that is organized
around the individual and emphasizes independence, personal uniqueness, individual
goals, and freedom of choice. Collectivism (COL), on the other hand, emphasizes on the
group, with the group’s goals and well-being being superordinate to the individual’s
(Oyserman & Lee, 2008). Cross- and multinational studies have generally found Asian
and Eastern European countries to be more collectivistic, whereas North American and
Western European countries tended to be more individualistic (Hofstede, 1980, 2001;
Oyserman et al., 2002; Triandis, 1993). IND-COL has important implications for
personality, self-concept, well-being, cognitive and attribution style, emotional experience,
and relationality; it directly influences the way we think, behave, and relate to others (for
a review, see Oyserman et al., 2002; Triandis & Suh, 2002).
Following this logic, it is not difficult to see how IND-COL can impact PPD. IND
elevates the individual, values hedonism and stimulating experiences, and rewards
independence and competitiveness—behaviors that, in their extreme forms, appear to
mirror PPD. Indeed, it had been postulated that IND may not only be associated with
greater prevalence of PPD but is also a cause (Cooke & Michie, 1999; Cooke, 1996; Hare,
1993; Lykken, 1995; Paris, 1998). Conversely, COL, which places greater emphasis on

10
the relatedness between people, may lead to the suppression of certain PPD-related traits
and behaviors, hence lowering severity and prevalence of the disorder as a whole.
Members of collectivistic societies are also known to be more concerned with conforming
to social norms, even ones that have no moral obligations (Kemmelmeier et al., 2003;
Saucier et al., 2014). Alternatively, COL may promote alternative expressions of the
underlying traits in ways that are not be intuitively recognized to be related to PPD, thereby
leading to the underdiagnosis and the underestimation of the disorder in collectivistic
societies (Ryder, Sun, Dere, & Fung, 2014). For instance, although dominance is a major
component of PPD, the strategies that would be effective in gaining power and control
may be very different in an individualistic society compared to a more collectivistic one.
An example of this is how aggression is used and displayed in individualistic versus
collectivistic societies. Whereas within individualistic societies, some levels of aggression
may be accepted as means for asserting oneself, establishing dominance, and even
gaining respect; overt displays of aggression, even in mild forms, in collectivistic cultures
are usually seen as disruptive and are more strongly shunned (Bond, 2004; Mesquita &
Walker, 2003; Triandis, 2000). However, that is not to say there is no or even less
aggression in collectivistic cultures. Instead, individuals in collectivistic societies may
express aggression and exert coercive control in more subtle and indirect ways, such as
through relational aggression (Bergeron & Schneider, 2005; Li, Wang, Wang, & Shi,
2010). In fact, this may be a more effective method and may cause more harm given the
higher value placed on relationships with others in collectivistic societies. Alternatively,
they may also attempt to gain dominance and display aggression in a manner that is more
socially acceptable, such as directing it towards out-group members. Previous studies
have shown association between social dominance orientation (SDO), which is an
individual’s preference for group dominance and power hierarchy (Pratto, Sidanius,
Stallworth, & Malle, 1994), and PPD (Glenn, Iyer, Graham, Koleva, & Haidt, 2009; Hodson,
Hogg, & MacInnis, 2009; Yokota, 2012). For collectivists, there are clear distinctions
between in-group and out-group, and although conformity and loyalty is expected towards
the in-group (Triandis, Bontempo, Villareal, Asai, & Lucca, 1988; Triandis, 1995), they may
show a lack of caring, derogation, and strong prejudice towards out-group members
(Brown et al., 1992; Pratto et al., 2000).

11
1.2.3. Culture as a Multi-Level Construct
The appropriate level of analysis of culture continues to be a matter of much debate
among cross-cultural researchers (Fischer, 2009; Ralston et al., 2013). Culture is a
complex multi-faceted but also multi-levelled construct that, like an onion, has many
different layers to it. IND-COL can be studied as a cultural syndrome at the country level
(Hofstede, 2001), a cultural attitude or orientation at the individual level (Hui & Triandis,
1986), or a social norm at the perceived cultural context level (Fischer, 2009). Studying
IND-COL as a country-level cultural syndrome is the approach most commonly used in
cross-cultural psychopathology research. However, as with the cross-national research,
this approach has been greatly criticized primarily because it ignores any within-group
variability (Chirkov et al., 2005; Oyserman et al., 2002). As an alternative approach,
researchers have used attitudinal scales to measure individual’s IND-COL, which is a
convenient approach for the direct assessment of culture at the individual level. However,
this approach conflates culture with personality and is less useful in the study of cultural
processes and dynamics (Chirkov et al., 2005; Fiske, 2002). The final approach to study
culture as a set of social norms sidesteps these issues to study the expressions of shared
meaning (Fischer, 2009). Cultural norms are implicit guidelines transmitted through
socialization and enculturalization processes to guide behaviors, thinking, and feelings
within certain defined contexts, relationships, and events (Matsumoto & Hwang, 2011).
Studying individuals’ perceptions of shared norms allows an unpacking of the sociocultural
processes that might influence and shape behaviors vis-à-vis individual personality factors
(Chirkov et al., 2005).
1.2.4. Measuring PPD Across Cultures
Studies attempting to establish the cross-cultural validity of PPD have typically
used the Psychopathy Checklist-Revised (PCL-R; Hare, 1991) (Cooke et al., 2005a;
Cooke, 1995; Hare et al., 2000; Mokros et al., 2011; Neumann et al., 2012; Olver et al.,
2013; Shariat et al., 2010; Wilson et al., 2014). The PCL-R contains 20 items thought to
reflect features of PPD. It was initially developed for use with North American Caucasian
male offenders but is now the one of the most commonly used instruments worldwide in

12
the assessment of PPD (Hare et al., 2000; Singh et al., 2014). The problem, I argue, with
using the PCL-R in cross-cultural research on PPD is that the PCL-R is a specific and a
fairly narrow operationalization of PPD; the PCL-R is unlikely, in my opinion, to be able to
capture fully the alternate presentations of PPD in non-Western groups. In addition, the
PCL-R immediately assumes an association between PPD and criminality and includes
items that are defined primarily by criminal conduct, even though this association between
PPD and criminality has not been shown to be robust in certain sub-groups (e.g., Asscher
et al., 2013; Cale & Lilienfeld, 2002; Kosson et al., 1990; Walsh & Kosson, 2007). Various
scholars have also called for more studies to investigate the disorder with alternative
measures, concerned that the field’s overreliance on the PCL-R has led to the conflation
of the construct of PPD with PCL-R as a measure of PPD (Hart & Cook, 2012; Skeem &
Cooke, 2010a, 2010b).
In response, a variety of alternative models and measures of PPD have been
proposed in the recent years (e.g., Lilienfeld & Andrews, 1996; Patrick, Fowles, & Krueger,
2009), one of which is the Comprehensive Assessment of Psychopathic Personality
(CAPP) by Cooke and colleagues (Cooke, Hart, Logan, & Michie, 2004, 2012; see also
www.gcu.ac.uk/capp2). The CAPP is a comprehensive broad-based lexical model of the
PPD that was developed based on thorough reviews of the theoretical, empirical, and
clinical literature and on interviews with subject matter experts of diverse theoretical
orientations. It consists of 33 symptoms grouped into the six broad domains of Attachment,
Behavior, Cognition, Dominance, Emotion, and Self (see Figure 1.1). Each symptom is
elaborated by three trait-descriptive adjectives or adjectival phrases to help triangulate its
meaning. Currently, the CAPP has been translated into more than 18 languages and
although research with the CAPP is still in its infancy, preliminary findings about its content
validity across gender and culture have been encouraging (e.g., Heinzen, Fittkau, Kreis,
& Huchzermeier, 2011; Hoff, Rypdal, Mykletun, & Cooke, 2012; Kreis, Cooke, Michie,
Hoff, & Logan, 2012; Kreis & Cooke, 2011).

13
Figure 1.1. The Comprehensive Assessment of Psychopathic Personality (CAPP)
There are two reasons why I believe the CAPP will be more suitable for assessing
different phenotypic manifestations of PPD across diverse cultural groups. First, it does
not presuppose criminal behaviors and instead focuses on personality traits. Although
closely linked, behaviors do not have a one-to-one association with personality traits and
are more context-dependent. Even the types of behaviors that are thought characteristic
of the different personality traits vary according to the individual’s age, gender, culture,
and other societal and environmental factors (Cooke et al., 2012). Second, the developers
were intentionally over-inclusive during the development of the CAPP and retained
putative items that may be considered “less central” to PPD to avoid potential problems
with construct underrepresentation. Although it is still possible that the CAPP missed
symptoms that are relevant to PPD in other cultures (i.e., emic or culture-specific) since

14
the episteme it was based on was heavily North American or European, the broad and
over-inclusive nature of the model militate against this.
1.3. Assessing Cross-Cultural Equivalence of PPD
Although not isomorphic, there exists certain structural and analytical parallels
between examining the cross-cultural generalizability of psychiatric classifications and the
cross-cultural measurement equivalence of psychological tests (Blashfield & Livesley,
1991). Foremost, the relationship between items to test or scale can be thought of, to an
extent, as being structurally akin to the relationship between symptoms to disorder.
Secondly, both tests and diagnostic classifications are evaluated using similar concepts
of reliability and validity and statistical methodologies (Blashfield & Livesley, 1991). Thus,
to an extent, the cross-cultural generalizability of the disorder m be evaluated by
examining the cross-cultural measurement equivalence of a corresponding measure.
The assessment of cross-cultural generalizability of the disorder and the
measurement equivalence of test is concerned with three primary questions: The first is,
is the disorder conceptually the same across the two cultures? In other words, does the
disorder have the same meaning, and is it defined by the same cluster of symptoms across
cultures (van de Vijver & Leung, 1997)? In terms of measurement, this question is
concerned if the measurement model has the same number of factors and pattern of factor
loadings across groups. Invariance at this level is known as configural equivalence. The
second question is whether the symptoms relate to the disorder the same way across
cultures; that is, are they equally important to or diagnostic of the disorder across cultures?
In terms of measurement, this question is concerned with whether the items share the
same unit of measurement across groups. Invariance at this level is known as metric
invariance. A lack of invariance at this level may mean some symptoms are more
important to the disorder for one group than the other. Thirdly, in the examination of
measurement equivalence, it is important to ensure scalar or strong factorial invariance to
allow for comparison of latent means (Meredith, 1993). Scalar invariance is concerned
with not only the scale having the same unit of measurement but also having the same

15
origin. Until metric and scalar equivalence are demonstrated, there can be no meaningful
comparison of tests across the different cultural groups—the observed difference in test
scores between the two groups could be due to a true group difference in the level of the
trait, or it could be due to measurement bias and different responding styles (Little, 1997)1.
There is a fourth level of invariance, known as strict invariance, which is concerned with
the precision of the measurement being the same across groups. However, this form of
residual or uniqueness invariance is difficult to achieve and not necessary for establishing
cross-group comparability in terms of factor structure or latent means (Byrne & Stewart,
2006). These various degrees of measurement invariance are typically examined using
either multi-group confirmatory factor analysis (MG-CFA), in which different constraints
are imposed onto a series of nested models and the goodness-of-fit of the more restricted
models are evaluated against a less constrained baseline (Vandenberg & Lance, 2000).
1.3.1. Differential Item Functioning (DIF) and Differential Test Functioning (DTF)
When items function differently for different groups either at the metric or scalar
levels, it can be said that the item is non-invariant and differential item functioning (DIF)
has occurred. DIF has traditionally been studied using item response theory (IRT) models.
Briefly, IRT models specify the nonlinear relationship between an individual response on
an item or test score and the underlying latent trait (θ) that is postulated to underpin item
or test scores. The probabilities of achieving a particular score on an item or test given a
person’s latent trait levels is specified by the S-shaped item response functions, also
known as item characteristic curve (ICC) and test characteristic curve (TCC), respectively.
DIF and DTF is said to occur when the item or test response functions are not invariant
across groups.
1 These various levels of invariance can be thought to be somewhat akin to the comparison between Celsius, Fahrenheit, and Kelvin. All three are measures of temperature, but it would be senseless to compare their raw numerical values directly. Celsius and Fahrenheit have completely different scale (Δ1ºC = Δ1.8ºF) and origin (0ºC = 32ºF). Even though Celsius and Kelvin have the same scale (Δ1ºC = Δ1K), they are still not directly comparable due to their different origins (0ºC = 273.15K).

16
DIF is essentially the between-group difference in the probability of an item
response when the level of latent trait is the same (Mellenberg, 1994). DIF can exist as a
difference in how discriminating or how extreme the items are across groups. Difference
in item discrimination, also known as non-uniform DIF, refers to the difference in the ability
of the item to differentiate between individuals with different levels of the latent trait. The
higher the discrimination parameter, the more sensitive and the better distinguishing the
item is of individuals with different levels of the latent trait. In a sense, non-uniform DIF
suggest the item is more closely related to the latent construct in one group than the other
(Cooke, Kosson, & Michie, 2001). On the other hand, differences in item difficulty
(attractiveness), or uniform DIF, is said to exist when the thresholds for the item scores
are different across the groups. This is when individuals from different groups score
differently on particular items despite having the same latent trait standing. This may be
due to different responding styles, suppression or facilitation effects of different social
norms, or different groups having different reference points when responding to the item
(F.F. Chen, 2008). Consequently, differences in item difficulty means the symptom
becomes apparent at different levels of the latent trait for each group. Accordingly then,
items with uniform DIF may be meaningful only in one group and not the other at lower
levels of the latent trait. Of the two, non-uniform DIF poses a more serious threat to the
cross-cultural generalizability of the model because non-uniform DIF signifies differences
in the way the item relates to the underlying construct in terms of its theoretical
conceptualization, suggesting that the item could be culturally specific (Cooke et al., 2001;
Hulin, 1987).
When the expected true score at the scale level is different across the groups, it is
known as differential test functioning (DTF; Zumbo, 2003). Bias at the item level does not
automatically result in bias at the test or scale level. Differences at the item level may
cancel each other out when the scores are summed at the scale level. Nevertheless,
identifying items that are non-invariant and understanding how they function differently
across cultural groups can provide unique insights into how culture and socialization
processes can alter the meaning of the disorder, differentially shape the expression of the
disorder, and promote or suppress the levels of the traits present in different cultural
groups.

17
Within the field PPD research, Cooke, Michie, Hart, and Clark (2005a) used IRT
analysis to compare the PCL-R scores of 1,316 adult male offenders from the UK to those
of 2,067 adult male offenders and forensic psychiatric patients from North America. They
found a PCL-R score of 30 in North America was closer to a PCL-R score of 28 in the UK
in terms of the actual severity of PPD, with the affective symptoms of the disorder being
the most invariant across the two cultures. Interpersonal and behavioral aspects, on the
other hand, were most vulnerable to the pathoplastic effects of cultures.
1.3.2. Mean and Covariance Structure (MACS) Analysis
An alternative approach to evaluating measurement equivalence and detecting
DIF is mean and covariance structure analysis (MACS; Sörbom, 1974). Unlike IRT which
is based on nonlinear models, MACS analysis belongs to a class of methodology known
as structural equation modeling (SEM). It can be thought of as an extension to the
standard MG-CFA (Little, 1997). Accordingly, MACS posits a linear relationship between
the latent trait and the observed response according to the equation
𝑥 = 𝜏 + 𝛬xξ + 𝛿
where 𝑥 is a vector of m Χ 1 observed variables; 𝜏 is the intercept; ξ is the latent factor; 𝛬x
is an m Χ 1 factor loading matrix; and 𝛿 is a m Χ 1 vector of residuals or measurement
errors. Traditional CFA model assumes 𝜏 to be zero and does not estimate it. Whereas
CFA tests for measurement equivalence based on analysis of the covariance structure,
MACS analysis considers both the covariance and the mean structures (González-Romá
& Hernández, 2006; Little, 1997). The inclusion of mean structure allows for (a)
simultaneous validation of the hypothesized factorial structure in each group; (b) testing
of cross-group equivalence of the reliable measurement parameters, correcting for
measurement error variance; (c) detecting between-group differences in latent construct’s
mean, variance, and covariance; and (d) testing hypotheses about culture differences on
the constructs (J. Lee, Little, & Preacher, 2011; Little, 1997).
The links between IRT and MACS have been well articulated elsewhere and will
not be reviewed in detail here (e.g., Chan, 2000; Elosua & Wells, 2013; Raju, Laffitte, &

18
Byrne, 2002; Reise, Widaman, & Pugh, 1993; Stark, Chernyshenko, & Drasgow, 2006).
Briefly, the MACS model has similar structure as the two-parameter IRT model
(Mellenberg, 1994). Differences in intercept parameters in MACS DIF analysis correspond
to differences in item difficulty/attractiveness levels in IRT. Interpreted within the MACS
framework, the higher the intercept, the more attractive or less difficult the item is in the
sense there is stronger endorsement of the item on average2. The loading parameters
correspond to the discrimination parameters; items with higher loading differentiate
between individuals with different levels of the trait better.
To quantify the effect of item-level DIF, Nye and Drasgow (2011) developed an
effect size index defined as
𝑑𝑀𝐴𝐶𝑆 = 1
𝑆𝐷𝑖𝑃√∫(�̂�𝑖𝑅 − �̂�𝑖𝐹 |𝜉)2 𝑓𝐹(𝜉)𝑑𝜉
where 𝑆𝐷𝑖𝑃 is the pooled standard deviation of item i, �̂�𝑖𝑅 is the reference group’s mean
predicted response, �̂�𝑖𝐹 is the focal group’s mean predicted response, and 𝑓𝐹(𝜉) is the
ability density of the latent factor in the focal group. Consequently, the DTF can be
quantified as
𝑑𝐷𝑇𝐹 = 1
𝑆𝐷𝑆𝑃[∑ ∫(�̂�𝑖𝑅 − �̂�𝑖𝐹 |𝜉) 𝑓𝐹(𝜉)𝑑𝜉
𝑛
1
]
in which item-level differences are summed across all n items and allowed to cancel out
each other (i.e., not squared) and then divided by the pooled standard deviation of the
scale, 𝑆𝐷𝑆𝑃. Because these indices use the pooled standard deviation, they are
comparable to Cohen’s (1988) d.
2 In IRT, the higher the b- (threshold) parameters, the more difficult/less attractive the item, and the more extreme one needs to be on the trait to receive a score on the item. This would be tantamount to having lower intercepts within the MACS context. In MACS analysis, the higher intercepts indicate the relative ease to score on the items even at low levels of the trait. For more a complete explication about the relationship between the MACS factor loadings and intercept parameters and the IRT a- and b- parameters, see Lord and Novick (1968) and McDonald (1999).
19
There are a few advantages to the MACS analysis that makes it particularly
attractive for evaluating measurement invariance and detecting DIF in this case.
Foremost, IRT typically require sample sizes of over 500 per group, although sample sizes
of over 1,000 per group are more typical, to obtain accurate parameter estimates,
especially for polytomous cases (Reise et al., 1993). MACS analysis, on the other hand,
has been shown in previous stimulation studies to have acceptable power and Type I error
rates for detecting medium-sized uniform and non-uniform DIF with sample sizes as low
as 200 using free-baseline strategies (González-Romá & Hernández, 2006; Hernández &
González-Romá, 2003; J. Lee et al., 2011; Stark et al., 2006). In fact, González-romá and
Hernández’s study (2006) showed that MACS analysis continued to demonstrate
acceptable power and Type I error rates even when the sample size was reduced to 100
per group. DIF detection with IRT is also more complicated in that one must decide on an
appropriate model that would adequately describe the way people response to the items
(Stark et al., 2006). A variety of item response models with different mathematical
functions have been developed, and their fit has to be each examined empirically before
DIF analysis can be performed. Additionally, while IRT methods are confined to testing
DIF in unidimensional scales, MACS can be used to test DIF across multiple latent
constructs, including second-order factor models (Byrne & Stewart, 2006), and across
multiple groups simultaneously. It is not possible to assess the measurement equivalence
of the association between different latent factors using IRT. Another disadvantage of the
IRT method is that it only has likelihood ratio chi-square test, which is extremely sensitive
to sample size, as a measure of model fit. In contrast, MACS analysis has the plethora of
fit indices that corrects for large sample sizes to help evaluate model fit (Chan, 2000).
Further, in addition to detecting DIF, the MACS model can simultaneously present latent
trait parameter values and test the between-group differences (Chan, 2000). Unless
specifically interested in examining between-group differences in tendency to endorse
specific options, MACS analysis is the recommended approach for polytomous data when
the sample size is smaller than 1,000 (J. Lee et al., 2011; Stark et al., 2006).

20
1.4. The Current Study
The overarching aim of this study was to evaluate the generalizability of PPD, as
measured by the self-ratings on the CAPP, across individualistic and collectivistic cultures
in an undergraduate sample. To do so, the measurement invariance of the CAPP and
identified items that had DIF, across attitudinal and normative median split IND and COL
groups using MACS analysis were assessed. The subsidiary aim of this study was to
unpack the role of culture, specifically IND-COL, on the expression of PPD. If PPD is
indeed an extreme manifestation of an individual’s IND orientation, then IND attitude
scores would be expected to correlate with CAPP self-ratings. In addition, if the expression
of the disorder is affected by socialization and enculturation processes as theorized, then
the association between individual’s IND-COL attitudes and CAPP would be expected to
be a function of the broader cultural syndrome and social norms.
Psychopathic traits are thought to exist on a continuum (Hart & Cook, 2012) and
thus meaningful to study in a non-forensic population. Studying psychopathic traits in
community samples can contribute to the understanding of PPD by extricating the core
personality features of the disorder from the confounding correlates of criminality (Belmore
& Quinsey, 1994). It also sidesteps the problem having the strong selection biases within
the criminal justice systems enhance or mask ethnic differences (Skeem et al., 2004).
Additionally, undergraduate samples have the added advantage of being relatively free
from comorbid disorders. They are also generally better respondents on self-report
measures given their higher level of literacy.
Based on previous findings comparing North Americans, Western Europeans
(Cooke et al., 2005a), Eastern Europeans (Wilson et al., 2014), and Middle Easterners
(Shariat et al., 2010), I expected differences in item functioning in the interpersonal and
behavioral domains. In contrast, I expected items in the affective domains to be most
invariant, and therefore the most diagnostic of the disorder pan-culturally.
For the second research question examining the role of culture on the expression
of PPD, I expected attitudinal IND-COL to be correlated with the CAPP such that those

21
who endorsed a stronger individualistic orientation would score higher in terms of their
CAPP self-ratings. Secondly, I expected this association between attitudinal IND-COL and
CAPP self-ratings to be moderated by syndromal and normative levels IND-COL.

22
Chapter 2. Method
2.1. Participants
Participants were 775 (32% male) Simon Fraser University undergraduate
students recruited in exchange for course credits. The data of one participant was
excluded in the final analysis due to excessive missing data. Thus, the final sample
consisted of 774 (32% male) undergraduate students between the ages of 17 and 38 (M
= 19.5, SD = 2.36). In terms of their ethnicity, 41% identified as East Asian, 30% as White
Caucasian/European, 16% as South Asian, 7% as South East Asian, 1% as
Aboriginal/First Nation, and 5% as Others.
A substantial minority reported being foreign born (n = 276; 36%), and the age at
which they arrived in Canada ranged between 2 months to 21 years old (M = 10.2, SD =
6.1). Among the foreign born participants, 60% reported being born in East Asia (e.g.,
China, Hong Kong, Korea, Taiwan, etc.), 12% in either North America or Europe (e.g.,
United States, United Kingdom, Sweden, etc.), 11% South East Asia (e.g., The
Philippines, Malaysia, Thailand, Singapore, etc.), and 9% South Asia (e.g., India,
Pakistan, etc.); a total of 35 countries were listed as country of birth. The percentage of
foreign born participants in the three major ethnic groups were as follows: 52% of East
Asians, 31% of South Asians/South East Asians, and 15% of White
Caucasians/Europeans reported they were born outside of Canada.
2.2. Procedure
Participants registered for the study through the Research Participation System
(RPS). They were then provided a link and a unique password to the online survey that
could be access from any internet-connected computer and participants completed the
survey at their leisure. The Remark Web Survey Software 5.0 was used for the online
survey, which was hosted on a secure web server. Prior to starting the questionnaire,
participants were provided information about the nature of the study as well as the

23
researcher’s contact information should they have any questions regarding the study
before participating. Participants had to select the checkbox indicating they read and
consent to the study before they could proceed. Participants who declined to consent were
automatically exited from the survey. The data collected from participants is securely
stored on Simon Fraser University computing server. Ethics approval was received from
Simon Fraser University’s Office of Research Ethics.
2.3. Materials
2.3.1. Demographic Variables
Participants were asked to report their gender, age, ethnicity, country of residence,
country of origin/country of birth, age arrived in Canada, education level, and familial
income. No other identifying information was collected.
2.3.2. Psychopathic Traits Measure
Comprehensive Assessment of Psychopathic Personality (CAPP). The
CAPP (Cooke et al., 2004, 2012) is a new personality-based model developed using a
lexical approach to capture the full range of PPD symptoms. It consists of 33 symptoms,
each elaborated by three adjectives or adjectival phrases. The 33 symptoms are rationally
organized into six domains: Attachment, Behavior, Cognition, Dominance, Emotion, and
Self. In this study, participants rated on a 4-point scale (0 = not at all like me, 3 = very like
me) how characteristic each item is of them. These ratings were ratings of personality
traits rather than symptom endorsements as there was no assessment of the functional
impairments associated with the items. The self-ratings on the 33 items were summed to
derive a total score, which could range from 0 to 198, with higher scores indicating greater
levels of psychopathy. The CAPP total score demonstrated excellent internal consistency
(α = .90) in the current sample.

24
2.3.3. Cultural Measures
The cultural dimension of IND-COL was measured four ways in this study, using
the shortened INDOL scale (Hui & Yee, 1994) to assess at the individual-attitudinal level,
the Normative IND-COL scale (Fischer et al., 2009) to assess at the perceived cultural
context level, participant’s self-identified ethnic group to assess at the ethnicity-syndromal
level, and finally, the Hofstede’s IDV index based on their country of origin to assess at
the country-syndromal level.
Shortened INDCOL Scale (ATT). Hui’s (1988) original INDCOL scale and the
shortened version (Hui & Yee, 1995) were developed to measure IND-COL attitudes in
individuals, with high scores reflecting high COL. The Shortened INDCOL was developed
as an improvement over the original scale, both in terms of the length of the scale as well
as the psychometric properties. It consists of 36 items rated on a 6-point scale (0 = strongly
disagree, 5 = strongly agree). The scale has been well-validated and used in cross-cultural
research of various disciplines including psychology, business, consumer and
organizational research (Oyserman et al., 2002). Importantly, studies have shown support
for the measurement equivalence of the INDCOL scale across a number of different
cultures (Robert, Lee, & Chan, 2006). The Shortened INDCOL scale was used in this
study to measure culture on the individual attitudinal level. The Cronbach’s alpha for the
overall Shortened INDCOL is typically reported to be between high .60s to high .70s
(Grimm, Church, Katigbak, & Reyes, 1999; Hui & Yee, 1999; Vogt & Laher, 2009). The
internal consistency of the Shortened INDCOL scale was acceptable in the current sample
(α = .75).
Normative IND-COL Scale (NORM). Instead of measuring personal
preferences or attitudes, the Normative IND-COL Scale measures descriptive group
norms (Fischer et al., 2009). It was designed much like a semantic differential scale with
22 opposite pairs of individualistic (e.g., “Most people act in line with their rights”) and
collectivistic (e.g., “Most people act in line with their group norms and duties”) statements.
Participants rated on a 7-point scale which of the two statements was more typical of
members of their self-identified ethnic group (1 = strongly agree with the first statement, 7

25
= strongly agree with the second statement). Having such statement anchors not only help
contextualize the items but also avoids the problem of frequency or typicality statements
having different meaning across cultural groups. The scale yields four attribute subscales
score of Self (5 items), Structure of Goals (5 items), Rational vs. Relational Concern (6
items), and Norms vs. Attitudes (6 items) and a total score. Higher scores represent higher
perceived COL norms, and the theoretical score range from 22 to 154. Only the total
scores were used in this study to measure culture on a perceived group normative level.
Initial validation with samples from 11 cultures demonstrated good psychometric
properties with adequate agreement within cultures and evidence for convergent and
divergent validity (Fischer et al., 2009). The Normative IND-COL total score had good
internal consistency in the current sample (α = .88).
Hofstede’s country IDV index (IDV). Participants’ self-reported country of
origin were used to calculate their country-level relative’s IND-COL based on Hofstede’s
(2001) IDV (Individualism versus Collectivism) indices. A low IDV score indicates high
COL. These indices were derived from Hofstede’s IBM study of national cultural
differences that took place between 1967 and 1973 with 117,000 individuals in 71
countries with updates and replications done in 2001 and 2010 (Hofstede & Minkov, 2010;
Hofstede, 1980, 2001). Because these scores are meant to be interpreted only in
comparison with each other and the relative scores have been shown to be quite stable
over time, they can be considered up to date (Hofstede & Minkov, 2010). In general, Asian
countries were generally found to be more collectivistic and North American and Western
European countries more individualistic (Hofstede, 2001).
2.4. Data Analytic Plan
2.4.1. MACS Analysis
All analyses were conducted using STATA 13.1 (StataCorp, 2013). Cross-cultural
generalizability of the CAPP across attitudinal and normative IND and COL groups were
analyzed using MACS analysis. A previous Monte Carlo stimulation demonstrated free-

26
baseline MACS analysis with sample size of 250 had power and Type I error rate of .88
and .03, respectively, when the DIF is small (Stark et al., 2006). When the DIF is large,
the power and Type I error rate were 1.00 and .06, respectively (Stark et al., 2006).
Attitudinal and normative IND and COL groups were formed based on median splits on
the attitudinal and normative IND-COL measures. The measurement invariance analysis
outlined below was repeated with both attitudinal and normative median-split groups to
investigate how different conceptualization and measurement of culture might affect the
measurement of cross-cultural PPD.
Because testing for measurement invariance begins with a factor model that can
be simultaneously fitted across the IND and COL groups, the first step of the data analysis
was to find a structural model that would fit well to each group. In the event that a global
one-factor model did not produce a good fit to either of the groups, exploratory factor
analysis would be carried out to find alternative factor solutions. A model’s fit was
evaluated by several absolute and relative fit indices, specifically, the root mean square
error of approximation (RMSEA), the non-normed fit index (NNFI), the comparative fit
index (CFI), and the chi-squared statistics. The RMSEA should be below 0.08 and the
NNFI and CFI should be more than .90 to indicate acceptable fit (Kline, 1998). The chi-
square value should be relatively low and statistically non-significant, although chi-square
tends to inflated in large sample sizes anyway (Browne & Cudeck, 1993). Generally, given
several model alternatives, the most appropriate one is the one consistent with theoretical
considerations while providing the best fit to the data, as evidenced by the fit indices.
Maximum likelihood (ML) estimation is typically the default method for confirmatory factor
analytic models such as these, given its robustness against most normality distribution
assumption violations. Previous Monte Carlo studies, however, have shown multivariate
skewness and kurtosis to drastically bias parameter estimations (Benson & Fleishman,
1994; Yuan, 2005). Given that the distribution of severe psychopathic traits was unlikely
to be normally distributed in an undergraduate sample, there was concern that this might
lead to biased statistics and inappropriate inferences. As such, it was decided a priori that
if the data displayed significant skewness and kurtosis, the asymptotic distribution free
(ADF) option in STATA 13.1, which does not make any normality assumptions, would be
used instead.
27
Once an equivalent-form factor structure that could fit each group well separately
was identified, measurement invariance was tested following on the MACS testing
strategies recommended by Lee, Little, and Preacher (2011). This is a three-stage testing
procedure that has been shown to be robust against potential misspecification of baseline
models and choosing of biased anchors, even in sample size of 100 (J. Lee et al., 2011).
A multi-group configural invariance model, in which all the measurement parameters were
freely estimated, was first fitted to the data as a baseline model (M1). Omnibus metric
invariance (M2) was tested in stage two by constraining the factor loadings to be equal
across groups and comparing it with the baseline model. In cases where the metric
invariance held, omnibus scalar invariance (M3) with both the factor loadings and
intercepts constrained to be equal across groups were then tested in the third stage. The
models were considered to be invariant if, when compared against the baseline model,
∆χ² was non-significant at α = .05 and ∆CFI was less than - 0.01 (G.W. Cheung &
Rensvold, 2002).
For models where metric invariance was not tenable, free-baseline MACS DIF
analysis with Bonferroni-corrected likelihood ratio test was conducted to examine each
item separately for non-uniform DIF (J. Lee et al., 2011). To identify and scale the
structural equation model, the factor loading and intercept of one of the item is
conventionally set to unity across all groups. This item is known as the referent. Valid DIF
analysis hinges upon the assumption that the referent item is invariant. However, in
practice, this item is often chosen arbitrarily. As Cheung and Rensvold (1999) and others
have demonstrated, if this assumption is incorrect, there can be serious ramifications for
item-level DIF analysis and may lead to very misleading results: invariant items can be
erroneously detected as having DIF, whereas items that did have DIF may be missed
(G.W. Cheung & Lau, 2011; E.C. Johnson, Meade, & DuVernet, 2009; Stark et al., 2006).
A more empirically validated method for identifying referent item is the factor-ratio test
proposed by Cheung and Rensvold (1999). This entails systematically estimating and
examining all possible models with each items set as the referent and then comparing it
to the baseline model to identify the invariant referent. Although highly labor intensive—a
total of n(n - 1)/2 models need to be estimated, where n is the number of items in the
factor—given lack of a priori knowledge about which items would most likely be invariant

28
across IND-COL groups and the serious ramifications associated with using the wrong
items as referents, it was decided that the factor-ratio test was necessary. Once an
invariant referent item was identified, non-uniform DIF was determined to be present if ∆χ²
was significant at the Bonferroni-corrected α-level for the corresponding test items (J. Lee
et al., 2011; Stark et al., 2006). The loading parameters of items showing non-uniform DIF
were allowed to be freely estimated in the partial metric invariance model and remained
unconstrained through the subsequent analysis. If the model failed to show scalar
invariance, items were then examined for uniform DIF. Items were considered to display
uniform DIF if the ∆χ² was significant at the Bonferroni-corrected α-level when comparing
the respective models with the item’s intercept constrained to be equal across groups
against the full or partial metric invariance model that was identified in the earlier stage.
The effect sizes of item-level DIF and scale-level DTF were calculated using the respective
indices developed by Nye and Drasgow (2011) as discussed above. The magnitude of
non-equivalence in this study was interpreted according to guidelines suggested by Nye
and Drasgrow (2012), wherein the lower bounds for small, medium, and large effects are
0.15, 0.30, and 0.45, respectively. These guidelines were empirically derived based on a
stimulation study and a review the extant research on the sizes of DIF encountered in
previous measurement non-equivalence studies (Nye & Drasgow, 2012).
2.4.2. Multiple Regression
For the second part of the analysis, multiple regression analyses were conducted
to examine how the three levels of IND-COL were related to the CAPP score. The
variables were entered into the model in a hierarchical fashion with attitudinal IND-COL
entered as the first block, and syndromal and normative IND-COL entered as the second
block. Interaction terms were entered in the third block to examine if social norms and
broader cultural syndromes interacted with individual’s attitudinal IND-COL to affect their
expressions of PPD.

29
Chapter 3. Results
3.1. Data Screening and Preliminary Analyses
Mean imputation was used to handle missing data. Multivariate outliers in the
CAPP were screened using an algorithm proposed by Billor, Hadi, Velleman (2000) based
on Mahalanobis’ distance, and none of the cases were identified as an outlier at α = .15.
However, examinations of the multivariate skewness and kurtosis in the CAPP self-ratings
revealed substantial multivariate non-normality in the data, CAPP: Mardia’s skewness
coefficient = 128.58, p < .001; Mardia’s kurtosis coefficient =1419.00, p < .001. The
distributions of the scores were positively skewed.
Examination of the means, standard deviations, and histograms suggested there
was a good range and variability in the ATT and NORM IND-COL scores in this sample.
No univariate outliers were identified in the ATT and NORM IND-COL scales. In addition,
assumptions of univariate normality were supported in the examinations of skewness,
kurtosis and the Shapiro-Wilk tests (ATT: S-W’s V = 1.71, p = .10; NORM: S-W’s V = 1.88,
p = .06).
3.1.1. Ethnicity and Correlational Analyses of Cultural Measures
For theoretical interests reason and because of the relatively small numbers in
some of the ethnic groups, ethnic comparisons were only conducted between East Asians
(n = 316), South and South East Asians (n = 179)3, and Caucasians (n = 234). The means
and standard deviations for each of the cultural measure for the three major ethnic groups
are reported in Table 3.1.
3 South Asians and South East Asians were combined to form one group. There were no
significant differences in their ATT and NORM IND-COL scores.
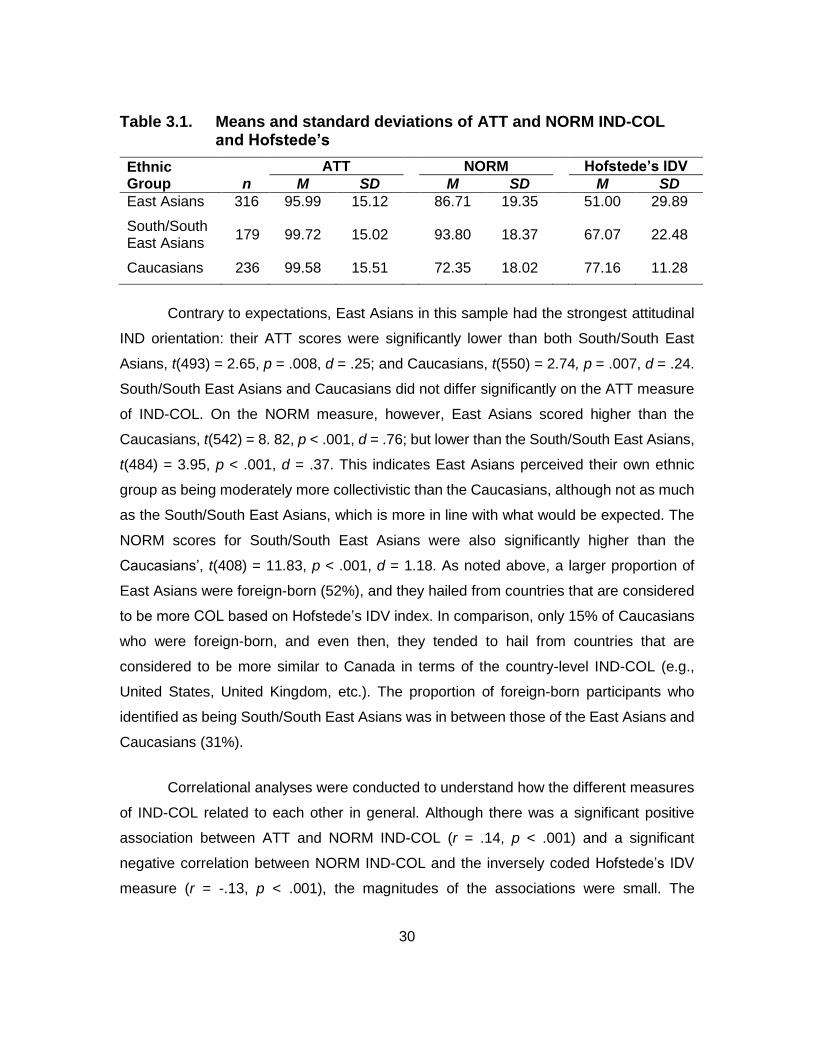
30
Table 3.1. Means and standard deviations of ATT and NORM IND-COL and Hofstede’s
Ethnic Group n
ATT NORM Hofstede’s IDV
M SD M SD M SD
East Asians 316 95.99 15.12 86.71 19.35 51.00 29.89
South/South East Asians
179 99.72 15.02 93.80 18.37 67.07 22.48
Caucasians 236 99.58 15.51 72.35 18.02 77.16 11.28
Contrary to expectations, East Asians in this sample had the strongest attitudinal
IND orientation: their ATT scores were significantly lower than both South/South East
Asians, t(493) = 2.65, p = .008, d = .25; and Caucasians, t(550) = 2.74, p = .007, d = .24.
South/South East Asians and Caucasians did not differ significantly on the ATT measure
of IND-COL. On the NORM measure, however, East Asians scored higher than the
Caucasians, t(542) = 8. 82, p < .001, d = .76; but lower than the South/South East Asians,
t(484) = 3.95, p < .001, d = .37. This indicates East Asians perceived their own ethnic
group as being moderately more collectivistic than the Caucasians, although not as much
as the South/South East Asians, which is more in line with what would be expected. The
NORM scores for South/South East Asians were also significantly higher than the
Caucasians’, t(408) = 11.83, p < .001, d = 1.18. As noted above, a larger proportion of
East Asians were foreign-born (52%), and they hailed from countries that are considered
to be more COL based on Hofstede’s IDV index. In comparison, only 15% of Caucasians
who were foreign-born, and even then, they tended to hail from countries that are
considered to be more similar to Canada in terms of the country-level IND-COL (e.g.,
United States, United Kingdom, etc.). The proportion of foreign-born participants who
identified as being South/South East Asians was in between those of the East Asians and
Caucasians (31%).
Correlational analyses were conducted to understand how the different measures
of IND-COL related to each other in general. Although there was a significant positive
association between ATT and NORM IND-COL (r = .14, p < .001) and a significant
negative correlation between NORM IND-COL and the inversely coded Hofstede’s IDV
measure (r = -.13, p < .001), the magnitudes of the associations were small. The

31
association between ATT IND-COL and Hofstede’s IDV was not significant (r = -.02, p =
.675), which is consistent with the notion that these cultural measures are hierarchically
organized from measuring the more individual and attitudinal aspects of IND-COL to
indexing IND-COL on broader and more syndromal levels. When analyzed by the three
ethnic groups, a significant difference in the correlation between ATT and NORM IND-
COL was found between the East Asians and the Caucasians (rEA = .07, p = .20; rC = .28,
p < .001; Fisher’s Z = -2.52, p = .01, q = .22). That is, for East Asians, their perception of
the normative IND-COL was not related to their personal IND-COL orientation (rEA = .07,
p = .20); whereas for Caucasians, their perception of cultural norms was associated with
their personal IND-COL orientation.
3.2. Exploratory and Confirmatory Factor Analysis
A global one-factor model with all 33 CAPP items and a six-factor model directly
corresponding to the thematic CAPP domains both did not produce good fit when fitted to
the data as a whole, 1-factor model: χ²(495) = 2789.25; CFI = .701; NNFI = .681; SRMR
= .068; RMSEA = .078, 90% CI [.075, .080]; 6-factor model: χ²(480) = 2497.38; CFI = .737;
NNFI = .711; SRMR = .068; RMSEA = .074, 90% CI [.071, .077]. As such, an exploratory
factor analysis (EFA) was conducted in attempts to identify the internal structure of the
CAPP ratings.
To avoid capitalizing on chance, the EFA was conducted using a separate
independent sample drawn from the same larger research study. With the exception that
these participants did not complete the cultural measures, they were similar in terms of
recruitment strategies, measurement procedures, and demographics. Specifically, this
derivation sample consisted of 574 (35% male) undergraduate students from Simon
Fraser University, aged between 17 and 37 (M = 19.9, SD = 2.15). Their self-reported
ethnicity breakdown is as follows: 46% identified as East Asians, 30% as
Caucasians/European, 19% as South Asians, and 6% as Others.

32
EFA was conducted using principal axis factor analysis with oblique promax
rotation. An examination of eigenvalues (i.e., eigenvalues > 1) and the scree plot
suggested a three-factor solution that accounted for 87% of the variance. The first three
eigenvalues were 7.88, 1.53, and 1.30, and accounted for 87% of variance, respectively.
Results from both Horn’s (1965) Parallel Analysis (PA) and the Minimum Average Partial
(MAP) method of Velicer (1976) also indicated the presence of a three-factor structure.
Thus, a three-correlated-factor solution was retained (Table 3.2). The first factor was
composed of 13 items and appears to reflect the dominance aspect of the disorder, hence
labelled Dominance (DOM). The second factor was composed of 11 items and appears
to reflect deficient emotional experience and attachment and relationship problems, hence
labelled Deficient Attachment (DA). The final factor was composed of nine items and
appears to reflect problems with inhibition and organization, hence labelled
Disorganized/Disinhibited (DIS). To an extent, these three factors appear to reflect similar
facets as those of Cooke and Michie’s (2001) three factor model that posits PPD is
underpinned by Arrogant and Deceitful Interpersonal Style, Deficient Affective Experience,
and Impulsive and Irresponsible Behavioral Style.
Table 3.2. Factor Loadings from Derivative Sample
DOM DA DIS
Sense of invulnerability (S) .68 .00 -.17
Self-aggrandizing (S) .61 .05 .01
Self-centred (S) .56 .07 .12
Sense of entitlement (S) .56 -.02 .12
Domineering (D) .49 .05 .15
Manipulative (D) .49 .22 .00
Lacks anxiety (E) .48 .24 -.28
Intolerant (C) .44 .16 .10
Sense of uniqueness (S) .44 -.33 -.02
Aggressive (B) .42 .22 .07
Disruptive (B) .41 .05 .24
Reckless (B) .41 -.01 .22
Garrulous (D) .28 .09 .16
Detached (A) .01 .59 .10
Uncaring (A) .21 .57 -.03
Lacks emotional depth (E) -.02 .56 .02

33
Uncommitted (A) .20 .51 -.01
Unempathic (A) .41 .48 -.13
Deceitful (D) .22 .46 .08
Lacks pleasure (E) -.24 .44 .29
Lacks remorse (E) .40 .41 -.16
Suspicious (C) .01 .39 .22
Unreliable (B) .11 .37 .21
Insincere (D) .34 .35 .04
Lacks concentration (C) -.06 -.01 .62
Lacks emotional stability (E) -.01 .05 .52
Lacks planfulness (C) -.03 .22 .41
Unstable self-concept (S) .04 .29 .39
Lacks perseverance (B) -.03 .32 .39
Self-justifying (S) .11 .02 .37
Restless (B) .28 -.36 .36
Antagonistic (D) .24 .18 .31
Inflexible (C) .15 .05 .30
Note. Domains of the respective are indicated in brackets; A = Attachment domain, B = Behavioral domain, C = Cognitive domain, D = Dominance domain, E = Emotional domain, and S = Self domain. Factor loadings ≥ |.30| are bolded and underlined.
The means, standard deviations, Cronbach’s alpha, skewness and kurtosis for
each of the three factors in the study sample are summarized in Table 3.3. To maximize
the power, this three-factor model was first tested with confirmatory factor analysis using
the full study sample. The fit of the three-factor model was fair, χ²(477) = 1910.82; CFI =
.813; NNFI = .793; SRMR = .063; RMSEA = .062, 90%CI [.060, .065]. Considering the
complexity of the model, number of parameters, and the low communalities (Marsh, Hau,
& Grayson, 2005; Meade & Bauer, 2007), the model could have been accepted as
appropriate. However, because the model had to be fitted to multi-groups with smaller
sample sizes, this overall three-factor model was discarded in favor of examining each of
the three factors of DOM, DA, and DIS separately, before examining the overall CAPP
model as a whole.

34
Table 3.3. Descriptive Statistics and Alpha Coefficients of DOM, DA, DIS
Factors M SD Skewness Kurtosis Alpha
DOM (13 items) 10.35 6.18 0.52 2.80 .83 DA (11 items) 6.05 5.07 0.87 3.18 .83 DIS (9 items) 8.76 4.38 0.17 2.47 .72
3.3. Measurement Invariance across Normative IND-COL Groups
To compare the CAPP measurements across individualistic and collectivistic
cultures, two sets of two groups were created based on the median spilt on the NORM
and ATT IND-COL scales. The results for the ATT median-split groups are presented in
the next section.
The means, standard deviations, Cronbach’s alpha, skewness and kurtosis for
each of the three factors by median-spilt NORM IND-COL groups are summarized in Table
3.4. None of the cases was identified as a multivariate outlier, although assumptions about
multivariate normality were again violated. As such, the ADF option was used instead of
the usual ML approach.
3.3.1. DOM Factor
Configural Invariance (M1). Table 3.5 shows the DOM single factor model had
good fit in the N-IND (the median-spilt individualistic group based on normative IND-COL
measure) and N-COL (the median-spilt collectivistic group based on normative IND-COL
measure) groups separately, as well as to the two groups simultaneously. This multi-group
configural invariance model served as the baseline model against which subsequent
comparisons were made. Overall, this indicated the factor was defined by the same
symptoms across both N-IND and N-COL groups: the DOM factor had zero and non-zero
loadings on the same items in both cultures.
Metric Invariance (M2). When the factor loadings were constrained to be equal
across N-IND and N-COL groups, the model resulted in practical, ∆CFI = -.018, and

35
significant, ∆χ²(12) = 27.86, p = .005, decline in model fit (Table 3.5). This indicated the
assumption that the model is metrically invariant across N-IND and N-COL groups was
untenable. The factor-ratio test identified Sense of entitlement as an invariant item suitable
to act as the referent. Two items were identified by the free-baseline MACS analysis to
have non-uniform DIF at the Bonferroni-corrected α-level (.05/13): Aggressive, λN-IND = .42
and λN-COL = .25; ∆χ²(1) = 14.70, p < .001, dMACS = .67; and Self-centred, λN-IND = .56 and
λN-COL = .46; ∆χ²(1) = 12.03, p < .001, dMACS = .29. The loading parameters of these items
were allowed to be freely estimated to derive a partial metric invariance model (partial M2,
see Table 3.5). They remained unconstrained through the subsequent test for scalar
invariance. The lower factor loadings for both items in the COL group suggest these items
are less central to the latent DOM factor among those who reported more COL group
norms. As an illustration, the item functioning plot showing non-uniform DIF for Aggressive
is given in Figure 3.1.
Scalar Invariance (M3). Scalar invariance was tested by constraining both
factor loadings and intercepts to be equal across groups for the rest of the items that were
not showing non-uniform DIF. Compared to the partial metric invariant model, there was
no significant nor practical decline in the model fit, indicating the rest of the items
demonstrated scalar invariance (see Table 3.5).
When examined at the scale level, the effect of the item-level DIF was small and
resulted in the IND group scoring only 0.35 points higher than the COL group on the DOM
scale (dDTF = .07). The test functioning plot for DOM is given in Figure 3.2. An examination
of the factor loadings revealed Sense of entitlement and Self-aggrandizing had the highest
factor loadings, whereas Sense of uniqueness had the lowest factor loading, indicating
these were the items that were thought to be the most and least central to the latent DOM
factor, respectively (Table 3.6). For the intercepts, Aggressive, Disruptive, and Intolerant
had the lowest intercepts, indicating they were unpopular (i.e., least endorsed or difficult)
items. On the other hand, Sense of Uniqueness had the highest intercept, denoting
conceptually low thresholds for endorsement.

36
Table 3.4. Descriptive Statistics and Alpha Coefficients of DOM, DA, DIS by Median-split NORM IND-COL Groups
Factor
NORM IND-COL median-split group n M SD Skewness Kurtosis
Mardia’s skewness coefficient
Mardia’s kurtosis
coefficient Alpha
DOM N-IND 373 10.26 6.50 0.67 3.02 25.17 245.07 .85 N-COL 390 10.38 5.85 0.31 2.44 19.77 228.60 .82 DA N-IND 373 5.95 5.20 0.85 2.84 39.18 218.20 .83 N-COL 390 6.08 4.87 0.75 2.71 32.40 211.86 .82 DIS N-IND 373 8.59 4.58 0.28 2.40 9.37 115.60 .74 N-COL 390 8.91 4.19 0.07 2.57 7.30 106.14 .71
Note. The Mardia’s skewness and kurtosis coefficients were significant for all at p < .001.

37
Table 3.5. Results of Measurement Invariance tests for DOM, DA, and DIS factors across N-IND and N-COL groups.
Model χ² df RMSEA NNFI CFI ∆χ² ∆df p ∆CFI
DOM
M0 N-IND 93.23 61 .038 CI [.021 - .052 ] .892 .915 M0 N-COL 96.45 57 .042 CI [.027 - .056] .894 .922 M1 197.76 118 .042 CI [.032 - .042] .881 .910 M2 225.62 130 .044 CI [.035 - .049] .871 .892 27.86 12 .005 -.018 Partial M2 210.30 128 .041 CI [.035 - .055] .887 .907 12.54 10 .250 -.003 M3 220.58 138 .040 CI [.031 - .049] .895 .907 10.28 10 .416 .000 DA
M0 N-IND 53.06 37 .034 CI [.007 - .054] .909 .939 M0 N-COL 48.03 37 .028 CI [.000 - .048] .933 .955 M1 101.02 70 .034 CI [.018 - .048] .904 .939 M2 115.22 80 .034 CI [.019 - .047] .905 .931 14.20 10 .164 -.008 M3 153.43 90 .043 CI [.031 - .055] .847 .875 38.31 10 < .001 -.056 DIS
M0 N-IND 43.83 26 .043 CI [.019 - .064] .899 .927 M0 N-COL 33.20 23 .034 CI [.000 - .058] .919 .948 M1 77.22 46 .042 CI [.025 - .058] .889 .929 M2 85.86 54 .039 CI [.023 - .055] .904 .928 8.64 8 .374 -.001 M3 100.38 62 .040 CI [.025 - .054] .899 .913 14.52 8 .069 -.016
Note. CI represents 90% confidence interval. RMSEA = root mean square error of approximation; NNFI = nonnormed fit index; CFI = comparative fit index. Underlined values indicate invariance was not held at that level.

38
Table 3.6. Factor Loadings and Intercepts for the Partial Scalar Invariant Model for DOM across N-IND and N-COL groups.
Item
λ (SE) τ (SE)
N-IND N-COL N-IND N-COL
Self-aggrandizing (S) .57 (.02) .68 (.03)
Sense of entitlement (S) .57 (.02) .76 (.03)
Sense of invulnerability (S) .50 (.03) .63 (.03)
Intolerant (C) .48 (.02) .48 (.03)
Manipulative (D) .47 (.02) .57 (.03)
Domineering (D) .45 (.02) .78 (.03)
Reckless (B) .39 (.03) .75 (.03)
Disruptive (B) .35 (.03) .43 (.03)
Lacks anxiety (E) .34 (.03) .71 (.03)
Garrulous (D) .33 (.03) .73 (.03)
Sense of uniqueness (S) .24 (.03) 1.58 (.03)
Aggressive (B) .42 (.03) .25 (.03) .40 (.03) .29 (.03)
Self-centred (S) .56 (.03) .46 (.03) .67 (.03) .59 (.04)
Figure 3.1. Plot of the Item Functioning for Aggressive showing non-uniform DIF (dMACS = .67) across NORM IND and COL groups.
0.5
11
.52
Me
an
pre
dic
ted
re
spo
nse
0 1 2 3Latent trait
IND
COL

39
Figure 3.2. Plot of the Test Functioning for DOM across NORM IND and COL groups showing little DTF (dDTF = .07).
3.3.2. DA Factor
The above steps testing the nested configural, metric, and scalar invariance
models were repeated for the DA factor, and the fit information are presented in Table 3.5.
The single DA factor model had excellent fit when fitted separately to N-IND and N-COL
groups and when fitted simultaneously across both groups in a multi-group model, fulfilling
the baseline requirement of a configural invariant model. There was no significant or
practical decline in model fit when the metric invariant model was fitted to the data, which
signified the metric invariance model was tenable. However, practical and significant
decline in model fit was noted when the factor loadings and intercepts were constrained
to test for scalar invariance, indicating scalar invariance was not tenable, ∆χ²(10) = 38.21,
p < .001, ∆CFI = -.056. The factor-ratio test identified Uncaring as an invariant item suitable
to act as the referent. MACS DIF analyses identified Unreliable, ∆χ²(1) = 15.45, p < .001,
dMACS = .34; and Suspicious, ∆χ²(1) = 8.40, p < .004, dMACS = .48; as having substantial
01
02
03
0
Me
an
pre
dic
ted
re
spo
nse
0 1 2 3Latent trait
IND
COL

40
uniform DIF, although in different directions. Their respective intercepts are reported in
Table 3.7. Figure 3.3 shows the item functioning plot for the uniform DIF in Suspicious.
The item-level DIF cancelled out each other at the scale-level, and their combined
impact on the test functioning was negligible (raw score difference = 0.09, dDTF = .02). An
examination of the factor loadings revealed Insincere and Deceitful were the most
discriminating items, whereas Lacks pleasure and Unreliable were least discriminating.
Uncommitted, Unreliable, and Uncaring had the lowest intercepts, indicating they were the
least popular items.
Table 3.7. Factor Loadings and Intercepts for the Partial Scalar Invariant Model for DA across N-IND and N-COL groups.
Item
λ (SE) τ (SE)
N-IND N-COL N-IND N-COL
Insincere (D) .46 (.02) .45 (.03)
Deceitful (D) .44 (.02) .38 (.02)
Suspicious (C) .43 (.03) .89 (.04) .70 (.04)
Detached (A) .41 (.03) .61 (.03)
Uncaring (A) .40 (.02) .25 (.02)
Unempathic (A) .39 (.02) .29 (.02)
Lacks emotional depth (E) .38 (.03) .65 (.03)
Uncommitted (A) .37 (.02) .25 (.02)
Lacks remorse (E) .36 (.03) .40 (.03)
Lacks pleasure (E) .31 (.03) .84 (.03)
Unreliable (B) .31 (.02) .25 (.02) .36 (.03)

41
Figure 3.3. Plot of the Item Functioning for Suspicious showing uniform DIF (dMACS = .48) across NORM IND and COL groups.
3.3.3. DIS Factor
The fit indices for the nested models for the single DIS factor are presented in
Table 3.5. In sum, the single factor DIS model had a good fit to the data and demonstrated
configural and metric invariance. However, as with DA, there was a practical reduction in
the goodness-of-fit when the scalar invariant model was fitted to the data, although this
was not significant, ∆χ²(8) = 26.86, p = .069, ∆CFI = -.015. The factor-ratio test identified
Unstable Self-concept as an invariant item suitable to act as the referent. Nevertheless,
MACS analyses for uniform DIF identified three items as being non-invariant: Lacks
perseverance, ∆χ²(1) = 8.71, p = .003, dMACS = .29; Lacks planfulness, ∆χ²(1) = 8.05, p =
.004, dMACS = .27; and Lacks concentration, ∆χ²(1) = 7.91, p = .005, dMACS = .23. All three
items had higher intercepts that suggested a greater ease of endorsement of these items
in the COL group (see Table 3.8).
.51
1.5
22
.5
Me
an
pre
dic
ted
re
spo
nse
0 .5 1 1.5Latent trait
IND
COL

42
An examination of the item parameters suggest Lacks concentration was the most
discriminating, whereas Restless was the least discriminating of the indicators for DIS. In
terms of item difficulty, the most difficult item to endorse was Antagonistic, and the easiest
items were Lacks concentration and Restless. Because of the item-level DIF, the IND
group scored 0.37 points lower than the COL group on the DIS scale (dDTF = .11).
Table 3.8. Factor Loadings and Intercepts for the Partial Scalar Invariant Model for DIS across N-IND and N-COL groups.
Item
λ (SE) τ (SE)
N-IND N-COL N-IND N-COL
Lacks concentration (C) .64 (.03) 1.29 (.05) 1.39 (.06)
Lacks planfulness (C) .52 (.03) .79 (.04) .92 (.05)
Unstable self-concept (S) .52 (.03) .64 (.04)
Lacks emotional stability (E) .42 (.03) 1.00 (.04)
Lacks perseverance (B) .42 (.03) .53 (.03) .64 (.04)
Self-justifying (S) .37 (.03) 1.07 (.03)
Antagonistic (D) .35 (.03) .52 (.03)
Inflexible (C) .32 (.04) 1.09 (.03)
Restless (B) .28 (.04) 1.30 (.03)
3.3.4. CAPP Total
Since there were no substantial DTF at the scale-level for the three DOM, DA, and
DIS factors, their respective item scores were summed to create three subscale scores.
A one-factor model with a PPD factor indicated by the three subscales was then modelled
to examine the association between the global PPD factor and the three constituent
factors. This model was invariant at the configural, metric, and scalar levels, indicating the
three DOM, DIS, and DA factors were associated with the global PPD factor in the same
way across NORM IND-COL groups. There was no difference in the Total CAPP score
due to item-level DIF; they cancelled each other out, and the overall effect at the total
score level was negligible (raw score difference = 0.07, dDTF = .006). The plot of the three
subscales’ test functioning indicated DOM was the most discriminating and DIS was the
least discriminating scales overall (Figure 3.4).

43
Figure 3.4. Plot of the Test Functioning for DOM, DA, and DIS subscales across latent trait PPD.
3.3.5. Discussion
The factor structures for all three DOM, DA, and DIS factors and for the overall
PPD factor were similar across both normative IND-COL groups. This suggests these
constructs are conceptually equivalent and PPD is defined by the same three facets and
each facet is defined by similar symptoms. However, there is some evidence of cross-
cultural variations. When measuring culture as a set of normative behaviors and values,
collectivistic norms appeared to impact the way the PPD is expressed, particularly in terms
of interpersonal style. Specifically, Aggressive and Self-Centred had lower factor loadings
in the COL group than IND group with DIF of large and medium effect sizes, respectively.
This meant Aggressive and Self-Centred were less discriminating, or less central to, the
latent trait DOM among individuals who reported stronger COL norms. In fact, Aggressive
was one of the least discriminating item of PPD in the COL group. In other words, PPD is
not typically expressed as violent, aggressive, and threatening in cultures where there are
05
10
15
20
25
Me
an
pre
dic
ted
re
spo
nse
0 5 10 15 20 25
Latent trait
DOM
DA
DIS

44
perceived stronger COL norms. In terms of uniform DIF, Unreliable, Lacks Perseverance,
Lacks Planfulness, and Lacks Concentration had higher intercepts for the COL group.
That is, individuals who reported perceiving stronger COL norms were more likely to
endorse these items even at lower levels of latent trait. In contrast, Suspicious had a lower
intercept in the COL group, meaning this symptom was suppressed and less likely to be
endorsed until higher levels of the latent trait. Nevertheless, these differences did not
substantially impact the overall test at both the scale and total score levels.
3.4. Measurement Invariance across Attitudinal IND-COL Groups
Table 3.9 reports the means, standard deviations, Cronbach’s alpha, skewness
and kurtosis for each of the three factors by median-spilt ATT IND-COL groups. MACS
analyses were conducted using ADF due to the significant skewness and kurtosis in the
data.
The fit indices for the individual, configural, metric, and scalar invariance models
for DOM, DA, and DIS factors are reported in Table 3.10. All three factors satisfied
conditions for configural and metric invariance, but not scalar invariance. Factor-ratio tests
indicated the three items identified as referents in the previous analysis were also invariant
across ATT IND-COL groups and thus were used as referents in this analysis. MACS
analyses revealed Sense of invulnerability, ∆χ²(1) = 12.68, p < .001, dMACS = .29; and
Sense of uniqueness, ∆χ²(1) = 8.92, p = .003, dMACS = .61, of the DOM factor had uniform
DIF. The variant and invariant factor loadings and intercepts are reported in Table 3.11.
Both Sense of invulnerability and Sense of uniqueness had higher intercepts and were
more attractive to those who personally endorsed stronger COL orientation. However, the
effect of this on the DOM subscale score was negligible (dDTF = .05). They only scored
0.28 points higher than their IND counterparts at the scale level due to DIF.
For DA factor, Detached, ∆χ²(1) = 18.54, p < .001, dMACS = .45, and Lacks pleasure,
∆χ²(1) = 8.06, p = .004, dMACS = .47, had uniform DIF (Table 3.12). These items had higher

45
intercepts in the IND group, resulting in them scoring an average of 0.37 points higher
than the COL group on the DA scale due to DIF. This represented a small effect (dDTF =
.09).
Finally, for DIS factor, Restless, ∆χ²(1) = 8.69, p = .003, dMACS = .91, had uniform
DIF across ATT IND-COL groups (Table 3.13). Although at the item level, this represents
a substantial DIF, its effect on the scale was very small (dDTF = .06). The COL group scored
an average of 0.21 points higher on the overall DIS scale due to the uniform DIF on
Restless.
The very small dDTF at the subscale levels indicated the subscale scores were
comparable across groups. These subscales were then used to examine the overall model
with a global PPD factor indicated by three subscales. Whereas there was configural
equivalence when this model was fitted across ATT IND-COL groups, metric equivalence
was not tenable, ∆χ²(1) = 5.20, p = .023, ∆CFI = -.011. MACS DIF analyses indicated non-
uniform DIF for the Deficient Attachment subscale, with it being less central to the
construct of PPD in the COL group; IND, λ = .94, τ = -3.25, and COL, λ = .75, τ = -2.38;
∆χ²(1) = 4.94, p = .027, dMACS = .40. Partial scalar invariance was achieved when the
parameters for Deficient Attachment were freely estimated. The non-uniform DIF due to
DA at the subscale level translated to a small dDTF of .14 at the Total CAPP scale level,
with a 1.48 point suppression in the COL group. Figure 3.5 shows the non-uniform DIF
plot for DA for the ATT IND and COL groups.

46
Table 3.9. Descriptive Statistics and Alpha Coefficients of DOM, DA, DIS by Median-split ATT IND-COL Groups
Factor
ATT IND-COL median-split
group n M SD Skewness Kurtosis
Mardia’s skewness coefficient
Mardia’s kurtosis
coefficient Alpha
DOM A-IND 386 11.36 6.34 0.35 2.58 18.59 226.49 .84 A-COL 388 9.33 5.84 0.69 3.20 27.07 245.37 .83 DA A-IND 386 7.48 5.43 0.64 2.73 25.88 188.58 .83 A-COL 388 4.61 4.24 1.00 3.42 51.22 249.07 .79 DIS A-IND 386 9.56 4.48 0.14 2.43 6.01 105.30 .72 A-COL 388 7.97 4.13 0.12 2.37 10.69 114.91 .71
Note. The Mardia’s skewness and kurtosis coefficients were significant for all at p < .001.
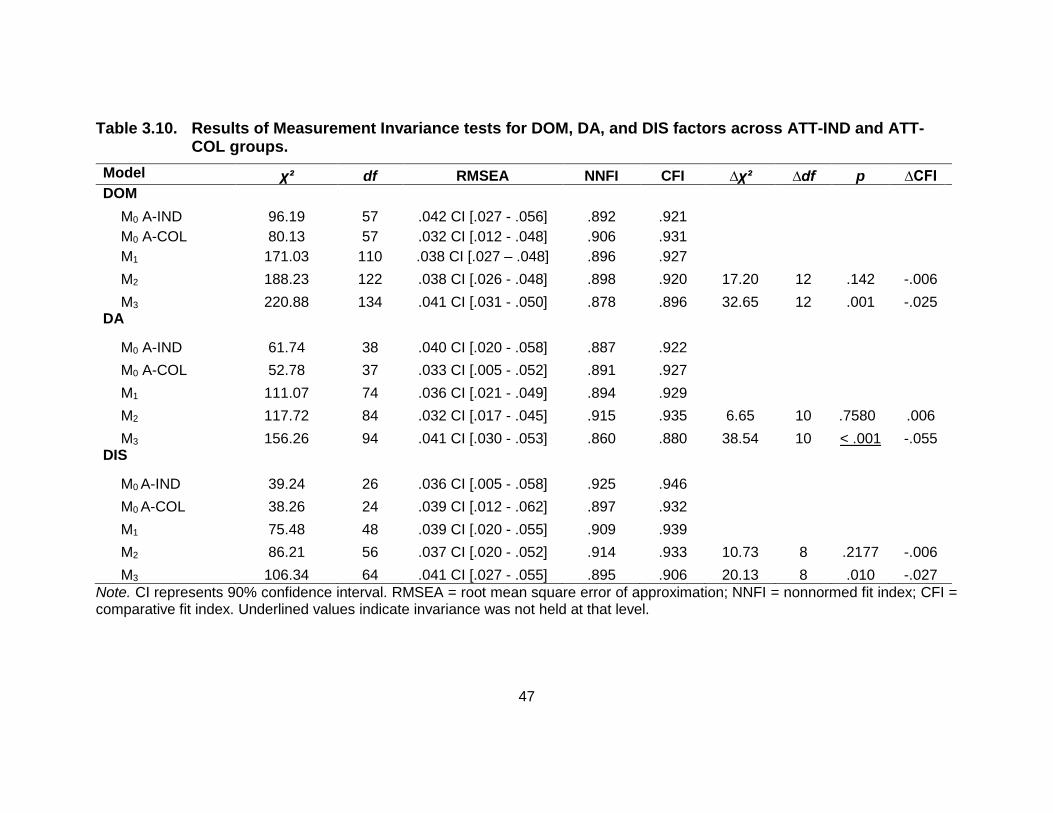
47
Table 3.10. Results of Measurement Invariance tests for DOM, DA, and DIS factors across ATT-IND and ATT-COL groups.
Model χ² df RMSEA NNFI CFI ∆χ² ∆df p ∆CFI
DOM
M0 A-IND 96.19 57 .042 CI [.027 - .056] .892 .921 M0 A-COL 80.13 57 .032 CI [.012 - .048] .906 .931 M1 171.03 110 .038 CI [.027 – .048] .896 .927 M2 188.23 122 .038 CI [.026 - .048] .898 .920 17.20 12 .142 -.006 M3 220.88 134 .041 CI [.031 - .050] .878 .896 32.65 12 .001 -.025 DA
M0 A-IND 61.74 38 .040 CI [.020 - .058] .887 .922 M0 A-COL 52.78 37 .033 CI [.005 - .052] .891 .927 M1 111.07 74 .036 CI [.021 - .049] .894 .929 M2 117.72 84 .032 CI [.017 - .045] .915 .935 6.65 10 .7580 .006 M3 156.26 94 .041 CI [.030 - .053] .860 .880 38.54 10 < .001 -.055 DIS
M0 A-IND 39.24 26 .036 CI [.005 - .058] .925 .946 M0 A-COL 38.26 24 .039 CI [.012 - .062] .897 .932 M1 75.48 48 .039 CI [.020 - .055] .909 .939 M2 86.21 56 .037 CI [.020 - .052] .914 .933 10.73 8 .2177 -.006 M3 106.34 64 .041 CI [.027 - .055] .895 .906 20.13 8 .010 -.027
Note. CI represents 90% confidence interval. RMSEA = root mean square error of approximation; NNFI = nonnormed fit index; CFI = comparative fit index. Underlined values indicate invariance was not held at that level.

48
Table 3.11. Factor Loadings and Intercepts for the Partial Scalar Invariant Model for DOM across A-IND and A-COL groups.
λ (SE) τ (SE)
Item A-IND A-COL A-IND A-COL
Garrulous (D) .32 (.03) .80 (.03)
Domineering (D) .45 (.02) .90 (.03)
Disruptive (B) .34 (.03) .53 (.03)
Sense of uniqueness (S) .27 (.03) 1.60 (.04) 1.73 (.04)
Reckless (B) .34 (.03) .84 (.03)
Self-aggrandizing (S) .56 (.02) .82 (.03)
Intolerant (C) .43 (.02) .55 (.03)
Sense of invulnerability (S) .48 (.03) .69 (.04) .82 (.04)
Lacks anxiety (E) .32 (.03) .81 (.03)
Manipulative (D) .49 (.02) .71 (.03)
Sense of entitlement (S) .53 (.02) .89 (.03)
Aggressive (B) .37 (.02) .42 (.02)
Self-centred (S) .54 (.02) .79 (.03)
Table 3.12. Factor Loadings and Intercepts for the Partial Scalar Invariant Model for DA across A-IND and A-COL groups.
λ (SE) τ (SE)
Item A-IND A-COL A-IND A-COL
Lacks pleasure (E) .24 (.03) .97 (.04) .80 (.04)
Lacks emotional depth (E) .37 (.03) .73 (.03)
Detached (A) .37 (.03) .81 (.04) .62 (.04)
Suspicious (C) .36 (.03) .90 (.03)
Insincere (D) .42 (.02) .56 (.03)
Unreliable (B) .29 (.02) .37 (.02)
Unempathic (A) .34 (.02) .36 (.03)
Lacks remorse (E) .33 (.02) .48 (.03)
Uncommitted (A) .32 (.02) .26 (.02)
Uncaring (A) .35 (.02) .34 (.03)
Deceitful (D) .38 (.02) .45 (.03)

49
Table 3.13. Factor Loadings and Intercepts for the Partial Scalar Invariant Model for DIS across A-IND and A-COL groups.
λ (SE) τ (SE)
Item A-IND A-COL A-IND A-COL
Antagonistic (D) .31 (.02) .60 (.03)
Inflexible (C) .31 (.03) 1.21 (.03)
Restless (B) .27 (.04) 1.27 (.04) 1.48 (.08)
Self-justifying (S) .34 (.03) 1.16 (.03)
Lacks planfulness (C) .49 (.03) 1.00 (.04)
Lacks emotional stability (E) .43 (.03) 1.14 (.04)
Lacks concentration (C) .60 (.03) 1.51 (.04)
Lacks perseverance (B) .38 (.02) .69 (.03)
Unstable self-concept (S) .47 (.03) .78 (.04)
Figure 3.5. Plot of the Test Functioning for the DA subscale showing non-uniform DTF (dDTF = .40) across ATT IND and COL groups.
05
10
15
20
Me
an
pre
dic
ted
re
spo
nse
0 5 10 15 20 25
Latent trait (PPD)
IND
COL

50
3.4.1. Discussion
Again, there was evidence to support syndromal equivalence of all three DOM,
DA, and DIS and the overall PPD factors across attitudinal IND-COL groups. Further,
when examining the lower level DOM, DA, and DIS factors, none of the items showed
non-uniform DIF, suggesting the items were equally discriminating across both groups. In
other words, the items were equally important to the respective DOM, DA, and DIS latent
factors across both groups. There was, however, a lack of scalar invariance in that
individuals who endorsed stronger COL attitudes also had a greater tendency to endorse
items such as Sense of invulnerability, Sense of uniqueness, and Restless even at lower
levels of the trait. Conversely, they were less likely to endorse Lacks pleasure and
Detached, meaning there was a suppression of these symptoms and they only become
apparent at higher levels of the trait. More noteworthy is the fact that DA as a scale was
less discriminatory of PPD in the COL group, which suggest the disorder is less strongly
expressed in terms of deficient emotional experiences and attachment for those who
endorsed greater COL personal orientations. Such finding makes sense when considering
that one of the hallmarks of collectivism is valuing relationships and bonding with others
(Oyserman et al., 2002). Nevertheless, the differences due to this non-uniform DIF in DA
translated only to a small DTF at the total score level.
3.5. Measurement Invariance across Ethnic Groups
Because of the smaller sample size for the South/South East Asians (i.e., less than
200), measurement invariance analyses were conducted only between Caucasians (n =
234) and East Asians (n = 316). Recall East Asians in this sample endorsed slightly
greater individualistic personal orientations but perceived their ethnic group to have more
collectivistic group norms (see Table 3.1, p. 28). Table 3.14 reports the means, standard
deviations, Cronbach’s alpha, skewness and kurtosis for each of the three factors for
Caucasians and East Asians. Even though it was previously decided that ADF was the
more appropriate method when there is significant skewness and kurtosis in the data, the
ADF method tended to produced more negative bias when sample sizes are small
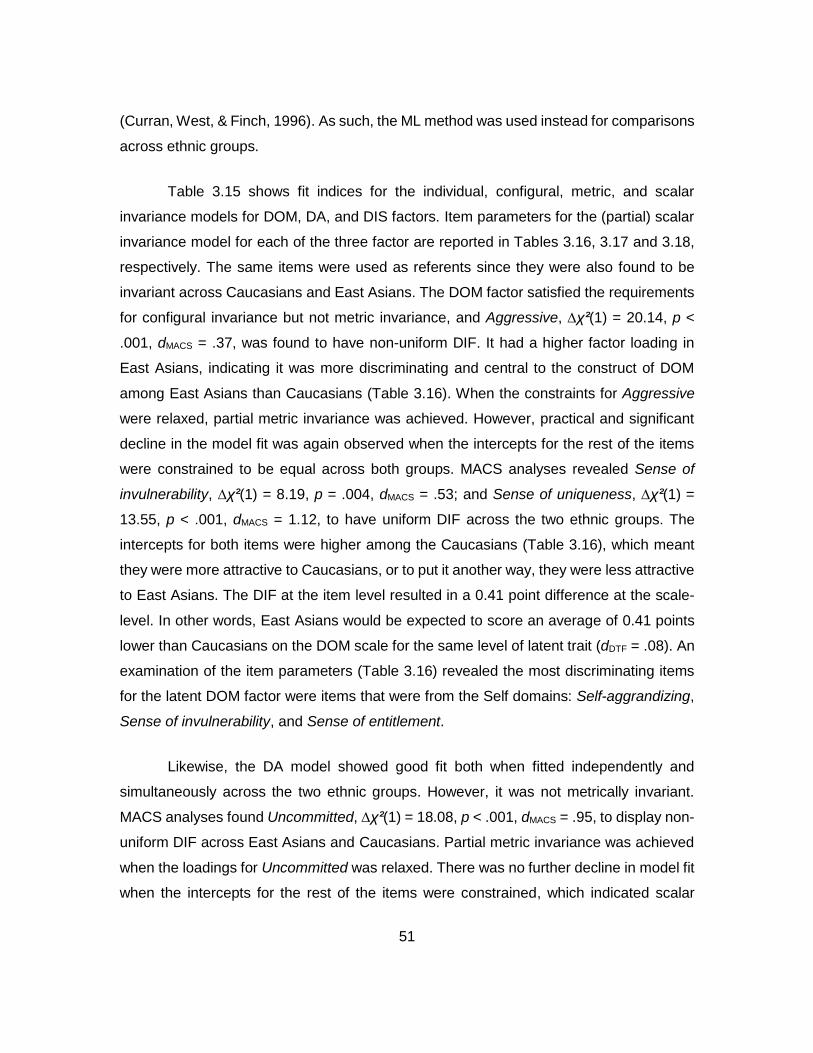
51
(Curran, West, & Finch, 1996). As such, the ML method was used instead for comparisons
across ethnic groups.
Table 3.15 shows fit indices for the individual, configural, metric, and scalar
invariance models for DOM, DA, and DIS factors. Item parameters for the (partial) scalar
invariance model for each of the three factor are reported in Tables 3.16, 3.17 and 3.18,
respectively. The same items were used as referents since they were also found to be
invariant across Caucasians and East Asians. The DOM factor satisfied the requirements
for configural invariance but not metric invariance, and Aggressive, ∆χ²(1) = 20.14, p <
.001, dMACS = .37, was found to have non-uniform DIF. It had a higher factor loading in
East Asians, indicating it was more discriminating and central to the construct of DOM
among East Asians than Caucasians (Table 3.16). When the constraints for Aggressive
were relaxed, partial metric invariance was achieved. However, practical and significant
decline in the model fit was again observed when the intercepts for the rest of the items
were constrained to be equal across both groups. MACS analyses revealed Sense of
invulnerability, ∆χ²(1) = 8.19, p = .004, dMACS = .53; and Sense of uniqueness, ∆χ²(1) =
13.55, p < .001, dMACS = 1.12, to have uniform DIF across the two ethnic groups. The
intercepts for both items were higher among the Caucasians (Table 3.16), which meant
they were more attractive to Caucasians, or to put it another way, they were less attractive
to East Asians. The DIF at the item level resulted in a 0.41 point difference at the scale-
level. In other words, East Asians would be expected to score an average of 0.41 points
lower than Caucasians on the DOM scale for the same level of latent trait (dDTF = .08). An
examination of the item parameters (Table 3.16) revealed the most discriminating items
for the latent DOM factor were items that were from the Self domains: Self-aggrandizing,
Sense of invulnerability, and Sense of entitlement.
Likewise, the DA model showed good fit both when fitted independently and
simultaneously across the two ethnic groups. However, it was not metrically invariant.
MACS analyses found Uncommitted, ∆χ²(1) = 18.08, p < .001, dMACS = .95, to display non-
uniform DIF across East Asians and Caucasians. Partial metric invariance was achieved
when the loadings for Uncommitted was relaxed. There was no further decline in model fit
when the intercepts for the rest of the items were constrained, which indicated scalar

52
invariance was tenable. The factor loading for Uncommitted was higher in East Asians
than Caucasians, meaning it was a more discriminating item for the East Asians than it
was for Caucasians (Table 3.17). In fact, it was the least discriminating item for
Caucasians. As a result of the non-uniform DIF by Uncommitted, East Asians would be
expected to score an average of 0.31 points higher than Whites on the DA scale (dDTF =
.07). Based on the factor loadings, items that were the most central to the DA factor were
Detached, Unempathic, Deceitful, and Insincere. Again, Uncommitted, Unreliable, and
Uncaring were the least popular items, whereas Suspicious and Lacks pleasure were
easily endorsed by participants.
The DIS model satisfied conditions for configural and metric invariance, but not
scalar invariance. MACS analyses with the DIS scale revealed Lacks perseverance,
∆χ²(1) = 10.01, p = .002, dMACS = .52; Lacks planfulness, ∆χ²(1) = 9.68, p = .002, dMACS =
.51, and Lacks concentration, ∆χ²(1) = 8.48, p = .004, dMACS = .42, to have uniform DIF.
The intercepts for all three items were higher in the East Asian group, suggesting East
Asians had a greater tendency compared to their Caucasian counterparts who are on the
same latent trait standing to endorse these items. The DIF at the item-level resulted in
East Asians scoring an average of 0.66 points higher than Whites on the DIS scale due to
DIF (dDTF = .20). The rank ordering of items in terms of their factor loadings and intercepts
were similar to those obtained from models fitted across the NORM and ATT groups:
Lacks concentration was the most discriminating item as well as the easiest item to
endorse. On the other hand, although Restless had one of the highest intercepts, it had
the lowest factor loading, indicating this item may be measuring something other than the
intended DIS construct.
Given the relatively small DTF, the items are summed across the respective factors
to form the three subscales to examine the overall model with a global PPD factor.
Configural equivalence was achieved when this model was fitted across East Asians and
Caucasians but metric equivalence was not, ∆χ²(2) = 9.01, p = .011, ∆CFI = -.037. MACS
analyses indicated non-uniform DTF for the Disorganized/Disinhibited subscale, with it
being less central to the construct of PPD among East Asians, λC = .79 and λEA = .54;
∆χ²(1) = 8.64, p = .003. However, the higher intercepts for East Asians indicate the items

53
reflecting disorganization and disinhibition were more attractive to them (τC = 0.55, τEA =
3.59). This had an overall small effect size (dDTF = .22). Partial scalar invariance was
achieved when the parameters for Disorganized/Disinhibited were freely estimated. The
non-uniform DIF due to DIS at the subscale level had a negligible effect at the Total CAPP
scale level (aggregate score difference = 0.65, dDTF = .06). Figure 3.6 shows the non-
uniform DIF plot for DIS.

54
Table 3.14. Descriptive Statistics and Alpha Coefficients of DOM, DA, DIS for Caucasians and East Asians
Factor
NORM IND-COL median-split group n M SD Skewness Kurtosis
Mardia’s skewness coefficient
Mardia’s kurtosis
coefficient Alpha
DOM Caucasians 236 8.79 5.66 0.48 2.44 34.60 238.86 .83 East Asians 316 11.43 6.46 0.48 2.72 20.79 225.73 .85 DA Caucasians 236 4.85 4.91 1.16 3.51 57.92 241.40 .85 East Asians 316 7.23 5.30 0.74 3.14 25.88 188.69 .83 DIS Caucasians 236 7.48 4.35 0.64 2.95 13.88 115.56 .75 East Asians 316 9.78 4.23 -0.07 2.64 6.80 107.07 .69
Note. The Mardia’s skewness and kurtosis coefficients were significant for all at p < .001.

55
Table 3.15. Results of Measurement Invariance tests for DOM, DA, and DIS factors between Caucasians and East Asians.
Model χ² df RMSEA NNFI CFI ∆χ² ∆df p ∆CFI
DOM
M0 Caucasians 114.63 60 .062 CI [.045 - .080] .904 .926 M0 East Asians 120.91 62 .055 CI [.040 - .069] .929 .943 M1 250.12 118 .064 CI [.053 - .075] .902 .926 M2 285.16 130 .066 CI [.056 - .076] .895 .913 35.03 12 < .001 -.013 Partial M2 274.30 129 .064 CI [.053 - .074] .901 .918 24.18 11 .012 -.007 M3 323.66 140 .069 CI [.059 - .079] .885 .897 49.36 11 < .001 -.022 DA
M0 Caucasians 137.39 41 .100 CI [.082 - .119] .849 .887 M0 East Asians 106.73 40 .073 CI [.056 - .090] .906 .932 M1 173.93 74 .070 CI [.057 - .084] .919 .945 M2 216.58 84 .076 CI [.063 - .088] .905 .928 42.65 10 < .001 -.018 Partial M2 202.65 83 .072 CI [.060 - .085] .913 .935 28.73 9 .001 -.010 M3 221.23 92 .071 CI [.059 - .084] .916 .929 18.58 9 .029 -.005 DIS
M0 Caucasians 50.34 23 .071 CI [.044 - .098] .886 .927 M0 East Asians 57.10 26 .062 CI [.040 - .083] .858 .897 M1 115.60 46 .074 CI [.057 - .091] .840 .898 M2 111.52 52 .065 CI [.048 - .081] .879 .912 -4.08 6 .666 .015 M3 135.84 60 .068 CI [.053 - .083] .866 .888 24.32 8 .002 -.024
Note. CI represents 90% confidence interval. RMSEA = root mean square error of approximation; NNFI = nonnormed fit index; CFI = comparative fit index. Underlined values indicate invariance was not held at that level.

56
Table 3.16. Factor Loadings and Intercepts for the Partial Scalar Invariant Model for DOM in Caucasians and East Asians.
λ (SE) τ (SE)
Item C EA C EA
Garrulous (D) .34 (.03) .87 (.04)
Domineering (D) .47 (.03) 1.00 (.04)
Disruptive (B) .36 (.03) .62 (.04)
Sense of uniqueness (S) .26 (.04) 1.85 (.07) 1.57 (.05)
Reckless (B) .38 (.04) .93 (.04)
Self-aggrandizing (S) .56 (.03) .94 (.04)
Intolerant (C) .43 (.03) .65 (.04)
Sense of invulnerability (S) .54 (.04) 1.04 (.07) .78 (.05)
Lacks anxiety (E) .35 (.04) .85 (.04)
Manipulative (D) .49 (.03) .82 (.04)
Sense of entitlement (S) .54 (.03) 1.00 (.04)
Aggressive (B) .25 (.04) .43 (.04) .45 (.04) .48 (.04)
Self-centred (S) .52 (.03) .88 (.04)
Table 3.17. Factor Loadings and Intercepts for the Partial Scalar Invariant Model for DA in Caucasians and East Asians.
λ (SE) τ (SE)
Item C EA C EA
Lacks pleasure (E) .37 (.04) .99 (.04)
Lacks emotional depth (E) .45 (.04) .84 (.04)
Detached (A) .49 (.04) .85 (.04)
Suspicious (C) .41 (.04) 1.03 (.04)
Insincere (D) .45 (.03) .65 (.04)
Unreliable (B) .29 (.02) .40 (.03)
Unempathic (A) .46 (.02) .49 (.03)
Lacks remorse (E) .43 (.03) .59 (.04)
Uncommitted (A) .24 (.03) .40 (.03) .28 (.03) .37 (.03)
Uncaring (A) .43 (.02) .43 (.03)
Deceitful (D) .45 (.03) .56 (.04)
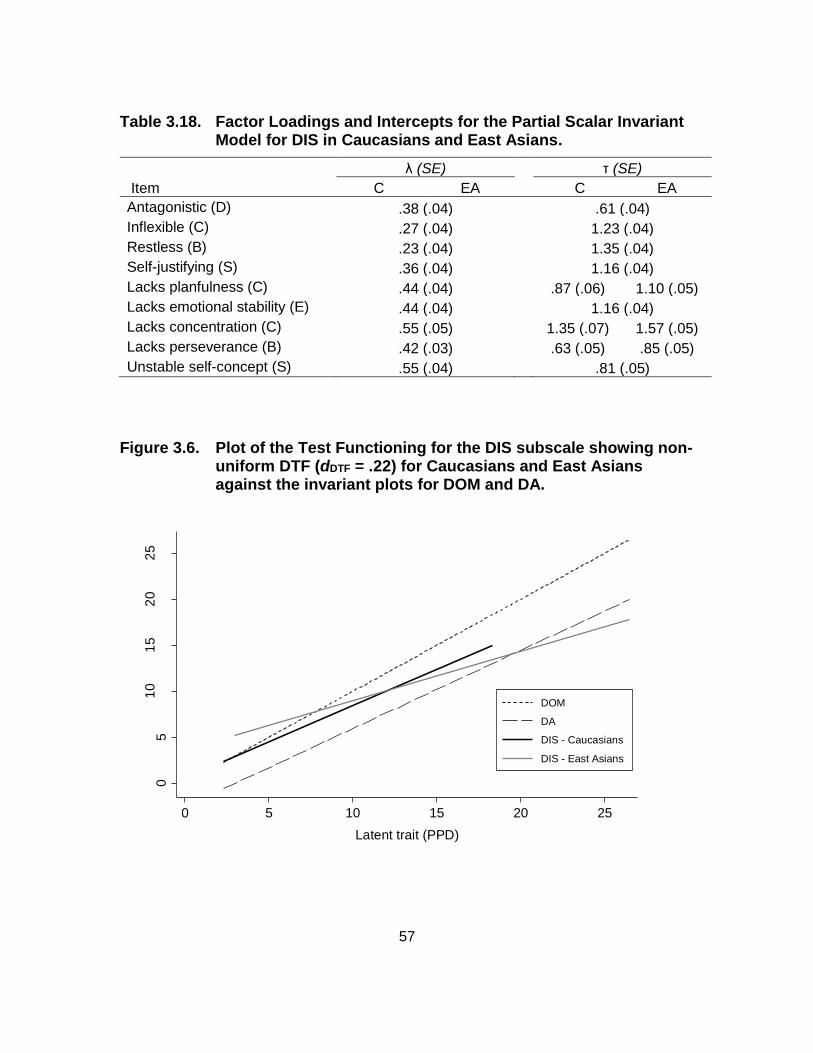
57
Table 3.18. Factor Loadings and Intercepts for the Partial Scalar Invariant Model for DIS in Caucasians and East Asians.
λ (SE) τ (SE)
Item C EA C EA
Antagonistic (D) .38 (.04) .61 (.04)
Inflexible (C) .27 (.04) 1.23 (.04)
Restless (B) .23 (.04) 1.35 (.04)
Self-justifying (S) .36 (.04) 1.16 (.04)
Lacks planfulness (C) .44 (.04) .87 (.06) 1.10 (.05)
Lacks emotional stability (E) .44 (.04) 1.16 (.04)
Lacks concentration (C) .55 (.05) 1.35 (.07) 1.57 (.05)
Lacks perseverance (B) .42 (.03) .63 (.05) .85 (.05)
Unstable self-concept (S) .55 (.04) .81 (.05)
Figure 3.6. Plot of the Test Functioning for the DIS subscale showing non-uniform DTF (dDTF = .22) for Caucasians and East Asians against the invariant plots for DOM and DA.
05
10
15
20
25
Me
an
pre
dic
ted
re
spo
nse
0 5 10 15 20 25
Latent trait (PPD)
DOM
DA
DIS - Caucasians
DIS - East Asians

58
3.5.1. Discussion
There was evidence for configural equivalence of DOM, DA, and DIS and the
overall PPD factor across East Asians and Caucasians; they had the same underlying
factor structure. However, cross-ethnic variations were also noted. Specifically,
Aggressive and Uncommitted were found to be more discriminatory among East Asians
than Caucasians with a medium and a large effect size, respectively. Aggressive being
more discriminatory in East Asians is somewhat contrary to the earlier finding that
Aggressive was less discriminatory among those who reporter stronger COL norms. The
reason for this contradiction is unclear. In terms of differences in item thresholds, it
appears that the DOM symptoms—specifically Sense of invulnerability and Sense of
uniqueness—were more easily endorsed by Caucasians, whereas the DIS symptoms—
Lacks Perseverance, Lacks Planfulness, and Lacks Concentration—were more easily
endorsed by East Asians even at lower levels of the respective latent traits. Furthermore,
even though DIS items were more easily endorsed by East Asians, DIS was found to be
less discriminatory of PPD. The effect of this at the total score level, however, was
negligible.
3.6. Additional Exploratory Analyses
As a manipulation check, the total sample was randomly split to form two equal
groups to which the same model-fitting procedure was applied. There was no evidence of
any uniform or non-uniform DIF, as would be expected, supporting the validity of this
method.
Given that there continues to be much debate about the most appropriate
approach for conducting MACS analyses, and this is the first study to use MACS to
evaluate the cross-cultural generalizability of PPD as measured by self-ratings on the
CAPP, additional exploratory analyses were performed to examine the stability of the
findings across the different approaches and group split methods. Specifically, the above
analyses with median-split NORM and ATT IND-COL groups were repeated using the ML
method. For the NORM IND-COL comparisons, there was no decline in model fit when

59
the increasingly more constrained metric and scalar models were fitted for the DOM and
DIS factors. The scalar invariant model, however, was not tenable for DA and MACS
analyses showed Unreliable to have uniform DIF (Table 3.19). For the comparisons across
ATT IND-COL groups, all three factors satisfied conditions for scalar invariance, and none
of the items were identified as having DIF. Additional analyses across the following
comparison groups were also conducted:
1) NORM extreme-split groups, comparing participants scoring on the upper and lower tertiles of the NORM scale using ML;
2) ATT extreme-split groups, comparing participants scoring on the upper and lower tertiles of the ATT scale using ML;
3) median-split groups based on Hofstede’s IDV measure using ML; and
4) median-split groups based on Hofstede’s IDV measure using ADF.
Tables 3.19, 3.20, and 3.21 summarized the parameter estimates for items that
were identified as being non-invariant for each of the three factors, respectively. Median-
split groups based on the Hofstede’s IDV index demonstrated scalar invariance for all
three factors, and no items were identified as having DIF. MACS analysis for NORM and
ATT extreme split groups and across East Asians and Caucasians were also conducted
using ADF, but the multi-group baseline models had poor fit to the data and was not
analyzed further.

60
Table 3.19. Parameter Estimates Associated with DIF Items on the DOM scale.
Group-split method
Group 1 vs. Group 2 DIF Item
Loading Intercept
ΔΧ2 p ΛIND ΛCOL τ IND ΤCOL
Extreme ATT split, ml
IND (n = 254) vs. COL (n = 268)
Sense of invulnerability
.83 1.05 17.39 <.001
Sense of uniqueness 1.54 1.83 15.33 <.001 Median Hofstede’s IDV split, adf
IND (n = 535) vs. COL (n = 239)
Sense of uniqueness 1.64 1.41 11.43 <.001 Aggressive .38 .24 9.49 .002
Table 3.20. Parameter Estimates Associated with DIF Items on the DA scale.
Group-split method
Group 1 vs. Group 2 DIF Item
Loading Intercept
ΔΧ2 p ΛIND ΛCOL τ IND ΤCOL
Extreme NORM split, ml
IND (n = 242) vs. COL (n = 256)
Unreliable .54 .98 .29 .45 11.94 <.001
Extreme ATT split, ml
IND (n = 254) vs. COL (n = 268)
Detached 1.01 .83 11.57 <.001 Lacks pleasure 1.12 .89 10.71 .001
Median Hofstede’s IDV split, adf
IND (n = 535) vs. COL (n = 239)
Unreliable .26 .36 8.28 .004

61
Table 3.21. Parameter Estimates Associated with DIF Items on the DIS scale.
Group-split method
Group 1 vs. Group 2 DIF Item
Loading Intercept
ΔΧ2 p ΛIND ΛCOL τ IND ΤCOL
Extreme ATT split, ml
IND (n = 254) vs. COL (n = 268)
Restless 1.24 1.55 12.26 <.001
Median Hofstede’s IDV split, adf
IND (n = 535) vs. COL (n = 239)
Lacks emotional stability
.94 .48 1.03 .97 10.55 .001
Inflexible .66 .33 1.14 1.10 9.70 .002

62
3.7. Multiple Regression Analyses
Correlational and hierarchical multiple regression analyses were conducted to
examine how the various levels of IND-COL were associated with the CAPP Total score.
These analyses were then repeated with the DOM, DA, and DIS factor scores to examine
if there might be aspects of PPD that were more strongly associated with culture. Given
that the differential test functioning at the total and factor CAPP score levels were
insubstantial, the raw scores were used in the following analyses.
Zero-order correlations between ATT, NORM, and IDV and the CAPP Total and
factor scores are reported in Table 3.22. As was hypothesized, attitudinal IND-COL was
significantly negatively correlated with CAPP score, although this association was only a
weak one. Stronger individualistic attitudes (i.e., lower ATT scores) was weakly associated
with higher CAPP self-rating scores. Country-level IND-COL was also significantly
associated with CAPP Total and factor scores, although this was in the opposite direction:
being from countries that were considered more collectivistic was weakly associated with
higher CAPP self-rating scores. Participants’ perceptions of the relative IND-COL norms
(i.e., NORM) were not associated with CAPP Total or factors scores.
Table 3.22. Zero-order correlations between the three INDCOL measures and CAPP Total and Factor Scores.
CAPP Total DOM DA DIS
ATT -.29** -.18** -.34** -.23**
NORM .02 .02 .00 .05
Hofstede’s IDV -.18** -.18** -.15** -.11**
Note. ** p < .001.
Steiger’s Z-tests for correlated correlation coefficients revealed ATT to be more
strongly related to DA than to DOM (Z = 5.13, p < .001) and DIS (Z = 3.36, p < .001). The
correlations between ATT and DOM and between ATT and DIS were not significantly
different (Z = 1.52, p = .128). ATT being more strongly related to DA is consistent with the

63
notion that ATT measures personal IND-COL orientation, which may not necessarily
translate into behaviors. There were no significant differences in the correlation
coefficients between IDV and the three factor scores.
Hierarchical regression on the CAPP Total scores were conducted with age and
gender entered as covariates in the first block; ATT entered as the second block; NORM,
IDV, and ethnicity entered in the third block. Two-way interactions between ATT and IDV,
NORM, and ethnicity were entered in the fourth block to examine if the associations
between attitudinal IND-COL and CAPP self-rating scores were moderated by social
norms and broader cultural syndromes. As was hypothesized, ATT was significantly
associated with CAPP Total scores, such that greater personal IND endorsement was
associated with higher CAPP Total scores (Table 3.23). In addition to greater attitudinal
IND endorsements, being East Asian and, oddly, being from countries that are considered
to be more COL based on Hofstede’s IDV index were also significantly associated with
higher CAPP Total scores. The association between ATT and CAPP Total scores was not
moderated by social norms and broader cultural syndromes.
To better understand how the different aspects of PPD are shaped and influenced
by culture, the above regression analysis was repeated with each of the three DOM, DA,
and DIS factor. As would be expected, ATT was significantly associated with all three
factors, although most significantly associated with DA (Table 3.24). However, contrary to
expectations, in addition to ATT, IDV was significantly associated with DOM and DA, but
not DIS. That is, those from countries that are considered to be more COL based on
Hofstede’s IDV index had higher DOM and DA scores. On the other hand, being East
Asian was significantly positively associated with DIS controlling for ATT. As per the
regression analysis for CAPP Total, association between ATT and CAPP factor scores
were not moderated by social norms and broader cultural syndromes. In fact, NORM was
not associated with CAPP Total and factor scores.

64
Table 3.23. Hierarchical regression analysis for culture measures predicting CAPP Total Scores.
CAPP Total Scores
β t R2 ΔR2
Block 1 .086**
Age -.04 -1.09
Gender -.28** -8.10
Block 2 .154** .068*
ATT -.25** -7.40
Block 3 .195** .041**
NORM .00 -0.02
IDV -.13** -3.65
East Asian ethnicity .12** 2.73
South/SE Asian ethnicity
.03 0.73
Block 4 .201** .006
ATT x NORM .01 0.04
ATT x IDV .39 1.56
ATT x East Asian .13 0.48
ATT x South/SE Asian .40 1.48
Note. ** p < .001.

65
Table 3.24. Hierarchical regression analysis for culture measures predicting CAPP factor Scores.
DOM DA DIS
β t R2 ΔR2 β t R2 ΔR2 β t R2 ΔR2
Block 1 .107** .091** .009*
Age .01 0.34 -.07 -2.04 -.05 -1.38
Gender .33** 9.32 .30** 8.39 -.08 -2.25
Block 2 .131** .023** .184** .093** .060** .051**
ATT -.15** -4.35 -.31** -9.10 -.23** -6.29
Block 3 .164** .034** .216 .032** .094** .034**
NORM -.02 -0.62 .00 -0.01 .03 0.80
IDV -.16** -4.27 -.11* -3.09 -.05 -1.32
East Asian ethnicity
.06 1.36 .09 2.20
.16** 3.57
South/SE Asian ethnicity
.05 1.13 -.02 -0.52
.05 1.11
Block 4 .172** .007 .226** .010 .98** .005
ATT x NORM .19 0.75 -.07 -0.3 -.16 -0.58
ATT x IDV .30 1.19 .41 1.67 .28 1.05
ATT x East Asian -.38 -1.41 .34 1.29 .53 1.89
ATT x South/SE Asian
.02 0.09 .70 2.61
.38 1.31
Note. * p < .01, ** p < .001

66
Chapter 4. General Discussion
Despite the widespread recognition of the importance of culture to the
understanding of personality and personality disorders, there is a dearth of cross-cultural
research on PPD. More than just intellectual chagrin, the lack of systematic research on
the influence of culture on the manifestation and consequences of the disorder is
particularly perturbing because of its clinical and legal applications. This study attempted
to reduce ethnocentrism in the science and practice by examining how the self-ratings of
psychopathic traits might vary across one fundamental cultural dimension, IND-COL.
Specifically, this study examined the measurement equivalence, as well as any differential
item functioning (DIF), of the CAPP across IND-COL groups using a MACS approach,
with IND-COL measured four ways across three levels. There are three main conclusions
about the cross-cultural generalizability of the CAPP self-ratings can be drawn from this
study.
4.1. Cross-Cultural Generalizability of the CAPP
Firstly, there is some preliminary evidence for a 3-factor solution for the CAPP self-
ratings. The three-factor model was intentionally kept broad in this study, but it still had a
reasonably good fit to the data and was robust across the different permutations of IND-
COL and ethnic groups. A particular strength of this study was that the model was
developed using an independent sample and then cross-validated on the current sample,
which enhances its plausibility (van de Vijver & Leung, 1997). The factor structure of PPD
and its various measures has been a matter of ongoing investigations for the past two
decade with differing supports for the 2- (Hare, 1991; Harpur, Hare, & Hakstian, 1989), 3-
(Brinkley, Diamond, Magaletta, & Heigel, 2008; Cooke et al., 2001; Cooke & Michie, 2001;
Sellbom, 2011), and 4-factor models (Kosson et al., 2013; Neumann, Hare, & Pardini,

67
2014; Vitacco, Neumann, & Jackson, 2005). The primary aim for developing a factor
model here was to allow for further cross-cultural analysis. Nevertheless, the fact that the
three factors found in the present study—Dominance (DOM), Deficient Attachment (DA),
and Disorganized/Disinhibited (DIS)—parallels to an extent Cooke and Michie’s (2001)
Arrogant and Deceitful Interpersonal Style, Deficient Affective Experience, and Impulsive
and Irresponsible Behavioral Style facets and Brinkley’s (2008) Egocentricity, Callous, and
Antisocial factors lends further support to the theoretical validity of this model.
Secondly, the syndromal structure of PPD, as operationalized by the CAPP and
indicated by DOM, DA, and DIS factors, was invariant across attitudinal and normative
IND-COL median split groups and across Caucasians vs. East Asians. This suggest the
construct of PPD is conceptually similar across IND-COL cultures. In addition, the
domineering and arrogant interpersonal aspects of the disorder consistently emerged as
the most discriminating, whereas behavioral problems relating to disinhibition and
impulsivity was consistently the least discriminating. Thirdly, even though there were a
handful of items and scales that did displayed metric and scalar differences when
comparing across IND-COL groups, these item-level biases cancelled each other out at
the test level, resulting in overall insubstantial DTF. Taken together, these results support
the cross-cultural generalizability of the CAPP and its use in individualistic and
collectivistic cultures and with East Asians and Caucasians.
4.1.1. Effects at Item Level
4.1.1.1 Items with Non-Uniform DIF
Nevertheless, it is still worthwhile to consider which items showed DIF to
understand the pathoplastic effect of culture on self-ratings of psychopathic traits. The
items that were found to display differential functioning depended to certain extent on how
IND-COL was measured: by participant’s perceived cultural context (i.e., NORM),
individual IND-COL orientation (i.e., ATT), self-identified ethnicity, or country of origin (i.e.,
based on Hofstede’s IDV index). That said, there were a few items that consistently
displayed non-uniform DIF with medium to large effect sizes. One example is Aggressive.

68
Aggressive was found to be less discriminating among those who reported perceiving
stronger COL norms but more discriminating in East Asians. The reason for this
paradoxical finding is not clear. Compared with White Europeans, East Asians have been
known to exhibit higher levels of dialectical thinking and less consistency in their self-
conceptions (S.X. Chen, Benet-Martínez, & Ng, 2014), and this may explain the
inconsistent findings on the CAPP self-ratings. It is also possible that this result is related
to acculturation issues given the greater proportion of foreign born participants in the East
Asians group. Previous studies with such bicultural individuals who have been exposed to
East Asian and Western cultures have found their self-perceptions to be quite drastically
different depending on which of their two cultures was primed (S.X. Chen et al., 2014; S.X.
Chen, 2015; Ross, Xun, & Wilson, 2002; Sik Hung Ng & Lai, 2009). Although there was
not priming or cultural frame switching involved in this study, it is possible that responding
to items about their personality and culture in English may have primed a more
Westernized conception of themselves, resulting in greater endorsement of IND attitudes
and higher ratings on CAPP items that appear more desirable in a Western context. This
may also explain the odd pattern of associations between ATT, NORM, and IDV found for
East Asians.
Regardless, the results suggest aggression may relate to PPD differently in
collectivistic and East Asian cultures than in individualistic and Western cultures. As
discussed earlier, the behaviors effective in asserting dominance and gaining power and
control is different in different cultures (Bergeron & Schneider, 2005; Bond, 2004;
Mesquita & Walker, 2003; Triandis, 2000). Thus, it is possible that in collectivistic cultures
that prize harmony and eschew direct confrontation (Hofstede, 1980; Nisbett, 2003; Sims,
2007) the domineering interpersonal facet of PPD is less expressed through overt displays
of violence and aggression. Instead, they may attempt to express dominance and assert
control through other more subtle and indirect ways (Bond, 2004; Gunsoy, Cross, Uskul,
Adams, & Gercek-Swing, 2015; Tinsley & Weldon, 2003). Although violent outcomes were
not specifically examined in this study, a logical implication if there were indeed a
suppressor effect of cultural norms on the aggressive interpersonal style associated with
PPD is that the predictive utility of PPD on violent outcomes may be limited in cultures that
has strong COL norms. Indeed, other studies have shown the association between PPD

69
and violence is moderated by ethnicity and other sociocultural factors (Asscher et al.,
2014; Edens, Campbell, & Weir, 2007; Leistico et al., 2008; Singh, Grann, & Fazel, 2011;
Walsh & Kosson, 2007; Walsh, 2012).
Other items that also showed non-uniform DIF were Unreliable and Uncommitted.
Both had higher factor loadings in the COL and East Asian groups. These items appear
to relate to interpersonal functioning and social role obligations. It is possible that being
unreliable and failing to fulfil social role obligations is more disruptive and detrimental, and
therefore more deviant and pathological, in collectivistic cultures, where there are greater
emphasis on interdependence (Hofstede, 2001; Markus & Kitayama, 1991). In fact,
Unreliable and Uncommitted were better indicators (i.e., had higher factor loadings) of DA
for the COL group than the affective items. Affective symptoms, particularly Lacks
pleasure, being less diagnostic of the disorder may be understood by considering the
cultural differences in emotional experience and expression. Although previous studies
comparing North Americans and Western and Eastern Europeans have suggested items
in the affective domain to be most culturally invariant (Cooke et al., 2005a; Shariat et al.,
2010; Wilson et al., 2014), this may not extrapolate to more collectivistic and Eastern
cultures where the context, rules, expectations, meaning, and experience of emotions are
quite different (Eid & Diener, 2001; Halberstadt & Lozada, 2011; Mesquita & Walker,
2003). Specifically, several studies have shown although the modal and preferred
emotional experience in North America is pleasure, East Asians tend to experience
“neutral” or no emotions (Eid & Diener, 2001; Matsumoto & Hwang, 2011; Mesquita &
Karasawa, 2002; Mesquita & Walker, 2003). Pleasure was also found to be less central
as a source of motivation and predictor of overall life satisfaction in collectivistic than
individualistic cultures (Diener, Oishi, & Lucas, 2003; Kitayama, Markus, & Kurokawa,
2000; Miyamoto, Ma, & Petermann, 2014). Hence, in collectivistic cultures, lacking in
pleasurable emotions may not be as problematic or dysfunctional as it would be in
individualistic cultures, which may explain its greater irrelevance to PPD.

70
4.1.1.2 Items with Uniform DIF
There were also a number of items that consistently showed uniform DIF.
Specifically, Sense of invulnerability and Sense of uniqueness on the DOM scale tended
to be endorsed more by Caucasians and those who endorsed greater COL attitudes;
whereas Lacks Perseverance, Lacks Planfulness, and Lacks Concentration on the DIS
scale tended to be endorsed by East Asians and those who reported perceiving strong
COL norms. In contrast, the endorsement of Lacks pleasure and Detached were
dampened in the attitudinal COL group. These differences in item intercepts may have
occurred due to different reasons. There may be different socialization and
enculturalization processes that have facilitated the expression of certain symptoms while
suppressing others. For instance, socialization experiences that emphasize relationships
and interconnectedness in collectivistic cultures may suppress isolative and distant
behaviors and thereby the dampened scores on Detached for those reporting greater COL
attitudes.
It is also possible that differences in item intercepts are artefacts that result from
the way people from different cultures respond to self-report measures. Specifically, two
potential sources of contamination have been identified to be particularly problematic in
cross-cultural research: response style bias and reference group effects (Church, 2010).
Response style bias (RSB) is the tendency to respond to items in particular ways that are
unrelated to the content or the intended construct (Baumgartner & Steenkamp, 2001).
Previous research has shown robust associations between particular types of response
styles and cultural orientations (Baumgartner & Steenkamp, 2001; G.W. Cheung &
Rensvold, 2000; He, Bartram, Inceoglu, & van de Vijver, 2014; T. Johnson, 2005; Morren,
Gelissen, & Vermunt, 2011). Some commonly cited response styles include acquiescence
or disacquiescence bias, extreme or middle response style, ambivalent or inconsistent
responding, and social desirability and self-enhancement bias. Specifically, Asians and
individuals from collectivistic cultures have been known to exhibit less self-enhancement
and greater self-effacing tendencies compared to North Americans (Boucher, 2009; Heine
& Hamamura, 2007). The second potential source of contamination is known as the
reference group effect (RGE). Because people rate their attributes by comparing

71
themselves with others familiar to them, people of different cultural backgrounds might
use different groups of individuals and different sets of norms as reference when they are
rating themselves (Heine, Lehman, Peng, & Greenholtz, 2002). This is akin to measuring
themselves using different rulers and can significantly skew the ratings. For example,
Heine and colleagues (2002) found North American respondents rated themselves more
independent and less interdependent than Japanese respondents when explicitly asked
to rate themselves relative to the other cultural group than when they rated themselves
with no explicit reference group. Thus, the greater endorsement on items such as Lacks
Perseverance, Lacks Planfulness, and Lacks Concentration by East Asians and those
who reported perceiving strong COL norms may be the result of these responding biases.
Importantly, RSB and RGE can impact item scores differentially, resulting in item-
level bias, or DIF, such as those discussed above. It can also have a uniform impact,
affecting all the items in the same way, in which case MACS techniques will not be able
to detect the bias. In the former case, RSB and RGE may interact with item content, item
wording, or format to result in DIF. In the latter case, the RSB and RGE have pervasive
effects on all the items, and they uniformly affect each indicator to more or less the same
degree. As a result, instead of showing item-level biases, the latent mean and variance of
the factor would be affected (Little, 1997; Meredith, 1993).To parse out the effects of
uniform RSB and RGE, these two response styles would have to be measured
independently and be included in the model as covariates.
4.2. Cultural Influences
The second aim of this study was to unpack the influence of culture on the
expression of PPD by studying IND-COL at various levels. The idea was that by focusing
on IND-COL from a subjective norm perspective and contrasting it from IND-COL as an
individual attitude, it will allow inferences to be drawn about the cultural processes and
how group norms and individual attitudes may be differentially associated with PPD. As
was hypothesized, results from the regression analyses suggest CAPP Total and factor
scores were significantly associated with individual’s IND orientation, suggesting PPD is,

72
to an extent, a manifestation of an individual’s IND orientation. This finding confirms, to an
extent, Cooke’s (1996) speculation that PPD, particularly its core interpersonal and
affective features, are associated with IND. A closer examination of the multiple regression
models of the three CAPP factors suggested different aspects of PPD may be shaped and
influenced by culture in different ways, although the direction of the associations was
contrary to expectations. Specifically, those from countries that are considered to be more
COL based on Hofstede’s IDV index had higher DOM and DA scores whereas being East
Asian was significantly associated with higher DIS scores, even after controlling for ATT.
Additionally, no interaction effects between individual’s IND-COL attitudes and broader
cultural syndrome and social norms on CAPP Total and factor scores were found, which
is again not what was expected.
As demonstrated in this study, not only is the measurement of culture necessarily
complex and multi-levelled, its effect on PPD is likely also multiplexed, making the
unpacking of cultural influences challenging. As such, it is not clear the reasons for such
unexpected findings. Further, although the measurement of INDCOL at each level was
significantly correlated in the expected direction to the next level in the hierarchical order,
the magnitudes of the correlations were small. In fact, the individual-level ATT measure
was not associated with the group-level measures of IND-COL. This finding is consistent
with other cross-cultural research that showed IND-COL was not isomorphic across levels
(Fischer, 2009; Hofstede, 1980; Taras, Rowney, & Steel, 2009). There was also no clear
pattern to the ATT and NORM IND-COL scores across the three ethnic groups, and it is
not clear how the different levels of culture relate to each other. Although perplexing, such
findings highlight the need for more nuanced understanding of culture; single numeric
index or category label is insufficient for any meaningful description or study of culture.
Further, as the results of this study demonstrated, findings cannot be generalized across
the different facets and levels of the culture.
73
4.3. Strengths and Limitations
Methodologically, the present study provides an example of how MACS (Sörbom,
1974) can be used to examine measurement equivalence and detect uniform and non-
uniform DIF on unidimensional polytomous data. Unlike most IRT models which often
require sample sizes of over 500 per group to obtain accurate parameter estimates,
especially for polytomous cases (Reise et al., 1993), MACS analysis can be used with
sample sizes as low as 200 per group and thus provides an accessible method for
examining measurement equivalence in cross-cultural studies (González-Romá &
Hernández, 2006; Hernández & González-Romá, 2003; J. Lee et al., 2011; Stark et al.,
2006). Further, as exemplified in this study, when conducting such measurement
equivalence tests, the referent item should not be selected arbitrarily as a non-invariant
indicator can greatly bias the invariance conclusion (G.W. Cheung & Rensvold, 1999).
Factor-ratio test, although tedious, performs well to identify invariant items to act as the
anchor (French & Finch, 2006).
4.3.1. Use of Undergraduate Sample
The use of a convenient undergraduate sample comes with several limitations.
Foremost, the findings may not be generalizable to other populations of interest, like
forensic and clinical populations, although recent studies have supported the validity and
utility of PPD research using non-instutionalized, college samples (Falkenbach, Stern, &
Creevy, 2014; Z. Lee & Salekin, 2010; Salekin, Trobst, & Krioukova, 2001; Sellbom, 2011).
The prevalence of severe psychopathic traits was low among in this sample of
undergraduate students, as would be expected. This resulted in range restriction issues,
which in turn attenuates the strength of the associations and lowers the communalities
when extracting the common factor. Nevertheless, the use of such sample circumvents
other potential confounds such as literacy issues or the need for translation. It is likely that
for a substantial minority of the participants, and perhaps a greater number in the
collectivistic group, English was not their first language. Although English language
proficiency was not directly assessed in this study, between group differences in the CAPP
ratings were unlikely attributable to this given that the participants were undergraduate

74
students at an English university. Moreover, the items that did show DIF did not appear to
be lexically more difficult.
4.3.2. Use of Self-Report Measures
Both a strength and a weakness of this study is that it does not utilize the “gold
standard” instrument, the PCL-R, but instead uses the CAPP. This avoids the problem of
mono-operation bias that Skeem and Cooke (2010a, 2010b) cautioned against. Using the
CAPP, which was developed as a comprehensive model of PPD, this study circumvents
the problems of conflating the measure with the construct and using operationalizations
of PPD that are too narrow and potentially culturally-biased. That said, given that the PCL-
R is the most widely accepted instrument used in clinical practice (Singh et al., 2014), it is
crucial that the cross-cultural validity of the PCL-R be examined to provide direct evidence
for its use or misuse.
The sole reliance on using self-report measures like the CAPP further presents
with a number of limitations from both personality disorder and cross-cultural research
standpoints. From a personality disorder research standpoint, there is the issue of using
self-report measures in the assessment of a personality disorder whose cardinal features
are dishonesty, egocentrism, and poor insight (Lilienfeld, 1994). Moreover, the CAPP was
used in this study as a lexical self-rating of psychopathic personality traits, rather than
ratings of symptoms of PPD per se, as functional impairments associated with the CAPP
symptoms were not assessed. Nevertheless, recent studies have found satisfactory
validity for using self-report measures to assess PPD (e.g., Levenson, Kiehl, & Fitzpatrick,
1995; Lilienfeld & Andrews, 1996; Marcus, John, & Edens, 2004; Riopka, Coupland, &
Olver, 2015; Sellbom, 2011; Vitacco, Neumann, & Pardini, 2014). Statistically, there is the
issue of shared method variance, which would artificially inflate the correlations; although,
this should have no effects on the pattern of associations or the items showing DIF.
The use of such self-report rating scales is also not ideal from a cross-cultural
research standpoint. Cross-cultural researchers have previously eschewed the use of
such scales, arguing that personality and trait attributes self-report measures are less

75
reliable and valid in collectivistic cultures compared to individualistic cultures because self-
referential behaviors and thinking are less natural and intuitive (e.g., Heine, Buchtel, &
Norenzayan, 2008; Markus & Kitayama, 1998; Sul et al., 2012). Furthermore, they contend
that personality traits are likely less predictive of behavioral outcomes in collectivistic
cultures given the greater influence of social roles, relationships, and norms (Markus &
Kitayama, 1998). Another issue with using such measures is that valid self-report ratings
assumes the individual only responds to the substantive meaning of the item. However,
as discussed above, this is rarely the case. In addition to causing bias and DIF to select
items, RSB and RGE can introduce systematic sources of measurement error and
confound cross-cultural comparisons (Baumgartner & Steenkamp, 2001). Although MACS
analysis is able identity items that are differentially affected by these measurement
artifacts, it cannot distinguish between systematic RSB and RGE and cultural effects
(Little, 2000). To examine the systematic impact of these various possible forms of biases,
they have to be measured independently and be included in the model as covariates
(Little, 2000).
Using observer or expert rating scales, such as the PCL-R or the CAPP-IRS
(Cooke, Hart, Logan, et al., 2004), may address some of these issues. However, they are
not without their own set of challenges. For one, there is the potential issue of rater effects.
Depending if the raters are of the same cultural background, there could be potential
misdiagnosis of symptoms due to raters’ unfamiliarity with the examinee’s language,
interpersonal style, culture, values, and expressions. On the other hand, if the raters are
of the same cultural background, then there is still the issue of reference group effects.
Despite the known problems with diagnostic reliabilities and clinical subjectivity
(Boccaccini, Murrie, Rufino, & Gardner, 2014), only one study has specifically investigated
this issue of cross-cultural rater bias in PPD assessment. Cooke and colleague (2004)
compared the ratings of Canadian and Scottish raters on six Canadian and Scottish
offenders each. Although they found no evidence for a rater effect, the authors cautioned
against generalizing this lack of rater effects to other cultures.

76
4.3.3. Other Limitations
Another limitation of this study is that it does not look at the predictive validity of
PPD. Given that it is its relationship with serious criminality and violence that had spurred
such great interest, it is crucial for future studies to investigate if PPD is equally predictive
of violence and serious criminality across cultures. Further, this study has investigated
cross-cultural differences only on one dimension, IND-COL. Future studies should
replicate this with the different dimensions of culture such as power distance, cultural
constraints, long-term versus short-term orientation, indulgence versus restraint, and so
forth (Taras et al., 2009). Indeed, even IND-COL has been differentiated into horizontal
and vertical individualism and collectivism (Singelis et al., 1995).
The sample in this study was drawn from a single setting, and it is likely that the
participants would be more similar than dissimilar in terms of their cultural orientation
despite their different ethnicities. Ideally, samples should be drawn from across different
nations and cultural groups to maximize cross-cultural variance. Nevertheless, despite
potentially restricted culture variance, differences in item functioning were observed for a
handful of items. It is possible that if compared across more extreme groups drawn from
more distinct cultural backgrounds, there would be more items showing DIF or the same
items showing even greater DIF.
4.3.4. Future Directions for Cross-Cultural PPD Research: Etic-Emic Approaches
One of the main deficiency of using this approach to use a Western model and
impose it on other cultures—despite the finding of cross-cultural generalizability—is that it
may still omit important culture-specific, or emic, constructs. That is, it is still possible that
the CAPP missed symptoms that are relevant to PPD in other cultures since the episteme
it was based on was heavily North American or European. Such approach, also known as
the etic approach, has been greatly criticized for it assumes that the imported model or
instrument is not only applicable, but also complete (F.M. Cheung, van de Vijver, & Leong,
2011; Church & Lonner, 1998). It has been argued that Western psychology may not be

77
relevant or applicable in non-Western contexts. Western ideological orientation to the
individual and the self, for example, flies in the face of Asian ethos (Ho, 1998). Thus, a
blind “transport-and-test” strategy would lead to incomplete, and distorted, understanding
of cross-cultural PPD.
Instead, there is a growing movement of indigenous psychology, especially in the
Philippines, Hong Kong, Taiwan, China, Korea, and Japan, that emphasizes for a more
cultural-specific understanding of psychology, personality, and psychopathology (F.M.
Cheung et al., 2011). A key aspect of indigenous psychology and the emic approach is
the emphasis on contextualizing understanding within certain setting and time, and making
discoveries using natural language and taxonomies (Kim, Park, & Park, 2000). It adopts
a bottom-up approach to build theories, but is based on local phenomena and experiences
within the ecological context (F.M. Cheung et al., 2011). The coming of age in indigenous
psychology in many parts of the world like Asia meant the emic approach is now a viable
and sustainable method that can be used in the study of cross-cultural PPD to understand
which symptoms may be culture-specific versus those that may be pan-cultural. This
approach to studying PPD might involve developing a conceptual map of PPD using
similar developmental process as the CAPP, but with different set of literature, and then
comparing it with the original English CAPP. Such a project is feasible today with many
researchers who are bilingual and bi-cultural. Additionally, emic researchers who do study
PPD within their local culture, may be using their own locally developed assessment tools,
should also be encourage integrate them into mainstream psychological research to test
their applicability to other cultures and contexts to bridge this etic-emic gap.

78
References
Alarcon, R. D. (1996). Personality disorders and culture in DSM-IV: A critique. Journal of Personality Disorders, 10, 260–270. doi:10.1521/pedi.1996.10.3.260
Allik, J., & McCrae, R. R. (2004). Toward a geography of personality traits: Patterns of profiles across 36 cultures. Journal of Cross-Cultural Psychology, 35, 13–28. doi:10.1177/0022022103260382
Arrigo, B. A., & Shipley, S. (2001). The confusion over psychopathy (i): Historical considerations. International Journal of Offender Therapy and Comparative Criminology, 45, 325–344. doi:10.1177/0306624X01453005
Ashton, M. C., & Lee, K. (2007). Empirical, theoretical, and practical advantages of the HEXACO model of personality structure. Personality and Social Psychology Review, 11, 150–166. doi:10.1177/1088868306294907
Asscher, J. J., Deković, M., Wissink, I. B., van Vugt, E. S., Stams, G. J. J. M., & Manders, W. A. (2014). Ethnic differences in the relationship between psychopathy and (re)offending in a sample of juvenile delinquents. Psychology, Crime & Law, 20, 152–165. doi:10.1080/1068316X.2012.749475
Baumgartner, H., & Steenkamp, J.-B. E. M. (2001). Response styles in marketing research: A cross-national investigation. Journal of Marketing Research, 38, 143–156. doi:10.1509/jmkr.38.2.143.18840
Belmore, M. F., & Quinsey, V. L. (1994). Correlates of psychopathy in a noninstitutional sample. Journal of Interpersonal Violence, 9, 339–349. doi:10.1177/088626094009003004
Benson, J., & Fleishman, J. A. (1994). The robustness of maximum likelihood and distribution-free estimators to non-normality in confirmatory factor analysis. Quality & Quantity, 28, 117–136. doi:10.1007/BF01102757
Bergeron, N., & Schneider, B. H. (2005). Explaining cross-national differences in peer directed aggression: a quantitative synthesis. Aggressive Behavior, 31, 116–137. doi:10.1002/ab.20049
Betancourt, H., & López, S. R. (1993). The study of culture, ethnicity, and race in american psychology. American Psychologist, 48, 629–637. doi:10.1037/0003-066X.48.6.629
Billor, N., Hadi, A. S., & Velleman, P. F. (2000). Bacon: blocked adaptive computationally efficient outlier nominators. Computational Statistics & Data Analysis, 34, 279–298.

79
doi:10.1016/S0167-9473(99)00101-2
Blashfield, R. K., & Livesley, W. J. (1991). Metaphorical analysis of psychiatric classification as a psychological test. Journal of Abnormal Psychology, 100, 262–270. doi:10.1037/0021-843X.100.3.262
Boccaccini, M. T., Murrie, D. C., Rufino, K. A., & Gardner, B. O. (2014). Evaluator differences in psychopathy checklist-revised factor and facet scores. Law and Human Behavior, 38, 337–345. doi:10.1037/lhb0000069
Bond, M. H. (2004). Culture and aggression: From context to coercion. Personality and Social Psychology Review, 8, 62–78. doi:10.1207/s15327957pspr0801
Boucher, H. C. (2009). Culture and implicit self-esteem: Chinese are “good” and “bad” at the same time. Journal of Cross-Cultural Psychology, 40, 24–45. doi:10.1177/0022022108326195
Brinkley, C. A., Diamond, P. M., Magaletta, P. R., & Heigel, C. P. (2008). Cross-validation of Levenson’s psychopathy scale in a sample of federal female inmates. Assessment, 15, 464–482. doi:10.1177/1073191108319043
Brown, R., Hinkle, S., Ely, P. G., Fox-Cardamone, L., Maras, P., & Taylor, L. A. (1992). Recognizing group diversity: Individualist-Collectivist and autonomous-relational social orientations and their implications for intergroup processes. British Journal of Social Psychology, 31, 327–342. doi:10.1111/j.2044-8309.1992.tb00976.x
Browne, M. W., & Cudeck, R. (1993). Alternative ways of assessing model fit. In K. A. Bollen & J. S. Long (Eds.), Testing Structural Equation Models (pp. 136–162). Beverly Hills CA: Sage Publications.
Byrne, B. M., & Stewart, S. M. (2006). The MACS approach to testing for multigroup invariance of a second-order structure: a walk through the process. Structural Equation Modeling: A Multidisciplinary Journal, 13, 287–321. doi:10.1207/s15328007sem1302_7
Caldwell-Harris, C. L., & Ayçiçegi, A. (2006). When personality and culture clash: the psychological distress of allocentrics in an individualist culture and idiocentrics in a collectivist culture. Transcultural Psychiatry, 43, 331–361. doi:10.1177/1363461506066982
Cale, E. M., & Lilienfeld, S. O. (2002). Sex differences in psychopathy and antisocial personality disorder. a review and integration. Clinical Psychology Review, 22, 1179–1207. Retrieved from http://www.ncbi.nlm.nih.gov/pubmed/12436810
Chan, D. (2000). Detection of differential item functioning on the Kirton adaption-

80
innovation inventory using multiple-group mean and covariance structure analyses. Multivariate Behavioral Research, 35, 169–199. doi:10.1207/S15327906MBR3502_2
Chen, F. F. (2008). What happens if we compare chopsticks with forks? The impact of making inappropriate comparisons in cross-cultural research. Journal of Personality and Social Psychology, 95, 1005–1018. doi:10.1037/a0013193
Chen, S. X. (2015). Toward a social psychology of bilingualism and biculturalism. Asian Journal of Social Psychology, 18, 1–11. doi:10.1111/ajsp.12088
Chen, S. X., Benet-Martínez, V., & Ng, J. C. K. (2014). Does language affect personality perception? a functional approach to testing the Whorfian hypothesis. Journal of Personality, 82, 130–143. doi:10.1111/jopy.12040
Cheung, F. M., Cheung, S. F., & Jianxin, Z. (2004). What is chinese personality? Subgroup differences in the chinese personality assessment inventory (CPAI-2). Acta Psychologica Sinica, 36, 491–499.
Cheung, F. M., Leung, K., Fan, R. M., Song, W.-Z., Zhang, J., & Zhang, J.-P. (1996). Development of the Chinese Personality Assessment Inventory. Journal of Cross-Cultural Psychology, 27, 181–199. doi:10.1177/0022022196272003
Cheung, F. M., van de Vijver, F. J. R., & Leong, F. T. L. (2011). Toward a new approach to the study of personality in culture. The American Psychologist, 66, 593–603. doi:10.1037/a0022389
Cheung, G. W., & Lau, R. S. (2011). A direct comparison approach for testing measurement invariance. Organizational Research Methods, 15, 167–198. doi:10.1177/1094428111421987
Cheung, G. W., & Rensvold, R. B. (1999). Testing factorial invariance across groups: a reconceptualization and proposed new method. Journal of Management, 25, 1–27. doi:10.1177/014920639902500101
Cheung, G. W., & Rensvold, R. B. (2000). Assessing extreme and acquiescence response sets in cross-cultural research using structural equations modeling. Journal of Cross-Cultural Psychology, 31, 187–212. doi:10.1177/0022022100031002003
Cheung, G. W., & Rensvold, R. B. (2002). Evaluating goodness-of-fit indexes for testing measurement invariance. Structural Equation Modeling: A Multidisciplinary Journal, 9, 233–255. doi:10.1207/S15328007SEM0902_5
Chiao, J. Y., Cheon, B. K., Pornpattanangkul, N., Mrazek, A. J., & Blizinsky, K. D. (2013). Cultural neuroscience: progress and promise. Psychological Inquiry, 24, 1–19.

81
doi:10.1080/1047840X.2013.752715
Chiao, J. Y., Iidaka, T., Gordon, H. L., Nogawa, J., Bar, M., Aminoff, E., … Ambady, N. (2008). Cultural specificity in amygdala response to fear faces. Journal of Cognitive Neuroscience, 20, 2167–2174. doi:10.1162/jocn.2008.20151
Chirkov, V. I., Lynch, M., & Niwa, S. (2005). Application of the scenario questionnaire of horizontal and vertical individualism and collectivism to the assessment of cultural distance and cultural fit. International Journal of Intercultural Relations, 29, 469–490. doi:10.1016/j.ijintrel.2005.05.014
Church, A. T. (2010). Measure issues in cross-cultural research. In G. Walford, E. Tucker, & M. Viswanathan (Eds.), The SAGE Handbook of Measurement (pp. 151–177). London, UK: SAGE Publications Ltd. doi:10.4135/9781446268230
Church, A. T., & Lonner, W. J. (1998). The Cross-Cultural Perspective in the Study of Personality: Rationale and Current Research. Journal of Cross-Cultural Psychology, 29, 32-62. doi:10.1177/0022022198291003
Cohen, D. (2013). Methods in cultural psychology. In Handbook of Cultural Psychology.
Cohen, J. (1988). Statistical power analysis for the behavioral sciences. Statistical Power Analysis for the Behavioral Sciences (2nd ed.). Hillsdale, NJ: Lawrence Erlbaum Associates. doi:10.1234/12345678
Cooke, D. J. (1995). Psychopathic disturbance in the scottish prison population: the cross-cultural generalisability of the hare psychopathy checklist. Psychology, Crime & Law, 2, 101–118. doi:10.1080/10683169508409769
Cooke, D. J. (1996). Psychopathic personality in different cultures: What do we know? what do we need to find out? Journal of Personality Disorders, 10, 23–40. doi:10.1521/pedi.1996.10.1.23
Cooke, D. J., Hart, S. D., Logan, C., & Michie, C. (2004). Comprehensive Assessment of Psychopathic Personality - Institutional Rating Scale (CAPP-IRS). Glasglow Caledonian University.
Cooke, D. J., Hart, S. D., Logan, C., & Michie, C. (2012). Explicating the construct of psychopathy: development and validation of a conceptual model, the comprehensive assessment of psychopathic personality (CAPP). International Journal of Forensic Mental Health, 11, 242–252. doi:10.1080/14999013.2012.746759
Cooke, D. J., Hart, S. D., & Michie, C. (2004). Cross-national differences in the assessment of psychopathy: do they reflect variations in raters’ perceptions of symptoms? Psychological Assessment, 16, 335–339. doi:10.1037/1040-

82
3590.16.3.335
Cooke, D. J., Kosson, D. S., & Michie, C. (2001). Psychopathy and ethnicity: structural, item, and test generalizability of the psychopathy checklist-revised (PCL-R) in caucasian and african american participants. Psychological Assessment, 13, 531–542. doi:10.1037//1040-3590.13.4.531
Cooke, D. J., & Michie, C. (1999). Psychopathy across cultures: North America and Scotland compared. Journal of Abnormal Psychology, 108, 58–68. doi:10.1037/0021-843X.108.1.58
Cooke, D. J., & Michie, C. (2001). Refining the construct of psychopath: towards a hierarchical model. Psychological Assessment, 13, 171–188. doi:10.1037//1040-3590.13.2.171
Cooke, D. J., Michie, C., Hart, S. D., & Clark, D. (2005a). Assessing psychopathy in the uk: concerns about cross-cultural generalisability. The British Journal of Psychiatry : The Journal of Mental Science, 186, 335–341. doi:10.1192/bjp.186.4.335
Cooke, D. J., Michie, C., Hart, S. D., & Clark, D. (2005b). Searching for the pan-cultural core of psychopathic personality disorder. Personality and Individual Differences, 39, 283–295. doi:10.1016/j.paid.2005.01.004
Costa, P. T., Terracciano, A., & McCrae, R. R. (2001). Gender differences in personality traits across cultures: robust and surprising findings. Journal of Personality and Social Psychology, 81, 322–331. doi:10.1037/0022-3514.81.2.322
Cronbach, L. J. (1990). Essentials of psychological testing (Vol. 5th). New York: HarperCollins.
Cross, S. E., & Markus, H. R. (1999). The cultural constitution of personality. In L. A. Pervin & P. O. John (Eds.), Handbook of Personality (pp. 378–396). New York: Guilford.
Crotts, J. C., & Litvin, S. W. (2003). Cross-cultural research: are researchers better served by knowing respondents’ country of birth, residence, or citizenship? Journal of Travel Research, 42, 186–190. doi:10.1177/0047287503254955
Curran, P. J., West, S. G., & Finch, J. F. (1996). The robustness of test statistics to nonnormality and specification error in confirmatory factor analysis. Psychological Methods, 1, 16–29.
Derefinko, K. J., & Lynam, D. R. (2007). Using the ffm to conceptualize psychopathy: a test using a drug abusing sample. Journal of Personality Disorders, 21, 638–656. Retrieved from http://www.ncbi.nlm.nih.gov/pubmed/18072865

83
Diener, E., Oishi, S., & Lucas, R. E. (2003). Personality, culture, and subjective well-being: emotional and cognitive evaluations of life. Annual Review of Psychology, 54, 403–25. doi:10.1146/annurev.psych.54.101601.145056
Edens, J. F., Campbell, J. S., & Weir, J. M. (2007). Youth psychopathy and criminal recidivism: a meta-analysis of the psychopathy checklist measures. Law and Human Behavior, 31, 53–75. doi:10.1007/s10979-006-9019-y
Eid, M., & Diener, E. (2001). Norms for experiencing emotions in different cultures: inter- and intranational differences. Journal of Personality and Social Psychology, 81, 869–885. doi:10.1037//0022-3514.81.5.869
Elosua, P., & Wells, C. S. (2013). Detecting dif in polytomous items using macs, irt and ordinal logistic regression. Psicologica, 34, 327–342.
Falkenbach, D., Stern, S. B., & Creevy, C. (2014). Psychopathy variants: empirical evidence supporting a subtyping model in a community sample. Personality Disorders: Theory, Research, and Treatment, 5, 10–19. doi:10.1037/per0000021
Felthous, A. R., & Saß, H. (2007). The International handbook of psychopathic disorders and the law. Chichester, UK: Wiley.
Fischer, R. (2009). Where is culture in cross cultural research? an outline of a multilevel research process for measuring culture as a shared meaning system. International Journal of Cross Cultural Management, 9, 25–49. doi:10.1177/1470595808101154
Fischer, R., Ferreira, M. C., Assmar, E., Redford, P., Harb, C., Glazer, S., … Achoui, M. (2009). Individualism-collectivism as descriptive norms: development of a subjective norm approach to culture measurement. Journal of Cross-Cultural Psychology, 40, 187–213. doi:10.1177/0022022109332738
Fiske, A. P. (2002). Using individualism and collectivism to compare cultures--a critique of the validity and measurement of the constructs: comment on oyserman et al. (2002). Psychological Bulletin, 128, 78–88. doi:10.1037//0033-2909.128.1.78
French, B. F., & Finch, W. H. (2006). Confirmatory factor analytic procedures for the determination of measurement invariance. Structural Equation Modeling: A Multidisciplinary Journal, 13, 378–402. doi:10.1207/s15328007sem1303_3
Glenn, A. L., Iyer, R., Graham, J., Koleva, S., & Haidt, J. (2009). Are all types of morality compromised in psychopathy? Journal of Personality Disorders, 23, 384–398. doi:10.1521/pedi.2009.23.4.384
González-Romá, V., & Hernández, A. (2006). Power and type i error of the mean and covariance structure analysis model for detecting differential item functioning in

84
graded response items. Multivariate Behavioral Research, 41, 29–53. doi:10.1207/s15327906mbr4101_3
Grimm, S. D., Church, a. T., Katigbak, M. S., & Reyes, J. A. S. (1999). Self-described traits, values, and moods associated with individualism and collectivism: Testing I-C theory in an individualistic (U.S.) and a collectivistic (Philippine) culture. Journal of Cross-Cultural Psychology, 30, 466–500. doi:10.1177/0022022199030004005
Gunsoy, C., Cross, S. E., Uskul, a. K., Adams, G., & Gercek-Swing, B. (2015). Avoid or fight back? Cultural differences in responses to conflict and the role of collectivism, honor, and enemy perception. Journal of Cross-Cultural Psychology, 46, 1081–1102. doi:10.1177/0022022115594252
Halberstadt, A. G., & Lozada, F. T. (2011). Emotion development in infancy through the lens of culture. Emotion Review, 3, 158–168. doi:10.1177/1754073910387946
Hare, R. D. (1991). Manual for the Revised Psychopathy Checklist (3rd ed.). Toronto: Multi-Health Systems, Inc.
Hare, R. D. (1993). Without conscience: The disturbing world of the psychopaths among us. New York: Pocket Books.
Hare, R. D. (1998). The hare PCL-R: some issues concerning its use and misuse. Legal and Criminological Psychology, 3, 99–119. doi:10.1111/j.2044-8333.1998.tb00353.x
Hare, R. D., Clark, D., Grann, M., & Thornton, D. (2000). Psychopathy and the predictive validity of the pcl-r: an international perspective. Behavioral Sciences & the Law, 18, 623–645. doi:10.1002/1099-0798(200010)18:5<623::AID-BSL409>3.0.CO;2-W
Hare, R. D., & Neumann, C. S. (2010). The role of antisociality in the psychopathy construct: comment on Skeem and Cooke (2010). Psychological Assessment, 22, 446–54. doi:10.1037/a0013635
Harenski, C. L., Harenski, K. A., & Kiehl, K. A. (2014). Neural processing of moral violations among incarcerated adolescents with psychopathic traits. Developmental Cognitive Neuroscience, 10, 181–189. doi:10.1016/j.dcn.2014.09.002
Harpur, T. J., Hare, R. D., & Hakstian, A. R. (1989). Two-factor conceptualization of psychopathy: construct validity and assessment implications. Psychological Assessment, 1, 6–17. doi:10.1037//1040-3590.1.1.6
Harrendorf, S., Heiskanen, M., & Malby, S. (2010). International Statistics on Crime and Justice. International Statistics on Crime and Justice. Helsinki: United Nations Office on Drugs and Crime.

85
Hart, S. D., & Cook, A. N. (2012). Current issues in the assessment and diagnosis of psychopathy (Psychopathic personality disorder). Neuropsychiatry, 2, 497–508. doi:10.2217/NPY.12.61
He, J., Bartram, D. D., Inceoglu, I., & van de Vijver, F. J. R. (2014). Response styles and personality traits: a multilevel analysis. Journal of Cross-Cultural Psychology, 45, 1028–1045. doi:10.1177/0022022114534773
Heine, S. J., Buchtel, E. E., & Norenzayan, A. (2008). What do cross-national comparisons of personality traits tell us? the case of conscientiousness: Research report. Psychological Science, 19, 309–313. doi:10.1111/j.1467-9280.2008.02085.x
Heine, S. J., & Hamamura, T. (2007). In search of east asian self-enhancement. Personality and Social Psychology Review, 11, 4–27. doi:10.1177/1088868306294587
Heine, S. J., Lehman, D. R., Peng, K., & Greenholtz, J. (2002). What’s wrong with cross-cultural comparisons of subjective likert scales?: The reference-group effect. Journal of Personality and Social Psychology, 82, 903–918. doi:10.1037/0022-3514.82.6.903
Heinzen, H., Fittkau, K., Kreis, M. K. F., & Huchzermeier, C. (2011). Content validation of the german version of the capp. In Poster Presented at the 2nd Bergen Conference on the Treatment of Psychopathy, November 15-17. Bergen, Norway.
Hernández, A., & González-Romá, V. (2003). Evaluating the multiple-group mean and covariance structure analysis model for the detection of differential item functioning in polytomous ordered items. Psicothema, 15, 322–327.
Ho, D. Y. F. (1998). Indigenous psychologies: asian perspectives. Journal of Cross-Cultural Psychology, 29, 88–103. doi:10.1177/0022022198291005
Hodson, G., Hogg, S. M., & MacInnis, C. C. (2009). The role of “dark personalities” (narcissism, machiavellianism, psychopathy), big five personality factors, and ideology in explaining prejudice. Journal of Research in Personality, 43, 686–690. doi:10.1016/j.jrp.2009.02.005
Hoff, H. A., Rypdal, K., Mykletun, A., & Cooke, D. J. (2012). A prototypicality validation of the comprehensive assessment of psychopathic personality model (CAPP). Journal of Personality Disorders, 26, 414–427. doi:10.1521/pedi.2012.26.3.414
Hofstede, G. J. (1980). Culture’s consequences. Beverly Hills CA: Sage.
Hofstede, G. J. (2001). Culture’s consequences: Comparing values, behaviors, institutions, and organization across nations (2nd ed.). Thousand Oaks, CA: Sage Publications.

86
Hofstede, G. J., & Minkov, M. (2010). Cultures and Organisations: Software of the Mind. New York: McGraw-Hill USA.
Horn, J. L. (1965). A rationale and test for the number of factors in factor analysis. Psychometrika, 30, 179–185. doi:10.1007/BF02289447
Hui, C. H. (1988). Measurement of individualism-collectivism. Journal of Research in Personality, 22, 17–36. doi:10.1016/0092-6566(88)90022-0
Hui, C. H., & Triandis, H. C. (1986). Individualism-collectivism: a study of cross-cultural researchers. Journal of Cross-Cultural Psychology, 17, 225–248. doi:10.1177/0022002186017002006
Hui, C. H., & Yee, C. (1994). Shortened individualism-collectivism scale. Scale, 1–3. doi:10.1037/t09469-000
Hui, C. H., & Yee, C. (1995). The shortened lndividualism-collectivism scale: its relationship to demographic and work-related variables. Journal of Research in Personality, 28, 409–424. doi:10.1006/jrpe.1994.1029
Hui, C. H., & Yee, C. (1999). The impact of psychological collectivism and workgroup atmosphere on chinese employees’ job satisfaction. Applied Psychology, 48, 175–185. doi:10.1111/j.1464-0597.1999.tb00056.x
Hulin, C. L. (1987). A psychometric theory of evaluations of item and scale translations: fidelity across languages. Journal of Cross-Cultural Psychology, 18, 115–142. doi:10.1177/0022002187018002001
Johnson, E. C., Meade, A. W., & DuVernet, A. M. (2009). The role of referent indicators in tests of measurement invariance. Structural Equation Modeling, 16, 642–657. doi:10.1080/10705510903206014
Johnson, T. (2005). The relation between culture and response styles: evidence from 19 countries. Journal of Cross-Cultural Psychology, 36, 264–277. doi:10.1177/0022022104272905
Kao, H.-F. S., Hsu, M.-T., & Clark, L. (2004). Conceptualizing and critiquing culture in health research. Journal of Transcultural Nursing : Official Journal of the Transcultural Nursing Society / Transcultural Nursing Society, 15, 269–277. doi:10.1177/1043659604268963
Kemmelmeier, M., Burnstein, E., Krumov, K., Genkova, P., Kanagaw, C., Hirshberg, M. S., … Noels, K. A. (2003). Individualism, collectivism, and authoritarianism in seven societies. Journal of Cross-Cultural Psychology, 34, 304-322. doi:10.1177/0022022103034003005

87
Kim, U., Park, Y.-S., & Park, D. (2000). The challenge of cross-cultural psychology: The role of the indigenous psychologies. Journal of Cross-Cultural Psychology, 31, 63–75. doi:10.1177/0022022100031001006
Kirmayer, L. J. (2006). Beyond the “new cross-cultural psychiatry”: cultural biology, discursive psychology and the ironies of globalization. Transcultural Psychiatry, 43, 126–144. doi:10.1177/1363461506061761
Kitayama, S. (2002). Culture and basic psychological processes--toward a system view of culture: comment on Oyserman et al.(2002). Psychological Bulletin, 128, 89–96. doi:10.1037//0033-2909.128.1.89
Kitayama, S., Markus, H. R., & Kurokawa, M. (2000). Culture, emotion, and well-being: good feelings in Japan and the United States. Cognition & Emotion, 14, 93–124. doi:10.1080/026999300379003
Kleinman, A. M. (1977). Depression, somatization and the “new cross-cultural psychiatry.” Social Science & Medicine, 11, 3–9. doi:10.1016/0037-7856(77)90138-X
Kline, R. B. (1998). Principles and practice of structural equation modeling. Book. New York, NY: Guilford.
Kosson, D. S., Neumann, C. S., Forth, A. E., Salekin, R. T., Hare, R. D., Krischer, M. K., & Sevecke, K. (2013). Factor structure of the Hare Psychopathy Checklist: Youth Version (PCL:YV) in adolescent females. Psychological Assessment, 25, 71–83. doi:10.1037/a0028986
Kosson, D. S., Smith, S. S., & Newman, J. P. (1990). Evaluating the construct validity of psychopathy in black and white male inmates: Three preliminary studies. Journal of Abnormal Psychology, 99, 250–259. doi:10.1037/0021-843X.99.3.250
Kreis, M. K. F., & Cooke, D. J. (2011). Capturing the psychopathic female: A prototypicality analysis of the comprehensive assessment of psychopathic personality (CAPP) across gender. Behavioral Sciences & the Law, 29, 634–648. doi:10.1002/bsl.1003
Kreis, M. K. F., Cooke, D. J., Michie, C., Hoff, H. A., & Logan, C. (2012). The comprehensive assessment of psychopathic personality (CAPP): Content validation using prototypical analysis. Journal of Personality Disorders, 26, 402–413. doi:10.1521/pedi.2012.26.3.402
Kuper, A. (1999). Culture: The Anthropologists’ Account. Book. London: Harvard University Press.
Lee, J., Little, T. D., & Preacher, K. J. (2011). Methodological issues in using structural equation models for testing differential item functioning. In E. Davidov, P. Schmidt, &

88
J. Billiet (Eds.), Cross-Cultural Analysis: Methods and Application (pp. 55–84). New York, NY: Routledge.
Lee, Z., & Salekin, R. T. (2010). Psychopathy in a noninstitutional sample: Differences in primary and secondary subtypes. Personality Disorders: Theory, Research, and Treatment, 1, 153–169. doi:10.1037/a0019269
Leistico, A. R., Salekin, R. T., DeCoster, J., & Rogers, R. (2008). A large-scale meta-analysis relating the hare measures of psychopathy to antisocial conduct. Law and Human Behavior, 32, 28–45. doi:10.1007/s10979-007-9096-6
Levenson, M. R., Kiehl, K. A., & Fitzpatrick, C. M. (1995). Assessing psychopathic attributes in a noninstitutionalized population. Journal of Personality and Social Psychology, 68, 151–158. doi:10.1037/0022-3514.68.1.151
Li, Y., Wang, M., Wang, C., & Shi, J. (2010). Individualism, collectivism, and chinese adolescents’ aggression: intracultural variations. Aggressive Behavior, 36, 187–194. doi:10.1002/ab.20341
Lilienfeld, S. O. (1994). Conceptual problems in the assessment of psychopathy. Clinical Psychology Review, 14, 17–38. doi:10.1016/0272-7358(94)90046-9
Lilienfeld, S. O., & Andrews, B. P. (1996). Development and preliminary validation of a self-report measure of psychopathic personality traits in noncriminal population. Journal of Personality Assessment, 66, 488–524. doi:10.1207/s15327752jpa6603_3
Lilienfeld, S. O., & Widows, M. R. (2005). Psychopathy Personality Inventory-Revised (PPI-R): Professional Manual. Book. Lutz, FL: Psychological Assessment Resources.
Little, T. D. (1997). Mean and covariance structures (MACS) analyses of cross-cultural data: practical and theoretical issues. Multivariate Behavioral Research, 32, 53–76. doi:10.1207/s15327906mbr3201_3
Little, T. D. (2000). On the comparability of constructs in cross-cultural research: a critique of cheung and rensvold. Journal of Cross-Cultural Psychology, 31, 213–219. doi:10.1177/0022022100031002004
Lloyd, C. D., Clark, H. J., & Forth, A. E. (2010). Psychopathy, expert testimony, and indeterminate sentences: exploring the relation- ship between psychopathy checklist-revised testimony and trial outcome in canada. Legal and Criminological Psychology, 15, 323–339. doi:10.1348/135532509X468432
Lorenz, A. R., & Newman, J. P. (2002). Do emotion and information processing deficiencies found in caucasian psychopaths generalize to african-american

89
psychopaths? Personality and Individual Differences, 32, 1077–1086. doi:10.1016/S0191-8869(01)00111-8
Lykken, D. T. (1995). The antisocial personalities (Vol. 1st). Hillsdale, NJ: Lawrence Erlbaum.
Lynam, D. R. (2002). Psychopathy from the perspective of the five-factor model of personality. In P. T. Costa & T. A. Widiger (Eds.), Personality Disorders and the Five-Factor Model of Personality (2nd ed., pp. 325–348). Washington, DC: American Psychological Association.
Lynam, D. R., & Miller, J. D. (2014). Psychopathy from a basic trait perspective: the utility of a five-factor model approach. Journal of Personality, 1–47. doi:10.1111/jopy.12132
Lynam, D. R., & Widiger, T. A. (2007). Using a general model of personality to identify the basic elements of psychopathy. Journal of Personality Disorders, 21, 160–178. doi:10.1521/pedi.2007.21.2.160
Lyon, D., & Ogloff, J. R. P. (2000). Legal and ethical issues in psychopathy assessment. In C. B. Gracono (Ed.), The Clinical and Forensic Assessment of Psychopathy (pp. 139–173). Mahwah, NJ: Erlbaum.
Marcus, D. K., John, S. L., & Edens, J. F. (2004). A taxometric analysis of psychopathic personality. Journal of Abnormal Psychology, 113, 626–635. doi:10.1037/0021-843X.113.4.626
Markus, H. R., & Kitayama, S. (1991). Culture and the self: implications for cognition, emotion, and motivation. Psychological Review, 98, 224–253. doi:10.1037/0033-295X.98.2.224
Markus, H. R., & Kitayama, S. (1998). The cultural psychology of personality. Journal of Cross-Cultural Psychology, 29, 63–87. doi:10.1177/0022022198291004
Marsh, H. W., Hau, K.-T., & Grayson, D. (2005). Goodness of fit in structural equation models. In A. Maydeu-Olivares & J. J. McArdle (Eds.), Contemporary Psychometrics (pp. 275–340). Mahwah, NJ: Lawrence Erlbaum Associates.
Matsumoto, D., & Hwang, H. S. (2011). Culture and emotion: the integration of biological and cultural contributions. Journal of Cross-Cultural Psychology, 43, 91–118. doi:10.1177/0022022111420147
Matsumoto, D., & Yoo, S. H. (2006). Toward a new generation of cross-cultural research. Perspectives on Psychological Science, 1, 234–250. doi:10.1111/j.1745-6916.2006.00014.x

90
McCoy, W. K., & Edens, J. F. (2006). Do black and white youths differ in levels of psychopathic traits? a meta-analysis of the psychopathy checklist measures. Journal of Consulting and Clinical Psychology, 74, 386–392. doi:10.1037/0022-006X.74.2.386
McCrae, R. R. (2002). Neo-pi-r data from 36 cultures. In R. R. McCrae & J. Allik (Eds.), The Five-Factor Model of Personality Across Cultures (pp. 105–125). Boston, MA: Springer US. doi:10.1007/978-1-4615-0763-5
McCrae, R. R., & Costa, P. T. (1997). Personality trait structure as a human universal. The American Psychologist, 52, 509–516. doi:10.1037/0003-066X.52.5.509
Meade, A. W., & Bauer, D. J. (2007). Power and precision in confirmatory factor analytic tests of measurement invariance. Structural Equation Modeling: A Multidisciplinary Journal, 14, 611–635. doi:10.1080/10705510701575461
Mellenberg, G. J. (1994). A unidimensional latent trait model for continuous item responses. Multivariate Behavioral Research, 29, 223–237.
Meredith, W. (1993). Measurement invariance, factor analysis and factorial invariance. Psychometrika, 58, 525–543. doi:10.1007/BF02294825
Mesquita, B., & Karasawa, M. (2002). Different emotional lives. Cognition & Emotion, 16, 127–141. doi:10.1080/0269993014000176
Mesquita, B., & Walker, R. (2003). Cultural differences in emotions: a context for interpreting emotional experiences. Behaviour Research and Therapy, 41, 777–793. doi:10.1016/S0005-7967(02)00189-4
Miller, J. D., & Lynam, D. R. (2012). An examination of the psychopathic personality inventory’s nomological network: A meta-analytic review. Personality Disorders: Theory, Research, and Treatment, 3, 305–326. doi:10.1037/a0024567
Miller, J. D., Lynam, D. R., Widiger, T. A., & Leukefeld, C. (2001). Personality disorders as extreme variants of common personality dimensions: can the five-factor model adequately represent psychopathy? Journal of Personality, 69, 253–276. doi:10.1111/1467-6494.00144
Miyamoto, Y., Ma, X., & Petermann, A. G. (2014). Cultural differences in hedonic emotion regulation after a negative event. Emotion, 14, 804–815. doi:10.1037/a0036257
Mokros, A., Neumann, C. S., Stadtland, C., Osterheider, M., Nedopil, N., & Hare, R. D. (2011). Assessing measurement invariance of pcl-r assessments from file reviews of Borth american and German offenders. International Journal of Law and Psychiatry, 34, 56–63. doi:10.1016/j.ijlp.2010.11.009
91
Morren, M., Gelissen, J. P. T. M., & Vermunt, J. K. (2011). Dealing with extreme response style in cross-cultural research: a restricted latent class factor analysis approach. Sociological Methodology, 41, 13–47. doi:10.1111/j.1467-9531.2011.01238.x
Murphy, J. M. (1976). Psychiatric labeling in cross-cultural perspective. Science, 191, 1019–1028. doi:10.1126/science.1251213
Neumann, C. S., Hare, R. D., & Pardini, D. a. (2014). Antisociality and the construct of psychopathy: data from across the globe. Journal of Personality, 83, 678-692. doi:10.1111/jopy.12127
Neumann, C. S., Schmitt, D. S., Carter, R., Embley, I., & Hare, R. D. (2012). Psychopathic traits in females and males across the globe. Behavioral Sciences & the Law, 30, 557–574. doi:10.1002/bsl.2038
Nisbett, R. E. (2003). The geography of thought: How Asian and Westerners think differently . . . and why. New York, NY: The Free Press.
Nisbett, R. E., Peng, K., Choi, I., & Norenzayan, A. (2001). Culture and systems of thought: holistic versus analytic cognition. Psychological Review, 108, 291–310. doi:10.1037/0033-295X.108.2.291
Norenzayan, A., & Heine, S. J. (2005). Psychological universals: what are they and how can we know? Psychological Bulletin, 131, 763–784. doi:10.1037/0033-2909.131.5.763
Nye, C. D., & Drasgow, F. (2011). Effect size indices for analyses of measurement equivalence: understanding the practical importance of differences between groups. The Journal of Applied Psychology, 96, 966–980. doi:10.1037/a0022955
Nye, C. D., & Drasgow, F. (2012). Small, medium, or large? empirical guidelines for evaluating measurement nonequivalence. Academy of Management Proceedings, 2012, 1–1. doi:10.5465/AMBPP.2012.237
Olver, M. E., Neumann, C. S., Wong, S. C. P., & Hare, R. D. (2013). The structural and predictive properties of the Psychopathy Checklist--Revised in canadian aboriginal and non-aboriginal offenders. Psychological Assessment, 25, 167–179. doi:10.1037/a0029840
Oyserman, D., Coon, H. M., & Kemmelmeier, M. (2002). Rethinking individualism and collectivism: Evaluation of theoretical assumptions and meta-analyses. Psychological Bulletin, 128, 3–72. doi:10.1037//0033-2909.128.1.3
Oyserman, D., & Lee, S. W. S. (2008). Does culture influence what and how we think? Effects of priming individualism and collectivism. Psychological Bulletin, 134, 311–

92
342. doi:10.1037/0033-2909.134.2.311
Paris, J. (1998). Personality disorders in sociocultural perspective. Journal of Personality Disorders, 12, 289–301. doi:10.1521/pedi.1998.12.4.289
Patrick, C. J., Fowles, D. C., & Krueger, R. F. (2009). Triarchic conceptualization of psychopathy: developmental origins of disinhibition, boldness, and meanness. Development and Psychopathology, 21, 913–938. doi:10.1017/S0954579409000492
Poortinga, Y. H., & van de Vijver, F. J. R. (1987). Explaining cross-cultural differences: bias analysis and beyond. Journal of Cross-Cultural Psychology, 18, 259–282. doi:10.1177/0022002187018003001
Poortinga, Y. H., & van Hemert, D. A. (2001). Personality and culture: demarcating between the common and the unique. Journal of Personality, 69, 1033–1060. Retrieved from http://www.ncbi.nlm.nih.gov/pubmed/11767817
Pratto, F., Liu, J. H., Levin, S., Sidanius, J., Shih, M., Bachrach, H., & Hegarty, P. (2000). Social dominance orientation and the legitimization of inequality across cultures. Journal of Cross-Cultural Psychology, 31, 369-409. doi:10.1177/0022022100031003005
Pratto, F., Sidanius, J., Stallworth, L. M., & Malle, B. F. (1994). Social dominance orientation: a personality variable predicting social and political attitudes. Journal of Personality and Social Psychology, 67, 741–763. doi:10.1037/0022-3514.67.4.741
Raju, N. S., Laffitte, L. J., & Byrne, B. M. (2002). Measurement equivalence: a comparison of methods based on confirmatory factor analysis and item response theory. The Journal of Applied Psychology, 87, 517–529. doi:10.1037/0021-9010.87.3.517
Ralston, D. A., Egri, C. P., Furrer, O., Kuo, M.-H., Li, Y., Wangenheim, F., … Weber, M. (2013). Societal-level versus individual-level predictions of ethical behavior: a 48-society study of collectivism and individualism. Journal of Business Ethics, 283–306. doi:10.1007/s10551-013-1744-9
Reise, S. P., Widaman, K. F., & Pugh, R. H. (1993). Confirmatory factor analysis and item response theory: two approaches for exploring measurement invariance. Psychological Bulletin, 114, 552–566. doi:10.1037/0033-2909.114.3.552
Riopka, S. J., Coupland, R. B. A., & Olver, M. E. (2015). Self-reported psychopathy and its association with criminal cognition and antisocial behavior in a sample of university undergraduates. Canadian Journal of Behavioural Science / Revue Canadienne Des Sciences Du Comportement, 47, 216–225. doi:10.1037/a0039075

93
Robert, C., Lee, W. C., & Chan, K. (2006). An empirical analysis of measurement equivalence wih the INDCOL measure of individual and collectivism: implications for valid cross-cultural inference. Personnel Psychology, 59, 65–99. doi:10.1111/j.1744-6570.2006.00804.x
Rohner, R. P. (1984). Toward a conception of culture for cross-cultural psychology. Journal of Cross-Cultural Psychology, 15, 111–138. doi:10.1177/0022002184015002002
Ross, M., Xun, W. Q. E., & Wilson, A. E. (2002). Language and the bicultural self. Personality and Social Psychology Bulletin, 28, 1040–1050. doi:10.1177/01461672022811003
Rule, N. O., Freeman, J. B., & Ambady, N. (2013). Culture in social neuroscience: a review. Social Neuroscience, 8, 3–10. doi:10.1080/17470919.2012.695293
Ryder, A. G., Ban, L. M., & Chentsova-Dutton, Y. E. (2011). Towards a cultural-clinical psychology. Social and Personality Psychology Compass, 5, 960–975. doi:10.1111/j.1751-9004.2011.00404.x
Ryder, A. G., Dere, J., Sun, J., & Chentsova-Dutton, Y. E. (2014). The cultural shaping of personality disorder. In F. T. L. Leong, L. Comas-Díaz, G. C. Nagayama Hall, V. C. McLoyd, & J. E. Trimble (Eds.), APA Handbook of Multicultural Psychology, Vol. 2: Applications and Training. (pp. 308–328).
Ryder, A. G., Sun, J., Dere, J., & Fung, K. (2014). Personality disorders in asians: summary, and a call for cultural research. Asian Journal of Psychiatry, 7, 86–88. doi:10.1016/j.ajp.2013.11.009
Salekin, R. T., Rogers, R., & Sewell, K. W. (1996). A review and meta-analysis of the psychopathy checklist and psychopathy checklist-revised: predictive validity of dangerousness. Clinical Psychology: Science and Practice, 3, 203–215. doi:10.1111/j.1468-2850.1996.tb00071.x
Salekin, R. T., Trobst, K. K., & Krioukova, M. (2001). Construct validity of psychopathy in a community sample: a nomological net approach. Journal of Personality Disorders, 15, 425–441. doi:10.1521/pedi.15.5.425.19196
Saucier, G., Kenner, J., Iurino, K., Bou Malham, P., Chen, Z., Thalmayer, a. G., … Altschul, C. (2014). Cross-cultural differences in a global “survey of world views.” Journal of Cross-Cultural Psychology, 46, 53-70. doi:10.1177/0022022114551791
Schmitt, D. P., Allik, J., McCrae, R. R., & Benet-Martinez, V. (2007). The geographic distribution of big five personality traits: patterns and profiles of human self-description across 56 nations. Journal of Cross-Cultural Psychology, 38, 173–212.

94
doi:10.1177/0022022106297299
Sellbom, M. (2011). Elaborating on the construct validity of the Levenson self-report psychopathy scale in incarcerated and non-incarcerated samples. Law and Human Behavior, 35, 440–451. doi:10.1007/s10979-010-9249-x
Shariat, S. V., Assadi, S. M., Noorzian, M., Pakravannejad, M., Yahayzadeh, O., Aghayan, S., … Cooke, D. J. (2010). Psychopathy in iran: a cross-cultural study. Journal of Personality Disorders, 24, 676–691. doi:10.1521/pedi.2010.24.5.676
Sik Hung Ng, & Lai, J. C. L. (2009). Effects of culture priming on the social connectedness of the bicultural self: A self-reference effect approach. Journal of Cross-Cultural Psychology, 40, 170–186. doi:10.1177/0022022108328818
Sims, R. L. (2007). Collective versus individualist national cultures: Comparing Taiwan and U.S. employee attitudes toward unethical business practices. Business & Society, 48, 39–59. doi:10.1177/0007650307299224
Singelis, T. M., Triandis, H. C., Bhawuk, D. P. S., & Gelfand, M. J. (1995). Horizontal and vertical dimensions of individualism and collectivism: a theoretical and measurement refinement. Cross-Cultural Research, 29, 240–275. doi:10.1177/106939719502900302
Singh, J. P., Desmarais, S. L., Hurducas, C., Arbach-Lucioni, K., Condemarin, C., Dean, K., … Otto, R. K. (2014). International perspectives on the practical application of violence risk assessment: a global survey of 44 countries. International Journal of Forensic Mental Health, 13, 193–206. doi:10.1080/14999013.2014.922141
Singh, J. P., Grann, M., & Fazel, S. (2011). A comparative study of violence risk assessment tools: a systematic review and metaregression analysis of 68 studies involving 25,980 participants. Clinical Psychology Review, 31, 499–513. doi:10.1016/j.cpr.2010.11.009
Skeem, J. L., & Cooke, D. J. (2010a). One measure does not a construct make: directions toward reinvigorating psychopathy research--reply to hare and neumann (2010). Psychological Assessment, 22, 455–459. doi:10.1037/a0014862
Skeem, J. L., & Cooke, D. J. (2010b). Is criminal behavior a central component of psychopathy? conceptual directions for resolving the debate. Psychological Assessment, 22, 433–445. doi:10.1037/a0008512
Skeem, J. L., Edens, J. F., Camp, J. P., & Colwell, L. H. (2004). Are there ethnic differences in levels of psychopathy? a meta-analysis. Law and Human Behavior, 28, 505–527. Retrieved from http://www.ncbi.nlm.nih.gov/pubmed/15638207

95
Skeem, J. L., Edens, J. F., Sanford, G. M., & Colwell, L. H. (2003). Psychopathic personality and racial/ethnic differences reconsidered: a reply to Lynn (2002). Personality and Individual Differences, 35, 1439–1462. doi:10.1016/S0191-8869(02)00361-6
Soares, A. M., Farhangmehr, M., & Shoham, A. (2007). Hofstede’s dimensions of culture in international marketing studies. Journal of Business Research, 60, 277–284. doi:10.1016/j.jbusres.2006.10.018
Sörbom, D. (1974). A general method for studying differences in factor mean and factor structures between groups. British Journal of Mathematical and Statistical Psychology2, 27, 229–239.
Stark, S., Chernyshenko, O. S., & Drasgow, F. (2006). Detecting differential item functioning with confirmatory factor analysis and item response theory: toward a unified strategy. The Journal of Applied Psychology, 91, 1292–1306. doi:10.1037/0021-9010.91.6.1292
StataCorp. (2013). Stata statistical software: release 13.1. College Station, T: StataCorp LP.
Statistics Canada. (2013). National Houshold Survey 2011: Immigration and Ethnocultural Diversity in Canada. Retrieved from http://www5.statcan.gc.ca/access_acces/alternative_alternatif.action?t=99-010-XWE2011001&l=eng&loc=http://www12.statcan.gc.ca/nhs-enm/2011/as-sa/99-010-x/99-010-x2011001-eng.pdf
Sul, S., Choi, I., & Kang, P. (2012). Cultural modulation of self-referential brain activity for personality traits and social identities. Social Neuroscience, 7, 280–91. doi:10.1080/17470919.2011.614001
Taras, V., Rowney, J., & Steel, P. (2009). Half a century of measuring culture: review of approaches, challenges, and limitations based on the analysis of 121 instruments for quantifying culture. Journal of International Management, 15, 357–373. doi:10.1016/j.intman.2008.08.005
Tinsley, C. H., & Weldon, E. (2003). Responses to a normative conflict among american and chinese managers. International Journal of Cross Cultural Management, 3, 183–194. doi:10.1177/14705958030032003
Triandis, H. C. (1993). Collectivism and individualism as cultural syndromes. Cross-Cultural Research, 27, 155–180. doi:10.1177/106939719302700301
Triandis, H. C. (1995). Individualism and Collectivism. Boulder, CO: Westview Press.

96
Triandis, H. C. (2000). Culture and conflict. International Journal of Psychology, 35, 145–152. doi:10.1080/002075900399448
Triandis, H. C., Bontempo, R., Villareal, M. J., Asai, M., & Lucca, N. (1988). Individualism and collectivism: cross-cultural perspectives on self-ingroup relationships. Journal of Personality and Social Psychology, 54, 323–338. doi:10.1037/0022-3514.54.2.323
Triandis, H. C., & Suh, E. M. (2002). Cultural influences on personality. Annual Review of Psychology, 53, 133–160.
van de Vijver, F. J. R., & Leung, K. (1997). Methods and data analysis for cross-cultural research. Book. Thousand Oaks, CA: Sage Publications.
Vandenberg, R. J., & Lance, C. E. (2000). A review and synthesis of the measurement invariance literature: suggestions, practices, and recommendations for organizational research. Organizational Research Methods, 3, 4–70. doi:10.1177/109442810031002
Velicer, W. F. (1976). Determining the number of components from the matrix of partial correlations. Psychometrika, 41, 321–327. doi:10.1007/BF02293557
Vitacco, M. J., Neumann, C. S., & Jackson, R. L. (2005). Testing a four-factor model of psychopathy and its association with ethnicity, gender, intelligence, and violence. Journal of Consulting and Clinical Psychology, 73, 466–476. doi:10.1037/0022-006X.73.3.466
Vitacco, M. J., Neumann, C. S., & Pardini, D. A. (2014). Predicting future criminal offending in a community-based sample of males using self-reported psychopathy. Criminal Justice and Behavior, 41, 345–363. doi:10.1177/0093854813500488
Vogt, L., & Laher, S. (2009). The five factor model of personality and individualism/collectivism in South Africa: an exploratory study. Psychology in Society, 37, 39–54.
Walsh, Z. (2012). Psychopathy and criminal violence: the moderating effect of ethnicity. Law and Human Behavior, 37, 303–311. doi:10.1037/lhb0000017
Walsh, Z., & Kosson, D. S. (2007). Psychopathy and violent crime: a prospective study of the influence of socioeconomic status and ethnicity. Law and Human Behavior, 31, 209–229. doi:10.1007/s10979-006-9057-5
Walsh, Z., Swogger, M. T., & Kosson, D. S. (2004). Psychopathy, iq, and violence in european american and african american county jail inmates. Journal of Consulting and Clinical Psychology, 72, 1165–1169. doi:10.1037/0022-006X.72.6.1165

97
Wilson, M. J., Abramowitz, C., Vasilev, G., Bozgunov, K., & Vassileva, J. (2014). Psychopathy in bulgaria: the cross-cultural generalizability of the hare psychopathy checklist. Journal of Psychopathology and Behavioral Assessment, 36, 389–400. doi:10.1007/s10862-014-9405-6
Yokota, K. (2012). The validity of a three-factor model in ppi-r and social dominance orientation in japanese sample. Personality and Individual Differences, 53, 907–911. doi:10.1016/j.paid.2012.07.006
Yuan, K. (2005). The effect of skewness and kurtosis on mean and covariance structure analysis: the univariate case and its multivariate implication. Sociological Methods & Research, 34, 240–258. doi:10.1177/0049124105280200
Zumbo, B. D. (2003). Re-visiting exploratory methods for construct comparability: is there something to be gained from the ways of old? In Construct Comparability Research: Methodological Issues and Results (pp. 1–25).