crop residues can affect n leaching over at least two winters
TRANSCRIPT

European Journal of Agronomy 15 (2001) 17–29
Crop residues can affect N leaching over at least twowinters
Ross Mitchell a,*, John Webb a, Roland Harrison b
a ADAS Wol�erhampton, Woodthorne, Wergs Road, Wol�erhampton, WV6 8TQ, UKb ADAS Boxworth, Boxworth, Cambridge, CB3 8NN, UK
Received 19 February 1999; received in revised form 13 July 2000; accepted 2 August 2000
Abstract
Overwinter nitrate leaching and periodic measurements of soil mineral N (SMN) to 90 cm depth, were taken for20 months after components of various arable crop residues had been ploughed into a free-draining sandy loamtextured soil in central UK. Treatments were arranged to incorporate either, below ground residues; above groundresidues with their own below ground residues; or, the above ground residues separately with the below groundresidue of a preceding under-fertilised barley crop. The combination of these treatments allowed separate quantifica-tion of the SMN and N leached from the above and below ground residues. The residues were incorporated(12/9/1995) and a crop of barley fertilised with 90 kg ha−1 N sown (14/9/1995). Immediately after the residuesincorporation SMN was greatest where cabbage, potato and over-fertilised wheat had been grown. It was leastfollowing under-fertilised wheat and sugar beet. The N leached in the following winter (1995/1996) was stronglyrelated to this preceding SMN (6/11/1995). There was considerable variation in N leached in 1995/1996 after theincorporation of below ground residues (18–145 kg ha−1 N). The greatest losses were after incorporating theover-fertilised wheat, potatoes and cabbage (58–145 kg ha−1 N), the smallest after sugar beet (18 kg ha−1 N). Thenet effect of above ground residues on N leached in 1995/1996 also varied, but their additional effect was far less(−19 to 15 kg ha−1 N). The abover-ground residues of sugar beet and cabbage increased N leaching by 5–15 kgha−1 in 1995/1996, while the above-ground residues of cereals tended to reduce leaching (−19 to 2 kg ha−1). By theharvest of the subsequent under-fertilised barley crop (30/7/1996), and all subsequent sampling dates, there was noeffect of previous crop residue treatments on SMN. N leached in 1996/1997, however, varied significantly. Leachingwas again greatest from the below-ground residues of potato (69–83 kg ha−1 N) and cabbage (112–115 kg ha−1 N).Leaching from these residues of sugar beet remained small (15–24 kg ha−1) in 1996/1997. N leached in this secondwinter from the below-ground, with and without above-ground residues, was therefore, very strongly related to Nleached the previous winter (r2=0.93). Relative to the below ground residues, the above ground residue again hadfar less effect on N leached in 1996/1997. The above ground residue of sugar beet again increased N leaching by thegreatest margin (9–10 kg ha−1 in 1996–1997), cereals again tended to reduce N leaching (−16 to 4 kg ha−1). N
www.elsevier.com/locate/eja
* Corresponding author. Present address: Bureau of Sugar Experiment Stations, PMB 57, Mackay Mail Centre, Queensland 4741,Australia. Tel.: +61-7-49545100; fax: +61-7-49545167.
1161-0301/01/$ - see front matter © 2001 Elsevier Science B.V. All rights reserved.
PII: S1161-0301(00)00088-5

R. Mitchell et al. / Europ. J. Agronomy 15 (2001) 17–2918
leached in this second winter from the above ground residues was, therefore, very strongly related to N leached theprevious winter in 1995/1996 (r2=0.69). © 2001 Elsevier Science B.V. All rights reserved.
Keywords: Crop residues; Mineral N; Nitrate leaching; Medium term
1. Introduction
The aerial residues of temperate arable cropsmay typically contain ca. 20–120 kg N ha−1
(Jensen and Hahr, 1990; Van Faassen and Leb-bink, 1990). In addition, there is a more poorlyquantified amount of N in their unharvestedroots. There is also a potential source of N inunused fertiliser and soil organic matter (SOM),especially recent additions (Gregorich et al.,1997). The physico-chemical and biological labil-ity of these various sources of N, means thequantity and timing of N release, via mineralisa-tion, is likely to vary (Shen et al., 1989).
Once mineralised from the residues or SOM,the N can contribute to the fertiliser requirementsof subsequent crops (Schro� der et al., 1997), or bea pollutant. These include nitrate leaching to wa-ter sources (Francis et al., 1994; Whitmore, 1996),and gaseous losses to the atmosphere (McKenneyet al., 1995). The rates of these processes arestrongly linked to environmental variables, so thefate of mineralised N will largely depend on whenit is released. Nitrate leaching is greatest overwin-ter, when there is net water drainage, typicallybetween October and March in the predominantlyarable areas of the UK.
Estimates of nitrate leaching are conventionallyderived from SMN measured immediately beforethe soil water potential reaches field capacity (An-thony et al., 1996). Current models predict that Nderived from fresh organic residues will rapidlydecrease in significance (Bradbury et al., 1993).Cover crops have, however, not only increased theN uptake of the crop grown immediately aftertheir incorporation, but also the succeeding crop,harvested 18 months later (Schro� der et al., 1997).There is also general evidence that sugar beetresidues may increase N leaching in the secondwinter after their incorporation on light texturedsoils (Shepherd et al., 1997).
The objective of this study was to quantify theeffects of components of arable crop residues, onboth SMN and N leached, for more than 1 year.It was also the intention to isolate the net effectsof residue shoots and identify differences in SMNand N leaching after incorporation with their ownbelow-ground residues, or after incorporationwith the below ground residue of another crop.
2. Materials and methods
2.1. Crop residues and experiment design
Eight arable/horticultural crops (Brassica napusoleifera, oilseed rape; Hordeum �ulgaris, barley;Solanum tuberosum, potato; Brassica oleracea,cabbage; Triticum aesti�um, wheat; Pisum sati�um,pea; Vicia faba, bean; Beta �ulgaris, sugar beet),were grown on a uniform, free draining, sandyloam (9% clay, 20% silt and 80% sand) soil(Bridgnorth Series by Soil Survey of England andWales; a Cambisol by FAO/UNESCO), in centralUK. The soil pH was 6.5. It contained 1.4%organic carbon and 0.14% total N, so the C:Nratio was 10. The site had been in a locally typicalarable crop rotation (cereal, potatoes, cereal,sugar beet) for �20 years, during which periodno organic manures were added.
The experiment was designed to investigatechanges in SMN and N leaching following thesecrops, and also to separate the contribution oftheir above ground (AG) and below ground (BG)components. The total effect of all soil and cropresidue components (TOT) was quantified by in-corporating the AG and BG together. All the AGresidues were reapplied at a rate equivalent to thatthey were harvested at (Table 1). The individualeffect of the BG was quantified by removing AGand incorporating only the below-groundresidues. All the treatments were present in each

R. Mitchell et al. / Europ. J. Agronomy 15 (2001) 17–29 19
of the three fully replicated, randomised blocks ofsplit-plot design, with BG residues as the mainfactor and addition of AG residues as the splittingfactor. The BG implicitly includes all N within thesoil system, including root residues, SMN and soilorganic N.
All the crops were grown according to typicalagronomic practice, except the wheat, which re-ceived three rates of N fertiliser (Table 1). Thewheat 1 crop received 80 kg ha−1 N, 100 kg ha−1
less than recommended (MAFF, 1994). The wheat2 treatment had the recommended N fertiliser input(180 kg ha−1 N), the wheat 3 treatment had anadditional 100 kg ha−1 N (280 kg ha−1 N). All thecrops, bar sugar beet and cabbage (Table 1) wereconventionally harvested (potatoes as a secondearly crop) and the crop residues removed andair-dried at ambient temperature for storage. Thecrop residues were removed for storage to avoidexcessive leaf-drop onto the plots. The sugar beetand cabbage crops were harvested on 11/9/1995and the AG removed and stored prior to use. Thesugar beet and cabbage were harvested about30–60 days earlier than would be typical to allowall the treatments to be applied concurrently.
All crops were grown in plots of 7–12×12 m,except the wheat 1. All the main plots were split byadding AG residues of the crops grown. Half ofeach of the main plots had their AG residues
reapplied (TOT) on 12/9/1995. The remaining halfof each plot had no AG residue applied, so wereBG residues only. No attempt was made to separatethese components. The net effect of the AG, on Nleached or SMN, was calculated as follows:
AG=TOT−BG (1)
Wheat 1 (fertilised with 80 kg ha−1 N) wasgrown in larger plots (39×12 m). Each was splitinto sub-plots by adding AG residues (AGWheat 1)from the ten crops grown (each of the eight crops,with wheat at two further N fertiliser inputs) on12/9/1995. Three sub-plots received no AGresidues. These sub-plots had only the BG residuesof Wheat 1 (BGWheat 1). The Wheat 1 treatmentsallowed the effect of all AG residues (AGWheat1) ona uniform BG base of low N content to becalculated. The relative effect of AGWheat 1 could,therefore, be studied without confounding by theBG component:
AGWheat 1=TOTWheat 1−BGWheat 1 (2)
All the AG residues were spread on 12/9/1995.This was 1 day after harvesting the sugar beet andcabbage and, therefore, minimised the storage ofresidues with the least dry matter concentration(Table 1). Representative sub-samples of all AGresidues were removed and analysed for dry matterand total N (Table 1, Harper and Lynch, 1981). Allthe plots were then ploughed on 12/9/1995.
Table 1Mean characteristics of the above ground (AG) residues (stubbles were not included in AG residues)
Above ground Total appliedCharacteristics (% DM)Harvest dateN Applied(kg ha−1)residuea
Dry matter Total N C:N ratio Total N (kg ha−1)Dry matter (t ha−1)
8718/7/199580Wheat 1 162.1520.7725180Wheat 2 3.0480.838718/7/1995
Wheat 3 2.6280 2218/7/1995 83 0.86 470.79 51 3.2 25Barley 11/7/199590 881.00 40 3.8 38Oilseed rape 25/6/1995120 88
272.3341.16Peas 8215/6/19950480 2.1 1712/7/1995 84 0.83Beans
240 30/6/1995 82Potatoes 2.48 16 2.0 5011/9/1995 1256.3201.99125 17Sugar beet
250 11/9/1995 15 2.88 14 3.1Cabbage 89
a Above-ground residue not removed during typical harvest.

R. Mitchell et al. / Europ. J. Agronomy 15 (2001) 17–2920
A test crop of Hordeum �ulgaris (barley) wasthen sown on 14/9/1995. This allowed for closerrepresentation of agricultural practice, although itreceived only 90 kg N ha−1 fertiliser (half therecommended rate, MAFF, 1994). This economi-cally sub-optimal N application rate was intendedto minimise interference of fertiliser-N with subse-quent measurements, while still producing a vi-able and uniform crop.
2.2. Soil mineral N (SMN) and N leaching
Soil mineral N (SMN) was calculated fromconcentrations of NO3
−–N and NH4+–N in 2 M
KCl extracts of soil (MAFF, 1986) removed be-fore and at intervals after incorporating the treat-ments. Semi-cylindrical augers were used toremove 20 cores from each plot. Each core was 90cm deep and separated into 30 cm increments.Samples were bulked by depth prior to analysis.Soil samples were first taken immediately prior tothe treatment incorporation (11/9/1995). It wasthen repeated, post treatment application (21/9/1995); before the first winter’s drainage (6/11/1995); after first winter’s drainage (12/4/1996);post harvest of the test crop (30/7/1996); beforesecond winters drainage (14/10/1996); and, aftersecond winters drainage (22/4/1997).
Concurrent samples of soil water were removedfrom porous cups during estimated periods ofwater drainage. These cups representatively sam-ple soil solution in apedal, sandy soils (Webster etal., 1993), as at this site. Porous cups (4–6 persub-plot, depending on the crop) were installed(Lord and Shepherd, 1993) in each sub-plot to 90cm depth, at a 30° angle on 20/9/1995. The angleminimised disturbance of the soil immediatelyabove the cups. The IRRIGUIDE model (Baileyand Spackman, 1996) estimated the periods andvolumes of water drainage on a daily time-step.These drainage volumes were only included intotal drainage where at least 50% of the porouscups could sample soil water at 90 cm. Soil watersamples were taken overwinter in 1995/1996 (16/11/1995–30/3/1996) and 1996/1997 (30/10/1996–1/4/1997). Samples were taken every 2 weeks, orfollowing the accumulation of 50 mm rain,whichever came first. Samples were frozen for
storage, then thawed at room temperature priorto analysis of nitrate and ammonium concentra-tions (MAFF, 1986). The mineral N (nitrate plusammonium) leached below 90 cm depth was thencalculated from the mineral N concentrations andthe estimated drainage volumes, following thetrapezoidal method (Lord and Shepherd, 1993).
The net effect of AG residues on changes in themineral N pool (SMN and N leached) during theexperiment (11/9/1995–22/4/1997), were alsocalculated:
�t 0− tn
AGNi=�AGNleached− �t 0− tn
AGSMN (3)
where, AGNi is the total change in inorganic Nbetween the final sampling point (tn) and thebeginning of the experiment (t0); AGNleached is thenet effect of the AG residue on N leached in1995/1996 and 1996/1997; �AGSMN is the neteffect of AG residue on the difference in SMNbetween the experiments start (t0) and end (tn).
2.3. Climate
Rainfall, air and soil temperature (15 cmdepth), were measured throughout the experimentusing tipping bucket rain gauges and electronicdataloggers. Back-up data was available from ameteorological station less than 1 km distant.
2.4. Statistics
Treatment means of SMN and N leached werecompared by analysis of variance (ANOVA). Aone-factorial ANOVA was performed onBGWheat1, TOTWheat1, AGWheat1 and AG datasets.A two-factorial ANOVA was performed on BGand TOT datasets, with BG as the main factorand addition of AG residues as the secondaryfactor. Significant differences can be calculatedfrom the least significant differences (5% level)presented. These have been included with tableddata, but are only pertinent when the ANOVAindicates that factor was statistically significant(P�0.05).
All the regressions were calculated by the leastsquares method. All analyses utilised GENSTATsoftware (Genstat Committee, 1987).

R. Mitchell et al. / Europ. J. Agronomy 15 (2001) 17–29 21
Fig. 1. N leached (kg ha−1) from individual plots for twowinters after adding below ground and below plus aboveground residues crop residues (BG, BGwheat 1, TOT andTOTwheat 1). NB, this figure contains data from individualplots. Data in Table 2 represent treatment means.
The larger N fertiliser applications to the wheatonly marginally increased the N concentration oftheir above ground crop residues (Table 1).
Greater detail of the effects of individual treat-ments will follow in subsequent Section 3.4. Someconsistent trends, however, will be presented firstSection 3.3.
3.3. General trends
3.3.1. Autumn soil mineral N (SMN) and Nleached in 1995/1996
The SMN content immediately before the in-corporation of all BG residue treatments variedsignificantly between treatments (Table 2), pre-sumably due to the effects of the crops grown.The SMN before drainage (6/11/1995) wasstrongly related to the subsequent N leached inthe 1995/1996 winter (r2=0.72), with 0.36–0.76kg ha−1 of N leached for every kg ha−1 SMN(relationship not presented, mean data in Table2).
3.3.2. N leached in 1995/1996 and 1996/1997N leaching losses in 1996/1997, varied consider-
ably within BG and TOT treatments (Table 2).Although the differences in N leached betweenTOTWheat 1 treatments were far less, they were stillsignificantly different (Table 3). The variations inN leaching were not related to the SMN immedi-ately before drainage started in this second winterafter drainage started (14/10/1996). It was how-ever, strongly related to the N leached during1995/1996. Linear regression on N leached fromall individual plots in 1995/1996 explained 93% ofthe variation in N leached in 1996/1997 (Fig. 1,mean data in Table 2). This strong relationshipmeant that for every kg N ha−1 leached in 1995/1996, a further 0.70 kg N ha−1 was leached in1996/1997.
There was also a strong relationship betweenextra affect of the AG residues on N leached in1995/1996 and 1996/1997 (Fig. 2, mean data inTable 4). This explained 69% of the variation inextra N leached in 1996/1997. The net effect ofAG residues on N leached in 1996/1997 was, onaverage, ca. 60% of their net effect on N leachedin 1995/1996.
Fig. 2. Net additional effect of the above ground crop residues(AG and AGWheat1) on N leached (kg N ha−1) from individ-ual plots for two winters. NB, this figure contains data fromindividual plots. Data in Table 4 represent treatment means.
3. Results
3.1. Climate
The mean temperature was atypically high(mean=11.7°C, long-term mean=10.0°C) andthe total rainfall atypically low (150 mm rain,long-term average=286 mm) during the maingrowing period (February–July 1995) of the treat-ment crops.
3.2. Crop residues
The sugar beet, cabbage and potatoes AG con-tained both the greatest concentration (2.0–2.9%DM) and quantity of N (50–125 kg N ha−1,Table 1). All other residues contained �1.2%DM N, with the cereals and beans having thesmallest concentration and content (�30 kg Nha−1, Table 1).
R.
Mitchell
etal./
Europ.
J.A
gronomy
15(2001)
17–
2922
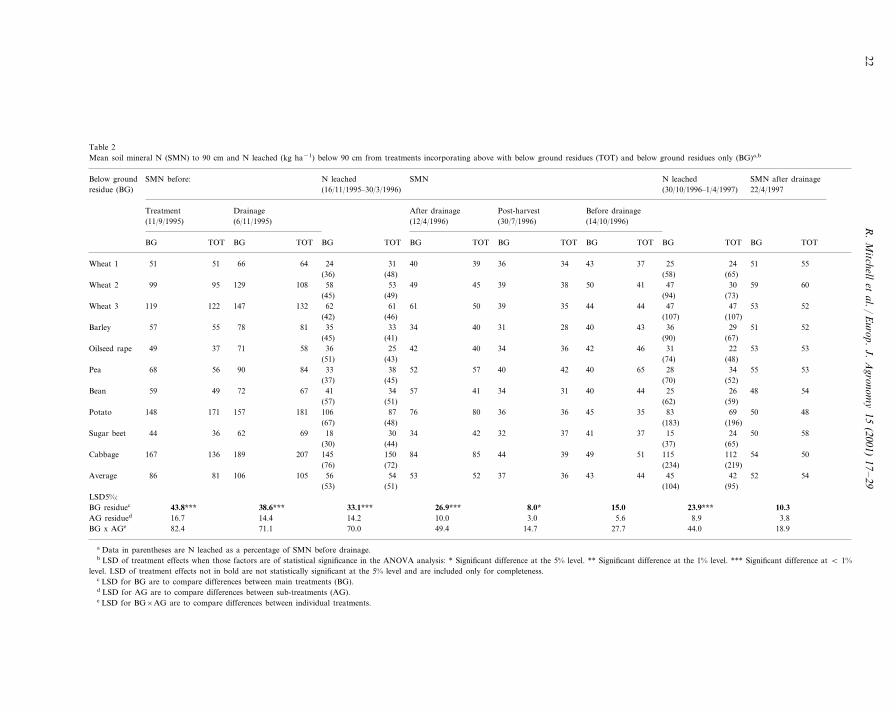
Table 2Mean soil mineral N (SMN) to 90 cm and N leached (kg ha−1) below 90 cm from treatments incorporating above with below ground residues (TOT) and below ground residues only (BG)a,b
SMN before: SMN N leachedBelow ground SMN after drainageN leached(30/10/1996–1/4/1997) 22/4/1997(16/11/1995–30/3/1996)residue (BG)
After drainage Post-harvestTreatment Before drainageDrainage(30/7/1996)(12/4/1996) (14/10/1996)(6/11/1995)(11/9/1995)
TOT BG TOT BG TOT BG TOT BG TOTBG BG TOT BG TOTTOTBG
Wheat 1 6451 24 3151 40 39 36 34 43 37 2566 24 51 55(58) (65)(48)(36)
129 108 5899 53Wheat 2 49 45 39 38 50 41 47 3095 59 60(94) (73)(49)(45)
132 62122 61 61 50 39 35119 44Wheat 3 44 47147 47 53 52(42) (107)(46) (107)
81 35 3357 34 40 31 28Barley 4055 43 3678 29 51 52(45) (41) (90) (67)
58 3637 25 42 40 34 3649 4271 46 31 22Oilseed rape 53 53(74) (48)(51) (43)
84 3390 3856 52 57 40 42 40 65 28 3468 55Pea 53(45)(37) (70) (52)
67 4149 34 57 41 34 3159 40Bean 44 2572 26 48 54(57) (59)(51) (62)
157 181 106 87Potato 76 80 36 36 45 35 83171 69148 50 48(183) (196)(48)(67)
62 69 18 30Sugar beet 34 42 32 37 41 37 1536 2444 50 58(44)(30) (37) (65)
207 145136 150 84 85 44 39167 49189 51 115 112Cabbage 54 50(234) (219)(76) (72)
105 56 5486 53Average 5281 37 36 43 44 45106 42 52 54(51) (95)(53) (104)
LSD5%:38.6*** 33.1*** 26.9*** 8.0* 15.0 23.9*** 10.343.8***BG residuec
AG residued 14.2 10.0 3.0 5.6 8.9 3.816.7 14.470.0 49.4 14.7 27.7 44.071.1BG x AGe 18.982.4
a Data in parentheses are N leached as a percentage of SMN before drainage.b LSD of treatment effects when those factors are of statistical significance in the ANOVA analysis: * Significant difference at the 5% level. ** Significant difference at the 1% level. *** Significant difference at � 1%
level. LSD of treatment effects not in bold are not statistically significant at the 5% level and are included only for completeness.c LSD for BG are to compare differences between main treatments (BG).d LSD for AG are to compare differences between sub-treatments (AG).e LSD for BG×AG are to compare differences between individual treatments.

R.
Mitchell
etal./
Europ.
J.A
gronomy
15(2001)
17–
2923
Table 3Mean soil mineral N (SMN) to 90 cm and N leached (kg ha−1) below 90 cm from treatments incorporating below ground residues of the Wheat1 treatment with theabove ground residues of other crops (TOTWheat1)a
SMN N leached SMN N leachedAbove ground SMN afterBelow grounddrainageresidue residue (30/10/1996–1/4/1997)
After harvestBeforeBefore Before(16/11/1995 After drainage(22/4/1997)(AG(Wheat1))(BG(Wheat1)) residues (12/4/1996) drainagedrainage (30/7/1996)
–30/3/1996)(14/10/1996)(6/11/1995)(11/9/1995)
36 43 25 512451 66 40Wheat 1 NoneWheat 1 39 34 37 24 5551 64Wheat 1 31Wheat 2 40 33 44 20 4951 61Wheat 1 21
33 42 30 5033Wheat 1 306251Wheat 323 40 33 44 26 5151Wheat 1 64Barley
39 43 27 5852Oilseed rapeWheat 1 24665137Peas 38 42 25 5351 63 27Wheat 150Beans 31 45 28 4851 66 26Wheat 1
35 46 30 4640Wheat 1 307551Potatoes43Wheat 1 46Sugar beet 35 5251 78 39 4640 43 31 455373 34Wheat 1 Cabbage 51
20.4 15.3 12.3 6.7 12.2– 10.0 8.1LSD5%28** 43 36 43 26** 51Average 51 67**
a Average and LSD indicate a significant treatment effect:*Significant difference at 5% level. **Significant difference at 1% level. ***Significant difference at �0.1%level.

R.
Mitchell
etal./
Europ.
J.A
gronomy
15(2001)
17–
2924
Table 4Net additional effectA of the above ground residues (AG and AGWheat 1) incorporated with their own below ground residues (BG), or the below ground residue ofWheat 1 (BG(Wheat1)), on soil mineral N (SMN) to 90 cm and N leached (kg ha−1) below 90 cma
SMN before TotalBelow SMN before N leachedAbove N leached SMN afterSMN(30/10/1996–1/4/1997) drainage(16/11/1995–30/3/1996)drainage changeBresiduesgroundground
Afterresidue After(11/9/1995) (6/11/1995) Before (22/4/1997)residuedrainage harvest drainage
(30/7/1996)(12/4/1996) (14/10/1996)−2 −6 −1 4 9−1Wheat 1 7−20Wheat 1
Wheat 2 −1Wheat 2 −9 −16 2 −16−4 −21 −5 −4−4 0 0 −0 −3−11Wheat 3 −0−153Wheat 3−3 3 −8 1 −7Barley Barley −2 2 −2 6
2 3 −9 1 −8−2Oilseed rape −11−12−12Oilseed rape−5Pea 2 25 6 −2 21−12 −5 5Pea
−3 4 1 6 10−16BeanBean −7−4−104Potato 1 −10 −14 −2 −5923 23 −19Potato
11 8 5 −4 9 8 35−8Sugar beet 8Sugar beet−5 1 −3 −4 3005Cabbage Cabbage −31 19
−2 (36.2) −0 (10.2) 3 (34.0) −3 (26.9) 1 (13.8)Average 1−5* (17.1) −1* (33.2) −2 (39.2)(LSD5%)
−3 0 −5 −2−3 −110−60Wheat 1Wheat 2Wheat 1 −7 −4 −2 4 −1 100 −4Wheat 3 6
−3 0 1 0 0−0Wheat 1Barley −1−2013Wheat 1 3 −0 1 7 80 −0 −0Oilseed rape
2Pea −1Wheat 1 −0 2 50 −3 3 −2−5 2 3 −3 210Bean 2−00Wheat 1−1 2 5 −5 7Potato Wheat 1 0 8 6 −0
7 3 10 1 267Sugar beet 15120Wheat 110 14 4 −0 6 −6 10Cabbage 0Wheat 1 7
4 (21.4) 0 (16.3) 0 (13.0) 3** (7.0) 2 (12.9) 64** (10.2)1** (10.6)0Average(LSD5%)
a Bold average and LSD indicate a significant treatment effect: * Significant difference at 5% level. ** Significant difference at 1% level. *** Significant differenceat � 1% level. A=net effect of above ground residues (Eqs. (1) and (2), Section 2 for clarification). B= total change in SMN (11/9/1995–22/4/1997) deducted fromtotal N leached (Eq. (3), Section 2 for clarification)

R. Mitchell et al. / Europ. J. Agronomy 15 (2001) 17–29 25
3.4. Effects of specific treatments
The net water drainage in 1995/1996 followedthe growth of different crops. The total drainagevolumes following these treatments, however,were similar (104–130 mm). This, therefore, hadonly a marginal effect on the flow-averaged ni-trate-N concentrations (16–131 mg N l−1 in1995/1996; data not reported). The drainage in1996/1997 was uniform across all previous treat-ments. The flow-averaged concentration of nitratein drainage water (10–80 mg N l−1 in 1996/1997,data not reported) was, therefore, not affected bytreatment. Flow-averaged nitrate concentration indrainage water is, therefore, not reported as it hadvery comparable trends to the reported data onabsolute quantities of N leached (kg ha−1).3.4.1. Effect of entire crop residues (TOT)
The increased N fertiliser applied to the winterwheat increased the N potentially available to thesubsequent test crop. Greater fertiliser applicationto the wheat progressively increased SMN beforetreatment (11/9/1995) and drainage (6/11/1995) in1995 (Table 2). This was reflected in the greater Nleached in 1995/1996 from wheat with greaterinitial N input (Table 2). From the end of thisfirst winters drainage (12/4/1996), to the experi-ment end (22/4/1997), the measured SMN of theTOT wheat 2 and 3 were comparable to the wheat1 (Table 2). Despite this the N leached from theTOT wheat 2 and 3 in the second winter was6–23 kg ha−1 greater than after wheat 1 (Table2).
The TOT of potatoes and cabbages also in-creased SMN and N leached (Table 2). Theyinitially had the greatest SMN contents and sub-sequently the greatest N leached of TOT residuesin 1995/1996. Despite this greater N leaching ex-tra SMN persisted to the end of this first drainageperiod (12/4/1996). The SMN of potato and cab-bage TOT treatments from the test crops harvest(30/7/1996) onwards was, however, comparable tomost other TOT residues (Table 2). Conversely,overwinter N leaching from the TOT cabbage andpotato residues in 1996/1997 was greater than anyother TOT residue (Table 2). This correspondedto the greater quantity of N previously leachedfrom these treatments in 1995/1996.
The TOT of cereals (except wheat 2 and 3),oilseed rape, pea, bean and sugar beet residues,had relatively little SMN, and consequently, rela-tively less N was leached 1995/1996 (Table 2).This scenario of relatively low mineral N concen-trations and leaching losses continued for theseTOT residues throughout the experiment.
3.4.2. Effect of root residues and soil N (BG)The BG significantly affected the SMN and N
leached (Table 2). As for their TOT residues, theBG wheat with the greater N fertiliser appliedinitially had progressively more SMN (Table 2),and then greater N leached in 1995/1996. In addi-tion, the SMN immediately following this periodof drainage tended to be greater, though notsignificantly. From the test crop’s harvest (30/7/1996) to the experiments end (22/4/1997), theSMN of the wheat 2 and 3 BG were comparableto the wheat 1 (Table 2). However, the N leachedfrom these BG in the second winter was greater(not significant at 5% level) than the wheat 1. Thiscorresponded to the greater N leached from thesetreatments in 1995/1996.
The BG of potatoes and cabbages also consis-tently increased the SMN and N leached (Table2). They initially had the greatest SMN contentsof BG treatments and subsequently the greatest Nleached in 1995/1996. Despite this leaching theextra SMN persisted into March 1996. However,from the test crop’s harvest (30/7/1996) to theexperiments finish (22/4/1997) the SMN of thepotato and cabbage was comparable to other BGtreatments (Table 2). Conversely, after this har-vest the overwinter leaching in 1996/1997 were,again the greatest of any BG treatment.
The BG of cereals (except wheat 2 and 3),oilseed rape, peas, beans and sugar beet, had littleconsistent effect on SMN and consequently rela-tively small N leaching losses in 1995/1996 (Table2). This continued until and beyond the test cropwas harvested (30/7/1996–22/4/1997).
3.4.3. Shoot residues (AG and AG(Wheat1))In addition to variation in SMN following in-
corporation of the BG residues, there was anadditional affect of the various AG residues(Table 4). The net effect of each AG residue on N

R. Mitchell et al. / Europ. J. Agronomy 15 (2001) 17–2926
leached and SMN was fairly consistent and notgrossly affected by the BG residues they wereincorporated with (compare net effect of the sameAG residues incorporated with BG or BGWheat 1
on the total change in organic N, Table 4). Theonly exception was the potato AG residue. Itstotal effect on inorganic N depended greatly onthe BG it had been incorporated with (−59 kgha−1 N on potato BG; +7 kg ha−1 N onBGWheat1, Table 4).
The AG residues had a net effect on N leachedin the winter of 1995/1996 (Table 4). The AG ofcabbage and sugar beet, increased N leached by5–15 kg ha−1, with both their own BG andBGWheat 1 residues. These residues had a greater Ncontent than any other AG residue (Table 1). TheN concentration was also relatively great and theC:N ratio was consequently narrow (Table 1).
Other AG residues had little consistent net ef-fect on N leached. The cereals, oilseed rape, peasand beans, often caused a net reduction in Nleached, or SMN overwinter to 12/4/1996, buttended to have little consistent total effect (Table4). All these AG residues had both small Nconcentrations (0.8–1.2% N), consequently wideC:N ratios, and small N contents (Table 1).
After the test crops harvest (30/7/1996), therange of SMN between all the treatments wasrelatively small (Tables 2 and 3). However, aspreviously presented, the AG residues had a sig-nificant effect on N leached in the second winter,1996/1997 (Fig. 2). The AG of sugar beet contin-ued to contribute the greatest amount to Nleached. Although they generally tended to reflectthe N leached in 1995/1996, none of the other AGresidues consistently affected N leached in 1996/1997 (Table 4).
4. Discussion
The large variation between treatments in SMNbefore incorporating the residues of differentiallyfertilised wheat crop, concurs with previous re-sults (Chaney, 1990; Shepherd and Sylvester-Bra-dley, 1996; Lord and Mitchell, 1998). They founda large increase in SMN after excessively fertilisedarable crops. The observed large differences be-
tween wheat treatments may have been exacer-bated in this experiment, by the unusually warmand dry weather during their growing season. Theclimatic conditions were very atypical, and thedegree of variation in post-harvest SMN may notbe repeated under more typical conditions, wherenutrient uptake may be greater (Jensen, 1987).
The N leached in the subsequent winter (1995/1996) was related to the preceding SMN. TheSLIMMER model (Anthony et al., 1996) calcu-lated that 47–59% of the available SMN would beleached after the various crops. This was in gen-eral agreement with our observed estimate of36–76%. It has also been shown that the arablecrops in UK fertilised for economically optimalproduction, tend to leach more N (Lord andMitchell, 1998) than the 17–34 kg N ha−1 thatwould generally be allowed to satisfy currentdrinking water legislation (total drainage=150–300 mm). Indeed, to meet these requirements ourdata suggests only 30–60 kg ha−1 SMN could bepresent before drainage started. Most commercialcrops in UK frequently have �80 kg ha−1 post-harvest SMN, only sugar beet had �50 kg ha−1
after harvest (Williams et al., 1996). If currentlegislation were to be satisfied during wetter win-ters, when most SMN that is not denitrified wouldtend to be leached, the SMN would have to be17–34 kg ha−1.
The AG residues with the greatest N contentand concentration (cabbage and sugar beet), hadthe greatest N leached in 1995/1996. This is con-sistent with previous work, which has demon-strated that N concentration, or C:N ratio, areimportant determinants of N mineralisation fromtemperate crop residues (Jenkinson, 1984; Whit-more, 1996).
The SMN was relatively consistent across allthe treatments by 14/10/1996. The subsequent Nleached in 1996/1997 was, however, very variable.The AG residues alone increased leaching by upto ca. 10 kg N ha−1 in the second winter. Thevariation in second winter N leached within bothTOT and BG treatments, was far greater (ca. 100kg ha−1). The N leached in 1996/1997 was notrelated to the preceding SMN, but strongly re-lated to the corresponding N leached in 1995/1996. This indicates that a significant and

R. Mitchell et al. / Europ. J. Agronomy 15 (2001) 17–29 27
potentially leachable source of N, not measuredas SMN, was retained in the soil and had aresidual impact into the second drainage period,14–20 months after their addition.
The residual effect of organic residues and fer-tiliser on N dynamics has been previously demon-strated. Fertiliser N applied to oilseed rape andpotato crops, can increase the uptake of N andgrain yield of subsequent cereal crops (Shepherdand Sylvester-Bradley, 1996; Webb et al., 1997).Schro� der et al. (1997) have shown that covercrops can affect N uptake of crops harvested 18months after their incorporation. Also, the Nleaching was not dependent on SMN after theharvest of the previous crop, but to differentialmineralisation in the autumn before drainagestarted (Hansen and Djurhuus, 1996). This wasapparently due to indirect effects of the quality ofcrop residues returned.
We are not, however, aware of any reports ofsuch large residual N leaching losses as observedin this experiment. The mechanism of the cropresidues residual effect on N leaching was notfurther investigated, but the only alternative toSMN would be SOM-N. Previous work hasshown that as N fertiliser inputs increase, so thereis greater retention of N in SOM (Glendining andPowlson, 1991; Bhogal et al., 1997), or perhapsmore importantly, in a more mineralisable frac-tion of SOM (Gregorich et al., 1997). Such physi-cally or chemically distinguishable fractions ofSOM have also been shown to be strongly relatedto additions of fresh organic matter (Hassink,1995a; Barrios et al., 1996) and N fertiliser (Gre-gorich et al., 1997) and is a particularly influentialsource of N (Golchin et al., 1995; Hassink, 1995b;Barrios et al., 1996). It can, therefore, be expectedthat at least part of the crop residues, or residualN fertiliser, contributed to the soil’s active organicmatter. This has a proposed half-life of ca. 6 years(Gregorich et al., 1997), which suggests its influ-ence would persist for at least the 20 months ofthis experiment.
It has also been demonstrated that fresh cropresidues are approximately seven times more min-eralisable than native SOM (Shen et al., 1989),and they increase the amount of other rapidlyturning over organic matter, e.g. soil microbial
biomass (Ocio et al. 1991a; Ocio et al., 1991b;Fauci and Dick, 1994; Ladd et al., 1994). Thislabile SOM could potentially be partially retained,or recycled in an available form for the secondwinter. If the residually leachable source of N wasakin to microbial biomass, with a C/N ratio of 8.5(Bradbury et al., 1993), the AG residues wouldhave to add ca. 0–130 kg ha−1 C to a residuallyleachable pool. If this was assimilated at 50%efficiency and the original residues contained 40%C, equivalent to 0–660 kg ha−1 DM of residue(0–22% initially applied DM) would be required.
Whatever its source, the N leaching losses inthe second winter after applying some cropresidues, remained very high (�100 kg N ha−1
for BG and TOT cabbage). Indeed, the differencesbetween the greatest and smallest leaching lossescaused by the crop shoot residues alone (27 kg Nha−1), would equal the quantity allowed to satisfythe current drinking water legislation under typi-cal UK conditions (17–34 kg N ha−1). Thissuggests that these unexplained crop residue Nleaching losses in the second winter after applica-tion are significant and, therefore, warrant furtherinvestigation.
5. Conclusions
Residues, both plant and soil components, oftemperate arable crops can have large effects onSMN and subsequent N leached. The N leachedin the winter after incorporating the residues wasstrongly related to preceding SMN. SMN and Nleaching in this first winter were greatest for thebelow ground residues of potato, cabbage andover-fertilised wheat, and least for sugar beet. Theabove-ground residues of sugar beet and cabbagehad greater effects on SMN and N leached thanother AG residues.
After the first winters leaching of N and subse-quent crop uptake, there was no significant varia-tion in SMN. However, the N leached in thesecond winter was both very variable and some-times great. Again, the greatest losses were frompotato, cabbage and over-fertilised wheat TOTresidues, and the least from sugar beet. This wasnot related to the immediately preceding SMN
R. Mitchell et al. / Europ. J. Agronomy 15 (2001) 17–2928
measurements. Instead, it was strongly related tothe N leached in the first winter.
These results need urgent confirmation. If confi-rmed, the source and mechanism for this secondwinter N leaching will need investigation if themedium and long-term effects of crop residues areto be quantifiably understood.
Acknowledgements
We are grateful to Mark Shepherd for his com-ments while preparing this paper, and to the staffat ADAS Wolverhampton who conducted theexperiment. Financial support from the Ministryof Agriculture Fisheries and Food (MAFF) for allthe work reported here, is gratefullyacknowledged.
References
Anthony S., Quinn P., Lord E.I., 1996. Catchment scalemodelling of nitrate leaching. In: Archer, J.R., Goulding,K.W.T., Jarvis, S.C., Knott, C.M, Lord, E.I., Ogilvy, S.E.,Orson, J., Smith, K.A., Wilson, B. (Eds.), Nitrate andFarming Systems. Aspects Applied Biology 46, pp. 23–32.
Bailey, R.J., Spackman, E., 1996. A model for estimating soilmoisture changes as an aid to irrigation scheduling andcrop water studies: I. Operational details and description.Soil Use Manage. 12, 122–128.
Barrios, E., Buresh, R.J., Sprent, J.I., 1996. Nitrogen mineral-isation in density fractions of soil organic matter frommaize and legume cropping systems. Soil Biol. Biochem.28, 1459–1465.
Bhogal, A., Young, S.D., Sylvester-Bradley, R., O’Donnell,F.M., Ralph, R.L., 1997. Cumulative effects of nitrogenapplication to winter wheat at Ropsley, UK, from 1978 to1990. J. Agric. Sci. (Cambridge) 129, 1–12.
Bradbury, N.J., Whitmore, A.P., Hart, P.B.S., Jenkinson,D.S., 1993. Modelling the fate of nitrogen of crop and soilin the years following application of 15N-labelled fertiliserto winter wheat. J. Agric. Sci. (Cambridge) 121, 363–380.
Chaney, K., 1990. Effects of nitrogen fertiliser rate on soilnitrate nitrogen content after harvesting winter wheat. J.Agric. Sci. (Cambridge) 114, 171–176.
Fauci, M.F., Dick, R.P., 1994. Soil microbial dynamics: shortand long-term effects of inorganic and organic nitrogen.Soil Sci. Soc. Am. J. 58, 801–806.
Francis, G.S., Haynes, R.J., Williams, P.H., 1994. N minerali-sation, nitrate leaching and crop growth after ploughing inleguminous and non-leguminous crop residues. J. Agric.Sci. (Cambridge) 123, 81–87.
Genstat Committee, 1987. A General Statistical Programme.Clarendon, Oxford.
Glendining, M.J., Powlson, D.S., 1991. The effect of long-termapplications of inorganic N fertiliser on soil organic N. In:Wilson, W.S. (Ed.), Advances in Soil Organic MatterResearch: The Impact on Agriculture and the Environ-ment. Royal Society of Chemistry, London, pp. 329–338.
Golchin, A., Oades, J.M., Skjemstad, J.O., Clarke, P., 1995.Structural and dynamic properties of soil organic matter asreflected by 13C natural abundance, pyrolysis mass spec-trometry and solid-state 13CNMR spectroscopy in densityfractions of an Oxisol under forest and pasture. Aust. J.Soil Res. 33, 59–76.
Gregorich, E.G., Drury, C.F., Ellert, B.H., Liang, B.C., 1997.Fertilisation effects on physically protected light fractionorganic matter. Soil Sci. Soc. Am. J. 61, 482–484.
Hansen, E.M., Djurhuus, J., 1996. Nitrate leaching as affectedby long-term N fertilisation on a coarse sand. Soil UseManage. 12, 199–204.
Harper, S.H.T., Lynch, J.M., 1981. The chemical componentsand decomposition of wheat straw leaves, internodes andnodes. J. Sci. Food Agric. 32, 1057–1062.
Hassink, J., 1995a. Density fractions of soil macro-organicmatter and microbial biomass as predictors of C and Nmineralisation. Soil Biol. Biochem. 27, 1099–1108.
Hassink, J., 1995b. Decomposition rate constants of size anddensity fractions of soil organic matter. Soil Sci. Soc. Am.J. 59, 1631–1635.
Jenkinson D.S., 1984. The supply of nitrogen from the soil. In:The nitrogen Requirement of Cereals. Reference book 385ADAS, Ministry of Agriculture Fisheries and Food, Lon-don. pp. 79–83.
Jensen, F., 1987. Irrigation requirements in various growingphases of peas. Danish J. Plant Soil Sci. 91, 113–119.
Jensen, E.S., Hahr, W., 1990. The effect of pea cultivation onsucceeding winter cereals and oilseed rape N utilisation.Appl. Agric. Res. 5, 102–107.
Ladd, J.N., Amato, M., Zhou, L.K., Schmaltz, J.E., 1994.Differential effects of rotation, plant residue and nitrogenfertiliser on microbial biomass and organic matter in anAustralian Alfisol. Soil Biol. Biochem. 26 (7), 821–831.
Lord, E.I., Shepherd, M.A., 1993. Developments in the use ofporous ceramic cups for measuring nitrate leaching. J. SoilSci. 44, 435–449.
Lord, E.I., Mitchell, R.D.J., 1998. Effect of nitrogen inputs tocereals on nitrate leaching from sandy soils. Soil UseManage. 14 (3), 78–83.
MAFF, 1986. The Analysis of Agricultural Materials. HMSO,London, pp248.
MAFF, 1994. Fertiliser Recommendations For Agriculturaland Horticultural Crops. MAFF, reference book 209 (sixthed.). HMSO, London.
McKenney, D.J., Wang, S.W., Drury, C.F., Findlay, W.I.,1995. Denitrification, immobilisation and mineralisation innitrate limited and non-limited residue amended soils. SoilSci. Soc. Am. J. 59, 118–124.

R. Mitchell et al. / Europ. J. Agronomy 15 (2001) 17–29 29
Ocio, J.A., Brookes, P.C., Jenkinson, D.S., 1991a. Field incor-poration of straw and its effects on soil microbial biomassand soil inorganic N. Soil Biol. Biochem. 23, 821–831.
Ocio, J.A., Martinez, J., Brookes, P.C., 1991b. Contributionof straw-derived N to total microbial biomass N followingincorporation of cereal straw to fallow. Soil Biol. Biochem.23, 655–659.
Schro� der, J.J., Ten Holte, L., Janssen, B.H., 1997. Non-over-wintering cover crops: a significant source of N. Neth. J.Agric. Sci. 45, 231–248.
Shen, S.M., Hart, P.B.S., Powlson, D.S., Jenkinson, D.S.,1989. The nitrogen cycle in the Broadbalk wheat experi-ment: 15N-labelled fertiliser residues in the soil and in thesoil microbial biomass. Soil Biol. Biochem. 21, 529–533.
Shepherd, M.S., Sylvester-Bradley, R., 1996. Effect of nitrogenfertilizer applied to winter oilseed rape (Brassica napus) onsoil mineral nitrogen after harvest and on the response ofa succeeding crop of winter wheat to nitrogen fertilizer. J.Agric. Sci. (Cambridge) 216, 63–74.
Shepherd M.S., Lord E.I., Mitchell R.D.J., Groves S.J., 1997.Sugar beet: nitrate leaching after harvest and consequencesfor longer-term losses. In: Bartasova, M. (Ed), Proceedingsof The 60th IIRB Congress, July 1997, Cambridge, UK,pp. 347–351.
Van Faassen, H.G., Lebbink, G., 1990. N cycling in high inputversus reduced input arable farming. Neth. J. Agric. Sci.38, 265–282.
Webb, J., Sylvester-Bradley, R., Seeney, F.M., 1997. Re-sponses of cereals to residual fertiliser nitrogen applied tothe preceeding potato crop. J. Sci. Food Agric. 73, 63–80.
Webster, C.P., Shepherd, M.A., Goulding, K.W.T., Lord, E.I.,1993. Comparison of methods for measuring the leachingof mineral nitrogen from arable land. J. Soil Sci. 44,49–62.
Whitmore, A.P., 1996. Modelling the release and loss of Nafter vegetable crops. Neth. J. Agric. Sci. 44, 73–86.
Williams, J.R., Harrison, R., Silgram, M., Chambers, B.J.,1996. Soil nitrogen supply in arable cropping rotations.Aspects Appl. Biol. 47, 59–66.
.