“crop insurance” for milk? dairy-revenue protection newton.pdf@new10_agecon 4 milk production...
TRANSCRIPT

5/8/17
1
@New10_AgEcon 1
“Crop Insurance” for Milk?
Dairy-Revenue ProtectionDr. John [email protected]
American Farm Bureau Federation
@New10_AgEcon 2
$55.
8
$40.
9
$38.
9
$10.
5
$4.9
$3.4
$2.0
$0
$10
$20
$30
$40
$50
$60
Corn Soybeans Dairy Wheat Cotton Rice Peanuts
Billion Dollars
Source: Congressional Budget Office
Congress Projected Annual Average Crop Market ValueDairy is the 3rd Biggest Crop

5/8/17
2
@New10_AgEcon 3
4%
2%
0.19%26%
15%1%
12%
0%
5%
10%
15%
20%
25%
30%
Corn Cotton Dairy Peanuts Rice Soybeans Wheat
Percent
Source: Congressional Budget Office
Commodity Payments as Share of Crop Market ValueDairy Safety Net Does Not Reflect Value of Industry
@New10_AgEcon 4
Milk Production Areas Highlight Dairy Policy ChallengeWhat’s the Most Common Denominator, Price of Feed or Milk Pricing Framework?
Source: USDA NASS

5/8/17
3
@New10_AgEcon 5
2016 State-Level All-Milk Price
Does One Size Fit All for Dairy Risk Management?Utilization %, Differentials, and Component Levels Create Farm-Level Basis Risk
Range: $13.90 to $19.60Average: $16.38
Source: USDA NASS
@New10_AgEcon 6
Percentage of Feed Purchased, 2016
Is Feed Risk Exposure the Same?Midwest Homegrown and Close Proximity to Feed, South and West Feed Purchasers
Source: USDA ERS
5/8/17
4
@New10_AgEcon
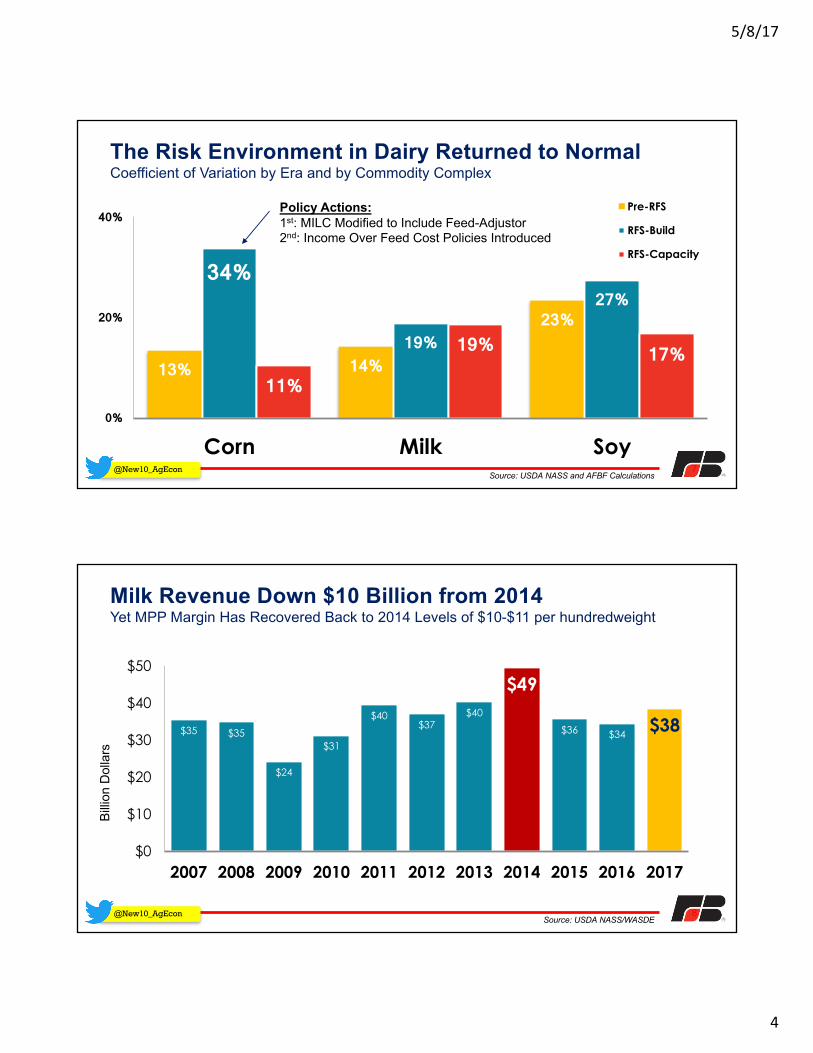
13% 14%
23%
34%
19%
27%
11%
19% 17%
0%
20%
40%
Corn Milk Soy
Pre-RFS
RFS-Build
RFS-Capacity
7Source: USDA NASS and AFBF Calculations
The Risk Environment in Dairy Returned to Normal Coefficient of Variation by Era and by Commodity Complex
Policy Actions:1st: MILC Modified to Include Feed-Adjustor2nd: Income Over Feed Cost Policies Introduced
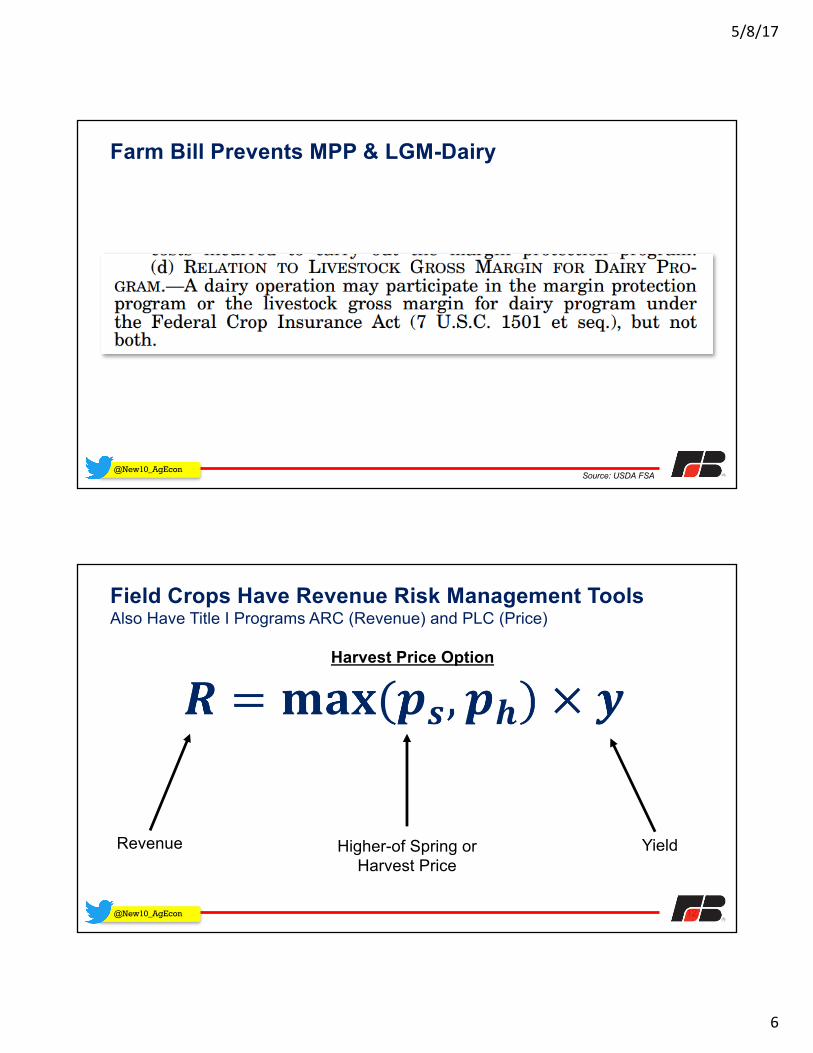
@New10_AgEcon 8Source: USDA NASS/WASDE
Billio
n D
olla
rs
Milk Revenue Down $10 Billion from 2014Yet MPP Margin Has Recovered Back to 2014 Levels of $10-$11 per hundredweight
$35 $35
$24
$31
$40$37
$40
$49
$36 $34 $38
$0
$10
$20
$30
$40
$50
2007 2008 2009 2010 2011 2012 2013 2014 2015 2016 2017

5/8/17
5
@New10_AgEcon
Farm Bureau Policy: Dairy Safety Nets Need to Be Enhanced MPP Performance During 2015 and 2016
Source: USDA FSA
@New10_AgEcon
61% 88% 98%
39% 12%
2%
0%
25%
50%
75%
100%
2015 2016 2017
$4.00 Catastrophic Coverage Buy-Up Coverage
Active Participation in MPP Has DeclinedPercent of Milk Enrolled in MPP by Coverage Election
Source: USDA FSA
5/8/17
6
@New10_AgEcon
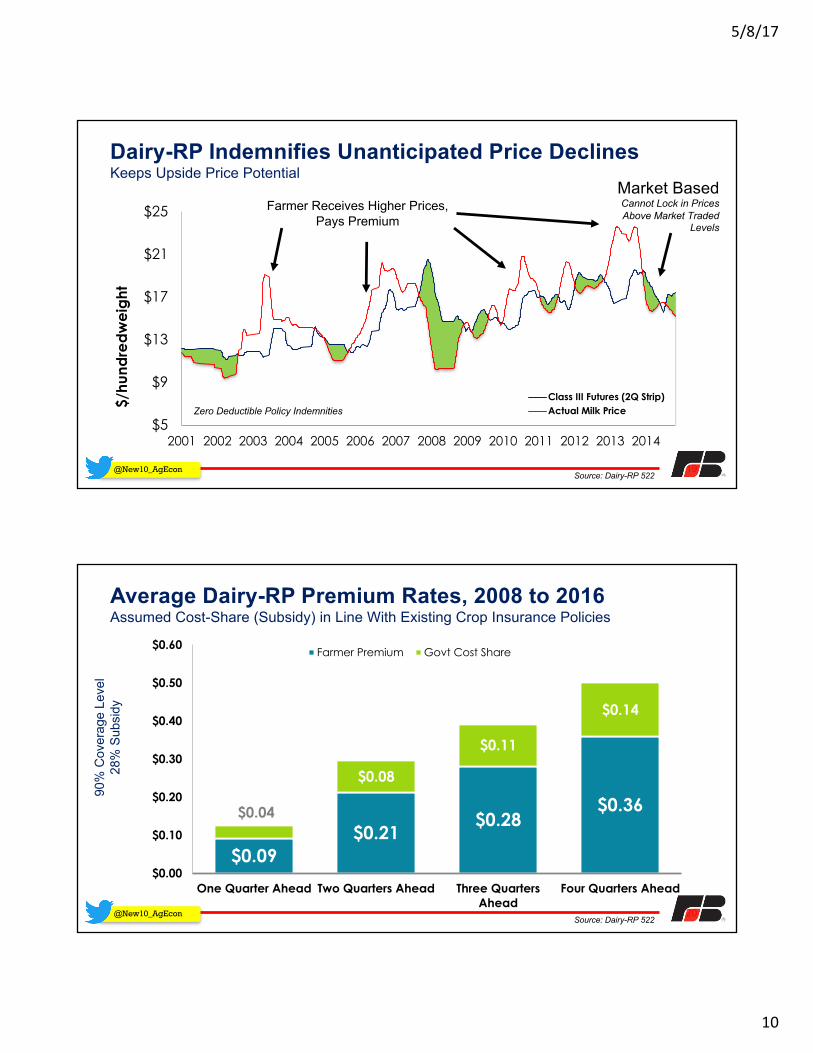
Farm Bill Prevents MPP & LGM-Dairy
Source: USDA FSA
@New10_AgEcon 12
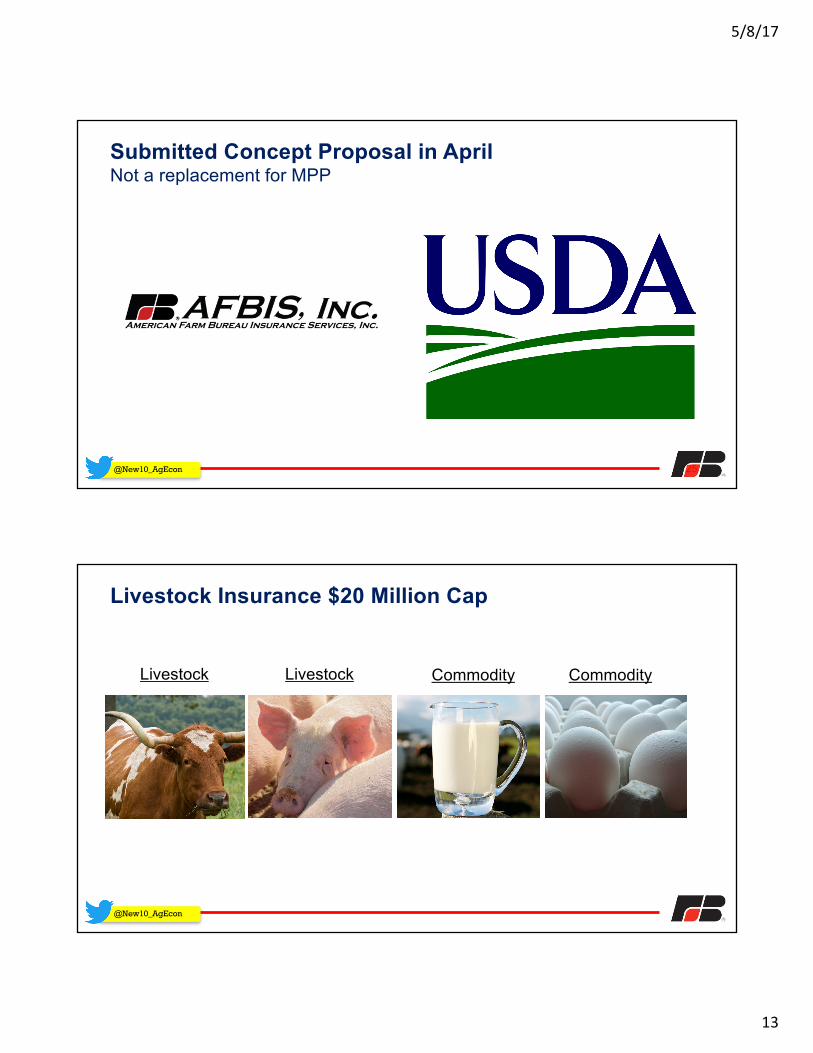
Field Crops Have Revenue Risk Management ToolsAlso Have Title I Programs ARC (Revenue) and PLC (Price)
Harvest Price Option
Revenue Higher-of Spring or Harvest Price
Yield

5/8/17
7
@New10_AgEcon 13Source: USDA NASS/RMA
Revenue-Based Policies Are Most Widely Used90% of Corn Acres Covered Under Crop Insurance, 80% Have Revenue Policy
0
10
20
30
40
50
60
70
80
90
100
1989
1990
1991
1992
1993
1994
1995
1996
1997
1998
1999
2000
2001
2002
2003
2004
2005
2006
2007
2008
2009
2010
2011
2012
2013
2014
2015
2016
Milli
on A
cres
Revenue Policies Non RP Policies Corn Acres Planted
@New10_AgEcon 14
We Can Improve Dairy Insurance, Dairy-Revenue Protection
• Direct Payment, i.e. Title I, programs face criticism in 2018 Farm Bill, 2023 Farm Bill, 2028 Farm Bill
• Crop Insurance for Milk = Based on actuarially sound procedures• “Skin in the Game” easy to defend
• Repeal of MILC in 2014 eliminated milk price support• No government tool to manage milk price/revenue risk, all policies include feed• Min-Feed LGM Policy is closest government instrument
• Early 2016 AFBF and AFBIS worked on concept for new insurance product to cover milk price/revenue risk
• Farm Bill Working Group and Stakeholder meetings across the country to gather input• Mix-Class III/IV milk or milk components• Policy is quarterly revenue, Jan-Mar, …, Oct-Dec• Farm-level customization on milk value protected• Custom mix of milk prices can significantly target basis risk relative• Basket option is a financial derivative and is a weighted average of a group of
commodities

5/8/17
8
@New10_AgEcon
Dairy-Revenue Protection Rating Methodology…
Math
@New10_AgEcon
Dairy-RP Expected RevenuePolicy Purchased Nov. 2015 for 2Q 2016
Market Information at Hedging TimeA. Class III Milk Futures Price per cwt $16.26B. Class IV Milk Futures Price per cwt $15.94
Farmer's Choices D. Class III Milk Utilization Ratio 75%E. Total Milk Production Protected (cwt) 40,000F. Coverage Level (10% Deductible) 90%
Insurance Policy ParametersG. Expected Milk Price (D*A+(1-D)*B) $16.18H. Expected Milk Revenue (E*G) $647,200J. Revenue Guarantee (H*F) $582,480
Source: Dairy-RP 522

5/8/17
9
@New10_AgEcon 17
Farmers May Self-Select Shallow Loss or Deep LossQuarterly Revenue Guarantee, 4 Mil Lbs.
$647 $582 $550 $518 $485 $453
$65 $97 $129 $162 $194
$0
$150
$300
$450
$600
$750
100% 90% 85% 80% 75% 70%
Thou
sand
Dol
lars
per
Qua
rter
Coverage Level
Revenue GuaranteeDeductible
Source: Dairy-RP 522
Shallow Loss Deep Loss
@New10_AgEcon
Dairy-RP PerformanceHedge Placed Nov 2015 for 2Q 2016
Market Information at Hedging TimeJ. Revenue Guarantee (H*F) $582,480
Actual Market InformationL. Final Class III Milk Price $13.20M. Final Class IV Milk Price $13.18N. Final Milk Price (L*D+M*(1-D)) $13.20O. Actual Milk Production (cwt)* 41,426P. Actual Revenue (N*O) $546,618
Dairy-RP PaymentQ. Indemnity (J-P, if positive) $35,862R. Policy Cost (K*E) $5,956S. Net Indemnity (Q-R) $29,906
Source: Dairy-RP 522
5/8/17
10
@New10_AgEcon 19
$5
$9
$13
$17
$21
$25
2001 2002 2003 2004 2005 2006 2007 2008 2009 2010 2011 2012 2013 2014
$/hu
ndre
dwei
ght
Class III Futures (2Q Strip)Actual Milk Price
Market BasedCannot Lock in Prices Above Market Traded
Levels
Dairy-RP Indemnifies Unanticipated Price Declines Keeps Upside Price Potential
Zero Deductible Policy Indemnities
Source: Dairy-RP 522
Farmer Receives Higher Prices, Pays Premium
@New10_AgEcon 20Source: Dairy-RP 522
Average Dairy-RP Premium Rates, 2008 to 2016Assumed Cost-Share (Subsidy) in Line With Existing Crop Insurance Policies
$0.09$0.21
$0.28$0.36$0.04
$0.08
$0.11
$0.14
$0.00
$0.10
$0.20
$0.30
$0.40
$0.50
$0.60
One Quarter Ahead Two Quarters Ahead Three Quarters Ahead
Four Quarters Ahead
Farmer Premium Govt Cost Share
90%
Cov
erag
e Le
vel
28%
Sub
sidy

5/8/17
11
@New10_AgEcon 21Source: Dairy-RP 522
Average Dairy-RP Premium Rates, 2008 to 2016Assumed Cost-Share (Subsidy) in Line With Existing Crop Insurance Policies
$0.01 $0.03 $0.05 $0.08$0.01 $0.03 $0.05
$0.08
$0.00
$0.10
$0.20
$0.30
$0.40
$0.50
$0.60
One Quarter Ahead Two Quarters Ahead Three Quarters Ahead
Four Quarters Ahead
Farmer Premium Govt Cost Share
80%
Cov
erag
e Le
vel
48%
Sub
sidy
@New10_AgEcon 22Source: Understanding Dairy Markets
Dairy-RP Can Minimize Milk Price Basis RiskFarmers Choose a Utilization to Match Mailbox Price Risk, Farm-Level Customization
Cheese MilkHigher Weight on
Class III
Heavy Fluid MilkEven Weight III/IV
Lower Fluid UseEven Weight III/IV

5/8/17
12
@New10_AgEcon 23
Comparison to Existing Risk Management ToolsWFRP LGM MPP Dairy-RP
Commodity Revenue Protection Yes No No YesMargin Protection No Yes Yes NoWorks with other Feed Insurance (e.g., Corn) Yes No N/A YesRegional N/A No No YesCoverage Election Yes Yes Yes YesCustomizable (components/classes etc.) No Low No Yes, HighVia FCIC Yes Yes No YesPrice Triggers Market Based N/A Yes No YesCovers Yield/Production Risk N/A No No YesBasis Risk Low High High LowReporting Requirements High Low Low LowDisappearing Deductible No No No YesDirectly Insure Milk Commodity or Indirectly via insuring Cash Flows from Live Animal Indirect Indirect Indirect DirectMarket Based Pricing No Yes No Yes
@New10_AgEcon 24
Portion of U.S. Milk Supply Hedged by Instrument
2%
6%
80%
LGM-D
CME Class III
MPP
MILC
30%
Forward Contracts
?
Source: USDA NASS, RMA, FSA, CME
5/8/17
13
@New10_AgEcon 25
Submitted Concept Proposal in AprilNot a replacement for MPP
@New10_AgEcon
Livestock Insurance $20 Million Cap
Livestock Livestock CommodityCommodity

5/8/17
14
@New10_AgEcon
Congressional Directive, May 1, 2017 Budget
@New10_AgEcon