crop adaptation to climate change (yadav/crop adaptation to climate change) || climate change...
TRANSCRIPT
P1: SFK/UKS P2: SFK Color: 1C
BLBS082-3-5 BLBS082-Yadav July 12, 2011 13:15 Trim: 246mm X 189mm
Chapter 3.5
Climate Change Impacts and Adaptations inthe Countries of the Former Soviet UnionAndrei Kirilenko and Nikolay Dronin
Introduction
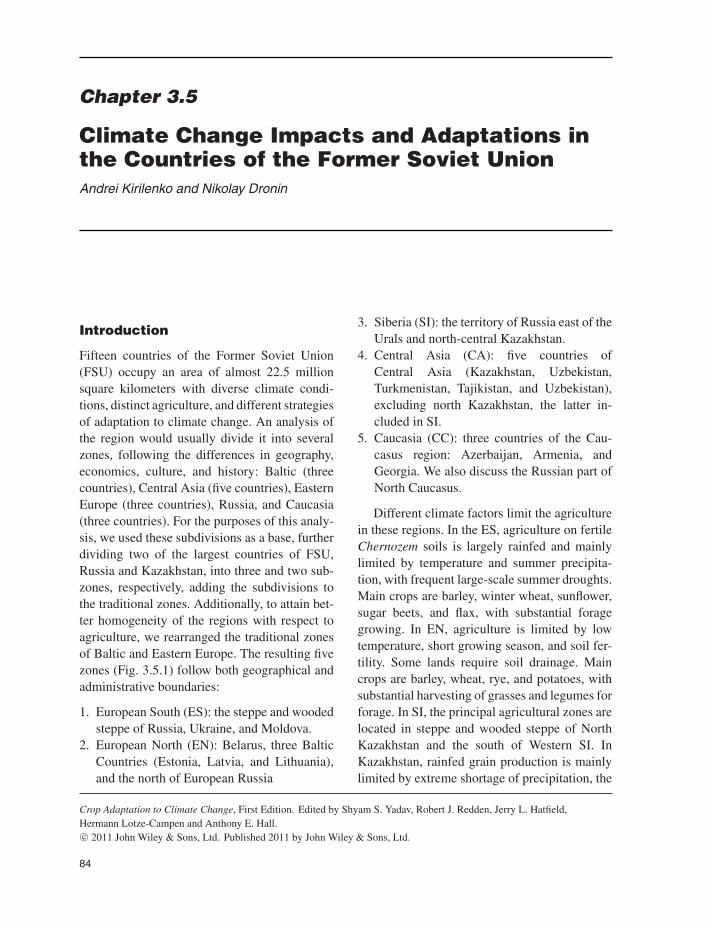
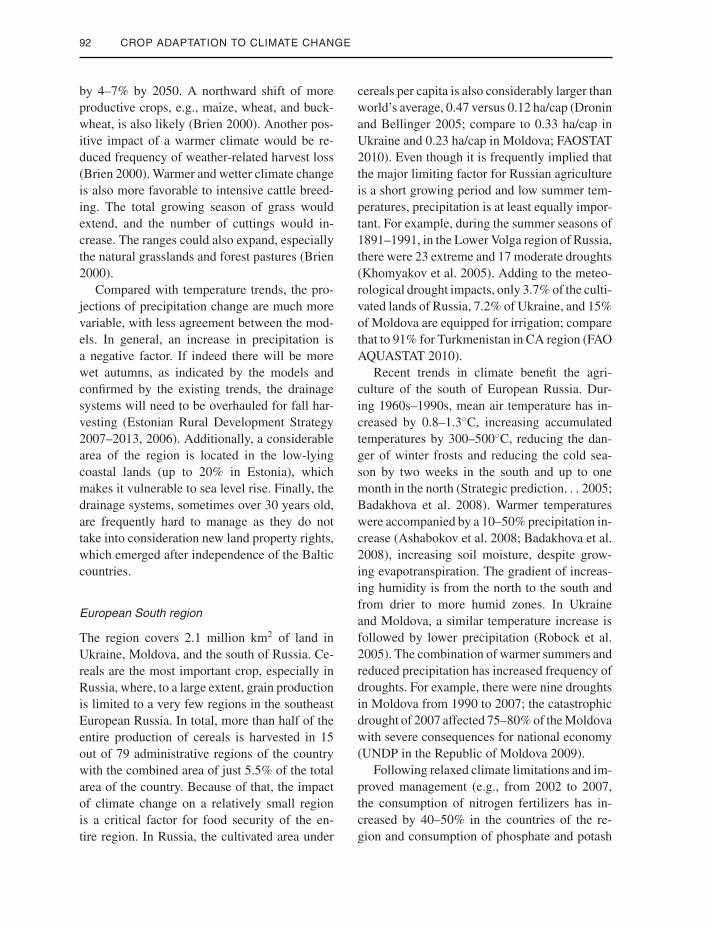
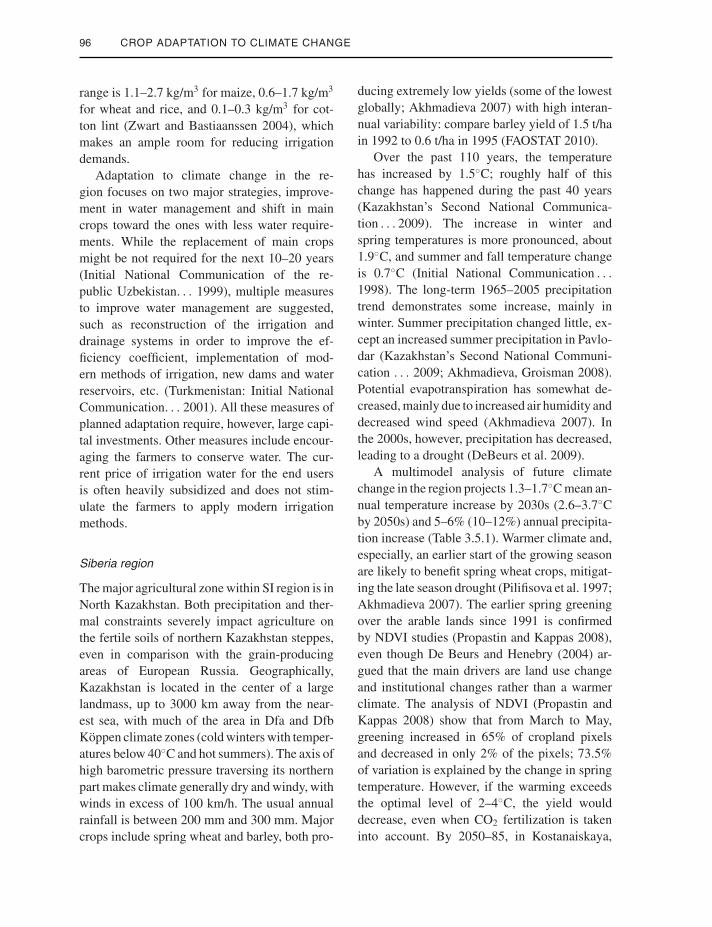
Fifteen countries of the Former Soviet Union(FSU) occupy an area of almost 22.5 millionsquare kilometers with diverse climate condi-tions, distinct agriculture, and different strategiesof adaptation to climate change. An analysis ofthe region would usually divide it into severalzones, following the differences in geography,economics, culture, and history: Baltic (threecountries), Central Asia (five countries), EasternEurope (three countries), Russia, and Caucasia(three countries). For the purposes of this analy-sis, we used these subdivisions as a base, furtherdividing two of the largest countries of FSU,Russia and Kazakhstan, into three and two sub-zones, respectively, adding the subdivisions tothe traditional zones. Additionally, to attain bet-ter homogeneity of the regions with respect toagriculture, we rearranged the traditional zonesof Baltic and Eastern Europe. The resulting fivezones (Fig. 3.5.1) follow both geographical andadministrative boundaries:
1. European South (ES): the steppe and woodedsteppe of Russia, Ukraine, and Moldova.
2. European North (EN): Belarus, three BalticCountries (Estonia, Latvia, and Lithuania),and the north of European Russia
3. Siberia (SI): the territory of Russia east of theUrals and north-central Kazakhstan.
4. Central Asia (CA): five countries ofCentral Asia (Kazakhstan, Uzbekistan,Turkmenistan, Tajikistan, and Uzbekistan),excluding north Kazakhstan, the latter in-cluded in SI.
5. Caucasia (CC): three countries of the Cau-casus region: Azerbaijan, Armenia, andGeorgia. We also discuss the Russian part ofNorth Caucasus.
Different climate factors limit the agriculturein these regions. In the ES, agriculture on fertileChernozem soils is largely rainfed and mainlylimited by temperature and summer precipita-tion, with frequent large-scale summer droughts.Main crops are barley, winter wheat, sunflower,sugar beets, and flax, with substantial foragegrowing. In EN, agriculture is limited by lowtemperature, short growing season, and soil fer-tility. Some lands require soil drainage. Maincrops are barley, wheat, rye, and potatoes, withsubstantial harvesting of grasses and legumes forforage. In SI, the principal agricultural zones arelocated in steppe and wooded steppe of NorthKazakhstan and the south of Western SI. InKazakhstan, rainfed grain production is mainlylimited by extreme shortage of precipitation, the
Crop Adaptation to Climate Change, First Edition. Edited by Shyam S. Yadav, Robert J. Redden, Jerry L. Hatfield,Hermann Lotze-Campen and Anthony E. Hall.c© 2011 John Wiley & Sons, Ltd. Published 2011 by John Wiley & Sons, Ltd.
84
P1: SFK/UKS P2: SFK Color: 1C
BLBS082-3-5 BLBS082-Yadav July 12, 2011 13:15 Trim: 246mm X 189mm
CLIMATE CHANGE IMPACTS AND ADAPTATIONS IN THE COUNTRIES OF THE FSU 85
Fig. 3.5.1. Subdivision of the FSU countries into the zones: European South (ES), European North (EN), Siberia (SI), CentralAsia (CA), and Caucasus (CC). The borders follow the upper-level administrative units of the countries (e.g., oblasts). Shadingshows the percentage of agricultural lands in a cell of the 0.5◦ × 0.5◦ geographical grid (Ramankutty et al. 2008) with darkershades corresponding to more agriculture. The cells with less than 10% of land designated to agriculture are not shaded.
dry, short, and warm growing period, and ex-tremely cold and windy winters. Main crops in-clude spring wheat, barley, and forage produc-tion. In CA, agriculture is generally restricted tooases and irrigated lands along the major riversand canals. Availability of water for irrigationis the major factor constraining agriculture, andconflicts over water are not infrequent. Majorcrops include wheat, rice, and cotton. Finally,CC is the smallest zone with multiple and diverselimitations, determined by the local climates inthe mountain valleys, precipitation and irrigationwater availability frequently being the most im-portant ones. There is a wide variety of crops inthis zone, including wheat, maize, barley, sugarbeets, nuts, cotton, vines and fruits; in terms ofagricultural exports, the top commodities includesugar, nuts, and alcoholic beverages.
Spatial heterogeneity of both the climatesand agriculture result in a diversity of climatechange impacts and also in a variety of adap-tation measures. In multiple locations, plannedand autonomous adaptations to climate changehave already resulted in changes in agriculturein the twentieth century, such as a dramatic in-crease in irrigation or shift in crops toward onesbetter suited for warmer and dryer climate; how-ever, it is hard or even impossible to differenti-ate between the effects of overall management
improvement and the avoidance of climate-related losses. Similarly, there are multiple fac-tors affecting yield, aside from climatic ones;climate-related yield reductions could be smallerthan yield increase due to other factors. Thesefactors complicate the analysis. We start the re-view with a general discussion of the geographyof agriculture in FSU, continue with descriptionof climate and climate change projections, andfinish with a discussion of recent changes in agri-culture in the regions, climate change impacts,and adaptations.
Geography of agriculture
Climatic limitations
Generally, the geography of agriculture of theFSU follows two climatic factors: temperatureand summer precipitation. Elevated topographyprevents moist and warm air from the Atlanticand Indian Oceans from entering the eastern partof the region. Annual mean temperature, com-puted for the agricultural lands alone,1 is justabove 1◦C in SI and 6.0◦C in EN. Low meanannual temperature and short period betweenthe first and the last frosts limit the length ofgrowing period (White 1987). In the intensivelyagricultural Chernozem (Black Earth) region in
P1: SFK/UKS P2: SFK Color: 1C
BLBS082-3-5 BLBS082-Yadav July 12, 2011 13:15 Trim: 246mm X 189mm
86 CROP ADAPTATION TO CLIMATE CHANGE
the southwestern Russia and Ukraine, the grow-ing period lasts 130–160 days with accumulatedtemperature of 1200–1600◦C base 10, and in theprincipal agricultural regions of SI, the growingseason length is only 115–130 days (Khomyakovet al. 2001), and accumulated temperature is800–1200◦C. Similarly, in the central regions ofEuropean Russia, the growing season lasts only110–130 days, and in Arkhangelsk oblast, accu-mulated temperature is only 400–500◦C. How-ever, in the major agricultural regions of theES (e.g., North Caucasus and Lower Volga), thegrowing period is 165–200 days, and it is evenlonger in CC, with accumulated temperaturesabove 2000◦C.
The average annual amount of precipitationover the FSU territory is 490 mm, as compared tothe 782 mm over the United States (Field 1968).About 82% of FSU is located in the continentalclimate zone (according to Koppen-Geiger clas-sification, as computed by Kottek et al. 2006),receiving a low to moderate amount of rain. Inthe CA and CC regions, 70% and 16% of land,respectively, is in the arid and semiarid climatezones. In Ukraine, only 25–30% of the required
moisture comes with summer precipitation, therest being stored in soil from autumn and winterrainfall (Protserov 1950). Only 1% of the region,predominantly along the Black Sea coast, is inthe humid temperate climatic zone, with highprecipitation, warm and long summers, and mildwinters, as compared to 34% in the United States(Parker 1972). Additionally, 8% of the territoryis in the arid and semiarid climate zones.
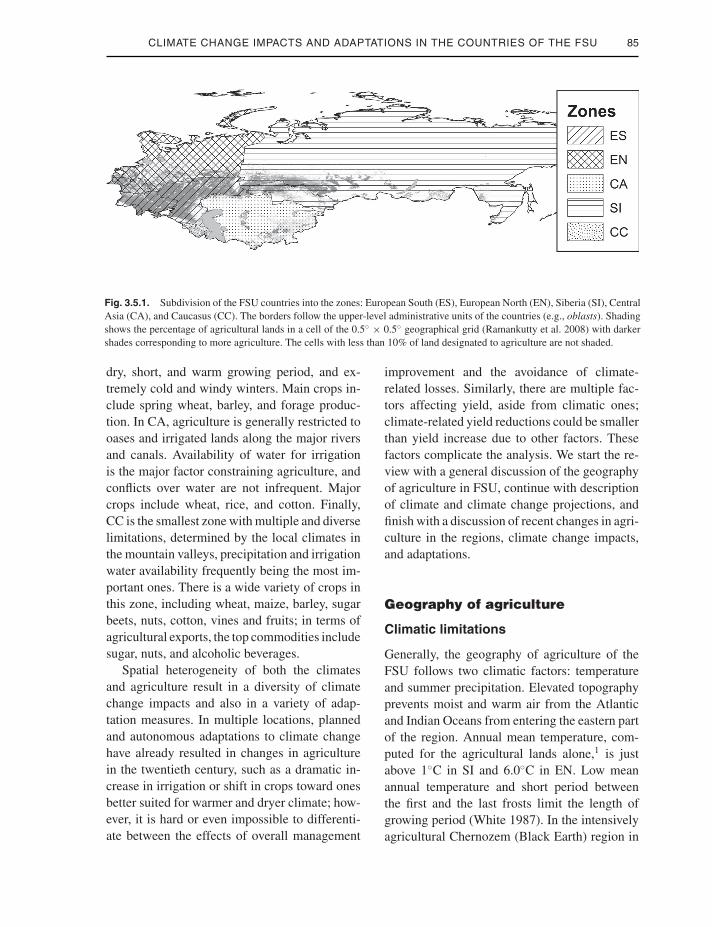
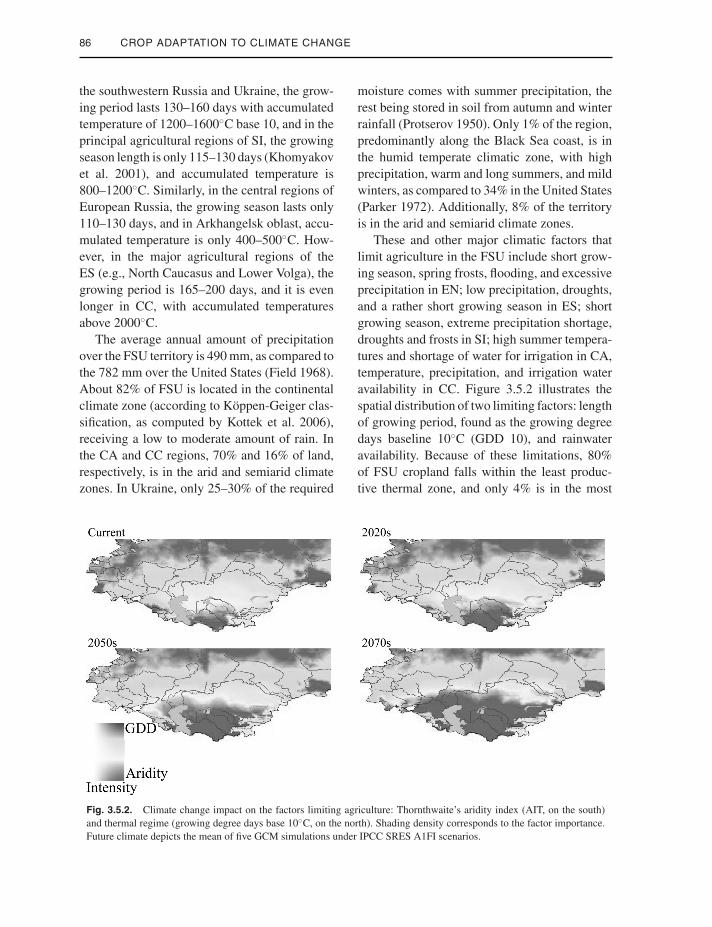
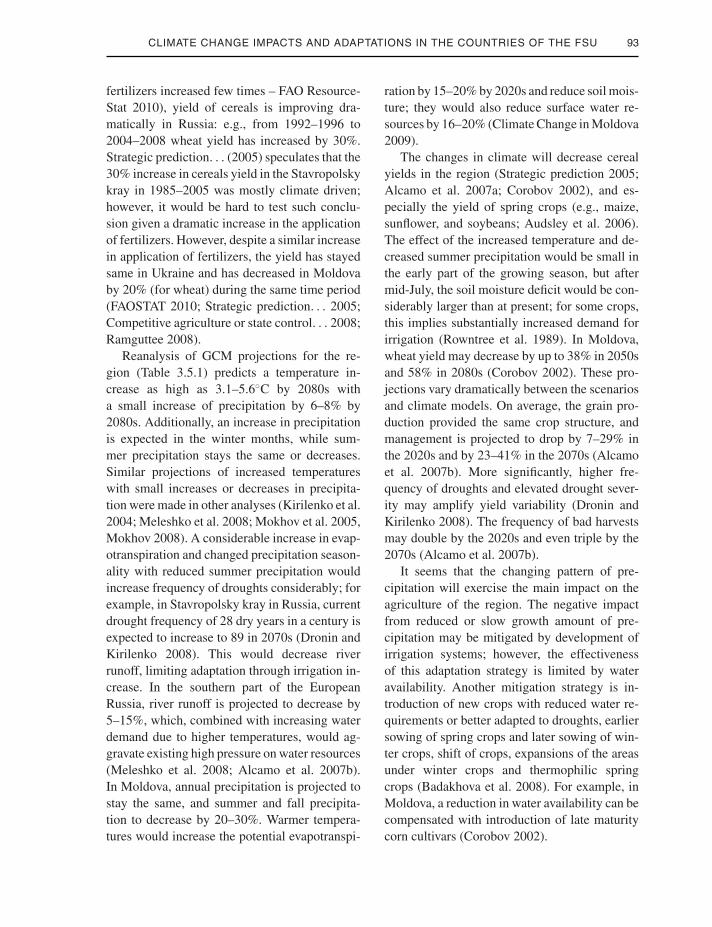
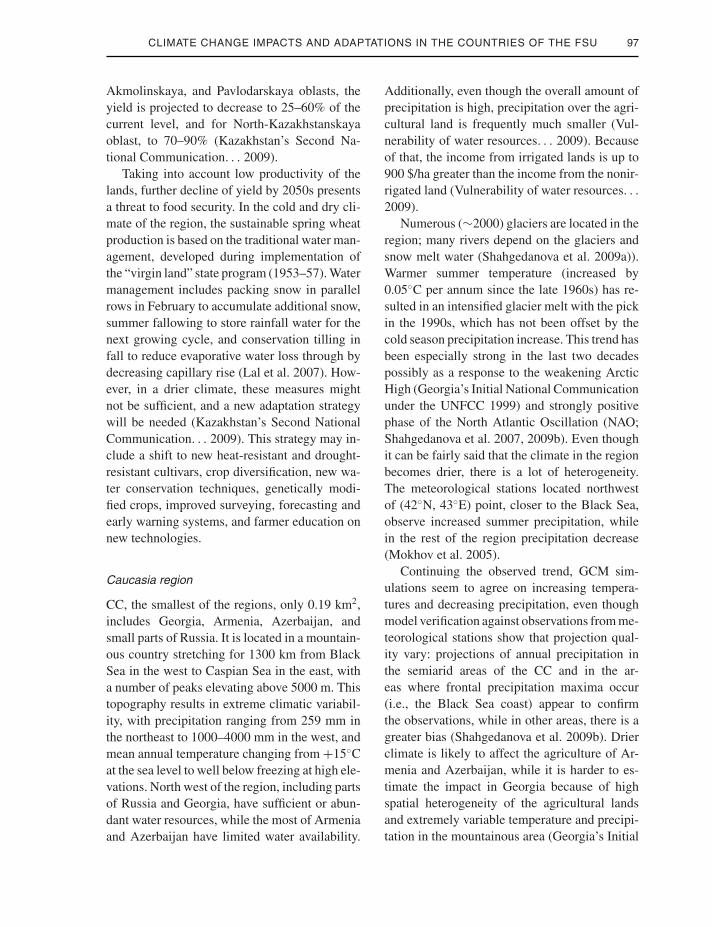
These and other major climatic factors thatlimit agriculture in the FSU include short grow-ing season, spring frosts, flooding, and excessiveprecipitation in EN; low precipitation, droughts,and a rather short growing season in ES; shortgrowing season, extreme precipitation shortage,droughts and frosts in SI; high summer tempera-tures and shortage of water for irrigation in CA,temperature, precipitation, and irrigation wateravailability in CC. Figure 3.5.2 illustrates thespatial distribution of two limiting factors: lengthof growing period, found as the growing degreedays baseline 10◦C (GDD 10), and rainwateravailability. Because of these limitations, 80%of FSU cropland falls within the least produc-tive thermal zone, and only 4% is in the most
Fig. 3.5.2. Climate change impact on the factors limiting agriculture: Thornthwaite’s aridity index (AIT, on the south)and thermal regime (growing degree days base 10◦C, on the north). Shading density corresponds to the factor importance.Future climate depicts the mean of five GCM simulations under IPCC SRES A1FI scenarios.
P1: SFK/UKS P2: SFK Color: 1C
BLBS082-3-5 BLBS082-Yadav July 12, 2011 13:15 Trim: 246mm X 189mm
CLIMATE CHANGE IMPACTS AND ADAPTATIONS IN THE COUNTRIES OF THE FSU 87
favorable zone, compared to 32% and 19% inthe United States (Field 1968). Only 1.4% ofthe land, suitable for cereal cultivation in the re-gion, has optimum combination of temperatureand precipitation—compared to 56% of the crop-land with optimum climate in the United States(Gatrell 1986). Severe climate conditions rendermuch lower crop yields compared to WesternEurope and the United States.
Major crops
In the countries of FSU, the most important foodcrop is wheat, which in 2007 was harvested on60% of the area under cereals and on 44% ofthe total area under primary crops (FAOSTAT2010). Despite its popularity, wheat is more vul-nerable to cold weather and soil acidity com-pared to other cereals of temperate climate. Boththese factors limit geographical distribution ofwheat cultivation to wooded steppe and steppe.While spring wheat varieties mainly use topsoilmoisture, winter wheat is able to use the mois-ture from deeper soil layers, returning an ade-quate harvest even in dry summers. Usually, theyield of spring wheat is only half of that of win-ter varieties (Kruchkov and Rakovskaya 1990).In Ukraine, Northern Caucasus, and Chernozemregions of ES, where the climate is more fa-vorable for crop overwintering, winter varietiesare cultivated. In west SI and north Kazakhstan(SI), severe winters with little snow favor springvarieties.
Following the climate and soils, cultivatedarea under wheat varies from 18% of the area un-der cereals in Belarus to 90% in Uzbekistan (in2007, see FAOSTAT 2010). Further north, wheatis replaced by barley and rye. At the extreme,in Estonia, 33% of the area under primary cropsis under barley (46% of the area under cereals;FAOSTAT 2010). In Belarus, 16% of the area un-der primary crops is under rye (24% of the areaunder cereals; FAOSTAT 2010). Rye is more tol-erant of cold temperatures, less vulnerable to pre-cipitation shortage, particularly within the grow-ing season, better suited to gray Podzol soils of
the forest zone, and better competes with weeds.Shallow plowing can be applied, as the hardierroot system of rye better penetrates compactedsoils (White 1987). Barley is also less demand-ing of soil and summer precipitation than wheat.Another important food and feed crop, oat, ismore demanding of heat and moisture conditionsand is more susceptible to drought; however, itcan be grown on poor acid Podzols, promotingits cultivation in the forest zone (Kruchkov andRakovskaya 1990) of Latvia, Estonia, Belarus,RF, and Lithuania (countries ordered accordingto percentage of the area harvested, FAOSTAT2010). Maize, the most important world feed, re-quires warm, long, and moist summers, whichlimits its cultivation for grain to a small part ofthe region: western Ukraine and Moldova in ES,and Georgia in CC. Overall, only 4% of har-vested area under cereals in FSU is under maize,as compared to 33% in the US (FAOSTAT 2010).
The agriculture of FSU is susceptible tothe changes in the global economy. Threecountries of the region (Ukraine, Russia, andKazakhstan) are major grain producers andexporters, and their agricultural performanceshapes the global food market. Example of the to-tal world wheat grain and flour export: Russia ex-ports 7.2%, Kazakhstan 3.9%, and Ukraine 2.4%(5th, 8th, and 9th place worldwide, computed asthe mean of 2003–2007 trade data in ton fromFAOSTAT 2010). Of the total world barley grainexport, Ukraine exports 13.6%, Russia 7.5%, andKazakhstan 1.6% (3rd, 5th, and 11th place). Thesame three countries are also highly dependenton imported food and feed to meet their domesticdemand: e.g., Russia exports $8 billion worth ofagricultural production, while imports $25 bil-lion (FAOTRADE 2010). Three CA countriesare major world exporters of cotton, Uzbekistanbeing the second largest world exporter after theUnited States. Additionally, many FSU countrieshave low food security and highly depend onglobal food market, with the following coun-tries having the highest undernourished popu-lation: Tajikistan (29%), Armenia (23%), andUzbekistan and Kyrgyzstan (13%) (FAO Food
P1: SFK/UKS P2: SFK Color: 1C
BLBS082-3-5 BLBS082-Yadav July 12, 2011 13:15 Trim: 246mm X 189mm
88 CROP ADAPTATION TO CLIMATE CHANGE
Security Statistics 2010, data for 2004–06, ex-cept for 1995–97 data for Kyrgyzstan).
Yield variability and extreme events
Annual yield variability in FSU counties is prob-ably greater than in any other major grain-producing region of the world. Compared to theUnited States, the coefficient of variability forwheat yield, measured over a 50–70 year period,is almost twice as large for Russia, and 2.4 timeslarger for Ukraine (White 1987). For the cur-rent time period (1992–2007), the coefficient ofvariability varies from 11% for Kyrgyzstan up to38% for Uzbekistan, much higher than just 7%for United States (FAOSTAT 2010). In Moldova,wheat yield was 0.5 t/ha in 1992 and 4.0 t/ha in2007 (FAOSTAT 2010). In the principal agricul-tural regions of ES (forest zone, wooded steppesof Chernozem region, western part of North-ern Caucasus), yield variability is high, and itis even higher in the southern taiga regions ofSI (20–25%) and in wooded steppes of the Uralsand Middle Volga (25–30%). The variability ofcereal production is the highest (35–50%) in thesteppes of the Low Volga, the very southernparts of Western SI, and in northern Kazakhstan(Kruchkov and Rakovetskaya 1990).
While crop composition in FSU is mainly de-termined by thermal conditions, the high fluctu-ation of yield is usually the result of precipita-tion variability. Historical records (Dronin andBellinger 2005) show that drought has been themost important extreme event to affect the agri-cultural regions of steppe and wooded steppe(Moldova, Ukraine, Central Chernozem, andNorth Caucasus, Volga, south of Western SI,and North Kazakhstan). Drought is determinedby the summer atmospheric circulation overthe main agricultural zone of FSU. Dry arcticair moves into European Russia and forms ananticyclone (Protserov 1950). Especially devas-tating droughts (e.g., in 1946, half of the agricul-tural lands of the USSR suffered from drought;Protserov 1950) are associated with the strengthand eastward extension of the Azores anticy-
clone moving in from the west. These droughtsstrike vast territories of the ES region, sometimesspreading into the northern regions of EuropeanRussia. The damage to agriculture is increasedby strong, hot, and dry southeast wind sukhovey,especially common in the steppes of SouthernUkraine and Kazakhstan. The impact of droughtsis increased by their tendency to carry to thenext year. During the twentieth century, therewere at least 27 major droughts in the USSR andthe countries of the FSU (Meshcherskaya andBlazhevich 1990).
Climate change impactsand adaptations
Climate change
We estimated the current and future climate in theregion from the University of Eastern Anglia’sClimate Research Unit (CRU) climate dataset(Mitchell et al. 2004). The monthly gridded val-ues for temperature, precipitation, air humid-ity, and incoming solar radiation were furtherprocessed using a stochastic weather generator(Friend 1998) to obtain daily dynamics and toproduce the missing monthly and yearly datasuch as the number of GDD 10, aridity indices,upper and lower deciles for temperature and pre-cipitation, etc. For future climate, we used simu-lations of four different general circulation mod-els (GCM): CGCM2, CSIROmk2, ECHam4, andDOE PCM, for three preset time periods: 2020s,2050s, and 2080s (Mitchell et al. 2004), for four“marker” SRES scenarios: A1FI, A2, B1, andB2 (IPCC 2000). Further, to account for interan-nual variability for each SRES scenario/GCM-time slice combination, we generated 30 differ-ent states of climate parameters following theapproach of Dronin and Kirilenko (2008), bring-ing the total number of sets of climate parametersincluded in the ensemble to 1650.
To characterize the current and future climateof the territories under intensive agriculture, foreach of the zones, we used the weighted arith-metic mean of the values of climate parameters
P1: SFK/UKS P2: SFK Color: 1C
BLBS082-3-5 BLBS082-Yadav July 12, 2011 13:15 Trim: 246mm X 189mm
CLIMATE CHANGE IMPACTS AND ADAPTATIONS IN THE COUNTRIES OF THE FSU 89
for each of the grid cells, with the weights equalto the relative area of a cell under agriculture.Additionally, we did not consider the cells whereagricultural lands composed less than 10% of thetotal area of the cell. Two main implications ofthis approach is that the major part of Russia isexcluded from consideration, and also that thecurrent and future values of climate parametersin this study are very different from the valuesfound when the entire territory is taken into con-sideration, such as that found in IPCC (2007).
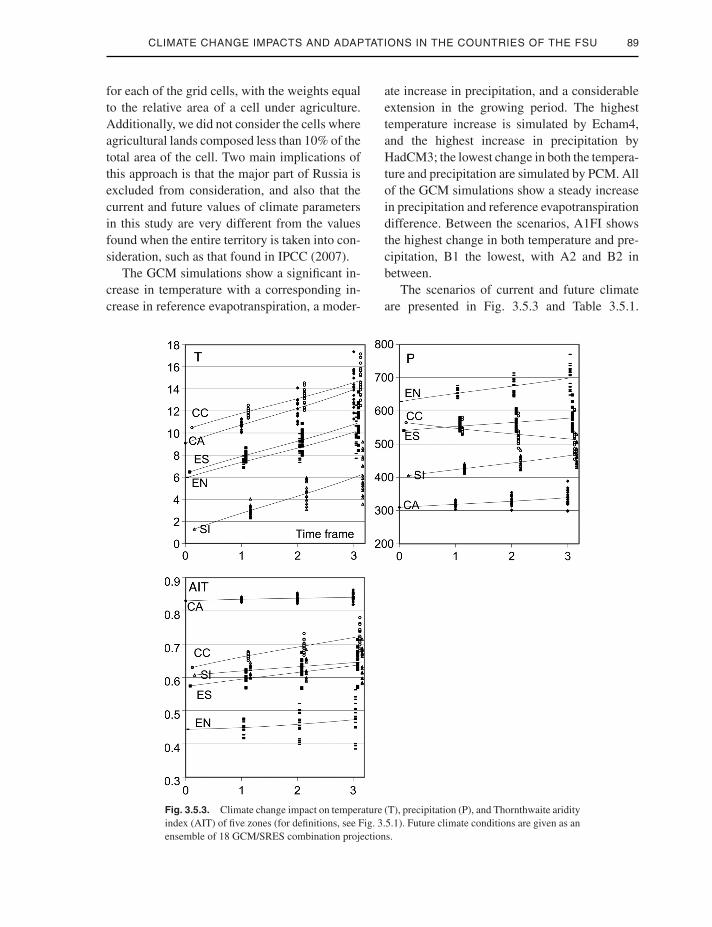
The GCM simulations show a significant in-crease in temperature with a corresponding in-crease in reference evapotranspiration, a moder-
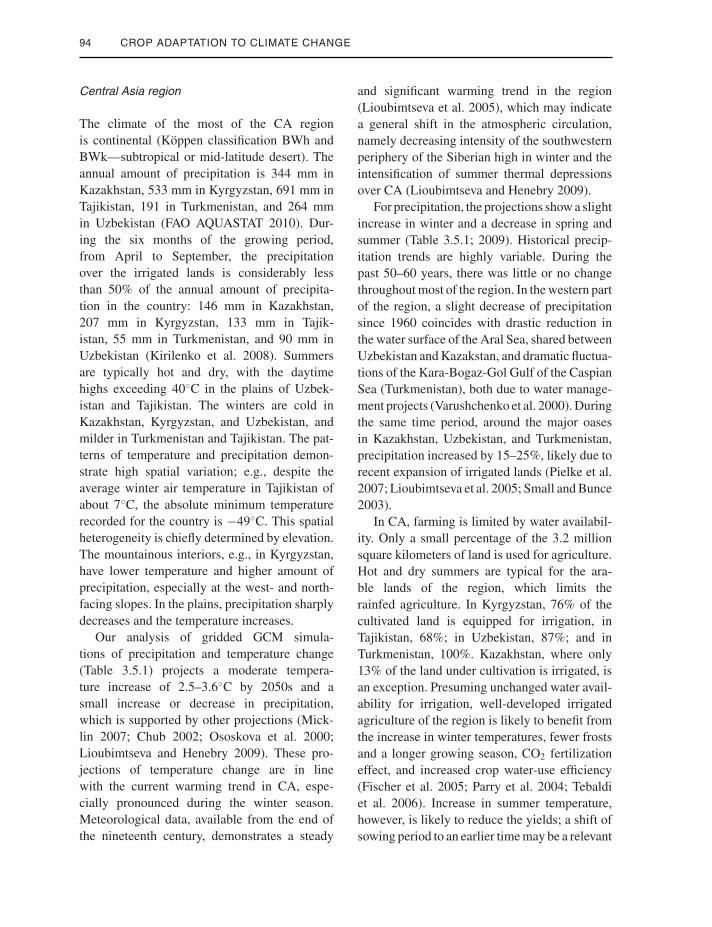
ate increase in precipitation, and a considerableextension in the growing period. The highesttemperature increase is simulated by Echam4,and the highest increase in precipitation byHadCM3; the lowest change in both the tempera-ture and precipitation are simulated by PCM. Allof the GCM simulations show a steady increasein precipitation and reference evapotranspirationdifference. Between the scenarios, A1FI showsthe highest change in both temperature and pre-cipitation, B1 the lowest, with A2 and B2 inbetween.
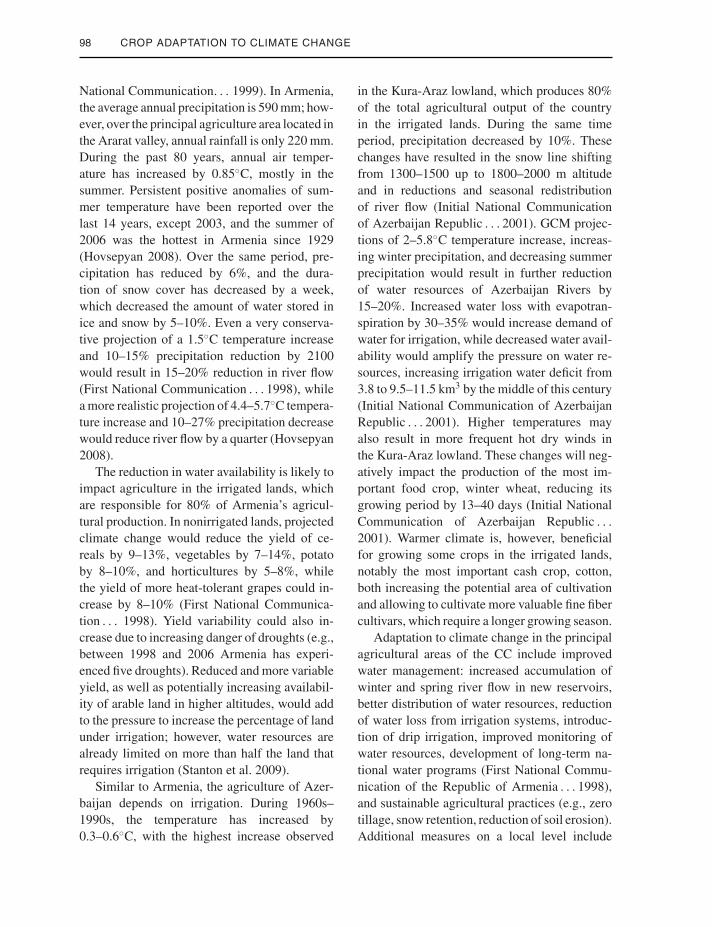
The scenarios of current and future climateare presented in Fig. 3.5.3 and Table 3.5.1.
Fig. 3.5.3. Climate change impact on temperature (T), precipitation (P), and Thornthwaite aridityindex (AIT) of five zones (for definitions, see Fig. 3.5.1). Future climate conditions are given as anensemble of 18 GCM/SRES combination projections.
P1: SFK/UKS P2: SFK Color: 1C
BLBS082-3-5 BLBS082-Yadav July 12, 2011 13:15 Trim: 246mm X 189mm
90 CROP ADAPTATION TO CLIMATE CHANGE
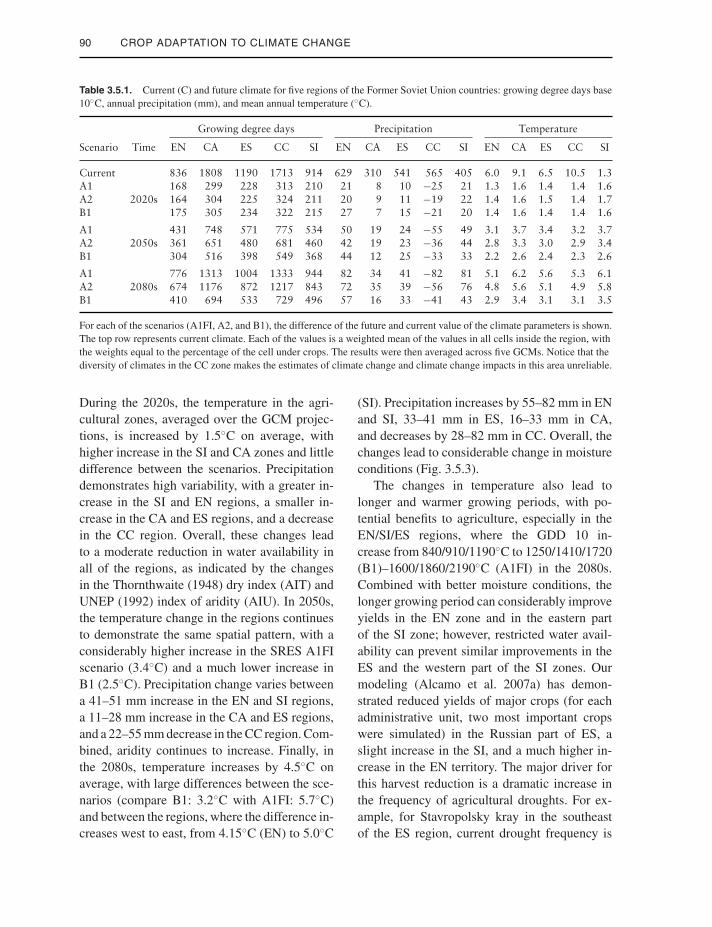
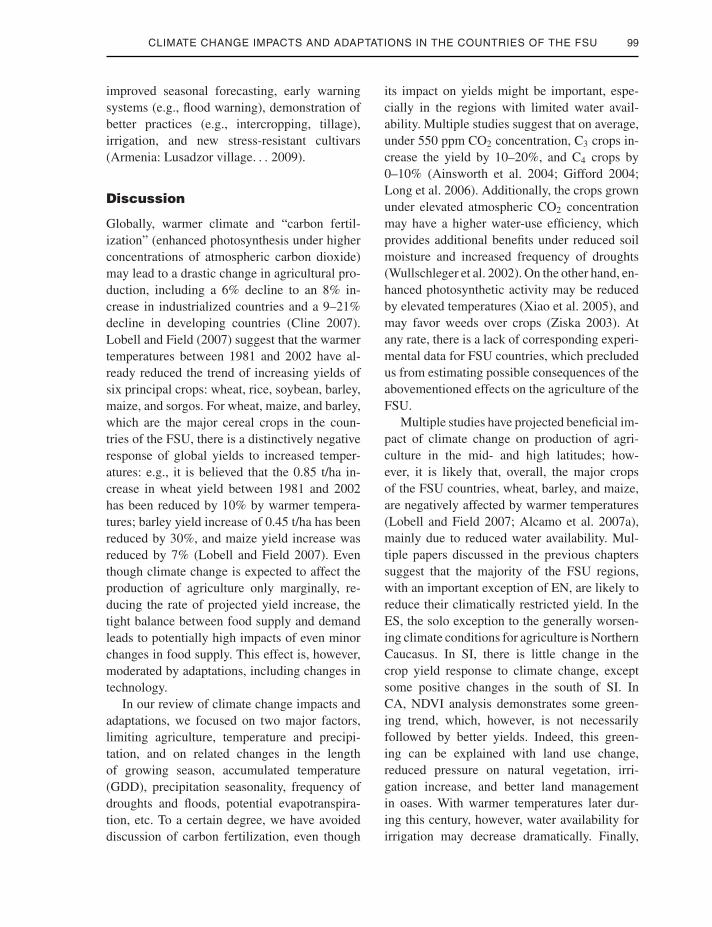
Table 3.5.1. Current (C) and future climate for five regions of the Former Soviet Union countries: growing degree days base10◦C, annual precipitation (mm), and mean annual temperature (◦C).
Growing degree days Precipitation Temperature
Scenario Time EN CA ES CC SI EN CA ES CC SI EN CA ES CC SI
Current 836 1808 1190 1713 914 629 310 541 565 405 6.0 9.1 6.5 10.5 1.3A1 168 299 228 313 210 21 8 10 −25 21 1.3 1.6 1.4 1.4 1.6A2 2020s 164 304 225 324 211 20 9 11 −19 22 1.4 1.6 1.5 1.4 1.7B1 175 305 234 322 215 27 7 15 −21 20 1.4 1.6 1.4 1.4 1.6
A1 431 748 571 775 534 50 19 24 −55 49 3.1 3.7 3.4 3.2 3.7A2 2050s 361 651 480 681 460 42 19 23 −36 44 2.8 3.3 3.0 2.9 3.4B1 304 516 398 549 368 44 12 25 −33 33 2.2 2.6 2.4 2.3 2.6
A1 776 1313 1004 1333 944 82 34 41 −82 81 5.1 6.2 5.6 5.3 6.1A2 2080s 674 1176 872 1217 843 72 35 39 −56 76 4.8 5.6 5.1 4.9 5.8B1 410 694 533 729 496 57 16 33 −41 43 2.9 3.4 3.1 3.1 3.5
For each of the scenarios (A1FI, A2, and B1), the difference of the future and current value of the climate parameters is shown.The top row represents current climate. Each of the values is a weighted mean of the values in all cells inside the region, withthe weights equal to the percentage of the cell under crops. The results were then averaged across five GCMs. Notice that thediversity of climates in the CC zone makes the estimates of climate change and climate change impacts in this area unreliable.
During the 2020s, the temperature in the agri-cultural zones, averaged over the GCM projec-tions, is increased by 1.5◦C on average, withhigher increase in the SI and CA zones and littledifference between the scenarios. Precipitationdemonstrates high variability, with a greater in-crease in the SI and EN regions, a smaller in-crease in the CA and ES regions, and a decreasein the CC region. Overall, these changes leadto a moderate reduction in water availability inall of the regions, as indicated by the changesin the Thornthwaite (1948) dry index (AIT) andUNEP (1992) index of aridity (AIU). In 2050s,the temperature change in the regions continuesto demonstrate the same spatial pattern, with aconsiderably higher increase in the SRES A1FIscenario (3.4◦C) and a much lower increase inB1 (2.5◦C). Precipitation change varies betweena 41–51 mm increase in the EN and SI regions,a 11–28 mm increase in the CA and ES regions,and a 22–55 mm decrease in the CC region. Com-bined, aridity continues to increase. Finally, inthe 2080s, temperature increases by 4.5◦C onaverage, with large differences between the sce-narios (compare B1: 3.2◦C with A1FI: 5.7◦C)and between the regions, where the difference in-creases west to east, from 4.15◦C (EN) to 5.0◦C
(SI). Precipitation increases by 55–82 mm in ENand SI, 33–41 mm in ES, 16–33 mm in CA,and decreases by 28–82 mm in CC. Overall, thechanges lead to considerable change in moistureconditions (Fig. 3.5.3).
The changes in temperature also lead tolonger and warmer growing periods, with po-tential benefits to agriculture, especially in theEN/SI/ES regions, where the GDD 10 in-crease from 840/910/1190◦C to 1250/1410/1720(B1)–1600/1860/2190◦C (A1FI) in the 2080s.Combined with better moisture conditions, thelonger growing period can considerably improveyields in the EN zone and in the eastern partof the SI zone; however, restricted water avail-ability can prevent similar improvements in theES and the western part of the SI zones. Ourmodeling (Alcamo et al. 2007a) has demon-strated reduced yields of major crops (for eachadministrative unit, two most important cropswere simulated) in the Russian part of ES, aslight increase in the SI, and a much higher in-crease in the EN territory. The major driver forthis harvest reduction is a dramatic increase inthe frequency of agricultural droughts. For ex-ample, for Stavropolsky kray in the southeastof the ES region, current drought frequency is
P1: SFK/UKS P2: SFK Color: 1C
BLBS082-3-5 BLBS082-Yadav July 12, 2011 13:15 Trim: 246mm X 189mm
CLIMATE CHANGE IMPACTS AND ADAPTATIONS IN THE COUNTRIES OF THE FSU 91
28 dry years in a century, but for the 2020sunder the A1FI scenario, it increases to 64,and for the 2070s to 89 years per century. InMoldova, even though a longer vegetation pe-riod is favorable for agriculture, declining wateravailability is likely to reduce yields (Corobov2002). Similarly, even though the growing periodis dramatically extended in the CA/CC zones,with the GDDs increasing from 1810/1710◦C to2500/2440 (B1)–3120/3050 (A1FI), this is alsofollowed with further increase in water demand,which could require an increase in irrigation.
Regional impacts and adaptations
European North region
Only a small part of the 2.7 million square kilo-meters of the EN zone is under agriculture. Thepercentage of cultivated land varies from 29% inLithuania down to 13% in Estonia (FAO AQUA-STAT 2010). The most important crops includewheat, rye, barley, oats, flax, and potatoes, andin Belarus, maize, triticale, and rapes. Consid-erable area is used for intensive cattle breed-ing. Limiting factors for agriculture are a short(175–195 days in Estonia) and cold growing sea-son, insufficient photosynthetically active radia-tion (PAR) in summer, low soil fertility, and, of-ten, excessive precipitation. The annual amountof precipitation is 600–800 mm, which consider-ably exceeds potential evapotranspiration, caus-ing floods. Dry periods, especially during thesecond half of summer and in May, are also notinfrequent (Tammets 2007). Because of that, thepercentage of the total cultivated area drainedvaries from 48% in Belorussia to 93% in Latvia,in comparison to 10% in Ukraine and only 2%further south in Moldova.
The EN region includes the northern part ofEuropean Russia, Belarus, Estonia, Latvia, andLithuania. The climate of Estonia, Lithuania,and Latvia is hemiboreal, with moderate win-ters and cool summers. The climate is mainly in-fluenced by large-scale atmospheric circulationin the North Atlantic. In Estonia, an increase in
the intensity of westerlies during the cold periodhas caused warming in winter (Jaagus 2006) andspring (Tooming and Kadaja 2006). Tempera-ture observations in the region demonstrate con-siderable warming. In Latvia, recently, winterair temperature has increased by 0.8◦C, a valueapproached only once during the observation pe-riod, in the mid-seventeenth century. Warmer cli-mate has shifted the time of spring river ice breakin Baltic and Belarus by up to 15 days (Klavinset al. 2009; Brien, 2000). Precipitation is highlyvariable. In Estonia, dry and wet periods are al-tering (Jaagus 2006; Tarand 1993) with both thenumber of extreme wet and extreme dry daysweakly increasing (Tammets 2007). Significanttrend of increasing cold season precipitation isobserved in Lithuania. The increasing cold pe-riod precipitation indicates a general tendency ofclimate to shift from continental climate towardmore maritime (Brien 2000; Lithuania’s secondnational communication. . . 2008).
Reanalysis of GCM simulations (Table 3.5.1)projects a substantial increase in both temper-ature (by 1.4◦C in 2020s, 2.2–3.1◦C in 2050s,and 2.9–5.1◦C in 2080s) and precipitation (by9–13% in 2080s) and confirms to the observedtrend. The considerable amount of precipitationand a relatively short vegetation season makescereal growing likely to benefit from warmertemperatures, even though an increase in springprecipitation may decrease production of pota-toes (UNFCCC 2006). In general, both the his-torical trend and GCM projections suggest morefavorable thermal conditions for agriculture: inthis region, any temperature increase would in-crease the potential yield of cereal and rootcrops, even though other factors, such as soilfertility, moderate the actual change in yields.In addition to the longer growing season andenhanced photosynthesis due to higher summertemperatures, an important factor is reduced fre-quency of devastating early and late spring frost(Reilly et al. 2001). In the similar climate of Fin-land, barley yield increases by 3–5% for 1◦C(Kettunen et al. 1988). In Estonia, “weather-harvest” models project potato yield increase
P1: SFK/UKS P2: SFK Color: 1C
BLBS082-3-5 BLBS082-Yadav July 12, 2011 13:15 Trim: 246mm X 189mm
92 CROP ADAPTATION TO CLIMATE CHANGE
by 4–7% by 2050. A northward shift of moreproductive crops, e.g., maize, wheat, and buck-wheat, is also likely (Brien 2000). Another pos-itive impact of a warmer climate would be re-duced frequency of weather-related harvest loss(Brien 2000). Warmer and wetter climate changeis also more favorable to intensive cattle breed-ing. The total growing season of grass wouldextend, and the number of cuttings would in-crease. The ranges could also expand, especiallythe natural grasslands and forest pastures (Brien2000).
Compared with temperature trends, the pro-jections of precipitation change are much morevariable, with less agreement between the mod-els. In general, an increase in precipitation isa negative factor. If indeed there will be morewet autumns, as indicated by the models andconfirmed by the existing trends, the drainagesystems will need to be overhauled for fall har-vesting (Estonian Rural Development Strategy2007–2013, 2006). Additionally, a considerablearea of the region is located in the low-lyingcoastal lands (up to 20% in Estonia), whichmakes it vulnerable to sea level rise. Finally, thedrainage systems, sometimes over 30 years old,are frequently hard to manage as they do nottake into consideration new land property rights,which emerged after independence of the Balticcountries.
European South region
The region covers 2.1 million km2 of land inUkraine, Moldova, and the south of Russia. Ce-reals are the most important crop, especially inRussia, where, to a large extent, grain productionis limited to a very few regions in the southeastEuropean Russia. In total, more than half of theentire production of cereals is harvested in 15out of 79 administrative regions of the countrywith the combined area of just 5.5% of the totalarea of the country. Because of that, the impactof climate change on a relatively small regionis a critical factor for food security of the en-tire region. In Russia, the cultivated area under
cereals per capita is also considerably larger thanworld’s average, 0.47 versus 0.12 ha/cap (Droninand Bellinger 2005; compare to 0.33 ha/cap inUkraine and 0.23 ha/cap in Moldova; FAOSTAT2010). Even though it is frequently implied thatthe major limiting factor for Russian agricultureis a short growing period and low summer tem-peratures, precipitation is at least equally impor-tant. For example, during the summer seasons of1891–1991, in the Lower Volga region of Russia,there were 23 extreme and 17 moderate droughts(Khomyakov et al. 2005). Adding to the meteo-rological drought impacts, only 3.7% of the culti-vated lands of Russia, 7.2% of Ukraine, and 15%of Moldova are equipped for irrigation; comparethat to 91% for Turkmenistan in CA region (FAOAQUASTAT 2010).
Recent trends in climate benefit the agri-culture of the south of European Russia. Dur-ing 1960s–1990s, mean air temperature has in-creased by 0.8–1.3◦C, increasing accumulatedtemperatures by 300–500◦C, reducing the dan-ger of winter frosts and reducing the cold sea-son by two weeks in the south and up to onemonth in the north (Strategic prediction. . . 2005;Badakhova et al. 2008). Warmer temperatureswere accompanied by a 10–50% precipitation in-crease (Ashabokov et al. 2008; Badakhova et al.2008), increasing soil moisture, despite grow-ing evapotranspiration. The gradient of increas-ing humidity is from the north to the south andfrom drier to more humid zones. In Ukraineand Moldova, a similar temperature increase isfollowed by lower precipitation (Robock et al.2005). The combination of warmer summers andreduced precipitation has increased frequency ofdroughts. For example, there were nine droughtsin Moldova from 1990 to 2007; the catastrophicdrought of 2007 affected 75–80% of the Moldovawith severe consequences for national economy(UNDP in the Republic of Moldova 2009).
Following relaxed climate limitations and im-proved management (e.g., from 2002 to 2007,the consumption of nitrogen fertilizers has in-creased by 40–50% in the countries of the re-gion and consumption of phosphate and potash
P1: SFK/UKS P2: SFK Color: 1C
BLBS082-3-5 BLBS082-Yadav July 12, 2011 13:15 Trim: 246mm X 189mm
CLIMATE CHANGE IMPACTS AND ADAPTATIONS IN THE COUNTRIES OF THE FSU 93
fertilizers increased few times – FAO Resource-Stat 2010), yield of cereals is improving dra-matically in Russia: e.g., from 1992–1996 to2004–2008 wheat yield has increased by 30%.Strategic prediction. . . (2005) speculates that the30% increase in cereals yield in the Stavropolskykray in 1985–2005 was mostly climate driven;however, it would be hard to test such conclu-sion given a dramatic increase in the applicationof fertilizers. However, despite a similar increasein application of fertilizers, the yield has stayedsame in Ukraine and has decreased in Moldovaby 20% (for wheat) during the same time period(FAOSTAT 2010; Strategic prediction. . . 2005;Competitive agriculture or state control. . . 2008;Ramguttee 2008).
Reanalysis of GCM projections for the re-gion (Table 3.5.1) predicts a temperature in-crease as high as 3.1–5.6◦C by 2080s witha small increase of precipitation by 6–8% by2080s. Additionally, an increase in precipitationis expected in the winter months, while sum-mer precipitation stays the same or decreases.Similar projections of increased temperatureswith small increases or decreases in precipita-tion were made in other analyses (Kirilenko et al.2004; Meleshko et al. 2008; Mokhov et al. 2005,Mokhov 2008). A considerable increase in evap-otranspiration and changed precipitation season-ality with reduced summer precipitation wouldincrease frequency of droughts considerably; forexample, in Stavropolsky kray in Russia, currentdrought frequency of 28 dry years in a century isexpected to increase to 89 in 2070s (Dronin andKirilenko 2008). This would decrease riverrunoff, limiting adaptation through irrigation in-crease. In the southern part of the EuropeanRussia, river runoff is projected to decrease by5–15%, which, combined with increasing waterdemand due to higher temperatures, would ag-gravate existing high pressure on water resources(Meleshko et al. 2008; Alcamo et al. 2007b).In Moldova, annual precipitation is projected tostay the same, and summer and fall precipita-tion to decrease by 20–30%. Warmer tempera-tures would increase the potential evapotranspi-
ration by 15–20% by 2020s and reduce soil mois-ture; they would also reduce surface water re-sources by 16–20% (Climate Change in Moldova2009).
The changes in climate will decrease cerealyields in the region (Strategic prediction 2005;Alcamo et al. 2007a; Corobov 2002), and es-pecially the yield of spring crops (e.g., maize,sunflower, and soybeans; Audsley et al. 2006).The effect of the increased temperature and de-creased summer precipitation would be small inthe early part of the growing season, but aftermid-July, the soil moisture deficit would be con-siderably larger than at present; for some crops,this implies substantially increased demand forirrigation (Rowntree et al. 1989). In Moldova,wheat yield may decrease by up to 38% in 2050sand 58% in 2080s (Corobov 2002). These pro-jections vary dramatically between the scenariosand climate models. On average, the grain pro-duction provided the same crop structure, andmanagement is projected to drop by 7–29% inthe 2020s and by 23–41% in the 2070s (Alcamoet al. 2007b). More significantly, higher fre-quency of droughts and elevated drought sever-ity may amplify yield variability (Dronin andKirilenko 2008). The frequency of bad harvestsmay double by the 2020s and even triple by the2070s (Alcamo et al. 2007b).
It seems that the changing pattern of pre-cipitation will exercise the main impact on theagriculture of the region. The negative impactfrom reduced or slow growth amount of pre-cipitation may be mitigated by development ofirrigation systems; however, the effectivenessof this adaptation strategy is limited by wateravailability. Another mitigation strategy is in-troduction of new crops with reduced water re-quirements or better adapted to droughts, earliersowing of spring crops and later sowing of win-ter crops, shift of crops, expansions of the areasunder winter crops and thermophilic springcrops (Badakhova et al. 2008). For example, inMoldova, a reduction in water availability can becompensated with introduction of late maturitycorn cultivars (Corobov 2002).
P1: SFK/UKS P2: SFK Color: 1C
BLBS082-3-5 BLBS082-Yadav July 12, 2011 13:15 Trim: 246mm X 189mm
94 CROP ADAPTATION TO CLIMATE CHANGE
Central Asia region
The climate of the most of the CA regionis continental (Koppen classification BWh andBWk—subtropical or mid-latitude desert). Theannual amount of precipitation is 344 mm inKazakhstan, 533 mm in Kyrgyzstan, 691 mm inTajikistan, 191 in Turkmenistan, and 264 mmin Uzbekistan (FAO AQUASTAT 2010). Dur-ing the six months of the growing period,from April to September, the precipitationover the irrigated lands is considerably lessthan 50% of the annual amount of precipita-tion in the country: 146 mm in Kazakhstan,207 mm in Kyrgyzstan, 133 mm in Tajik-istan, 55 mm in Turkmenistan, and 90 mm inUzbekistan (Kirilenko et al. 2008). Summersare typically hot and dry, with the daytimehighs exceeding 40◦C in the plains of Uzbek-istan and Tajikistan. The winters are cold inKazakhstan, Kyrgyzstan, and Uzbekistan, andmilder in Turkmenistan and Tajikistan. The pat-terns of temperature and precipitation demon-strate high spatial variation; e.g., despite theaverage winter air temperature in Tajikistan ofabout 7◦C, the absolute minimum temperaturerecorded for the country is −49◦C. This spatialheterogeneity is chiefly determined by elevation.The mountainous interiors, e.g., in Kyrgyzstan,have lower temperature and higher amount ofprecipitation, especially at the west- and north-facing slopes. In the plains, precipitation sharplydecreases and the temperature increases.
Our analysis of gridded GCM simula-tions of precipitation and temperature change(Table 3.5.1) projects a moderate tempera-ture increase of 2.5–3.6◦C by 2050s and asmall increase or decrease in precipitation,which is supported by other projections (Mick-lin 2007; Chub 2002; Ososkova et al. 2000;Lioubimtseva and Henebry 2009). These pro-jections of temperature change are in linewith the current warming trend in CA, espe-cially pronounced during the winter season.Meteorological data, available from the end ofthe nineteenth century, demonstrates a steady
and significant warming trend in the region(Lioubimtseva et al. 2005), which may indicatea general shift in the atmospheric circulation,namely decreasing intensity of the southwesternperiphery of the Siberian high in winter and theintensification of summer thermal depressionsover CA (Lioubimtseva and Henebry 2009).
For precipitation, the projections show a slightincrease in winter and a decrease in spring andsummer (Table 3.5.1; 2009). Historical precip-itation trends are highly variable. During thepast 50–60 years, there was little or no changethroughout most of the region. In the western partof the region, a slight decrease of precipitationsince 1960 coincides with drastic reduction inthe water surface of the Aral Sea, shared betweenUzbekistan and Kazakstan, and dramatic fluctua-tions of the Kara-Bogaz-Gol Gulf of the CaspianSea (Turkmenistan), both due to water manage-ment projects (Varushchenko et al. 2000). Duringthe same time period, around the major oasesin Kazakhstan, Uzbekistan, and Turkmenistan,precipitation increased by 15–25%, likely due torecent expansion of irrigated lands (Pielke et al.2007; Lioubimtseva et al. 2005; Small and Bunce2003).
In CA, farming is limited by water availabil-ity. Only a small percentage of the 3.2 millionsquare kilometers of land is used for agriculture.Hot and dry summers are typical for the ara-ble lands of the region, which limits therainfed agriculture. In Kyrgyzstan, 76% of thecultivated land is equipped for irrigation, inTajikistan, 68%; in Uzbekistan, 87%; and inTurkmenistan, 100%. Kazakhstan, where only13% of the land under cultivation is irrigated, isan exception. Presuming unchanged water avail-ability for irrigation, well-developed irrigatedagriculture of the region is likely to benefit fromthe increase in winter temperatures, fewer frostsand a longer growing season, CO2 fertilizationeffect, and increased crop water-use efficiency(Fischer et al. 2005; Parry et al. 2004; Tebaldiet al. 2006). Increase in summer temperature,however, is likely to reduce the yields; a shift ofsowing period to an earlier time may be a relevant
P1: SFK/UKS P2: SFK Color: 1C
BLBS082-3-5 BLBS082-Yadav July 12, 2011 13:15 Trim: 246mm X 189mm
CLIMATE CHANGE IMPACTS AND ADAPTATIONS IN THE COUNTRIES OF THE FSU 95
adaptation strategy (Turkmenistan: Initial Na-tional Communication . . . 2001). The analysisof the Normalized Difference Vegetation Index(NDVI) demonstrates that the earlier greening,together with a general increase in NDVI, isalready happening, even though there might befactors other than climate, such as decreasedlands under cultivation, reduced herbicideapplication, decreased pressure on range lands,improved management, etc. (DeBeurs and Hene-bry 2004; Lioubimtseva and Henebry 2009).
Whether because of the changes in manage-ment or climate, the yields on irrigated plots areimproving. In Uzbekistan, where the agricultureis mainly irrigated, over the time of country in-dependence of 1992–2008, wheat yield has in-creased by 2.5 t/ha, maize yield increased by2.3 t/ha, while rice and cotton yields increased lit-tle (the change was estimated as a difference be-tween 1992–1996 and 2004–2008 mean yield).During the same time period, for Kazakhstan,maize yield has increased by 2.2 t/ha, while theyield of wheat and barley, grown primarily in therainfed land, did not change (FAOSTAT 2010;Gintzburger et al. 2005).
Despite the positive yield trends, climatechange may result in reduction of water re-sources. Increased evapotranspiration will leadto a corresponding increase in irrigation waterrequirements. Additionally, all countries of theregion except Kazakhstan plan to further expandtheir irrigation system areas in the near future,even though existing water resources are oftenoverexploited: abstraction of water for irrigationfrom two major rivers of the region, Amu Darjaand Syr Darja, in some years are already closeto their entire annual discharge. The increase inwater demand, up to 100% by 2080s, will beespecially strong in the downstream countries,Turkmenistan and Uzbekistan, which competewith the upstream countries over water resources(Kirilenko et al. 2008). National reports toUNFCCC confirm this increase in the irrigationnorm for major crops in future climate (Turk-menistan: Initial National Communication. . .
2001).
Three-quarter of the river runoff of the re-gion originates from the glaciers of Pamir andTien Shan mountains. Accelerated melting ofHimalayan glaciers may improve water avail-ability temporarily. Significant changes inseasonality of glacial flows are already happen-ing. During 1973–2000, accelerated glacier melt-ing has increased the flow of Kyrgyzstan riversby 6.3%, with an additional 10% increase pro-jected for next 20 years (First National Commu-nication of the Kyrgyz Republic. . . 2003). Withglacier volume reduction, this mitigating effectwill, however, eventually subside, to be replacedwith a reduction in river flow, exacerbating waterproblems in the region (IPCC 2007).
A viable strategy to reduce water demandin the region is a shift in main crops towardones with less water requirements and replace-ment of the cultivars with more water efficientones. Globally averaged crop water productivity(CWP, crop yield per unit of water evapotran-spiration) is 1.8 kg/m3 for maize, 1.1 kg/m3 forwheat and rice, but only 0.2 kg/m3 for cottonlint (Zwart and Bastiaanssen 2004). Some re-duction in water demand in the region may havealready happened, with the shift from cotton tocereals. Between 1990 and 1998, the area un-der cotton in the entire Aral Sea basin droppedfrom 45% to 25% of the total irrigated land,while the area under winter wheat has increased(Dukhovny and Sokolov 2002), resulting in a16% reduction in water abstraction for irrigation(from 109 to 92 km3), while the total irrigatedarea increased by 10% (Micklin 2007; accordingto FAO AQUASTAT, agricultural water use hasdecreased only by 5%, from 134 to 127 km3).To sustain both agricultural production and theenvironment, the International Food Policy Re-search Institute recommends keeping the cottoncultivation under 40% of the total irrigated landand increasing the area under wheat and maizearea from 10% in the early 1990 to 32% (Caiet al. 2006). Another strategy of water consump-tion reduction is replacement of cultivars andintroduction of new water management prac-tices to improve crop water productivity. CWP
P1: SFK/UKS P2: SFK Color: 1C
BLBS082-3-5 BLBS082-Yadav July 12, 2011 13:15 Trim: 246mm X 189mm
96 CROP ADAPTATION TO CLIMATE CHANGE
range is 1.1–2.7 kg/m3 for maize, 0.6–1.7 kg/m3
for wheat and rice, and 0.1–0.3 kg/m3 for cot-ton lint (Zwart and Bastiaanssen 2004), whichmakes an ample room for reducing irrigationdemands.
Adaptation to climate change in the re-gion focuses on two major strategies, improve-ment in water management and shift in maincrops toward the ones with less water require-ments. While the replacement of main cropsmight be not required for the next 10–20 years(Initial National Communication of the re-public Uzbekistan. . . 1999), multiple measuresto improve water management are suggested,such as reconstruction of the irrigation anddrainage systems in order to improve the ef-ficiency coefficient, implementation of mod-ern methods of irrigation, new dams and waterreservoirs, etc. (Turkmenistan: Initial NationalCommunication. . . 2001). All these measures ofplanned adaptation require, however, large capi-tal investments. Other measures include encour-aging the farmers to conserve water. The cur-rent price of irrigation water for the end usersis often heavily subsidized and does not stim-ulate the farmers to apply modern irrigationmethods.
Siberia region
The major agricultural zone within SI region is inNorth Kazakhstan. Both precipitation and ther-mal constraints severely impact agriculture onthe fertile soils of northern Kazakhstan steppes,even in comparison with the grain-producingareas of European Russia. Geographically,Kazakhstan is located in the center of a largelandmass, up to 3000 km away from the near-est sea, with much of the area in Dfa and DfbKoppen climate zones (cold winters with temper-atures below 40◦C and hot summers). The axis ofhigh barometric pressure traversing its northernpart makes climate generally dry and windy, withwinds in excess of 100 km/h. The usual annualrainfall is between 200 mm and 300 mm. Majorcrops include spring wheat and barley, both pro-
ducing extremely low yields (some of the lowestglobally; Akhmadieva 2007) with high interan-nual variability: compare barley yield of 1.5 t/hain 1992 to 0.6 t/ha in 1995 (FAOSTAT 2010).
Over the past 110 years, the temperaturehas increased by 1.5◦C; roughly half of thischange has happened during the past 40 years(Kazakhstan’s Second National Communica-tion . . . 2009). The increase in winter andspring temperatures is more pronounced, about1.9◦C, and summer and fall temperature changeis 0.7◦C (Initial National Communication . . .
1998). The long-term 1965–2005 precipitationtrend demonstrates some increase, mainly inwinter. Summer precipitation changed little, ex-cept an increased summer precipitation in Pavlo-dar (Kazakhstan’s Second National Communi-cation . . . 2009; Akhmadieva, Groisman 2008).Potential evapotranspiration has somewhat de-creased, mainly due to increased air humidity anddecreased wind speed (Akhmadieva 2007). Inthe 2000s, however, precipitation has decreased,leading to a drought (DeBeurs et al. 2009).
A multimodel analysis of future climatechange in the region projects 1.3–1.7◦C mean an-nual temperature increase by 2030s (2.6–3.7◦Cby 2050s) and 5–6% (10–12%) annual precipita-tion increase (Table 3.5.1). Warmer climate and,especially, an earlier start of the growing seasonare likely to benefit spring wheat crops, mitigat-ing the late season drought (Pilifisova et al. 1997;Akhmadieva 2007). The earlier spring greeningover the arable lands since 1991 is confirmedby NDVI studies (Propastin and Kappas 2008),even though De Beurs and Henebry (2004) ar-gued that the main drivers are land use changeand institutional changes rather than a warmerclimate. The analysis of NDVI (Propastin andKappas 2008) show that from March to May,greening increased in 65% of cropland pixelsand decreased in only 2% of the pixels; 73.5%of variation is explained by the change in springtemperature. However, if the warming exceedsthe optimal level of 2–4◦C, the yield woulddecrease, even when CO2 fertilization is takeninto account. By 2050–85, in Kostanaiskaya,
P1: SFK/UKS P2: SFK Color: 1C
BLBS082-3-5 BLBS082-Yadav July 12, 2011 13:15 Trim: 246mm X 189mm
CLIMATE CHANGE IMPACTS AND ADAPTATIONS IN THE COUNTRIES OF THE FSU 97
Akmolinskaya, and Pavlodarskaya oblasts, theyield is projected to decrease to 25–60% of thecurrent level, and for North-Kazakhstanskayaoblast, to 70–90% (Kazakhstan’s Second Na-tional Communication. . . 2009).
Taking into account low productivity of thelands, further decline of yield by 2050s presentsa threat to food security. In the cold and dry cli-mate of the region, the sustainable spring wheatproduction is based on the traditional water man-agement, developed during implementation ofthe “virgin land” state program (1953–57). Watermanagement includes packing snow in parallelrows in February to accumulate additional snow,summer fallowing to store rainfall water for thenext growing cycle, and conservation tilling infall to reduce evaporative water loss through bydecreasing capillary rise (Lal et al. 2007). How-ever, in a drier climate, these measures mightnot be sufficient, and a new adaptation strategywill be needed (Kazakhstan’s Second NationalCommunication. . . 2009). This strategy may in-clude a shift to new heat-resistant and drought-resistant cultivars, crop diversification, new wa-ter conservation techniques, genetically modi-fied crops, improved surveying, forecasting andearly warning systems, and farmer education onnew technologies.
Caucasia region
CC, the smallest of the regions, only 0.19 km2,includes Georgia, Armenia, Azerbaijan, andsmall parts of Russia. It is located in a mountain-ous country stretching for 1300 km from BlackSea in the west to Caspian Sea in the east, witha number of peaks elevating above 5000 m. Thistopography results in extreme climatic variabil-ity, with precipitation ranging from 259 mm inthe northeast to 1000–4000 mm in the west, andmean annual temperature changing from +15◦Cat the sea level to well below freezing at high ele-vations. North west of the region, including partsof Russia and Georgia, have sufficient or abun-dant water resources, while the most of Armeniaand Azerbaijan have limited water availability.
Additionally, even though the overall amount ofprecipitation is high, precipitation over the agri-cultural land is frequently much smaller (Vul-nerability of water resources. . . 2009). Becauseof that, the income from irrigated lands is up to900 $/ha greater than the income from the nonir-rigated land (Vulnerability of water resources. . .2009).
Numerous (∼2000) glaciers are located in theregion; many rivers depend on the glaciers andsnow melt water (Shahgedanova et al. 2009a)).Warmer summer temperature (increased by0.05◦C per annum since the late 1960s) has re-sulted in an intensified glacier melt with the pickin the 1990s, which has not been offset by thecold season precipitation increase. This trend hasbeen especially strong in the last two decadespossibly as a response to the weakening ArcticHigh (Georgia’s Initial National Communicationunder the UNFCC 1999) and strongly positivephase of the North Atlantic Oscillation (NAO;Shahgedanova et al. 2007, 2009b). Even thoughit can be fairly said that the climate in the regionbecomes drier, there is a lot of heterogeneity.The meteorological stations located northwestof (42◦N, 43◦E) point, closer to the Black Sea,observe increased summer precipitation, whilein the rest of the region precipitation decrease(Mokhov et al. 2005).
Continuing the observed trend, GCM sim-ulations seem to agree on increasing tempera-tures and decreasing precipitation, even thoughmodel verification against observations from me-teorological stations show that projection qual-ity vary: projections of annual precipitation inthe semiarid areas of the CC and in the ar-eas where frontal precipitation maxima occur(i.e., the Black Sea coast) appear to confirmthe observations, while in other areas, there is agreater bias (Shahgedanova et al. 2009b). Drierclimate is likely to affect the agriculture of Ar-menia and Azerbaijan, while it is harder to es-timate the impact in Georgia because of highspatial heterogeneity of the agricultural landsand extremely variable temperature and precipi-tation in the mountainous area (Georgia’s Initial
P1: SFK/UKS P2: SFK Color: 1C
BLBS082-3-5 BLBS082-Yadav July 12, 2011 13:15 Trim: 246mm X 189mm
98 CROP ADAPTATION TO CLIMATE CHANGE
National Communication. . . 1999). In Armenia,the average annual precipitation is 590 mm; how-ever, over the principal agriculture area located inthe Ararat valley, annual rainfall is only 220 mm.During the past 80 years, annual air temper-ature has increased by 0.85◦C, mostly in thesummer. Persistent positive anomalies of sum-mer temperature have been reported over thelast 14 years, except 2003, and the summer of2006 was the hottest in Armenia since 1929(Hovsepyan 2008). Over the same period, pre-cipitation has reduced by 6%, and the dura-tion of snow cover has decreased by a week,which decreased the amount of water stored inice and snow by 5–10%. Even a very conserva-tive projection of a 1.5◦C temperature increaseand 10–15% precipitation reduction by 2100would result in 15–20% reduction in river flow(First National Communication . . . 1998), whilea more realistic projection of 4.4–5.7◦C tempera-ture increase and 10–27% precipitation decreasewould reduce river flow by a quarter (Hovsepyan2008).
The reduction in water availability is likely toimpact agriculture in the irrigated lands, whichare responsible for 80% of Armenia’s agricul-tural production. In nonirrigated lands, projectedclimate change would reduce the yield of ce-reals by 9–13%, vegetables by 7–14%, potatoby 8–10%, and horticultures by 5–8%, whilethe yield of more heat-tolerant grapes could in-crease by 8–10% (First National Communica-tion . . . 1998). Yield variability could also in-crease due to increasing danger of droughts (e.g.,between 1998 and 2006 Armenia has experi-enced five droughts). Reduced and more variableyield, as well as potentially increasing availabil-ity of arable land in higher altitudes, would addto the pressure to increase the percentage of landunder irrigation; however, water resources arealready limited on more than half the land thatrequires irrigation (Stanton et al. 2009).
Similar to Armenia, the agriculture of Azer-baijan depends on irrigation. During 1960s–1990s, the temperature has increased by0.3–0.6◦C, with the highest increase observed
in the Kura-Araz lowland, which produces 80%of the total agricultural output of the countryin the irrigated lands. During the same timeperiod, precipitation decreased by 10%. Thesechanges have resulted in the snow line shiftingfrom 1300–1500 up to 1800–2000 m altitudeand in reductions and seasonal redistributionof river flow (Initial National Communicationof Azerbaijan Republic . . . 2001). GCM projec-tions of 2–5.8◦C temperature increase, increas-ing winter precipitation, and decreasing summerprecipitation would result in further reductionof water resources of Azerbaijan Rivers by15–20%. Increased water loss with evapotran-spiration by 30–35% would increase demand ofwater for irrigation, while decreased water avail-ability would amplify the pressure on water re-sources, increasing irrigation water deficit from3.8 to 9.5–11.5 km3 by the middle of this century(Initial National Communication of AzerbaijanRepublic . . . 2001). Higher temperatures mayalso result in more frequent hot dry winds inthe Kura-Araz lowland. These changes will neg-atively impact the production of the most im-portant food crop, winter wheat, reducing itsgrowing period by 13–40 days (Initial NationalCommunication of Azerbaijan Republic . . .
2001). Warmer climate is, however, beneficialfor growing some crops in the irrigated lands,notably the most important cash crop, cotton,both increasing the potential area of cultivationand allowing to cultivate more valuable fine fibercultivars, which require a longer growing season.
Adaptation to climate change in the principalagricultural areas of the CC include improvedwater management: increased accumulation ofwinter and spring river flow in new reservoirs,better distribution of water resources, reductionof water loss from irrigation systems, introduc-tion of drip irrigation, improved monitoring ofwater resources, development of long-term na-tional water programs (First National Commu-nication of the Republic of Armenia . . . 1998),and sustainable agricultural practices (e.g., zerotillage, snow retention, reduction of soil erosion).Additional measures on a local level include
P1: SFK/UKS P2: SFK Color: 1C
BLBS082-3-5 BLBS082-Yadav July 12, 2011 13:15 Trim: 246mm X 189mm
CLIMATE CHANGE IMPACTS AND ADAPTATIONS IN THE COUNTRIES OF THE FSU 99
improved seasonal forecasting, early warningsystems (e.g., flood warning), demonstration ofbetter practices (e.g., intercropping, tillage),irrigation, and new stress-resistant cultivars(Armenia: Lusadzor village. . . 2009).
Discussion
Globally, warmer climate and “carbon fertil-ization” (enhanced photosynthesis under higherconcentrations of atmospheric carbon dioxide)may lead to a drastic change in agricultural pro-duction, including a 6% decline to an 8% in-crease in industrialized countries and a 9–21%decline in developing countries (Cline 2007).Lobell and Field (2007) suggest that the warmertemperatures between 1981 and 2002 have al-ready reduced the trend of increasing yields ofsix principal crops: wheat, rice, soybean, barley,maize, and sorgos. For wheat, maize, and barley,which are the major cereal crops in the coun-tries of the FSU, there is a distinctively negativeresponse of global yields to increased temper-atures: e.g., it is believed that the 0.85 t/ha in-crease in wheat yield between 1981 and 2002has been reduced by 10% by warmer tempera-tures; barley yield increase of 0.45 t/ha has beenreduced by 30%, and maize yield increase wasreduced by 7% (Lobell and Field 2007). Eventhough climate change is expected to affect theproduction of agriculture only marginally, re-ducing the rate of projected yield increase, thetight balance between food supply and demandleads to potentially high impacts of even minorchanges in food supply. This effect is, however,moderated by adaptations, including changes intechnology.
In our review of climate change impacts andadaptations, we focused on two major factors,limiting agriculture, temperature and precipi-tation, and on related changes in the lengthof growing season, accumulated temperature(GDD), precipitation seasonality, frequency ofdroughts and floods, potential evapotranspira-tion, etc. To a certain degree, we have avoideddiscussion of carbon fertilization, even though
its impact on yields might be important, espe-cially in the regions with limited water avail-ability. Multiple studies suggest that on average,under 550 ppm CO2 concentration, C3 crops in-crease the yield by 10–20%, and C4 crops by0–10% (Ainsworth et al. 2004; Gifford 2004;Long et al. 2006). Additionally, the crops grownunder elevated atmospheric CO2 concentrationmay have a higher water-use efficiency, whichprovides additional benefits under reduced soilmoisture and increased frequency of droughts(Wullschleger et al. 2002). On the other hand, en-hanced photosynthetic activity may be reducedby elevated temperatures (Xiao et al. 2005), andmay favor weeds over crops (Ziska 2003). Atany rate, there is a lack of corresponding experi-mental data for FSU countries, which precludedus from estimating possible consequences of theabovementioned effects on the agriculture of theFSU.
Multiple studies have projected beneficial im-pact of climate change on production of agri-culture in the mid- and high latitudes; how-ever, it is likely that, overall, the major cropsof the FSU countries, wheat, barley, and maize,are negatively affected by warmer temperatures(Lobell and Field 2007; Alcamo et al. 2007a),mainly due to reduced water availability. Mul-tiple papers discussed in the previous chapterssuggest that the majority of the FSU regions,with an important exception of EN, are likely toreduce their climatically restricted yield. In theES, the solo exception to the generally worsen-ing climate conditions for agriculture is NorthernCaucasus. In SI, there is little change in thecrop yield response to climate change, exceptsome positive changes in the south of SI. InCA, NDVI analysis demonstrates some green-ing trend, which, however, is not necessarilyfollowed by better yields. Indeed, this green-ing can be explained with land use change,reduced pressure on natural vegetation, irri-gation increase, and better land managementin oases. With warmer temperatures later dur-ing this century, however, water availability forirrigation may decrease dramatically. Finally,
P1: SFK/UKS P2: SFK Color: 1C
BLBS082-3-5 BLBS082-Yadav July 12, 2011 13:15 Trim: 246mm X 189mm
100 CROP ADAPTATION TO CLIMATE CHANGE
climate change should reduce water availabilityfor agriculture in CC region.
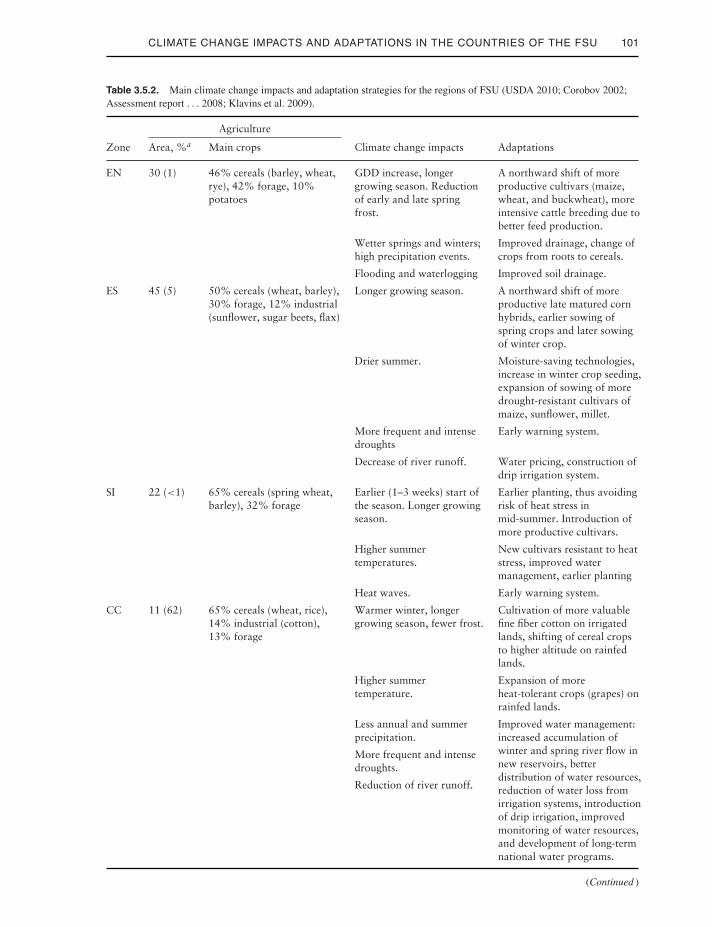
Successful adaptation of FSU agriculture tothe new climate is then the key element ofincreasing regional and global food security.These regional impacts and adaptations are sum-marized in Table 3.5.2. In many instances, adap-tation strategies are already being applied in theregions in response to the past climate change;however, there are strong factors in addition toclimate change that induce adaptive responses.The collapse of the Soviet Union at the end of1991 produced major socioeconomic and institu-tional shifts across the agricultural sector. With-out planting schedules or crop energy subsidiesin the form of fertilizers, pesticides, and fuel,and without price supports and access to guaran-teed markets, yields fell sharply and croplandswere abandoned (Lerman et al. 2004). Hence,it is hard to determine, e.g., whether the ob-served greening trend, as evident from NDVIremote sensing products, should be attributed tothe change in management or to the change inclimate (De Beurs et al. 2009). Because of thesharp monetary-driven decline in the agricultureof FSU countries, climatic effects are difficult toextract.
At the same time, there is a great potentialto increase the production of agriculture throughthe change in practices. In the European part ofFSU, the potential yield increase can exceed theclimatically driven yield decrease by a factor of4.5 (Olesen and Bindi 2002). For example, whilein Estonia, the average 1965–1996 yield of pota-toes was 13–14 t/ha, the potential yield due toclimate alone is 55.3 t/ha (Karing et al. 1999).In Ukraine, the yield of cereals can be increasedfrom 2.64 to 6.2 t/ha (FAO 2002). According toRussian Grain Union’s estimates (www.grun.ru),current yield of cereals in the south of EuropeanRussia can be increased from 2.8 to 9 t/ha and inVolga region from 1.7 to 6.4 t/ha. In SI, springwheat yield can be increased from 1.2 to 5t/ha.One of the factors affecting the yields is insuffi-cient application of fertilizers (compare 88 kg ofmineral fertilizers per hectare in 1990 to 17 kg/ha
in 1995, 19 kg/ha in 2000, 25 kg/ha in 2005 and36 kg/ha in 2009—Statistical Yearbook of Rus-sia, 2010). Climate change will, however, mod-ify the response of crops to improved manage-ment. If, provided that climate does not change,the yield of cereals would continue to improvein Russia at a 1.5% per annum, as it did in1985–2005 (Strategic prediction. . . 2005), cli-mate change is to decrease this rate.
There is an ongoing debate on the costs ofanticipatory versus reactive adaptation. If thischange is slow enough so that autonomous reac-tive adaptations to the new climatic conditionsgo along with the normal cycle of equipmentreplacement, the costs would be much smallercompared to the costs of replacement of equip-ment made obsolete by changing climate (Reillyet al. 2001). The farmers are able to effectivelyand quickly adjust to new climate conditions,perhaps not realizing that the changes in prac-tices are associated with climate (Olesen andBindi 2004), e.g., when the adaptations to wa-ter shortage are included into a new water man-agement plan. These responses include selectingnew cultivars, introduction of new crops, earlyplanting, change in crop mixture and crop rota-tion, change in management practice, new pestand disease control techniques, etc. However, ifclimate change is accelerated, as projected byGCMs for this century, reactive adaptations maycarry high costs; planned adaptations may berequired.
Additionally, adaptive capacities of FSUcountries vary greatly. One obvious limit to adap-tation is that the necessary capital investmentsmay be too high, while many countries of the re-gion are yet to surpass, or have barely surpassed,their 1991 per capita GDP. However, there aremultiple other physical, technological, financial,social, informational, or cultural barriers to adap-tations. Better regional integration can help inovercoming these limitations. For example, thewater management system in CA requires com-bined efforts of the governments of several coun-tries to function effectively. More research is re-quired on the existing and perspective strategies
P1: SFK/UKS P2: SFK Color: 1C
BLBS082-3-5 BLBS082-Yadav July 12, 2011 13:15 Trim: 246mm X 189mm
CLIMATE CHANGE IMPACTS AND ADAPTATIONS IN THE COUNTRIES OF THE FSU 101
Table 3.5.2. Main climate change impacts and adaptation strategies for the regions of FSU (USDA 2010; Corobov 2002;Assessment report . . . 2008; Klavins et al. 2009).
Agriculture
Zone Area, %a Main crops Climate change impacts Adaptations
EN 30 (1) 46% cereals (barley, wheat,rye), 42% forage, 10%potatoes
GDD increase, longergrowing season. Reductionof early and late springfrost.
A northward shift of moreproductive cultivars (maize,wheat, and buckwheat), moreintensive cattle breeding due tobetter feed production.
Wetter springs and winters;high precipitation events.
Improved drainage, change ofcrops from roots to cereals.
Flooding and waterlogging Improved soil drainage.
ES 45 (5) 50% cereals (wheat, barley),30% forage, 12% industrial(sunflower, sugar beets, flax)
Longer growing season. A northward shift of moreproductive late matured cornhybrids, earlier sowing ofspring crops and later sowingof winter crop.
Drier summer. Moisture-saving technologies,increase in winter crop seeding,expansion of sowing of moredrought-resistant cultivars ofmaize, sunflower, millet.
More frequent and intensedroughts
Decrease of river runoff.
Early warning system.
Water pricing, construction ofdrip irrigation system.
SI 22 (<1) 65% cereals (spring wheat,barley), 32% forage
Earlier (1–3 weeks) start ofthe season. Longer growingseason.
Earlier planting, thus avoidingrisk of heat stress inmid-summer. Introduction ofmore productive cultivars.
Higher summertemperatures.
New cultivars resistant to heatstress, improved watermanagement, earlier planting
Heat waves. Early warning system.
CC 11 (62) 65% cereals (wheat, rice),14% industrial (cotton),13% forage
Warmer winter, longergrowing season, fewer frost.
Higher summertemperature.
Less annual and summerprecipitation.
More frequent and intensedroughts.
Reduction of river runoff.
Cultivation of more valuablefine fiber cotton on irrigatedlands, shifting of cereal cropsto higher altitude on rainfedlands.
Expansion of moreheat-tolerant crops (grapes) onrainfed lands.
Improved water management:increased accumulation ofwinter and spring river flow innew reservoirs, betterdistribution of water resources,reduction of water loss fromirrigation systems, introductionof drip irrigation, improvedmonitoring of water resources,and development of long-termnational water programs.
(Continued )
P1: SFK/UKS P2: SFK Color: 1C
BLBS082-3-5 BLBS082-Yadav July 12, 2011 13:15 Trim: 246mm X 189mm
102 CROP ADAPTATION TO CLIMATE CHANGE
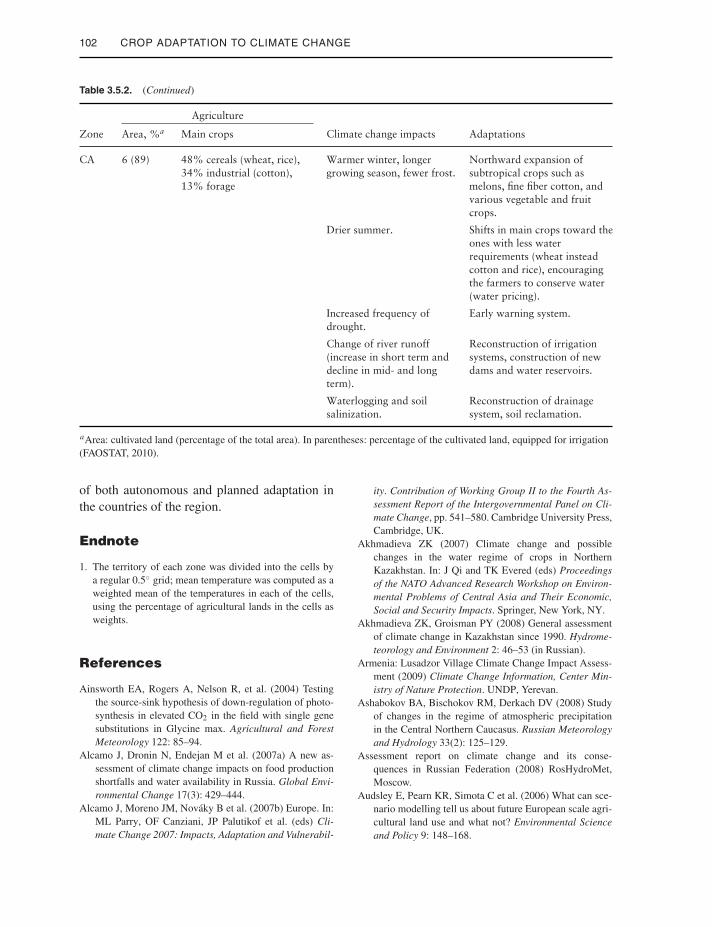
Table 3.5.2. (Continued)
Agriculture
Zone Area, %a Main crops Climate change impacts Adaptations
CA 6 (89) 48% cereals (wheat, rice),34% industrial (cotton),13% forage
Warmer winter, longergrowing season, fewer frost.
Drier summer.
Northward expansion ofsubtropical crops such asmelons, fine fiber cotton, andvarious vegetable and fruitcrops.
Shifts in main crops toward theones with less waterrequirements (wheat insteadcotton and rice), encouragingthe farmers to conserve water(water pricing).
Increased frequency ofdrought.
Change of river runoff(increase in short term anddecline in mid- and longterm).
Early warning system.
Reconstruction of irrigationsystems, construction of newdams and water reservoirs.
Waterlogging and soilsalinization.
Reconstruction of drainagesystem, soil reclamation.
aArea: cultivated land (percentage of the total area). In parentheses: percentage of the cultivated land, equipped for irrigation(FAOSTAT, 2010).
of both autonomous and planned adaptation inthe countries of the region.
Endnote
1. The territory of each zone was divided into the cells bya regular 0.5◦ grid; mean temperature was computed as aweighted mean of the temperatures in each of the cells,using the percentage of agricultural lands in the cells asweights.
References
Ainsworth EA, Rogers A, Nelson R, et al. (2004) Testingthe source-sink hypothesis of down-regulation of photo-synthesis in elevated CO2 in the field with single genesubstitutions in Glycine max. Agricultural and ForestMeteorology 122: 85–94.
Alcamo J, Dronin N, Endejan M et al. (2007a) A new as-sessment of climate change impacts on food productionshortfalls and water availability in Russia. Global Envi-ronmental Change 17(3): 429–444.
Alcamo J, Moreno JM, Novaky B et al. (2007b) Europe. In:ML Parry, OF Canziani, JP Palutikof et al. (eds) Cli-mate Change 2007: Impacts, Adaptation and Vulnerabil-
ity. Contribution of Working Group II to the Fourth As-sessment Report of the Intergovernmental Panel on Cli-mate Change, pp. 541–580. Cambridge University Press,Cambridge, UK.
Akhmadieva ZK (2007) Climate change and possiblechanges in the water regime of crops in NorthernKazakhstan. In: J Qi and TK Evered (eds) Proceedingsof the NATO Advanced Research Workshop on Environ-mental Problems of Central Asia and Their Economic,Social and Security Impacts. Springer, New York, NY.
Akhmadieva ZK, Groisman PY (2008) General assessmentof climate change in Kazakhstan since 1990. Hydrome-teorology and Environment 2: 46–53 (in Russian).
Armenia: Lusadzor Village Climate Change Impact Assess-ment (2009) Climate Change Information, Center Min-istry of Nature Protection. UNDP, Yerevan.
Ashabokov BA, Bischokov RM, Derkach DV (2008) Studyof changes in the regime of atmospheric precipitationin the Central Northern Caucasus. Russian Meteorologyand Hydrology 33(2): 125–129.
Assessment report on climate change and its conse-quences in Russian Federation (2008) RosHydroMet,Moscow.
Audsley E, Pearn KR, Simota C et al. (2006) What can sce-nario modelling tell us about future European scale agri-cultural land use and what not? Environmental Scienceand Policy 9: 148–168.
P1: SFK/UKS P2: SFK Color: 1C
BLBS082-3-5 BLBS082-Yadav July 12, 2011 13:15 Trim: 246mm X 189mm
CLIMATE CHANGE IMPACTS AND ADAPTATIONS IN THE COUNTRIES OF THE FSU 103
Badakhova GKh, Kaplan GL, Knutas AV (2008) Agricultureadaptation of the south region of Russia to conditionsof present climate change. 8th Annual Meeting of theEMS/7th ECAC, 5.
Brien KO (2000) Developing strategies for climate change:The UNEP country studies on climate change im-pacts and adaptations assessment. CICERO Report2000:2.
Cai X, McKinneyb DC, Rosegranta MW (2006) Sustainabil-ity Analysis for Irrigation Water Management in the AralSea Region. International Food Policy Research Institute,Washington, DC.
Chub VY (2002) Climate Change and Its Influence on theNatural Resource Potential of the Republic of Uzbekistan(In Russian). Glavgidromet, Tashkent.
Climate Change in Moldova (2009) Socio-economic Impactand Policy Options for Adaptation. UNDP in Moldova,Chisinau, Moldova.
Cline W (2007) Global Warming and Agriculture: Impact Es-timates by Country. Center for Global Development andPeterson Institute for International Economics, Washing-ton, DC.
Competitive Agriculture or State Control: Ukraine’s Re-sponse to the Global Food Crisis (2008) Europe and Cen-tral Asia Region Sustainable Development Unit, WorldBank.
Corobov R (2002) Estimations of climate change impacts oncrop production in the Republic of Moldova. GeoJournal57: 195–202.
DeBeurs KM, Wright CK, Henebry GM (2009) Dual scaletrend analysis for evaluating climatic and anthropogeniceffects on the vegetated land surface in Russia andKazakhstan. Environmental Research Letters 4: 045012.
DeBeurs KM, Henebry GM (2004) Land surface phenology,climatic variation, and institutional change: Analyzingagricultural land cover change in Kazakhstan. RemoteSensing of Environment 89: 497–509.
Dronin N, Bellinger E (2005) Climate Dependence and FoodProblems in Russia (1900–1990). The Interaction of Cli-mate and Agricultural Policy and Their Effect on FoodProblems. CEU Press, Budapest–New York, NY.
Dronin N, Kirilenko A (2008) Climate change and food stressin Russia: What if the market transforms as it did duringthe past century? Climatic Change 86: 123–150.
Dukhovny VA, Sokolov VI (2002) Vodohozyaistvennyeproblemy stran basseina Aral’skogo Morya: desyat’let sotrudnichestva i perspekctivy [Water managementproblems of the Aral Sea basin States: ten years ofcooperation and perspectives]. Melioratsia i VodnoeKhozyaistvo [Melioration and Water Economy] 1: 66–71(In Russian).
Estonian Rural Development Strategy 2007–2013 (2006)Ministry of Agriculture of the Republic of Estonia,Tallinn.
FAO AQUASTAT [Online database] (2010) Available from:http://www.fao.org/nr/water/aquastat/main/index.stm.Accessed June 1, 2010.
FAO FAOTRADE [Online database] (2010) Availablefrom: http://faostat.fao.org/site/535/default.aspx. Ac-cessed June 1, 2010.
FAO Food Security Statistics (2010) Available from:http://www.fao.org/economic/ess/food-security-statistics/en/. Accessed June 1, 2010.
FAO ResourceStat [Online database] (2010) Availablefrom: http://faostat.fao.org/site/377/ default.aspx. Ac-cessed June 1, 2010.
FAO (2002) World Agriculture: Towards 2015/2030. FAO,Rome.
FAOSTAT [Online database] (2010) Available from:http://faostat.fao.org. Accessed June 1, 2010.
Field NC (1968) Environmental quality and land productiv-ity: A comparison of the agricultural land base of theUSSR and North America. Canadian Geographer XII:1–14.
Fischer G, Shah M, Tubiello FN et al. (2005) Socio-economicand climate change impacts on agriculture: An inte-grated assessment, 1990–2080. Philosophical Transac-tions of the Royal Society B: Biological Sciences 360:2067–2073.
First National Communication of the Kyrgyz Republic underthe UNFCCC (2003) Bishkek.
First National Communication of the Republic of Armeniaunder the UNFCCC (1998) Ministry of Nature Protectionof the Republic of Armenia, Yerevan.
Friend AD (1998) Parameterization of a global daily weathergenerator for terrestrial ecosystem modelling. EcologicalModelling 109: 121–140.
Gatrell P (1986) Tsarist Economy (1850–1917). BT Batsford,London.
Georgia’s Initial National Communication under the UN-FCC (1999) Department of Hydrometeorology NationalClimate Research Centre, Tbilisi.
Gifford RM (2004) The CO2 fertilizing effect—Does it occurin the real world? New Phytologist 163: 221–225.
Gintzburger G, Le Houerou HN, Toderich KN (2005) Thesteppes of Middle Asia: Post-1991 agricultural and range-land adjustment. Arid Land Research and Management19(3): 215–239.
Hovsepyan A (2008) Model simulations of climate changeover Armenia region. In Enabling activities for prepa-ration of Armenia’s Second National Communication tothe UN Framework Convention on Climate Change (UN-FCCC), Yerevan.
Initial National Communication of Azerbaijan Republic onClimate Change (2001) State Hydrometeorological Com-mittee of Azerbaijan Republic, Baku.
Initial National Communication of the Republic of Kaza-khstan under the United Nations Framework Conventionon Climate Change (1998) Almaty.
Initial National Communication of the Republic of Uzbek-istan under the UNFCCC (1999) Tashkent.
IPCC (2000) Intergovernmental Panel on Climate Change:Summary for policymakers: Emissions scenarios, Aspecial report of the IPCC Working Group III, 2000.
P1: SFK/UKS P2: SFK Color: 1C
BLBS082-3-5 BLBS082-Yadav July 12, 2011 13:15 Trim: 246mm X 189mm
104 CROP ADAPTATION TO CLIMATE CHANGE
Available from: http://www.ipcc.ch/pub/reports.htm. Ac-cessed June 1, 2010.
IPCC (2007) Intergovernmental Panel on Climate Change.Climate Change 2007: The Physical Science Basis. Con-tribution of Working Group I to the Fourth Assessment Re-port of the Intergovernmental Panel on Climate Change.Cambridge University Press, Cambridge, UK, and NewYork, NY.
Jaagus J (2006) Climate change in Estonia during the sec-ond half of the 20th century in relationship with changein large-scale atmospheric circulation. Theoretical andApplied Climatology 83: 77–88
Karing P, Kallis A, Tooming H (1999) Adaptation principlesof agriculture to climate change. Climate Research 12:175–183
Kazakhstan’s Second National Communication to the Con-ference of the Parties to the United Nations FrameworkConvention on Climate Change (2009) Ministry of Envi-ronment Protection, Astana.
Kettunen L, Mukula J, Pohjonen V et al. (1988) The ef-fects of climatic variations on agriculture in Finland. In:ML Parry, TR Carter, and NT Konijn (eds) The Impactof Climatic Variations on Agriculture, Volume 1, Assess-ments in Cool Temperate and Cold Regions, pp. 511–614.Kluwer, Dordrecht, The Netherlands.
Khomyakov PM, Kuznetsov VI, Konyshev VN (2001) Im-pact of the Global Climate Changes on the Functioningof Major Sectors of the Economy and Health of the Pop-ulation of Russia (in Russian). Editorial, Moscow.
Khomyakov PM, Kuznetsov VI, Alfertov AM (2005)Vliyanie globalnyh izmenernii klimata na phunkt-sionirovanie osnovnyx sectorov ekonomiki i zdorovienaseleniya Rossii (Impact of the Global Climate Changeson Functioning of Major Sectors of the Economy andHealth of Population of Russia), (in Russian). EditorialURSS, Moscow.
Kirilenko A, Alcamo J, Endejan M et al. (2004) Assess-ment of climate change impacts on agricultural produc-tion in Russia. Reports of the Russian Academy of Sci-ences 396(6): 819–822.
Kirilenko AP, Dronin NM, Ashakeeva G Zh (2008) Project-ing water security in the Aral Sea basin countries: Cli-mate change, irrigation and policy. In: JR White and WHRobinson (eds) Natural Resources: Economics, Manage-ment and Policy, pp. 51–87. Nova Science Publishers,Hauppauge, NY.
Klavins M, Briede A, Rodinov V (2009) Long term changesin ice and discharge regime of rivers in the Baltic region inrelation to climatic variability. Climatic Change 95(3–4):485–498.
Kottek M, Grieser J, Beck C et al. (2006) World map of theKoppen-Geiger climate classification updated. Meteorol-ogische Zeitschrift 15: 259–263.
Kruchkov BG, Rakovskaya LI (1990) Zernovoe khozyastvo:territorial’naya organizatsiya I efectivnost’ proizvod-stva. (Grain Production: Territorial Organization andFarming Efficiency) (in Russian). MSU, Moscow.
Lal R, Suleimenov M, Stewart BA et al. (2007) ClimateChange and Terrestrial Carbon Sequestration in CentralAsia. Taylor & Francis Group, London, UK.
Lerman Z, Csaki C, Feder G (2004) Agriculture in Tran-sition: Land Policies and Evolving Farm Structures inPost-Soviet Countries. Lexington Books, Lanham, MD.
Lioubimtseva E, Cole R, Adams JM et al. (2005) Impacts ofclimate and land-cover changes in arid lands of CentralAsia. Journal of Arid Environments 62(2): 285–308.
Lioubimtseva E, Henebry GM (2009) Climate and environ-mental change in arid Central Asia: Impacts, vulner-ability, and adaptations. Journal of Arid Environments73(11): 963–977.
Lithuania’s Second National Communication under theFramework Convention on Climate Change (2008) Min-istry of the Environment, Vilnius
Lobell DB, Field CB (2007) Global scale climate-crop yieldrelationships and the impacts of recent warming. Envi-ronmental Research Letters 2(014002): 1–7.
Long SP, Ainsworth EA, Leakey ADB et al. (2006) Foodfor thought: Lower expected crop yield stimulationwith rising CO2 concentrations. Science 312: 1918–1921.
Meleshko VP, Kattsov VM, Govorkova VA et al. (2008)Climate of Russia in the 21st Century. Part 3. Futureclimate changes calculated with an ensemble of cou-pled atmosphere-ocean general circulation CMIP3 mod-els. Russian Meteorology and Hydrology 33(9): 541–552.
Meshcherskaya AA, Blazhevich BG (1990) Catalogs of Tem-perature and Humidity Characteristics According to theEconomical Regions of the Main Productive Zone of theUSSR (1891–1983) (in Russian). Leningrad.
Micklin PA (2007) The Aral Sea disaster. Annual ReviewEarth Planet Science 35: 47–72.
Mitchell TD, Carter TR, Jones PD et al. (2004) A comprehen-sive set of high-resolution grids of monthly climate forEurope and the globe: The observed record (1901–2000)and 16 scenarios (2001–2100). Tyndall Centre WorkingPaper 55.
Mokhov II (2008) Possible regional consequences of globalclimate changes. Russian Journal of Earth Sciences 10:ES6005.
Mokhov II, Roeckner E, Semenov VA, Khon VCh et al.(2005) Extreme precipitation regimes in Northern Eura-sia in the 20th century and their possible changes in the21st century. Doklady Earth Sciences 403(5): 767–770.
Olesen JE, Bindi M (2002) Consequences of climate changefor European agricultural productivity, land use and pol-icy. European Journal of Agronomy 16: 239–262.
Olesen JE, Bindi M (2004) Agricultural impacts and adapta-tions to climate change in Europe. Farm Policy Journal1(3): 36–46.
Ososkova T, Gorelkin N, Chub V (2000) Water re-sources of Central Asia and adaptation measures for cli-mate change. Environmental Monitoring and Assessment61(1): 161–166.
P1: SFK/UKS P2: SFK Color: 1C
BLBS082-3-5 BLBS082-Yadav July 12, 2011 13:15 Trim: 246mm X 189mm
CLIMATE CHANGE IMPACTS AND ADAPTATIONS IN THE COUNTRIES OF THE FSU 105
Parker WN (1972) The Superpowers. The United States andthe Soviet Union Compared. John Willey & Sons, NewYork, NY.
Parry ML, Rosenzweig C, Iglesias A et al. (2004) Effects ofclimate change on global food production under SRESemissions and socio-economic scenarios. Global Envi-ronmental Change 14: 53–67.
Pielke RA, Adegoke J, Beltran-Przeukurat A et al. (2007) Anoverview of regional land-use and land-cover impacts onrainfall. Tellus B 59: 587–601.
Pilifisova OV, Eserkepova IB, Dolgih SA (1997) Regionalclimate change scenarios under global warming inKazakhstan. Climatic Change 36(1–2): 23–40.
Propastin PA, Kappas M (2008) Photosynthetic trends be-tween 1982–2003 in the steppe zone of Kazakhstanand their climatic correlates. Climate 2008/Klima2008. Available from: http://www.climate2008.net/?a1=pap&cat=1&e=68. Accessed December 15,2009.
Protserov AV (1950) Zasyxi na Evropeiskoi territirii SSSR(Drought on European Territory of the Soviet Union). In:Agroklimaticheskie usloviya stepei Ukrainskoi SSR i putiulucheniya ix (Agroclimatic conditions of steppes of theUkrainian SSR and ways to improve them), pp. 17–22 (inRussian). Academy of Sciences of the Ukrainian SSR,Kiev.
Ramguttee L (2008) Climate change: Moldova’s experience.In: 11th CEI Summit Economic Forum, Chisinau, October9, 2008.
Ramankutty N, Evan A, Monfreda C et al. (2008) Farming theplanet: 1. Geographic distribution of global agriculturallands in the year 2000. Global Biogeochemical Cycles22(1): GB1003.
Reilly J, Graham J, Hrubovcak J (2001) Agriculture: The Po-tential Consequences of Climate Variability and Changefor the United States, US National Assessment of the Po-tential Consequences of Climate Variability and Change,US Global Change Research Program. Cambridge Uni-versity Press, New York, NY.
Robock A, Mu M, Vinnikov K et al. (2005) Forty-five years ofobserved soil moisture in the Ukraine: No summer dessi-cation (yet). Geophysical Research Letters v.32, L03401,doi: 10.1029/2004GL021914.
Rowntree PR, Callander BA, Cochrane J (1989) Modellingclimate change and some potential effects on agriculturein the UK. Journal of the Royal Agricultural Society ofEngland 150(1): 153–170.
Shahgedanova M, Popovnin V, Aleynikov A et al. (2007)Long-term change, interannual and intra-seasonal vari-ability in climate and glacier mass balance in the cen-tral Greater Caucasus, Russia. Annals of Glaciology 46:355–361.
Shahgedanova M, Hagg W, Zacios M et al. (2009a). An as-sessment of the recent past and future climate change,glacier retreat, and runoff in the Caucasus region usingdynamical and statistical downscaling and HBV-ETH hy-drological model. In: PY Groisman and SV Ivanov (eds)
Regional Aspects of Climate-Terrestrial-Hydrologic In-teractions in Non-boreal Eastern Europe, pp. 63–72.Springer, The Netherlands.
Shahgedanova M, Hagg W, Hassell D et al. (2009b) Climatechange, glacier retreat, and water availability in the Cau-casus region. In: A Jones (ed) Global Threats to WaterSecurity, pp. 131–143. Springer, The Netherlands.
Small I, Bunce N (2003) The Aral Sea disaster and the dis-aster of international assistance. Journal of InternationalAffairs 56: 11–13.
Stanton EA, Ackerman F, Resende F (2009) The Socio-economic Impact of Climate Change in Armenia. Stock-holm Environment Institute, UNDP, Yerevan.
Statistical Yearbook of Russia (2010) Goskomstat.Moscow. Available from: http://www.gks.ru/bgd/regl/b10_13/Main.htm. Accessed March 30, 2011.
Strategic Prediction for the Period of up to 2010–2015 ofClimate Change Expected in Russia and Its Impact onSectors of the Russian National Economy (2005) Roshy-dromet, Moscow.
Tarand A (1993) Precipitation time series in Estonia in1751–1990. Zeszyty Naukowe Uniwersytetu Jagiellon-skiego, Prace Geograficzne 95: 139–149.
Tammets T (2007) Distribution of extreme wet and drydays in Estonia in last 50 years. Proceedings of theEstonian Academy of Sciences Engineering 13: 252–259.
Tebaldi C, Hayhoe K, Arblaster et al. (2006) Going to the ex-tremes; an intercomparison of model-simulated historicaland future changes in extreme events. Climatic Change79: 185–211.
Tooming H, Kadaja J (2006) Climate changes indicated bytrends in snow cover duration and surface albedo in Es-tonia. Meteorologische Zeitschrift NF8: 16–21.
Turkmenistan: Initial National Communication of ClimateChange under UN Framework Convention on ClimateChange (2001) Ministry of Nature Protection, Ashgabat.
UNDP in the Republic of Moldova (2009) Climate changeand its challenges for Moldova 2009/2010. National Hu-man Development Report. UNDP, Chisinau, Republic ofMoldova.
UNFCCC (2006) Report of the centralized in-depth review ofthe fourth national communication of Estonia. Availablefrom: http://unfccc.int/resource/docs/2006/idr/est04.pdf.Accessed January 13, 2010.
USDA (2010) Production Estimates and Crop Assess-ment Division. Foreign Agricultural Service. Availableat http://www.fas.usda.gov/remote/soviet/country_page/rep_area.htm. Accessed March 30, 2011.
Varushchenko AN, Lukyanova SA, Solovieva GD et al.(2000) Evolution of the Gulf of Kara-Bogaz-Gol in thepast century. In: KP Lulla and LV Dessinov (eds) Dy-namic Earth Environments: Remote Sensing Observa-tions from Shuttle-Mir Missions. John Wiley & Sons,New York, NY, pp. 201–210.
Vulnerability of Water Resources in the Republic of Ar-menia under Climate Change (2009) Climate Change
P1: SFK/UKS P2: SFK Color: 1C
BLBS082-3-5 BLBS082-Yadav July 12, 2011 13:15 Trim: 246mm X 189mm
106 CROP ADAPTATION TO CLIMATE CHANGE
Information Center, Ministry of Nature Protection of theRepublic of Armenia, Yerevan.
White C (1987) Russia and America: The Roots of EconomicDivergence. Grum Helm, New York, NY.
Wullschleger SD, Tschaplinski TJ, Norby RJ (2002) Plantwater relations at elevated CO2—Implications for water-limited environments. Plant Cell and Environment 25:319–331.
Xiao G, Liu W, Xu Q et al. (2005) Effects of temperatureincrease and elevated CO2 concentration, with supple-mental irrigation, on the yield of rain-fed spring wheat in
a semiarid region of China. Agricultural Water Manage-ment 74: 243–255.
Ziska LH (2003) Evaluation of yield loss in field-grownsorghum from a c3 and c4 weed as a function of in-creasing atmospheric carbon dioxide. Weed Science 51:914–918.
Zwart SJ, Bastiaanssen WGM (2004) Review of measuredcrop water productivity values for irrigated wheat, rice,cotton and maize. Agricultural Water Management 69:115–133.