criticality analysis for lhc cryogenic … criterions for a criticality ranking numerical input data...
TRANSCRIPT
CRITICALITY ANALYSIS FOR LHC CRYOGENIC PROCESS Determination of critical components
1

CRITICALITY ANALYSIS FOR LHC CRYOGENIC PROCESS Determination of critical components
2 Jimmy Martin
A criticality analysis ? What for ?
• The current overall availability reached is above 90% • This value must be increased to maximise the global LHC’s efficiency
Methodology of study : 2 STEPS • Step 1 : Process functional analysis
• Step 2 : WEIBULL analysis (Reliability computations) + FMECA criterions for a criticality ranking
Numerical input data
• Statistics for 2011-2012 of ‘CM’ conditions losses (E. DURET) • Cumulated events from Logbook OA (‘failure/stop’ and ‘problem solved’ categories)
Studied components
• From 1st January 2011 to 1st August 2012 Period of study
• Valves: CV’s for helium – PV’s for nitrogen • Turbines, warm and cold compressors systems • Electric heaters
Waloddi WEIBULL

CRITICALITY ANALYSIS FOR LHC CRYOGENIC PROCESS Determination of critical components
3 Jimmy Martin
STEP 1 : PROCESS FUNCTIONAL ANALYSIS
Aim of the analysis • Good comprehension of the process layout in order to make easier the next criticality analysis
tasks The chosen methodology
• Determination of elementary process functions, given the requested thermal-hydraulic conditions for cryogenic fluids
• Development into secondary and tertiary functions, as far as elementary technical solutions can be highlighted
Main function and its associated sub functions
Technical solutions
‘Warm’ compression station
Example :

CRITICALITY ANALYSIS FOR LHC CRYOGENIC PROCESS Determination of critical components
4 Jimmy Martin
STEP 2 : CRITICALITY ANALYSIS
Definition of criticality • Level of criticality of an elementary component : estimated by studying the occurrence, the
severity and the probability of non-detection associated to a (combined) failure mode(s) :
C = O ∗ S ∗ D
Criticality index (from 0 to 1)
Occurrence index (from 0 to 1) • Built by using statistical data from logbook • Computation of failure rate functions associated to
hardware components (cf. WEIBULL analysis)
Severity index (from 0 to 1) • Built by using statistical data from ‘CM loss’ monitoring
files (cf. E. DURET )
Non-detection index (from 0 to 1) • Not included because of a lack of input data
(equivalent to the ‘Risk Priority Number’ or ‘RPN’ criterion used in the FMECA analysis)

CRITICALITY ANALYSIS FOR LHC CRYOGENIC PROCESS Determination of critical components
5 Jimmy Martin
STEP 2 : CRITICALITY ANALYSIS
Occurrence index ‘O’ : determination
Studied population of components + ‘Logbook OA data’
05
10152025
Histogram of causes
02468
1012
Command systems
0
0,001
0,002
0,003
0,004
0,005
0,006
0 200 400 600
Lam
bda
(fai
lure
/day
)
time (day)
Decreasing Pareto analysis of causes (like a ‘Russian dolls’ game)
Statistical computations, using the WEIBULL’s tools
(λ(t), R(t), etc.)
⇒ However :
• λ(t) = ?? • R(t) = ?? • WEIBULL’s models = ??
EXCEL file ‘LHC CRYO – statistical study’
Extraction

CRITICALITY ANALYSIS FOR LHC CRYOGENIC PROCESS Determination of critical components
Jimmy Martin
STEP 2 : CRITICALITY ANALYSIS
Some definitions : • R(t) = reliability probability (from 0 to 1) of a given population of components • F(t) = failure probability = 1 - R(t) • λ(t) = failure rate function associated to a population : number of failures by unit of time, as a function of time variable • MTBF = ‘Mean Time Between Failures’ of a population : estimator of the population reliability
How to compute λ(t), F(t), R(t) and MTBFs from ‘Logbook OA’ data ?
By trying to correlate statistical data to known mathematical
models (WEIBULL,…)
Occurrence index ‘O’ : determination
Under the WEIBULL model hypothesis : 𝑅 𝑡 = 𝑒−(𝑡−𝛾𝜂 )𝛽
𝐹 𝑡 = 1 − 𝑒−(𝑡−𝛾𝜂 )𝛽
𝜆 𝑡 =𝛽𝜂 ∗
𝑡 − 𝛾𝜂
𝛽−1
Where: t = time variable β = shape parameter γ = position parameter η = scale parameter
CRITICALITY ANALYSIS FOR LHC CRYOGENIC PROCESS Determination of critical components
Jimmy Martin
STEP 2 : CRITICALITY ANALYSIS
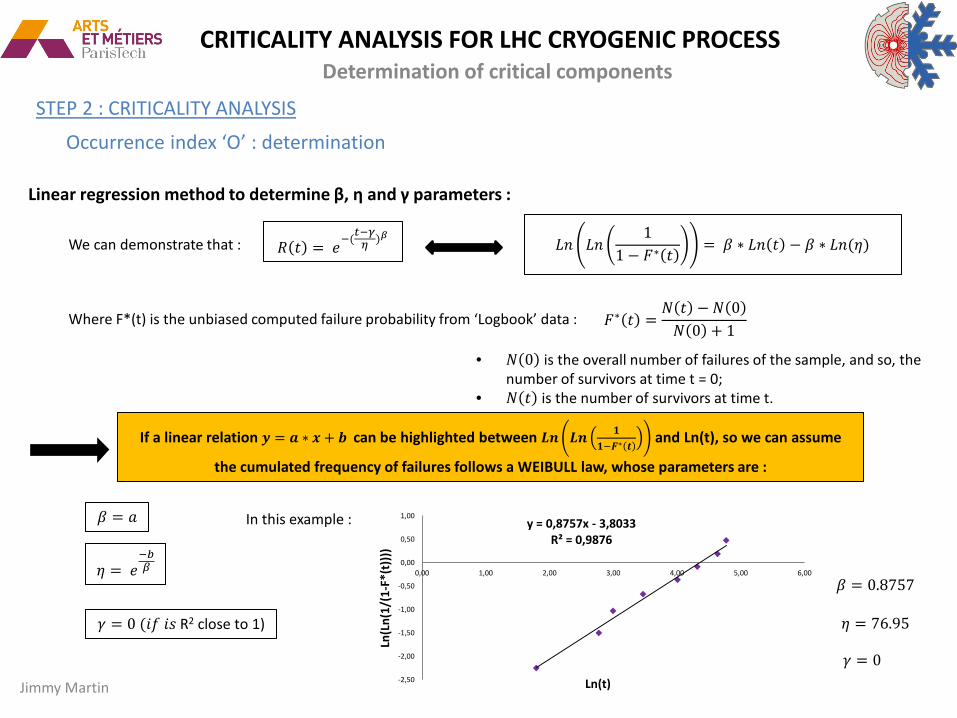
Linear regression method to determine β, η and γ parameters :
Occurrence index ‘O’ : determination
𝑅 𝑡 = 𝑒−(𝑡−𝛾𝜂 )𝛽 𝐿𝐿 𝐿𝐿
11 − 𝐹∗ 𝑡
= 𝛽 ∗ 𝐿𝐿 𝑡 − 𝛽 ∗ 𝐿𝐿(𝜂) We can demonstrate that :
Where F*(t) is the unbiased computed failure probability from ‘Logbook’ data : 𝐹∗ 𝑡 =𝑁 𝑡 − 𝑁 0𝑁 0 + 1
• 𝑁 0 is the overall number of failures of the sample, and so, the number of survivors at time t = 0;
• 𝑁 𝑡 is the number of survivors at time t.
If a linear relation 𝒚 = 𝒂 ∗ 𝒙 + 𝒃 can be highlighted between 𝑳𝑳 𝑳𝑳 𝟏𝟏−𝑭∗ 𝒕
and Ln(t), so we can assume
the cumulated frequency of failures follows a WEIBULL law, whose parameters are :
y = 0,8757x - 3,8033 R² = 0,9876
-2,50
-2,00
-1,50
-1,00
-0,50
0,00
0,50
1,00
0,00 1,00 2,00 3,00 4,00 5,00 6,00
Ln(L
n(1/
(1-F
*(t)
)))
Ln(t)
𝛽 = 𝑎
𝜂 = 𝑒−𝑏𝛽
𝛾 = 0 (𝑖𝑖 𝑖𝑖 R2 close to 1)
In this example :
𝛽 = 0.8757
𝜂 = 76.95
𝛾 = 0

CRITICALITY ANALYSIS FOR LHC CRYOGENIC PROCESS Determination of critical components
Jimmy Martin
STEP 2 : CRITICALITY ANALYSIS
Given the β, η and γ parameters :
Occurrence index ‘O’ : determination
• It is now possible to compute theoretical R(t) and λ(t) functions • The β value defines the trend of λ(t) :
00,0010,0020,0030,0040,0050,0060,0070,0080,009
1 6 11 16 21 26 31 36 41 46 51 56 61 66 71 76 81 86 91 96 101
106
111
116
121
λ(t)
β < 1 1 < β β = 1
• A bilinear scatter when plotting 𝐿𝐿 𝐿𝐿 11−𝐹∗ 𝑡
as a function of Ln(t) reveals a bi-Weibull distribution which currently leads to
the typical ‘bathtub’ plot for λ(t) :
0
0,0005
0,001
0,0015
0,002
0,0025
0,003
0 100 200 300 400 500 600 700
λ(t)
time t (day)
y = 0.8555x - 5.6952 R² = 0.9819
y = 3.5604x - 21.553 R² = 0.9649
-4,7
-3,7
-2,7
-1,7
-0,7
0,3
1,3
2,2 2,7 3,2 3,7 4,2 4,7 5,2 5,7 6,2 6,7
ln(ln
(1/(
1-F*
(t)))
)
ln(t)

CRITICALITY ANALYSIS FOR LHC CRYOGENIC PROCESS Determination of critical components
Jimmy Martin
STEP 2 : CRITICALITY ANALYSIS
The Kolmogorov-Smirnov statistical test to check the WEIBULL distribution hypothesis :
Occurrence index ‘O’ : determination
• Computation of the maximum absolute value of the difference between the theoretical and observed F(t) : 𝐷 = 𝑀𝑎𝑀 𝐹𝑡𝑡𝑡𝑡 𝑡 − 𝐹∗(𝑡)
• Determination of the admissible limit value for D from a Kolmogorov-Smirnov table, as a function of the number N(0) of
events and the chosen level of risk α (what gives the level of confidence of the WEIBULL hypothesis) :
• If the condition 𝐷 ≤ 𝐷𝑙𝑙𝑙𝑙𝑡 is respected, so the WEIBULL hypothesis can be accepted with an associated level of confidence (1 –α)%
Example :
0,0000
0,1000
0,2000
0,3000
0,4000
0,5000
0,6000
0,7000
0,8000
0,9000
1,0000
0 100 200 300 400 500 600
F(t)
t (day)
theoreal

CRITICALITY ANALYSIS FOR LHC CRYOGENIC PROCESS Determination of critical components
Jimmy Martin
STEP 2 : CRITICALITY ANALYSIS
Construction of the Occurrence index :
Occurrence index ‘O’ : determination
• Built by considering the overall number of events and the failure rate’s trend related to a studied population:
If: • β < 1 λ’s trend = ↘ • β = 1 λ’s trend = → • 1 < β ≤ 2 λ’s trend = ↗ + • 2 < β λ’s trend = ↗ ++
Code of colours: • Green 0.25; • Yellow 0.5; • Orange 0.75; • Red 1.
0
0,001
0,002
0,003
0,004
0,005
0,006
0 200 400 600
Lam
bda
(fai
lure
/day
)
time (day)
0 1 2
CV valves - MEC
Warm Compressors(without leakage)
PV valves for N2
Turbines - command
Electric Heatears
CV valves - COM
Cold Compressors -regulator
Previously computed λ(t) functions for the studied populations of components
Occurrence ranking

CRITICALITY ANALYSIS FOR LHC CRYOGENIC PROCESS Determination of critical components
Jimmy Martin
STEP 2 : CRITICALITY ANALYSIS
Construction of the Severity index :
Severity index ‘S’ : determination
• Built by considering the overall number of losses of ‘CM’ and time before recovering these conditions, for a studied population:
Code of colours: • Green 0.25; • Yellow 0.5; • Orange 0.75; • Red 1.
Statistical data about ‘CM’ losses (cf. E. DURET’s files)
0 0,5 1
PV valves for N2
CV valves - MEC
Electric Heatears
CV valves - COM
Turbines - command
Warm Compressors (withoutleakage)
Cold Compressors - regulator
Severity ranking

CRITICALITY ANALYSIS FOR LHC CRYOGENIC PROCESS Determination of critical components
Jimmy Martin
STEP 2 : CRITICALITY ANALYSIS
Construction of the Criticality index :
Criticality index ‘C’ : determination
0 0,1 0,2 0,3 0,4 0,5 0,6 0,7 0,8
PV valves for N2
CV valves - MEC
Electric Heatears
CV valves - COM
Turbines - command
Warm Compressors (withoutleakage)
Cold Compressors - regulator
Severity ranking
• Built by multiplying the two previous indexes of occurrence and severity:
0,0 20,0 40,0 60,0 80,0
CV valves - MEC
PV valves for N2
Electric Heatears
Warm Compressors (without leakage)
Turbines - command
CV valves - COM
Cold Compressors - regulator
0 1 2
CV valves - MEC
Warm Compressors(without leakage)
PV valves for N2
Turbines - command
Electric Heatears
CV valves - COM
Cold Compressors -regulator
Occurrence ranking
CRITICALITY RANKING
Recall : C = O ∗ S ∗ D (With D = 1)

CRITICALITY ANALYSIS FOR LHC CRYOGENIC PROCESS Determination of critical components
13 Jimmy Martin
Cold compressors – global study • 25 events along the studied period
• A unique Weibull distribution: the failure rate’s trend is increasing (95% of confidence)
y = 2.683x - 15.847 R² = 0.9433
-4
-3
-2
-1
0
1
2
4,6 5,1 5,6 6,1 6,6
ln(ln
(1/(
1-F*
(t))))
ln(t)
0,0000
0,0020
0,0040
0,0060
0,0080
0,0100
0,0120
0,0140
0 100 200 300 400 500 600
λ(t)
time (day)
𝜆 𝑡 =2.683367
∗𝑡
367
1.683
CRITICALITY ANALYSIS FOR LHC CRYOGENIC PROCESS Determination of critical components
14 Jimmy Martin
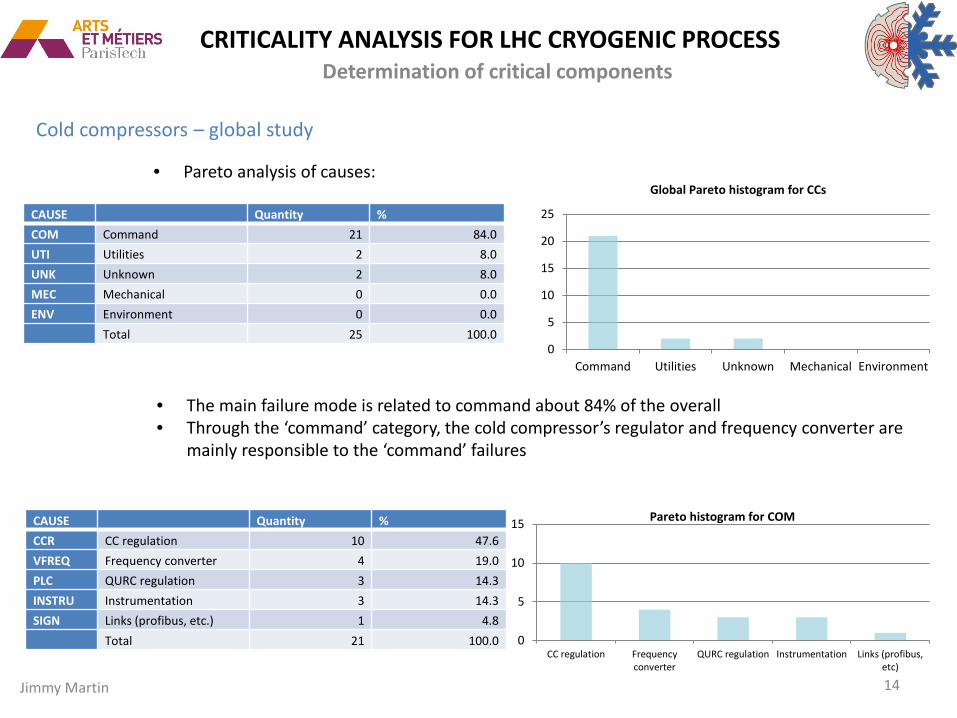
Cold compressors – global study
• Pareto analysis of causes:
CAUSE Quantity % COM Command 21 84.0 UTI Utilities 2 8.0 UNK Unknown 2 8.0 MEC Mechanical 0 0.0 ENV Environment 0 0.0
Total 25 100.0 0
5
10
15
20
25
Command Utilities Unknown Mechanical Environment
Global Pareto histogram for CCs
• The main failure mode is related to command about 84% of the overall • Through the ‘command’ category, the cold compressor’s regulator and frequency converter are
mainly responsible to the ‘command’ failures
CAUSE Quantity % CCR CC regulation 10 47.6 VFREQ Frequency converter 4 19.0 PLC QURC regulation 3 14.3 INSTRU Instrumentation 3 14.3 SIGN Links (profibus, etc.) 1 4.8
Total 21 100.0 0
5
10
15
CC regulation Frequencyconverter
QURC regulation Instrumentation Links (profibus,etc)
Pareto histogram for COM

CRITICALITY ANALYSIS FOR LHC CRYOGENIC PROCESS Determination of critical components
15 Jimmy Martin
Cold compressors – ‘regulator’ causes
• 11 events along the studied period • A unique Weibull distribution: the failure rate’s trend is increasing (95% of confidence)
0,0000
0,0020
0,0040
0,0060
0,0080
0,0100
0,0120
0 100 200 300 400 500 600
Lam
bda
(fai
lure
/day
)
time (day)
VREQ and CCR failure distribution
CC1
CC2
CC3
CC4
VFREQ and CCR failure distribution Element Quantity % %Air Liquide %Linde CC1 6 42.9 83.3 16.7 CC2 4 28.6 0 100 CC3 2 14.3 0 100 CC4 2 14.3 - 100 Total 14 100.0 % value 35.7 64.3
Linde/A.Liquide failure%
%AirLiquide
%Linde
• CC1 and then CC2 main causes of failures • A possible correlation between thermo hydraulic conditions and ‘regulator’ failures?
𝜆 𝑡 =2.7631
406∗
𝑡406
1.7631

CRITICALITY ANALYSIS FOR LHC CRYOGENIC PROCESS Determination of critical components
16 Jimmy Martin
Warm compressors – excluding leakage
• 21 events along the studied period • A unique Weibull distribution: the failure rate’s trend is decreasing (95% of confidence)
y = 0,8155x - 4,6538 R² = 0,9504
-3,5-3
-2,5-2
-1,5-1
-0,50
0,51
1,5
2 2,5 3 3,5 4 4,5 5 5,5 6 6,5 7
ln(ln
(1/(
1-F*
(t))))
ln(t)
y = 0,0078x-0,184
0,0025
0,003
0,0035
0,004
0,0045
0,005
0,0055
0 100 200 300 400 500 600
Lam
bda
(fai
lure
/day
)
time (day)
• Pareto analysis of causes: CAUSE Quantity %
COM Command 8 38.1 MEC Mechanical 6 28.6 UTI Utilities 4 19.0 UNK Unknown 2 9.5 ENV Environment 1 4.8
Total 21 100.0 0
2
4
6
8
10
Command Mechanical Utilities Unknown Environment
• Main causes: ‘command’ and ‘mechanical’ • Not enough data to follow the statistical analysis
𝜆 𝑡 =0.8155
301∗
𝑡301
−0.1845
CRITICALITY ANALYSIS FOR LHC CRYOGENIC PROCESS Determination of critical components
17 Jimmy Martin
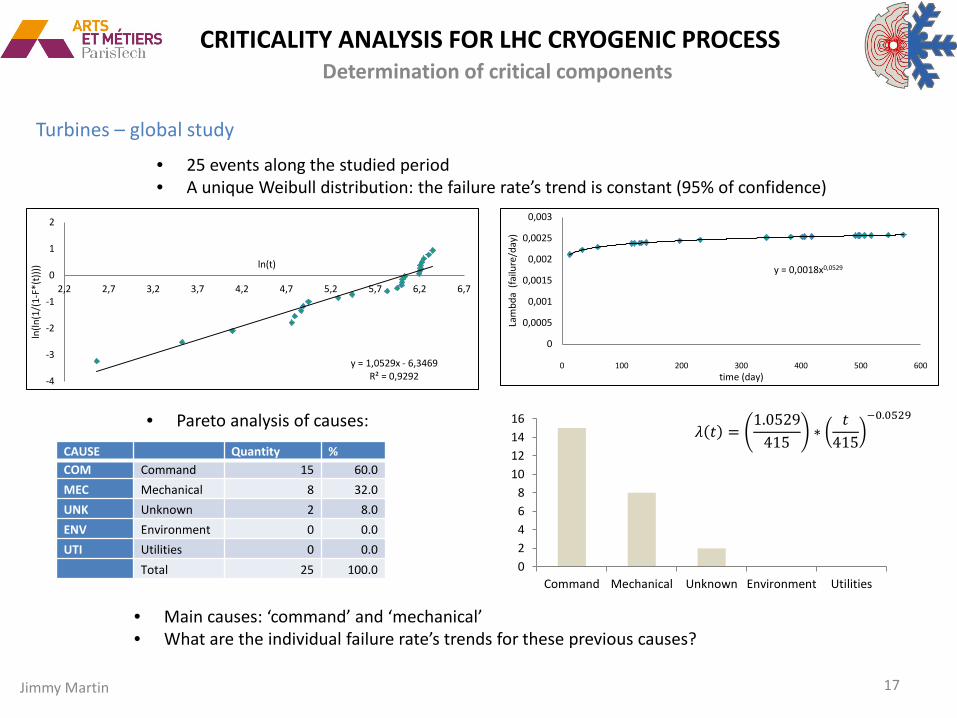
Turbines – global study
• 25 events along the studied period • A unique Weibull distribution: the failure rate’s trend is constant (95% of confidence)
• Pareto analysis of causes:
• Main causes: ‘command’ and ‘mechanical’ • What are the individual failure rate’s trends for these previous causes?
y = 1,0529x - 6,3469 R² = 0,9292 -4
-3
-2
-1
0
1
2
2,2 2,7 3,2 3,7 4,2 4,7 5,2 5,7 6,2 6,7
ln(ln
(1/(
1-F*
(t))))
ln(t) y = 0,0018x0,0529
0
0,0005
0,001
0,0015
0,002
0,0025
0,003
0 100 200 300 400 500 600
Lam
bda
(fai
lure
/day
)
time (day)
CAUSE Quantity % COM Command 15 60.0 MEC Mechanical 8 32.0 UNK Unknown 2 8.0 ENV Environment 0 0.0 UTI Utilities 0 0.0
Total 25 100.0 02468
10121416
Command Mechanical Unknown Environment Utilities
𝜆 𝑡 =1.0529
415∗
𝑡415
−0.0529

CRITICALITY ANALYSIS FOR LHC CRYOGENIC PROCESS Determination of critical components
18 Jimmy Martin
Turbines – ‘command’ causes
• 15 events along the studied period • A unique Weibull distribution: the failure rate’s trend is increasing (95% of confidence), so the
failure rate’s trend for ‘mechanical’ causes is necessarily decreasing
• Pareto analysis of causes:
• Main causes: ‘flow switch’ and ‘TU regulator’ • Not enough data to follow the statistical analysis
y = 1,262x - 7,8751 R² = 0,8721
-3
-2,5
-2
-1,5
-1
-0,5
0
0,5
1
3,7 4,2 4,7 5,2 5,7 6,2 6,7
ln(ln
(1/(
1-F*
(t))))
ln(t)
y = 0,0005x0,262
0
0,0005
0,001
0,0015
0,002
0,0025
0,003
0 100 200 300 400 500 600
Lam
bda
(fai
lure
/day
)
time (day)
CAUSE Quantity % FS Flow Switch 6 40.0 PLC TU regulation 5 33.3 INSTRU Instrumentation 3 20.0 SETTING Settings 1 6.7
Total 15 100.0
0
1
2
3
4
5
6
7
Flow Switch TU regulation Instrumentation Settings
𝜆 𝑡 =1.262513
∗𝑡
513
0.262

CRITICALITY ANALYSIS FOR LHC CRYOGENIC PROCESS Determination of critical components
19 Jimmy Martin
CVs – global study • 43 events along the studied period
• Two distinguishable Weibull distributions, i.e. two distinct failure rate’s trends difficult case !
y = 0.8555x - 5.6952 R² = 0.9819
y = 3.5604x - 21.553 R² = 0.9649
-4,7
-3,7
-2,7
-1,7
-0,7
0,3
1,3
2,2 2,7 3,2 3,7 4,2 4,7 5,2 5,7 6,2 6,7
ln(ln
(1/(
1-F*
(t))))
ln(t)
0
0,005
0,01
0,015
0,02
0,025
0,03
0,035
0,04
0 100 200 300 400 500 600 700
Lam
bda
(fai
lure
/day
)
time (day)
• Good fitting between theoretical and observed reliability probabilities (cf. K-Smirnov test) • 95% of confidence in the Weibull distribution’s hypothesis
• Use of bi-WEIBULL distribution, expressed by :
𝑅 𝑡 = �𝑒−(𝛼𝑡)𝜃 , 𝑡 < T
𝑒−[ 𝛼𝑡 𝜃+ 𝑡−𝛾𝜂
𝛽] , 𝑡 ≥ T
𝜆 𝑡 = �𝛼𝛼 ∗ (𝛼𝑡)𝜃−1, 𝑡 < T
𝛼𝛼 ∗ 𝛼𝑡 𝜃−1 + 𝛽𝜂
∗𝑡 − 𝛾𝜂
𝛽−1
, 𝑡 ≥ T
𝝀 𝒕 = �𝟎.𝟎𝟎𝟏𝟏 ∗ 𝟎.𝟎𝟎𝟏𝟎 ∗ 𝒕 −𝟎.𝟏𝟏𝟏, 𝒕 < 𝟎𝟑𝟑 𝒅𝒂𝒚𝒅
𝟎.𝟎𝟎𝟏𝟏 ∗ 𝟎.𝟎𝟎𝟏𝟎 ∗ 𝒕 −𝟎.𝟏𝟏𝟏 + 𝟗.𝟎𝟎𝟑𝟑𝟑𝟎𝟑
∗𝒕
𝟑𝟎𝟑
𝟖.𝟎𝟎𝟑𝟑, 𝒕 ≥ 𝟎𝟑𝟑 𝒅𝒂𝒚𝒅
For the complete mathematical method see technical note LHC-CRYO-OP-A-110

CRITICALITY ANALYSIS FOR LHC CRYOGENIC PROCESS Determination of critical components
20 Jimmy Martin
CVs – global study
• Pareto analysis of causes:
CAUSE N %
Command 21 48.8
Mechanical 11 25.6
Unknown 5 11.6
Utilities 5 11.6
Environment 1 2.3
Total 43 100 0
5
10
15
20
25
Command Mechanical Unknown Utilities Environment
Global Pareto histogram for CVs
• Two failure modes are dominant: ‘command’ and ‘mechanical’ causes both represent around 75% of the overall
CRITICALITY ANALYSIS FOR LHC CRYOGENIC PROCESS Determination of critical components
21 Jimmy Martin
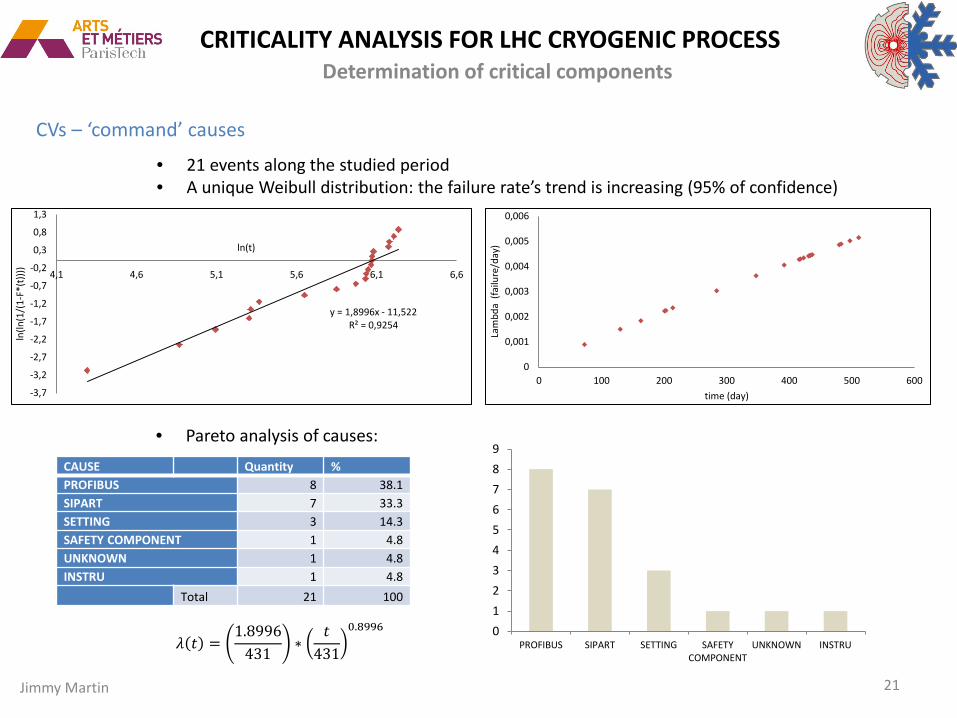
CVs – ‘command’ causes • 21 events along the studied period
• A unique Weibull distribution: the failure rate’s trend is increasing (95% of confidence)
0
0,001
0,002
0,003
0,004
0,005
0,006
0 100 200 300 400 500 600
Lam
bda
(fai
lure
/day
)
time (day)
y = 1,8996x - 11,522 R² = 0,9254
-3,7
-3,2
-2,7
-2,2
-1,7
-1,2
-0,7
-0,2
0,3
0,8
1,3
4,1 4,6 5,1 5,6 6,1 6,6
ln(ln
(1/(
1-F*
(t))))
ln(t)
• Pareto analysis of causes: CAUSE Quantity %
PROFIBUS 8 38.1 SIPART 7 33.3 SETTING 3 14.3 SAFETY COMPONENT 1 4.8 UNKNOWN 1 4.8 INSTRU 1 4.8
Total 21 100
0123456789
PROFIBUS SIPART SETTING SAFETYCOMPONENT
UNKNOWN INSTRU𝜆 𝑡 =1.8996
431∗
𝑡431
0.8996

CRITICALITY ANALYSIS FOR LHC CRYOGENIC PROCESS Determination of critical components
22 Jimmy Martin
CVs – ‘mechanical’ causes • 11 events along the studied period
• A unique Weibull distribution: the failure rate’s trend is decreasing
• Good fitting between theoretical and observed failure probabilities • 95% of confidence in the Weibull distribution’s hypothesis
y = 0,6494x - 3,7642 R² = 0,968
-2,7
-2,2
-1,7
-1,2
-0,7
-0,2
0,3
0,8
1,3
2,2 2,7 3,2 3,7 4,2 4,7 5,2 5,7 6,2 6,7
ln(ln
(1/(
1-F*
(t))))
ln(t)
y = 0,0151x-0,351
0
0,001
0,002
0,003
0,004
0,005
0,006
0,007
0,008
0 100 200 300 400 500 600
Lam
bda
(fai
lure
/day
)
time (day)
𝜆 𝑡 =0.6494
329∗
𝑡329
−0.3506
CRITICALITY ANALYSIS FOR LHC CRYOGENIC PROCESS Determination of critical components
23 Jimmy Martin
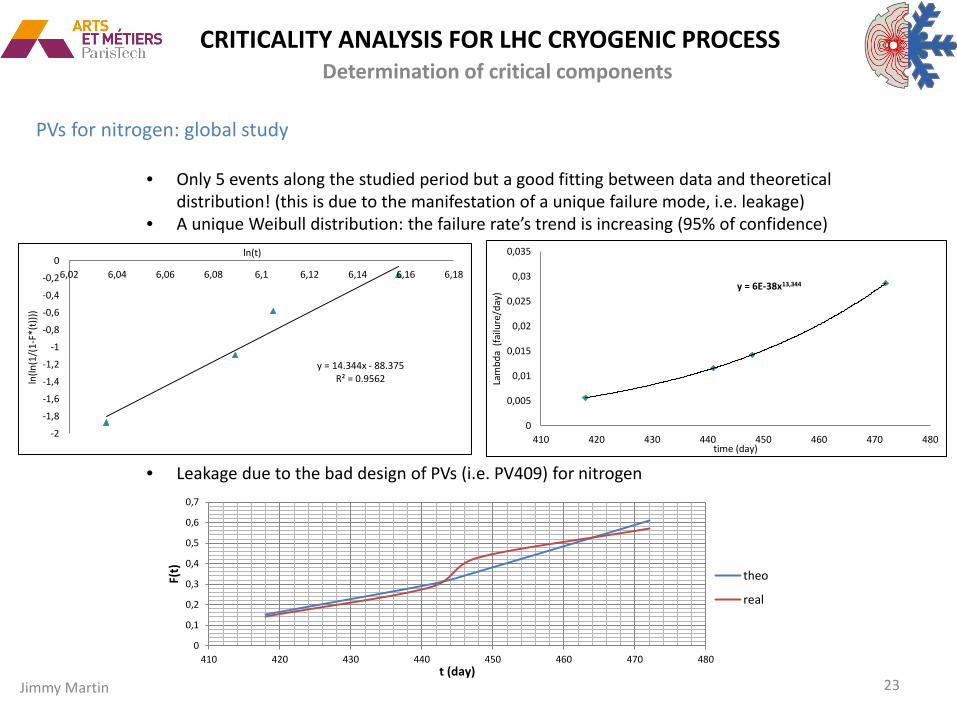
PVs for nitrogen: global study
• Only 5 events along the studied period but a good fitting between data and theoretical distribution! (this is due to the manifestation of a unique failure mode, i.e. leakage)
• A unique Weibull distribution: the failure rate’s trend is increasing (95% of confidence)
• Leakage due to the bad design of PVs (i.e. PV409) for nitrogen
y = 14.344x - 88.375 R² = 0.9562
-2
-1,8
-1,6
-1,4
-1,2
-1
-0,8
-0,6
-0,4
-0,2
06,02 6,04 6,06 6,08 6,1 6,12 6,14 6,16 6,18
ln(ln
(1/(
1-F*
(t))))
ln(t)
y = 6E-38x13,344
0
0,005
0,01
0,015
0,02
0,025
0,03
0,035
410 420 430 440 450 460 470 480
Lam
bda
(fai
lure
/day
)
time (day)
0
0,1
0,2
0,3
0,4
0,5
0,6
0,7
410 420 430 440 450 460 470 480
F(t)
t (day)
theo
real

CRITICALITY ANALYSIS FOR LHC CRYOGENIC PROCESS Determination of critical components
24 Jimmy Martin
Electric heaters (from tunnel) – global study
• 8 events along the studied period, cumulated from February 2012 • A unique Weibull distribution: the failure rate’s trend is increasing (95% of confidence)
• Pareto analysis of causes:
y = 8,9778x - 55,668 R² = 0,8372
-2,5
-2
-1,5
-1
-0,5
0
0,5
1
6 6,05 6,1 6,15 6,2 6,25 6,3 6,35
ln(ln
(1/(
1-F*
(t))))
ln(t)
0
0,005
0,01
0,015
0,02
0,025
0,03
0,035
0,04
400 420 440 460 480 500 520 540 560
Lam
bda
(fai
lure
/day
)
time (day)
0
1
2
3
4
5
6
7
0
0,1
0,2
0,3
0,4
0,5
0,6
0,7
0,8
0,9
1
400 420 440 460 480 500 520 540 560
F(t)
t (day)
theo
real

CRITICALITY ANALYSIS FOR LHC CRYOGENIC PROCESS Determination of critical components
25 Jimmy Martin
Criticality ranking – index of occurrence • Built by considering the overall number of events and the failure rate’s trend related to a studied
population:
Population type
λ’s trend
N of events
MTBF (day)
Index O
Cold compressors – general
β = 2.68
↗ ++
25
327
1
Cold compressors –
regulator
β = 2.76
↗ ++
11
362
1
Warm compressors –
general
β = 0.89
↘
26
325
0.5
Warm compressors –
without leakage
β = 0.82
↘
21
336
0.5
Turbines – general
β = 1.05
→
25
407
0.75
Turbines – ‘command’
β = 1.26
↗ +
15
477
0.75
CVs – general
↗ ++
43
-
1
CVs – ‘command’
β = 1.9
↗ +
21
382
1
CVs – ‘mechanical’
β = 0.65
↘
11
450
0.25
Electric heaters
β = 8.98
↗ ++
8
467
0.75
PVs for N2
β = 14.3
↗ ++
5
457
0.75
If: • β < 1 λ’s trend = ↘ • β = 1 λ’s trend = → • 1 < β ≤ 2 λ’s trend = ↗ + • 2 < β λ’s trend = ↗ ++
Code of colours: • Green 0.25; • Yellow 0.5; • Orange 0.75; • Red 1.
0 0,2 0,4 0,6 0,8 1 1,2
CV valves - MEC
Warm Compressors (without leakage)
PV valves for N2
Turbines - command
Electric Heatears
CV valves - COM
Cold Compressors - regulator
INDEX OF OCCURENCE OF PROCESS HARDWARE COMPONENTS

CRITICALITY ANALYSIS FOR LHC CRYOGENIC PROCESS Determination of critical components
26 Jimmy Martin
Criticality ranking – Index of severity • Built by considering the overall number of losses of ‘CM’ and time before recovering these
conditions, for a studied population:
Code of colours: • Green 0.25; • Yellow 0.5; • Orange 0.75; • Red 1.
0 0,1 0,2 0,3 0,4 0,5 0,6 0,7 0,8
PV valves for N2
CV valves - MEC
Electric Heatears
CV valves - COM
Turbines - command
Warm Compressors (without leakage)
Cold Compressors - regulator
SEVERITY OF PROCESS HARDWARE COMPONENTS

CRITICALITY ANALYSIS FOR LHC CRYOGENIC PROCESS Determination of critical components
27 Jimmy Martin
Criticality ranking – index of criticality • Built by multiplying the two previous indexes of occurrence and severity:
0,0 10,0 20,0 30,0 40,0 50,0 60,0 70,0 80,0
CV valves - MEC
PV valves for N2
Electric Heatears
Warm Compressors (without leakage)
Turbines - command
CV valves - COM
Cold Compressors - regulator
GLOBAL CRITICALITY OF PROCESS HARDWARE COMPONENTS Recall :
C = O ∗ S ∗ D (With D = 1)
CRITICALITY ANALYSIS FOR LHC CRYOGENIC PROCESS Determination of critical components
28 Jimmy Martin
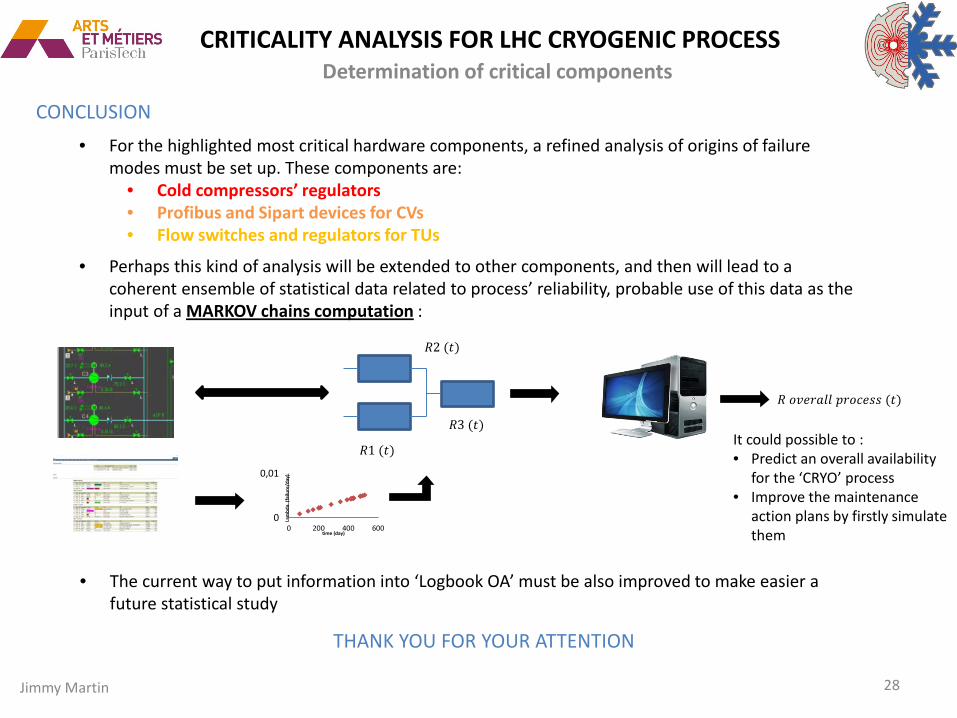
CONCLUSION • For the highlighted most critical hardware components, a refined analysis of origins of failure
modes must be set up. These components are: • Cold compressors’ regulators • Profibus and Sipart devices for CVs • Flow switches and regulators for TUs
• Perhaps this kind of analysis will be extended to other components, and then will lead to a coherent ensemble of statistical data related to process’ reliability, probable use of this data as the input of a MARKOV chains computation :
THANK YOU FOR YOUR ATTENTION
• The current way to put information into ‘Logbook OA’ must be also improved to make easier a future statistical study
𝑅1 (𝑡)
𝑅2 (𝑡)
𝑅3 (𝑡)
𝑅 𝑜𝑜𝑒𝑜𝑎𝑜𝑜 𝑝𝑜𝑜𝑝𝑒𝑖𝑖 (𝑡)
0
0,01
0 200 400 600
Lam
bda
(fai
lure
/day
)
time (day)
It could possible to : • Predict an overall availability
for the ‘CRYO’ process • Improve the maintenance
action plans by firstly simulate them