critical success factors for positive user experience in
TRANSCRIPT

Critical Success Factors for Positive User Experience in Hotel Websites: Applying
Herzberg’s Two Factor Theory for User Experience Modeling
Arunasalam Sambhanthan*
School of Computing, University of Portsmouth, UK
Alice Good
School of Computing, University of Portsmouth, UK
ABSTRACT
This research presents the development of a critical success factor matrix for increasing
positive user experience of hotel websites based upon user ratings. Firstly, a number of
critical success factors for web usability have been identified through the initial literature
review. Secondly, hotel websites were surveyed in terms of critical success factors identified
through the literature review. Thirdly, Herzberg’s motivation theory has been applied to the
user rating and the critical success factors were categorized into two areas. Finally, the
critical success factor matrix has been developed using the two main sets of data.
Keywords: User Experience, Herzberg‘s Theory, Critical Success Factors, Usability
Evaluation, e-Commerce
1. Introduction
Website usability plays a major role in building and nurturing an effective electronic
business/customer relationship. In particular, the ability to trigger a positive user experience
is a vital requirement for any e-commerce websites to reach its critical mass. There are
however documented issues with the usability of hotel websites (Sambhanthan et al, 2012;
iPerceptions Inc, 2012. & Ip, Law & Lee, 2010). The ability to trigger a positive user
experience via an e-commerce interface is critical in motivating the customer to buy tourism
products. In other words, the user‘s motivation to buy is highly dependent upon how positive
their experience is with the user interface. Consequently, developing web interfaces in a
manner which could trigger positive user experience is critical for tourism businesses.
Therefore the research questions of this study:
• What are the Critical Success Factors for Positive User Experience in Hotel
websites?
• How the Herzberg’s two factor theory could be applied for User Experience
Modeling?
Hence, this study aims to explore the critical success factors for positive user experience in
hotel websites. The study, further investigate on classifying the critical success factors
according to Herzberg’s two factor theory of motivation. The main contribution of this paper
is to provide a classification of critical success factors into two types according to the two
factor theory propounded by Herzberg.
The paper begins with the introduction and moves into the core theories. The review of
existing literature in the area is placed in the next section. The hypothesis were developed
next to that and followed by the methodology section. Then the results are presented and
followed by statistical analysis and Herzberg’s theory has been applied and the factors are

classified accordingly. Finally the implications are described and followed by the conclusions
and future research directions.
2. A Contextual Definition of Usability
Preece et al., (2002) highlights that “Ensuring that interactive products are easy to learn,
effective to use, and enjoyable from the user’s perspective” The research presented within
this paper focuses on hotel web interfaces and specifically looks at the user‘s experience
triggered by the hotels’ websites. The importance of matching usability with user experience
goals is well documented (Schneiderman & Plaisant, 2005, & Preece et al, 2002). Preece et
al.(2002) highlights six usability goals and ten user experience goals as the main parameters
of measuring usability as depicted in the figure 1.
A positive user experience is an important factor to ensure the continued usage of any
interactive system. This is particularly relevant for ecommerce sites. If the site does not
induce a positive user experience from the outset, customers are far less likely to return. Poor
Fun
Motivatin
g
Emotiona
lly
fulfilling
Satisfyin
g
Enjoyabl
e
Rewardin
g
Entertaini
ng Supportiv
e of
creativity
Helpful Aesthetical
ly pleasing
Usability
Goals
Efficient
to use
Easy to
learn
Easy to
remember
how to
Effective
to use
Safe to
use
Have
good
utility
Figure 1: Usability Goals: at Center of Interaction Design
User-experience Goals: Outer Ring of Diagram (Secondary to Usability Goals)
user experience of ecommerce sites can potentially contribute to loss of revenue. For the
purpose of this research, the degree of usability and user experience will relate to the specific
features of hotel web sites, which trigger positive user experience through ensuring the
interface is easy to learn, effective to use and enjoyable from the user’s perspective. This
research aims to specify the usability shortcomings of a study of hotel websites through the
identification of design elements which trigger positive user experience. The main focus of
this study will therefore be on user perceptions of web interface elements affecting usability
and user experience from browsing Sri Lankan hotel web sites. The results of the study can
be used to inform the design of hotel websites to ensure better usability and user experience.
The ten user experience goals depicted in the above diagram are taken forward for the
evaluation.
3. Usability Evaluation Methods
Methodologies that evaluate usability and user experience are varied and tend to be user-
centered by definition. Usability evaluation methods were developed in conjunction with the
birth of human computer interaction. The focus was traditionally upon lab-based usability
evaluation, as documented in Card et al (1983) and Carroll et al (1992). Other early methods
of usability evaluation include the thinking aloud protocol (Nielsen & Molich, 1990) and
shortly after, Nielsen’s widely used heuristics (Nielsen, 1992).
Many methods tend to be applicable to the usability evaluation of most interfaces. However
there are a few which have been designed exclusively for tourism sites.Since it commenced
around 1995, the growth in tourism marketing via the Internet, led quickly to the
development of evaluation methodologies, soon after in 1996. This led to pioneer work by
Murphy et al which sought to evaluate early web development in tourism and hospitality sites
(Murphy et al, 1996). Since then, there has been a number of evaluation frameworks
developed specifically for e-commerce websites. These include a variety of methods such as
surveys, case studies, observation studies, evaluation frameworks and customer satisfaction
studies. Lu et al (2002) classified ecommerce Website evaluation into four main areas:
application functionality evaluation; cost benefit analysis; user satisfaction assessment and
success factors identification, whereas other researchers looked at network statistics (Fletcher
et al, 2002). Later research looks at recognizing the importance of correctly defining user
requirements to ensure a good user experience and usability (Preece et Al, 2007). However,
research into tourism Website evaluation is still limited and Law et al (2010) suggest in their
paper that specific standards for tourism Website evaluation would be useful. These standards
should be interdisciplinary in their approach and essentially be human centered.
In relation to the usability evaluation of hotel sites, there has been research which emphasizes
three criteria namely: (1) user interface, (2) information quality and, (3) service quality
(Essawy, 2006). However, the above classification is very broad and shows very little
operational focus. Additionally, the focus of this research is on the evaluation of web
interface design elements, which trigger positive or negative user experience. Therefore, it is
essential to evaluate the available approaches to test the usability of hotel web interfaces
rather than just exploring the usability frameworks itself. Consequently, the following section
comparatively analyzes the usability assessment approaches available in the past literature.
Formal analysis, automated analysis, empirical analysis and heuristic analysis are the four
main methods propounded by early researchers for evaluating a user interface (Nielsen and
Molich, 1990). However, Law et al, (2010) classifies evaluation methods into five main

categories namely, counting, automated, numerical computation, user judgment, and
combined methods. Apart from other approaches, heuristic analysis and user centered
evaluation tend to be the two dominating methods used by researchers. Both these methods
have different contextual significance as one include users in the evaluation while the other
one relies upon domain experts. There is however an increasing trend among researchers to
adapt innovative approaches for interface evaluation through the combination or modification
of above approaches.
3.1. Heuristic Evaluation
Heuristic is a well-developed approach to both inform and evaluate the usability of an
interface. A number of domain experts will be asked to develop criterion of design aspects
which are hazardous to the usability performance of interface. The interface is then analyzed
based on the heuristics and the shortcomings are then identified. In most cases, heuristics
tests are being done collectively to increase the efficiency of evaluation. A plethora of
research has been reported on the ways and means of heuristic evaluation (Thovtrup and
Nielsen, 1991), (Nielsen, 1992), (Dzida, 1996) (Allen et al, 2006), (Paddison and Englefield,
2004). In addition, different scholars have developed specific heuristics and different
reporting Medias relevant to certain contexts, however, Hvannberg et al. (2007), reports there
are no significant difference between different heuristics and reporting Medias in terms of
effectiveness, efficiency and inter-evaluator reliability.
Another version of the heuristic method uses an adapted approach named as ‘modified
heuristic approach’ covering both domain experts and users in the evaluation (Yeung and
Law, 2006). This approach allows more flexible evaluation using not only a sample of
domain experts but also potential end users. Whilst this emulates a user centered approach,
the method would obviously be more time consuming and costly, than the traditional
heuristic approach, due to the incorporation of empirical evaluation. Also, the heuristics
given to both types of evaluators (experts & users) should be the same to ensure the
effectiveness of validation protocol.
3.2. Heuristic and User Testing: A Complementary Approach
More recently the research has seen the development of a framework for the evaluation of
web site usability, which combines both heuristic evaluation and analytic hierarchy process
(Delice and Gungor, 2009). This study approaches usability issues in two different aspects.
Firstly, the exact usability problem is identified through a heuristic evaluation and then the
severity listing of the same is carried out by means of circulating a questionnaire among
evaluators, just after the heuristic evaluation occurs. This approach however does not directly
include the users in the evaluation. It could be argued that the absence of direct user input
could pose challenges in assessing the user experience. Particularly given that it is well
documented that the inclusion of users within the design process does contribute to web
usability (Preece et al., 2007, Verdenburg et al., 2002 & Good, 2011). Inspection methods,
however, such as heuristic evaluation or cognitive walkthrough have been proposed within
the User Centered Design paradigm. They are User- Centered because they focus on an
evaluation for the user. The user is not necessarily directly involved, but evaluators must have
knowledge of the user profile and evaluate what they consider to be relevant to users (not
themselves). Furthermore, Nielsen argues that even users, with a minimum training, could
apply the method. It is also important to consider user centered design as this is essential for
search engine optimization of the sites as well (Spink, 2002). User testing could then be the

effective method for an existing website while, heuristic would address the new website (Tan
et al, 2009). Early stages in website design needs expertise recommendations on what is
possible – hence heuristics to inform design. Built websites require evaluation based on user
perception of what is required for any improvements – hence user testing. It could then be
concluded that both of the aforementioned methods are complementary, instead of competing
(Tan et al, 2009).
4. Herzberg’s Two Factor Theory
Zang et al. (2000) argues that the presence of hygiene factors would provide the basic
functionality of a website, while their absence would create user dissatisfaction. The concept
of hygiene factors originates from Herzberg's motivation/hygiene theory, also known as the
two factor theory (Herzberg, 1968).Motivating factors are those that contribute to user
satisfaction. The study conducted by Zang et al (2000) established 44 core features in the web
environment classified into 12 categories by subjects. The preliminary results show that 4
categories and 14 features were judged to be primarily motivational, while 3 categories and
13 features were perceived to be primarily hygiene in nature. The remaining 5 categories and
17 features were perceived to be both motivational and hygiene in nature. According to Zang
and Darn (2000), the motivators and hygiene factors are subject to change according to the
context as well as time. It should be noted that the above study had been conducted based on
CNN.com, therefore a news media site. However, applying the above thinking to hotel
domain is an open area for exploration. The Herzberg’s two factor theory could be
successfully applied to classify the criticality of factors affecting user experience in a hotel
website. In particular, the competing factors of a hotel website could effectively be classified
into two categories by adapting the above approach.
5. Critical Success Factors for Web Usability
An early definition for Critical Success Factors (CSF) suggests that there are a few key
areas of activity in which favorable results are absolutely necessary for a particular
manager to reach his goals (Bullen and Rockart, 1981). In the context of this research, CSF
means the factors which determine user’s experience when interacting with the web
interfaces of hotels. Furthermore, the positive user experience is key for user motivation to
buy. In other words, the user experience directly influences the purchase decision of the user.
Hence, CSF in this research is the factors which determine positive user experience at the
web interface of hotels. This research specifically focuses on developing a CSF metric based
on Herzberg’s two factor theory of motivation. The paper will later highlight how specific
factors identified from the literature are hypothesized to check their impact on triggering
positive user experience.
5.1. Click Stream Paradox and Security
(Nielsen, 2008) argues that the sites which take more than five clicks to reach any specific
information are not usable. Furthermore, Essawy (2006) contextualized the common web
usability concepts to hotel industry, arguing sites take more than three clicks to reach the
desired information will be discarded by the consumers. It can however be contradictory to
balance the number of clicks with the degree of security in authentication points. In fact,
much information needs to be verified in different levels to ensure proper authentication.
Eventually, the number of gateways passed in making a reservation will intrinsically build a
confident and secure perception in the consumer psyche. It is a given that spending more time

on browsing basic information will frustrate users and increase the likelihood of users
switching to another site. Therefore, the basic information should be presented adhering to
the specifications of Essawy, (2006) but not the reservation portals. It is also documented that
a usage-oriented hierarchy or a combined hierarchy is a navigation structure associated with
significantly higher usability than subject-oriented hierarchies (Fang and Holsapple, 2007).
Therefore, the number of clicks taken to reach a specific set of basic information is a critical
success factor. In addition to this, the secure perception is another critical success factor,
which could be influenced by the number of clicks taken to make actual purchase with credit
cards.
5.2. Value and Information Accuracy
Prior research states that the web content should be regularly updated, informative and
personalized in a manner, which could directly influence the customer perceived image of
destinations to create a positive virtual experience (Kozak et al, 2005 and Doolin et al, 2002).
However, the updated information should be valuable to the user to make purchase decisions.
Sites with irrelevant information or over informative sites could trigger negative user
experience. In addition to this, information accuracy plays a vital role in ensuring usability of
sites. Potentially, inaccurate information could mislead customers and lead to issues such as
incorrect navigation or incorrect product selection. The accuracy of information might
contradict with value in some instances where the information needs to be presented as an
invitation to treat in the marketing perspective. This contradiction needs to be resolved in
ensuring positive user experience in website interfaces. Therefore, value and information
accuracy are another two CSF in ensuring positive user experience in tourism websites.
5.3. Interactivity and Loading Speed
Doolin et al (2002) claims interactivity of a website as the major contributor towards the
quality of service itself. In broader terms, interactivity could however mean both the
interactivity of the interface as well as the interactive communication between the hotel and
the user through the interface. In this research, interactivity is interpreted as the interactivity
of interface. Interactivity plays a major role in building up user experience. Less interactive
sites may create unpleasant browsing experiences to users. However, consideration to loading
speed should be coupled with interactivity to achieve the optimum outcome. A website built
with multimedia features and interactive chat facilities, but lacking to have proper loading
speed will undoubtedly frustrates the user. Site interactivity is then proposed as the next CSF
for ensuring positive user experience.
5.4. Purchase Influence and Recommend-ability
Consumer ratings on the site’s purchase influencing ability could be utilized to measure
whether the interface has achieved its ultimate aim. Hence, the ultimate aim of web interfaces
on hotels is to influence the purchase decision of browsers through improving the ease of use
ability. Therefore, the ratings on sites’ purchase influencing ability could be utilized as an
overall assessment for the achievement of ultimate goal of site through user centered design.
Yaobin (2007) in fact reports a correlation between the purchase intention and perceived ease
of use of commercial websites. Purchase influencing ability could therefore be considered as
another CSF.

5.5. Control Variables
Interestingly, Iliachenko (2006) uses, ‘recommend a friend’, and ‘revisit intention’ rating as
control variables to measure the electronic service quality of tourism sites. Evidently then, the
above two ratings could clearly reflect the overall consumer perception on the site. A
customer will likely not revisit a site which has not provided a good user experience..
Similarly, a customer will likely not recommend the site to anyone unless they genuinely feel
a positive experience when browsing the site. Therefore, both these ratings could be used as
control variables for this study. However, the revisit intention could not be expected from the
sample of this study consists of non-tourist audience while ‘recommends a friend’ rating
could be considered as the browser could recommend the business to others.
6. Critical Success Factors
Critical Success Factor Description
Click Stream Paradox The number of clicks taken for reaching a desired web
location
Security The degree of security involved in authentication points
Value The value of information provided in the websites
Information Accuracy The accuracy of information presented in the websites
Interactivity The interactivity of the web interfaces
Loading Speed The loading speed of the web sites
Purchase Influence The ability of the websites to influence purchase decision
Recommend-ability
The ability of websites to trigger the user's
recommendation of business to others
Table 1: List of Critical Success Factors
As a result of the above literature findings a pilot version of the CSF matrix has been
developed reflecting the CSF elements discussed in the literature review. The factors are
classified into two categories as critical success factors and control variables. The matrix will
be tested using a survey to develop an improved version of this matrix which will apply
Herzberg’s two factor theory to classify the factors depicted in blue ink.
Factors (To be categorized)
Critical Success
Factors
Click Stream Security
Value Information Accuracy
Interactivity Loading Speed
Control Variables Purchase Influence (To be rated)
Recommend-ability (To be rated)
Figure 2: Critical Success Factor Matrix – Pilot Version

7. Hypothesis Development
The hypotheses of this research were driven by the need to re-evaluate the criticality of the
above competing factors (i.e. click stream paradox vs. security) in terms of critical success
factors and hygiene factors. The critical success factors compiled in the pilot version of the
matrix are synonymous with each other. Firstly, click stream paradox have a high relevance
to security perception. One factor needs to be featured as dominating in order for it to be
categorized as motivator and other to be labeled as hygiene factor. This applies to other two
sets of factors as well. Hence, the following testable propositions were developed, which will
be addressed eventually during the course of this research.
Hypothesis 1: Click Stream Paradox has domination over secure perception in terms of
positive user experience.
Hypothesis 2: Value has domination over Information Accuracy in terms of positive user
experience.
Hypothesis 3: Interactivity has domination over loading speed in terms of positive user
experience.
Hypothesis 4: Purchase Influence has domination over Recommend-ability in terms of
positive user experience.
The above four hypothesizes were divided into ten sub hypotheses, each one of those could
be tested through separate ANOVA tests. The rationale for doing this is to test each of the
user experience types independently in terms of the effect on critical success factors. The
table presented shows the approach adapted for coding the hypothesizes. The hypothesis
codes were developed by combining each hypothesis with experience types. The same codes
are used throughout the data analysis phase. Refer to the appendix for a list of testable
questions derived from the four propositions depicted above.
Table 2: Hypothesis Matrix
8. Methodology
The aim of this study is to establish the critical success factors of hotel websites in a user
perspective. Initially a comprehensive literature review has been conducted and a set of
hypothesis were developed as the results of the literature review. The hypothesis were
formulated based on the six critical success factors developed as the result of literature
E1 E2 E3 E4 E5 E6 E7 E8 E9 E10
H1 H 1.1 H 1.2 H 1.3 H 1.4 H 1.5 H 1.6 H 1.7 H 1.8 H 1.9 H 1.10
H2 H 2.1 H 2.2 H 2.3 H 2.4 H 2.5 H 2.6 H 2.7 H 2.8 H 2.9 H 2.10
H3 H 3.1 H 3.2 H 3.3 H 3.4 H 3.5 H 3.6 H 3.7 H 3.8 H 3.9 H 3.10
H4 H 4.1 H 4.2 H 4.3 H 4.4 H 4.5 H 4.6 H 4.7 H 4.8 H 4.9 H 4.10

review. The user experiences triggered by specific web content criteria were measured via a
web survey. A user-centric approach was adopted for this study, involving real users. A web
survey was selected as the suitable method for data collection due to the fact that it could be
used to collect data from geographically dispersed users. Data gathered through the web
survey includes the web content rating and user experience ratings of users. The web content
rating was collected to measure the effectiveness of web content in ensuring usability of the
site. The user experience ratings were collected to measure the kind of experience triggered
by specific web content criteria.
8.1. Research Instrument
The instrument for this research is a web based survey. The survey consists of three main
sections. The first section was designed to track the participant profile. The second section
focused on the user ratings of web content. The third section focused on user experience
ratings.
Likert questions were designed in a five point scale from strongly agree to strongly disagree
with a neutral scale falling on three, for tracing the user ratings on web content. The designed
questionnaire was piloted with a student, IT professional, housewife, senior citizen, lecturer,
statistician and a usability scholar of the university to ensure its usability for users with varied
IT literacy backgrounds, analytical feasibility of the questions and its interface usability.
Improvements were made according to the comments given by the above. A website was
created to educate the respondents about the survey. The site was specifically designed to
receive the informed consent of participants for the questionnaire study.
One hundred and forty three participants took part in this survey. While there may be some
criticism of selecting a sample of generic users instead of tourists, it is defendable in this
instance. The purpose of study is to measure the user experience triggered by the sites. User
experience of a site is largely depending on design aspects but not on whether the user is a
tourist or non-tourist. In fact, the usability of a site would be same for a tourist and non tourist
user. However, the sample includes 10 users having membership in virtual tour communities.
This is to ensure the sample includes a number of users having considerable interest on
tourism. The geographical area of the study included Australia, Canada, Ghana, India,
Malaysia, Nepal, Norway, Saudi Arabia, Seychelles, Sri Lanka, Sweden, UAE, UK and USA.
(Refer figure 3). The participant profile is presented in the table 2.

Figure 3: Country wise Respondent Profiles
Measure Value Frequency Percentage
Country of
Residence
Sri Lanka 46 35.38%
Foreign Country 84 81.55%
Type of connection
Dial Up 3 2.80%
ADSL 49 45.79%
Broad band 54 50.47%
Any other 1 0.93%
Average time spent
on Browsing
< 30 minutes 7 6.67%
30 minutes – 1hr 18 17.14%
1 hr - 2 hr 30 28.57%
2 hr - 3 hr 21 20.00%
> 3 hr 29 27.62%
Number of Search
Results checking
Up to 10 60 57.69%
Up to 20 26 25.00%
Up to 30 9 8.65%
Up to 40 5 4.81%
Up to 50 4 3.85%
Search Concern Time to load 14 13.46%
Australia , 26
Canada, 5
Ghana, 1
India, 2
Malaysia, 2Nepal,
1Norway, 3
Saudi
Arabia, 1Seychelles,
1
Sri Lanka, 46
Swden, 1
UAE, 3
UK, 10
USA, 1
Not Specified, 27
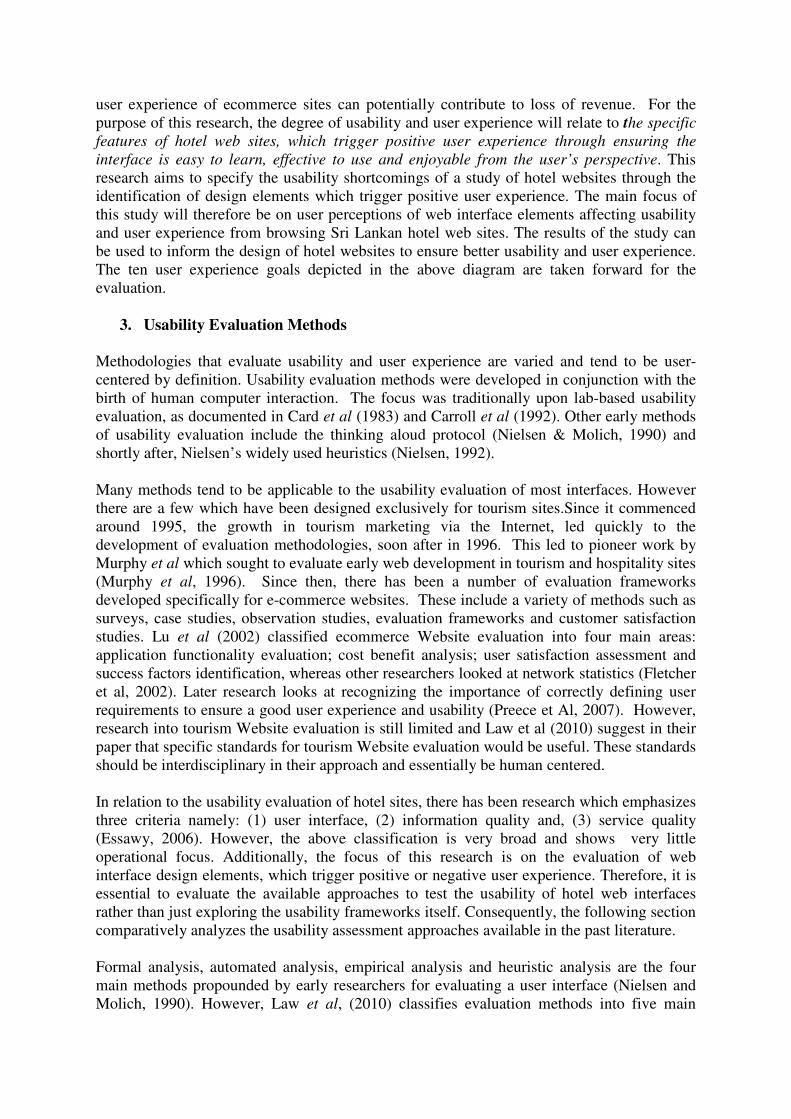
Innovative Design 5 4.81%
Reliable
Information 68 65.38%
Virtual Experience 5 4.81%
Any other 12 11.54%
Virtual
Community
Membership
Member 11 10.48%
Non Member 94 89.52%
Special Needs Yes 17 16.35%
No 87 83.65%
Special Needs type Visual 6 35.29%
Auditory 1 5.88%
Mobility 5 29.41%
Cognitive 3 17.65%
Any other 2 11.76%
Table 3: Survey Participant Characteristics
8.2 Selection of Samples
The list of Sri Lankan hotels was obtained from the Sri Lanka Tourist Board (SLTB) and
western region hotels were abstracted from the list. A Google search was done for all hotels
and the hotels holding an e-commerce site were short listed from the abstracted list. The
number of questionnaires to be promoted was processed as 120. In fact the maximum number
of dependent variables was determined as 4. Altogether 80 responses were estimated deciding
20 responses per variable. To reach 80 responses it was decided to gather 120 considering 40
unusable questionnaires. Also, 10 user samples were planned to represent the tourist
community. Considering the above outcome the survey was planned for one full week. Links
of all 5 hotel sites were given to the respondents and they were asked to select one site to
record their browsing experience.
8.3. Two Factor Theory Applications
The CSF was tested using ANOVA and the list of CSF was separated into two categories by
applying Herzberg’s two factor theory. The categories are classified into two as motivators
and hygiene factors. Herzberg’s theory of motivation has been applied at this point for the
classification of factors. The factors were classified based on the p values derived in the
ANOVA test. The influence of one factor over the other one has been determined based on
looking at whether the p value is > 0.5 or < 0.5. The hypothesis classification has been
structured into two categories based on the aforementioned classification.

9. Results
The descriptive statistics derived from the data is presented in the appendix. The statistical
mean and median values have been derived from the data and presented in tables 3, 4, 5 and
6. The descriptive statistics of positively influenced users, (depicted in tables 3 and 4) shows
that almost all of the mean values are above average [3.00]. Although the same pattern is
observed with negatively influenced users (depicted in tables 5 and 6), there are some
exceptions observed in security, purchase influence and recommend-ability.
Almost all medians are on average for purchase influence rating. Majority of the means
values, except emotional fulfillment and fun show below average. Therefore, the sites’ ability
to influence the purchase decision is identified as poor. All medians show average value for
security rating. But, all experience categories except emotional fulfillment, fun and
entertainment, shows a below average mean value. This shows a negative user perception on
security, regardless of the above average ratings for three web content criteria. In fact, it is
generalized as there is a significant correlation between users’ security perception and user
experience. Results depicts, users with negative experience have rated negatively for
‘Recommend’ criteria as well. Although the median values of the above criteria shows an
average rating, the mean value records for a poor rating by the negatively experienced users.
Therefore, the recommend-ability of the site has been scrutinized as a shortcoming which
triggers negative user experience.
User Experience Value Accuracy Interactivity
Loading
Speed
Mea
n
Media
n
Mea
n
Media
n
Mea
n
Media
n
Mea
n
Media
n
Satisfaction 3.67 4.00 3.46 3.00 3.48 4.00 3.21 3.00
Enjoy 3.69 4.00 3.48 3.00 3.49 4.00 3.25 3.00
Fun 3.66 4.00 3.47 3.00 3.50 4.00 3.27 3.00
Entertainment 3.68 4.00 3.48 3.00 3.51 4.00 3.29 3.00
Independence 3.66 4.00 3.44 3.00 3.47 4.00 3.18 3.00
Motivation 3.67 4.00 3.46 3.00 3.48 4.00 3.21 3.00
Aesthetically Pleasing 3.68 4.00 3.48 3.00 3.51 4.00 3.29 3.00
Rewarding 3.68 4.00 3.48 3.00 3.51 4.00 3.29 3.00
Emotionally Fulfilling 3.69 4.00 3.47 3.00 3.50 4.00 3.31 3.00
Revisit 1.95 4.00 3.48 3.00 3.49 4.00 3.25 3.00
Table 4: Web Content Ratings of Users with Positive Experience
User Experience
Click Stream Security Purchase In. Recommend
Mea
n
Media
n
Mea
n
Media
n
Mea
n
Media
n
Mea
n
Media
n
Satisfaction 3.19 3.00 3.12 3.00 3.06 3.00 3.19 3.00
Enjoy 3.23 3.00 3.15 3.00 3.09 3.00 3.22 3.00
Fun 3.26 3.00 3.16 3.00 3.11 3.00 3.24 3.00
Entertainment 3.27 3.00 3.19 3.00 3.38 3.00 3.25 3.00
Independence 3.18 3.00 3.09 3.00 3.04 3.00 3.18 3.00

Motivation 3.19 3.00 3.12 3.00 3.06 3.00 3.19 3.00
Aesthetically Pleasing 3.27 3.00 3.19 3.00 3.13 3.00 3.25 3.00
Rewarding 3.27 3.00 3.19 3.00 3.13 3.00 3.25 3.00
Emotionally Fulfilling 3.27 3.00 3.21 3.00 3.15 3.00 3.26 3.00
Revisit 3.23 3.00 3.15 3.00 3.08 3.00 3.22 3.00
Table 5: Web Content Ratings of Users with Positive Experience
User Experience Value Accuracy Interactivity Loading Speed
Mean Median Mean Median Mean Median Mean Median
Satisfaction 3.54 3.00 3.30 3.00 3.31 3.00 3.00 3.00
Enjoy 3.55 3.00 3.33 3.00 3.35 3.00 3.03 3.00
Fun 3.64 4.00 3.42 3.00 3.45 4.00 3.17 3.00
Entertainment 3.61 4.00 3.40 3.00 3.43 3.00 3.13 3.00
Independence 3.53 3.00 3.29 3.00 3.33 3.00 2.98 3.00
Motivation 3.56 4.00 3.33 3.00 3.36 3.00 3.05 3.00
Aesthetically Pleasing 3.58 4.00 3.37 3.00 3.40 3.00 3.11 3.00
Rewarding 3.55 3.50 3.33 3.00 3.35 3.00 3.03 3.00
Emotionally Fulfilling 3.62 4.00 3.41 3.00 3.44 3.50 3.16 3.00
Revisit 3.58 4.00 3.37 3.00 3.40 3.00 3.11 3.00
Table 6: Web Content Ratings of Users with Negative Experience
User Experience Click Stream Security Purchase In. Recommend
Mean Median Mean Median Mean Median Mean Median
Satisfaction 3.02 3.00 2.83 3.00 2.74 3.00 2.98 3.00
Enjoy 3.02 3.00 2.90 3.00 2.87 3.00 3.05 3.00
Fun 3.16 3.00 3.06 3.00 3.01 3.00 3.17 3.00
Entertainment 3.12 3.00 3.01 3.00 2.99 3.00 3.15 3.00
Independence 3.02 3.00 2.84 3.00 2.76 3.00 2.98 3.00
Motivation 3.03 3.00 2.92 3.00 2.89 3.00 3.05 3.00
Aesthetically
Pleasing 3.09 3.00 2.98 3.00 2.88 3.00 3.11 3.00
Rewarding 3.02 3.00 2.90 3.00 2.87 3.00 3.05 3.00
Emotionally
Fulfilling 3.15 3.00 3.03 3.00 3.00 3.00 3.16 3.00
Revisit 3.09 3.00 2.98 3.00 2.95 3.00 2.95 3.00
Table 7: Web Content Ratings of Users with Negative Experience
10. Data Analysis
The results obtained through web survey were subjected to statistical analysis. The statistical
ANOVA has been conducted for each sub hypothesis and presented. The p values of each sub
hypothesis are presented in the below table. The p values for each hypothesis are presented in
separate graphs and followed by discussion.

10.1. Statistical Analysis of Hypothesis 1
Hypothesis Source of
Variation
Sum of
Squares d.f.
Mean
Squares F
p
value
between 0.2273 1 0.2273
H 1.1 error 45.96 108 0.4256 0.534 0.47
total 46.19 109
between 0.1481 1 0.1481
H 1.2 error 40.52 106 0.3823 0.3876 0.53
total 40.67 107
between 0.3571 1 0.3571
H 1.3 error 25.43 68 0.3739 0.9551 0.33
total 25.79 69
between 0.2051 1 0.2051
H 1.4 error 30.67 76 0.4035 0.5084 0.48
total 30.87 77
between 0.4455 1 0.4455
H 1.5 error 47.75 108 0.4421 1.008 0.32
total 48.19 109
between 0.1071 1 0.1071
H 1.6 error 34.6 82 0.4219 0.254 0.62
total 34.7 83
between 0.1023 1 0.1023
H 1.7 error 32.89 86 0.3824 0.2674 0.61
total 32.99 87
between 0 1 0
H 1.8 error 31.95 82 0.3897 0 1
total 31.95 83
between 0 1 0
H 1.9 error 20.29 68 0.2983 0 1
total 20.29 69
between 0 1 0
H 1.10 error 31.85 76 0.419 0 1
total 31.85 77
Table 8: Statistical Analysis of Hypothesis 1
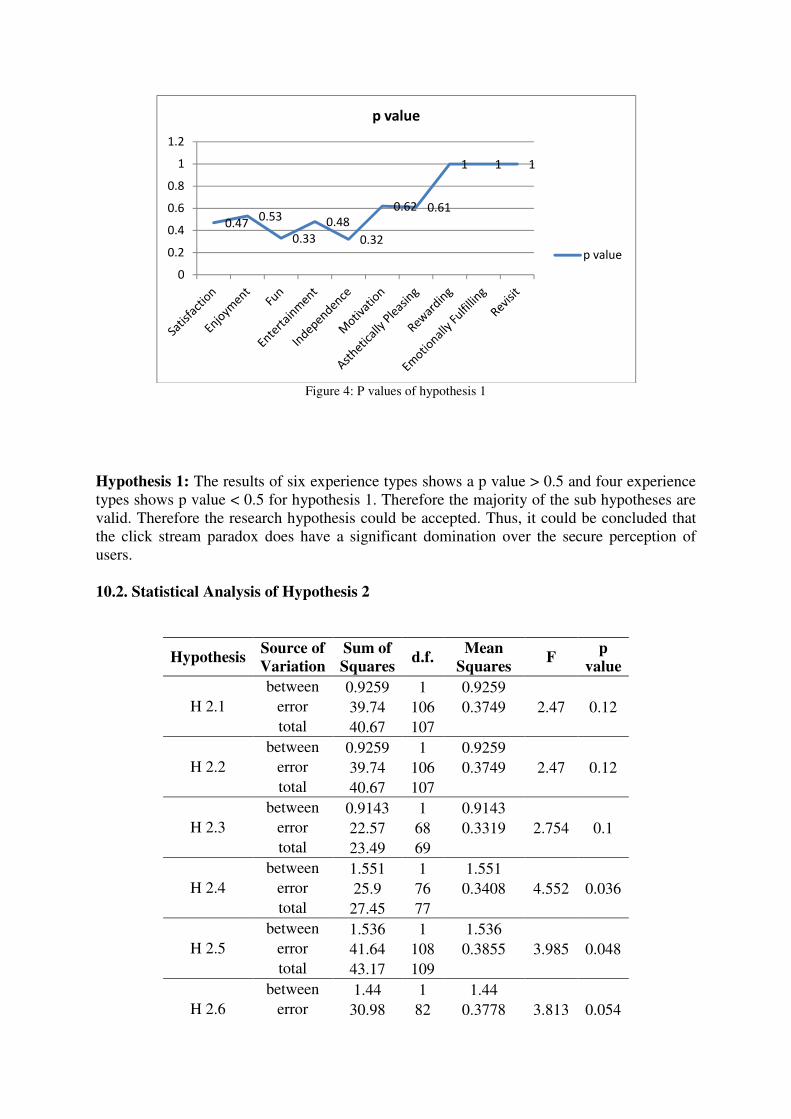
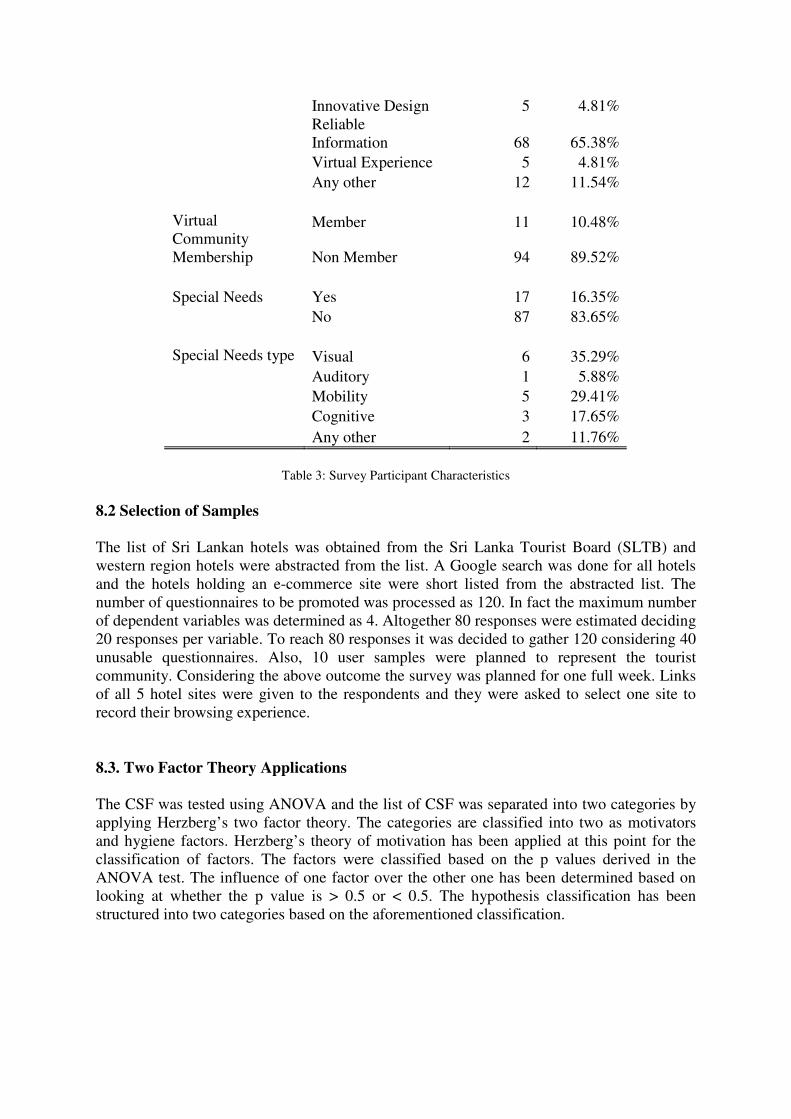
Figure 4: P values of hypothesis 1
Hypothesis 1: The results of six experience types shows a p value > 0.5 and four experience
types shows p value < 0.5 for hypothesis 1. Therefore the majority of the sub hypotheses are
valid. Therefore the research hypothesis could be accepted. Thus, it could be concluded that
the click stream paradox does have a significant domination over the secure perception of
users.
10.2. Statistical Analysis of Hypothesis 2
Hypothesis Source of
Variation
Sum of
Squares d.f.
Mean
Squares F
p
value
between 0.9259 1 0.9259
H 2.1 error 39.74 106 0.3749 2.47 0.12
total 40.67 107
between 0.9259 1 0.9259
H 2.2 error 39.74 106 0.3749 2.47 0.12
total 40.67 107
between 0.9143 1 0.9143
H 2.3 error 22.57 68 0.3319 2.754 0.1
total 23.49 69
between 1.551 1 1.551
H 2.4 error 25.9 76 0.3408 4.552 0.036
total 27.45 77
between 1.536 1 1.536
H 2.5 error 41.64 108 0.3855 3.985 0.048
total 43.17 109
between 1.44 1 1.44
H 2.6 error 30.98 82 0.3778 3.813 0.054
0.470.53
0.33
0.48
0.32
0.62 0.61
1 1 1
0
0.2
0.4
0.6
0.8
1
1.2
p value
p value

total 32.42 83
between 1.136 1 1.136
H 2.7 error 33.73 86 0.3922 2.898 0.092
total 34.86 87
between 0.9643 1 0.9643
H 2.8 error 30.6 82 0.3731 2.584 0.11
total 31.56 83
between 1.429 1 1.429
H 2.9 error 23.71 68 0.3487 4.096 0.047
total 25.14 69
between 0.8205 1 0.8205
H 2.10 error 29.64 76 0.39 2.104 0.15
total 77
Table 9: Statistical Analysis of Hypothesis 2
Figure 5: P values of hypothesis 2
Hypothesis 2: The results of all ten experience types show a p value <0.5 for hypothesis 2.
Overall, this means that the probability of research hypothesis is not valid and the research
hypothesis cannot be accepted. Thus, it could be concluded that value does not have a
significant domination over the information accuracy.
10.3. Statistical Analysis of Hypothesis 3
Hypothesis Source of
Variation
Sum of
Squares d.f.
Mean
Squares F
p
value
between 1.12 1 1.12
0.12 0.12
0.1
0.0360.048
0.054
0.092
0.11
0.047 0.048
0
0.02
0.04
0.06
0.08
0.1
0.12
0.14
p value
p value

H 3.1 error 60.31 106 0.569 1.969 0.16
total 61.44 107
between 1.565 1 1.565
H 3.2 error 55.87 106 0.5271 2.969 0.088
total 57.44 107
between 1.729 1 1.729
H 3.3 error 34.86 68 0.5126 3.372 0.071
total 36.59 69
between 1.282 1 1.282
H 3.4 error 42.1 76 0.554 2.314 0.13
total 43.38 77
between 1.536 1 1.536
H 3.5 error 67.64 108 0.6263 2.453 0.12
total 69.17 109
between 3.44 1 3.44
H 3.6 error 43.26 82 0.5276 6.521 0.013
total 46.7 83
between 2.557 1 2.557
H 3.7 error 41.16 86 0.4786 5.342 0.023
total 43.72 87
between 1.44 1 1.44
H 3.8 error 37.45 82 0.4567 3.154 0.079
total 38.89 83
between 0.9143 1 0.9143
H 3.9 error 30.23 68 0.4445 2.057 0.16
total 31.14 69
between 2.885 1 2.885
H 3.10 error 40.41 76 0.5317 5.425 0.023
total 43.29 77
Table 10: Statistical Analysis of Hypothesis 3
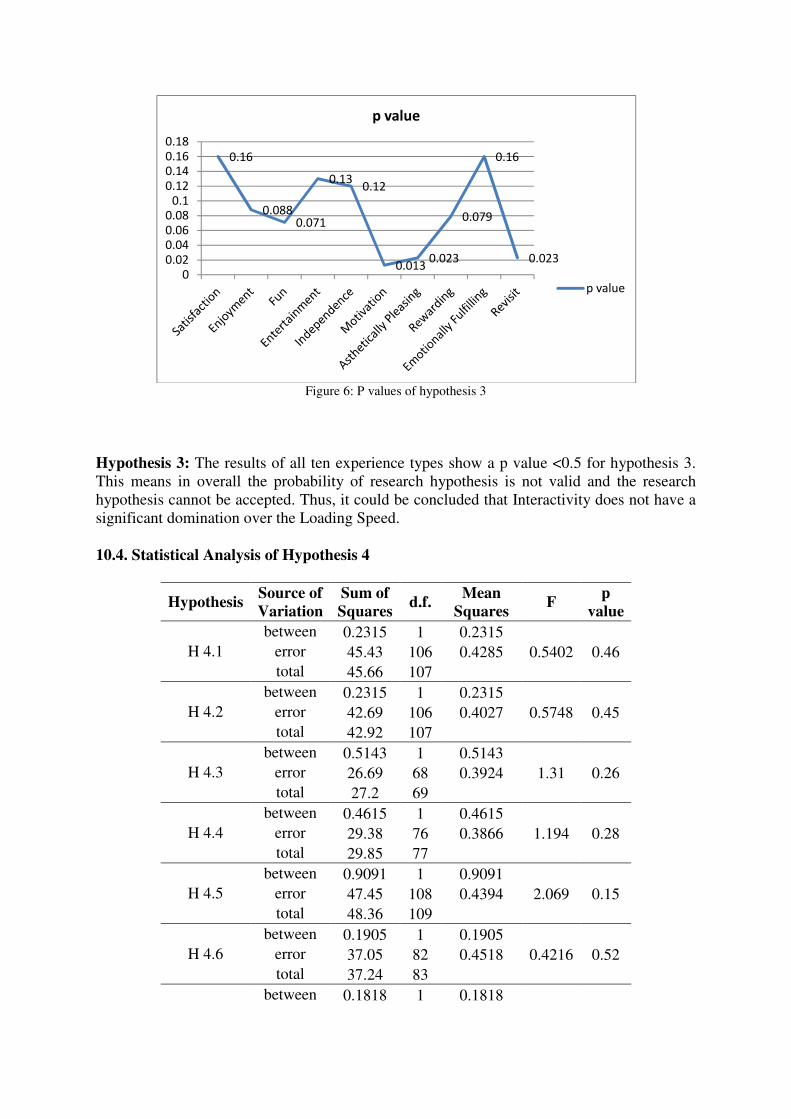
Figure 6: P values of hypothesis 3
Hypothesis 3: The results of all ten experience types show a p value <0.5 for hypothesis 3.
This means in overall the probability of research hypothesis is not valid and the research
hypothesis cannot be accepted. Thus, it could be concluded that Interactivity does not have a
significant domination over the Loading Speed.
10.4. Statistical Analysis of Hypothesis 4
Hypothesis Source of
Variation
Sum of
Squares d.f.
Mean
Squares F
p
value
between 0.2315 1 0.2315
H 4.1 error 45.43 106 0.4285 0.5402 0.46
total 45.66 107
between 0.2315 1 0.2315
H 4.2 error 42.69 106 0.4027 0.5748 0.45
total 42.92 107
between 0.5143 1 0.5143
H 4.3 error 26.69 68 0.3924 1.31 0.26
total 27.2 69
between 0.4615 1 0.4615
H 4.4 error 29.38 76 0.3866 1.194 0.28
total 29.85 77
between 0.9091 1 0.9091
H 4.5 error 47.45 108 0.4394 2.069 0.15
total 48.36 109
between 0.1905 1 0.1905
H 4.6 error 37.05 82 0.4518 0.4216 0.52
total 37.24 83
between 0.1818 1 0.1818
0.16
0.0880.071
0.130.12
0.0130.023
0.079
0.16
0.023
0
0.02
0.04
0.06
0.08
0.1
0.12
0.14
0.16
0.18
p value
p value

H 4.7 error 33.27 86 0.3869 0.4699 0.49
total 33.45 87
between 0.4286 1 0.4286
H 4.8 error 34.71 82 0.4233 1.012 0.32
total 35.14 83
between 0.5143 1 0.5143
H 4.9 error 25.83 68 0.3798 1.354 0.25
total 26.34 69
between 1.038 1 1.038
H 4.10 error 35.33 76 0.4649 2.234 0.14
total 36.37 77
Table 11: Statistical Analysis of Hypothesis 4
Figure 7: P values of hypothesis 4
Hypothesis 4: The results of all nine experience types show a p value <0.5 for hypothesis 2.
This means in overall the probability of research hypothesis is not valid and the research
hypothesis cannot be accepted. Thus, it could be concluded that purchase influence does not
have a significant domination over the recommend - ability.
E1 E2 E3 E4 E5 E6 E7 E8 E9 E10
H1 0.47 0.53 0.33 0.48 0.32 0.62 0.61 1 1 1
H2 0.12 0.12 0.1 0.036 0.048 0.054 0.092 0.11 0.047 0.048
H3 0.16 0.088 0.071 0.13 0.12 0.013 0.023 0.079 0.16 0.023
H4 0.46 0.45 0.26 0.28 0.15 0.52 0.49 0.32 0.25 0.14
Table 12: P value Summary
0.46 0.45
0.26 0.28
0.15
0.520.49
0.32
0.25
0.14
0
0.1
0.2
0.3
0.4
0.5
0.6
p value
p value

11. Model Development
The factors were organized into two groups based on the results obtained from hypothesis
tests. The structural model obtained through the above exercise is presented below. Click
stream paradox is selected as a motivator while the security falls under hygiene factor.
Arguably, security is one of the most important concerns of users. Research by Law and
Wong (2003) among Hong Kong participants shows e-buyers of travel products concern
‘secure payment methods’ as the most important aspect. Information Accuracy is selected as
a motivator while Value falls under hygiene factor. Information accuracy in its own form is
the foremost concern when it comes to reservations in terms of tourism business. Although,
Value is an important factor, the accuracy remarks a distinctive place in criticality. Loading
speed is selected as a motivator while interactivity gets into hygiene factor. Interactivity of
the web interface could be an important factor - but loading speed is more critical for
businesses to have competitive advantage over other organizations. Control Variables are
used as a validation protocol to the constructs identified in the above section. Recommend-
ability is a motivator while the Purchase influence falls under hygiene factor.
Motivator Hygiene
Factors
Click Stream Paradox Security
Information Accuracy Value
Loading Speed Interactivity
Control Variables Recommend-ability Purchase Influence
Table 13: Classified Critical Success Factors
12. Discussion
(Nielsen, 2008) argues that the sites which take more than five clicks to reach any specific
information are not usable. Furthermore, Essawy (2006) contextualized the common web
usability concepts to hotel industry, arguing sites take more than three clicks to reach the
desired information will be discarded by the consumers. Accordingly, the results show that
the number of clicks taken to reach a specified destination in the website is more critical for
the success of website when comparing with the security. It can however be contradictory to
balance the number of clicks with the degree of security in authentication points. In fact,
much information needs to be verified in different levels to ensure proper authentication.
Eventually, the number of gateways passed in making a reservation will intrinsically build a
confident and secure perception in the consumer psyche. It is a given that spending more time
on browsing basic information will frustrate users and increase the likelihood of users
switching to another site. Therefore, the basic information should be presented adhering to
the specifications of Essawy, (2006) but not the reservation portals. It is also documented that
a usage-oriented hierarchy or a combined hierarchy is a navigation structure associated with
significantly higher usability than subject-oriented hierarchies (Fang and Holsapple, 2007).
Therefore, the number of clicks taken to reach a specific set of basic information is a critical
success factor while the security remains as a hygiene factor. In addition to this, the secure
perception is another important factor, which could be influenced by the number of clicks
taken to make actual purchase with credit cards. Especially, the user needs to be empowered
with a secure perception when browsing the site. Although, the companies take so many

security measures; it is critical to include trust inducing design elements in the web interface,
in order to maintain a secure perception in the users’ mind (Sambhanthan & Good, 2012).
Prior research states that the web content should be regularly updated, informative and
personalized in a manner, which could directly influence the customer perceived image of
destinations to create a positive virtual experience (Kozak et al., 2005 and Doolin et al.,
2002). However, the updated information should be valuable to the user to make purchase
decisions. Sites with irrelevant information or over informative sites could trigger negative
user experience. In addition to this, information accuracy plays a vital role in ensuring
usability of sites. Potentially, inaccurate information could mislead customers and lead to
issues such as incorrect navigation or incorrect product selection. The accuracy of
information might contradict with value in some instances where the information needs to be
presented as an invitation to treat in the marketing perspective. In this study, the value of
information has been featured as a critical success factor while the accuracy been identified
as a hygiene factor. In the context of tourism business the value and the usefulness of
information is more critical compared to the accuracy of information. For an example, a
customer coming to the website with the intention of room details will check for the valuable
information instead of bothering whether the room rates are accurately presented. First the
motivator is whether the relevant room information is presented in the web or not. But the
accuracy of information is a supplementary factor which could be there as a hygiene factor.
Doolin et al (2002) claims interactivity of a website as the major contributor towards the
quality of service itself. In broader terms, interactivity could however mean both the
interactivity of the interface as well as the interactive communication between the hotel and
the user through the interface. In this research, interactivity is interpreted as the interactivity
of interface. Interactivity plays a major role in building up user experience. Less interactive
sites may create unpleasant browsing experiences to users. However, consideration to loading
speed should be coupled with interactivity to achieve the optimum outcome. A website built
with multimedia features and interactive chat facilities, but lacking to have proper loading
speed will undoubtedly frustrates the user. Loading speed is then proposed as the next CSF
for ensuring positive user experience.
A consumer rating on the site’s purchase influencing ability is utilized to measure whether
the interface has achieved its ultimate aim. Hence, the ultimate aim of web interfaces on
hotels is to influence the purchase decision of browsers through improving the ease of use
ability. Therefore, the rating on sites’ purchase influencing ability was utilized as an overall
assessment for the achievement of ultimate goal of site through user centered design.
However, the Recommend-ability is featured as a critical success factor while purchase
influence ability is featured as a hygiene factor. Yaobin (2007) reports a correlation between
the purchase intention and perceived ease of use of commercial websites. However,
recommend ability is a broad concept which includes purchase influence as well as the other
aspects of positivity involved in the websites. The recommend-ability could therefore be
considered as another CSF.
13. Limitations
On evaluating the process of the above study, a number of limitations could be notified.
Firstly, this study is entirely based on the ten user experience goals derived from Preece et al.
(2001). Secondly, the target audience consists of generic users instead of tourists. Even
though, the goal of study is to measure the Critical Success Factors for user experience in

tourism websites, the selection of tourist samples for the study could positively influence the
dependability of findings with regard to the purchase influence ratings. Thirdly, the sample
size of the project consists of 120, which is adequate to make generalizations, but could be
increased further to improve the accuracy of results and dependability of generalizations.
Finally, the research has not been tracing a very comprehensive background variable data. It
could be criticized that inferring insightful conclusions from a study which does not have
much background variable is quite challenging. However, the study records this as one of the
major limitations and open doors for the future researchers to rectify it in the research design
process.
This research could be further developed by working on a process model. These could be
derived from the results which gives a more details account of the factors presented in the
structural model. Basically, the process model could be based on the relationship between
each set of factors and their relationship with experience types. The process model could be
used by the managers in decision making based on the contextual requirement of their hotel
business. Furthermore, there are several types of tourism businesses in the hotel sector. From
sport tourism to destination marketing – each type of market requires specific experience
types to be generated through the website to attract the specific target groups. In such cases,
there can be a need for contextual model to develop websites – since each type would require
generating different user experience types through the web interfaces. Hence, the process
model would be useful in developing context specific interfaces for the required categories.
References
Allen, M., Currie, L.M., Bakken, S., Pattel, V.L. & Cimino, J., J., Heuristic Evaluation of
Paper Based Web pages: A Simplified Inspection Usability Methodology, Journal of
Biomedical Informatics, vol. 39, pp. 412-423.
Belanger, F., Hiller, J. S. & Smith, W.J., Trustworthiness in Electronic Commerce: The Role
of Privacy Security and Site Attributes, The Journal of Strategic Information Systems,
vol. 11, issues. 3-4, pp. 245-270.
Bullen, C. V. and Rockart, J. F., (1981) A Primer on Critical Success Factors, Solan working
paper no. 1220 - 81.
Card, S. K., Moran, T. P., & Newell, A. (1983). The psychology of human-computer
interaction Hillsdale, NJ:Erlbaum.
Carroll, J. M., Singley, M. K., & Ross on, M. B. (1992). Integrating Theory Development
with Design Evaluation.
Delice, E., K. & Gungor, Z., The Usability Analysis with Heuristic Evaluation and Analytic
Hierarchy Process, International Journal of Industrial Ergonomics, vol. 39, pp. 934-939.
Doolin, B., Burgess, L. & Cooper, J., Evaluating the Use of the Web for Tourism Marketing:
a Case Study from New Zealand. Tourism Management, 23, 557-561.
Dzida, W., International Usability Standards, ACM Computing Surveys, vol. 28, no. 1, pp.
173-175.
Essawy, M., Testing the Usability of Hotel Websites: The Springboard for Customer
Relationship Management, Information Technology & Tourism, vol. 8, pp. 47-70.
Fang, X., Holsapple, C., W., An Empirical Study of Web Site Navigation Structures' Impacts
on Web Site Usability, Decision Support Systems, vol. 43, pp. 476-491.
Fletcher, P., Poon, A., Pearce, B., & Comber, P. (2001). Practical web Traffic Analysis:
Standards, Privacy, Ttechniques, Results, Glasshaus, Acocks Green, Birmingham.
Good, A. (2011). Automating the ranking of web paNiges according to user defined
accessibility ratings: An exploratory investigation. Lecture Notes in Computer Science:
Universal Access in Human-Computer Interaction, Applications and Services Springer
Berlin / Heidelberg.
Herzberg, F., (1968). One More Time: How Do You Motive Employees? Harvard Business
Review, 46, 53-62.
Hvannberg, E., T., Law, E., L., C. & Larusdottir, M., K., Heuristic Evaluation: Comparing
Ways of Finding and Reporting Usability Problems, Interacting with Computers, vol. 19,
pp. 225-240.
Iliachenko, E, Y., Electronic Service Quality in Tourism: Development of a Scale for the
Assessment of E-SQ of Tourism Websites. Doctoral Thesis, Lulea University of
Technology, Lulea, Sweden.
Ip, C., Law, R. & Lee, H. (2010). A review of website evaluation studies in the tourism and
hospitality fields from 1996 to 2009. International Journal of Tourism Research.13 (3),
234-265
Kozak, M., Bigne, E. &Andreu, L., Web-based National Tourism Promotion in the
Mediterranean Area. Tourism Review, 60 (1), 6-11.
Law, R., Qi, S. &Buhalis, D., Progress in Tourism Management: A Review of Website
Evaluation Methods in Tourism Research, Tourism Management, vol. 31, pp. 297-313.
Law, R., Wong, J., Successful Factors for a Travel Website: Perceptions of On-line
Purchasers in Hong Kong, Journal of Hospitality & Tourism Research, 27 (1), 118-124.
Lu, Z., Lu, J., & Zhang, C., (2002). Website Development and Evaluation in the Chinese
Tourism Industry, Special Issue of Network and Communications on the Internet
Development in Asia, NETCOME, Vol. 16, No 3-4. 191-208.
Murphy, J., Forrest, E., J., Wotring, C., E., &Brymer, R., A. (1996).Hotel Management and
Marketing on the Internet. Cornell HRAQuarterly, 37(3), 71-82.
Nielsen, J. &Molich. R., Heuristic Evaluation of User Interfaces, ACM Computer Human
Interaction Proceedings, April 1990, pp. 249-256.
Nielsen, J. (1990). Evaluating the thinking aloud technique for use by computer scientists. In
H. R. Hartson& D.
Nielsen, J. (1992). Finding Usability Problems through Heuristic Evaluation. Proceedings of
CHI Conference onHuman Factors in Computing Systems. New York: ACM, 373-380.
Nielsen, J., Finding Usability Problems through Heuristic Evaluation, Communications of the
ACM, pp. 373-380.
Nielsen, J., Interaction Elasticity, Accessed on 20th
August 2009 from
http://www.useit.com/alertbox/interaction-elasticity.html
Paddison, C. &Englefield, P., Applying Heuristic to Accessibility Inspections, Interacting
with Computers, vol.16 (3), pp.507-521.
Preece, J., Rogers, Y. & Sharp, H., (2007) Interaction Design: Beyond Human Computer
Interaction.John Wiley & Sons.Inc.
Preece, J., Rogers, Y. & Sharp, H., Interaction Design: Beyond Human Computer
Interaction.John Wiley & Sons.Inc.
Punj, G., Influence of Problem Recognition on Search and other Decision Process Variables:
A framework for Analysis, Advances in Consumer Research Volume, vol. 19, pp. 491-
497, Retrieved http://www.acrwebsite.org/volumes/display.asp?id=7348 on 16th
May
2010.
Sambhanthan, A and Good, A (2012), Implications for Improving Accessibility to e-
commerce websites in Developing Countries – A study of Hotel Websites, International
Journal of Knowledge Based Organizations, vol 2. Issue. 1, pp. 1 – 20.
Shneiderman, Ben., and Catherine Plaisant. Designing the User Interface, Fourth Edition:
Strategies for Effective Human Computer Interaction, Boston: Pearson Addison Wesley,
2005.
Spink, A., A User Centered Approach to Evaluating Human Interaction with Web Search
Engines: An Exploratory Study, Information Processing & Management, vol. 38, pp.
401-426.
Tan, W., S., Liu, D. &Bishu, R., Web Evaluation: Heuristic Evaluation vs. User Testing,
International Journal of Industrial Ergonomics, vol. 39, pp. 621-627.
Thovtrup, H. & Nielsen, J., Assessing the Usability of a User Interface Standard,
Communications of the ACM, pp. 335-341.
Turner, C., W., Zavod, M. &Yurcik, W., Factors that Affect the Perception of Security and
Privacy of E-Commerce Web Sites, Proceedings of the Fourth International Conference
on Electronic Commerce Research, Dallas TX, November 2001.
Verdenburg, K., Mao, J.Y., Smith, P.W., Carey, T., A Survey of User Centered Design
Practice, ACM Computer Human Interaction, vol. 4, Issue. 1, pp. 471-478.
Yaobin, L. & Tao, Z., A Research of Consumers’ Initial Trust in Online Stores in China,
Journal of Research & Practice in Information Technology, vol. 39, no. 3, pp. 167-180.
Yeung, T., A & Law, R., Evaluation of Usability: A Study of Hotel Websites in Hong Kong,
Journal of Hospitality & Tourism Research, vol. 30, no. 4, pp. 452-473.
Yeung, T., A & Law, R., Extending the Modified Heuristic Usability Evaluation Technique
to Chain and Independent Hotel Websites, International Journal of Hospitality
Management, vol. 23, pp. 307-313.
Zang, P &Dran, G. M. (2000), Satisfiers and Dissatisfiers: A Two Factor Model for Website
Design and Evaluation, Journal of the American Society for Information Science, 51 (14),
1253 - 1268.
Zang, P., Small, R. V., Dran, G. M. &Barcellos, S. (2000), A Two Factor Theory for Web
Design, Proceedings of the 33rd Hawaii International Conference on System Sciences.

Appendix
Hypothesis 1: Click Stream Paradox has domination over secure perception in terms of
positive user experience.
Hypothesis 1.1: Click Stream Paradox has domination over secure perception in terms of
user satisfaction.
Hypothesis 1.2: Click Stream Paradox has domination over secure perception in terms of
user enjoyment.
Hypothesis 1.3: Click Stream Paradox has domination over secure perception in terms of
user feeling fun?
Question 1.4: Click Stream Paradox has domination over secure perception in terms of
user entertainment.
Hypothesis 1.5: Click Stream Paradox has domination over secure perception in terms of
user independence.
Hypothesis 1.6: Click Stream Paradox has domination over secure perception in terms of
user motivation.
Hypothesis 1.7: Click Stream Paradox has domination over secure perception in terms of
aesthetic pleasantness.
Hypothesis 1.8: Click Stream Paradox has domination over secure perception in terms of
user feeling of rewarding.
Hypothesis 1.9: Click Stream Paradox has domination over secure perception in terms of
user emotional fulfillment.
Hypothesis 1.10: Click Stream Paradox has domination over secure perception in terms of
user revisit intention.
Hypothesis 2: Value has domination over Information Accuracy in terms of positive user
experience.
Hypothesis 2.1: Value has domination over Information Accuracy in terms of user
satisfaction.
Hypothesis 2.2: Value has domination over Information Accuracy in terms of user
enjoyment.
Hypothesis 2.3: Value has domination over Information Accuracy in terms of user feeling
fun.

Hypothesis 2.4: Value has domination over Information Accuracy in terms of user
entertainment.
Hypothesis 2.5: Value has domination over Information Accuracy in terms of user
independence.
Hypothesis 2.6: Value has domination over Information Accuracy in terms of user
motivation.
Hypothesis 2.7:Value has domination over Information Accuracy in terms of user aesthetic
pleasantness.
Hypothesis 2.8: Value has domination over Information Accuracy in terms of user feeling
of rewarding.
Hypothesis 2.9: Value has domination over Information Accuracy in terms of user
emotional fulfillment.
Hypothesis 2.10: Value has domination over Information Accuracy in terms of user revisit
intention.
Hypothesis 3: Interactivity has domination over loading speed in terms of positive user
experience.
Hypothesis 3.1: Interactivity has domination over loading speed option in terms of user
satisfaction.
Hypothesis 3.2: Interactivity has domination over loading speed in terms of user
enjoyment.
Hypothesis 3.3: Interactivity has domination over loading speed in terms of user feeling
fun.
Hypothesis 3.4: Interactivity has domination over loading speed in terms of user
entertainment.
Hypothesis 3.5: Interactivity has domination over loading speed in terms of user
independence.
Hypothesis 3.6: Interactivity has domination over loading speed in terms of user
motivation.
Hypothesis 3.7: Interactivity has domination over loading speed in terms of user aesthetic
pleasantness.
Hypothesis 3.8: Interactivity has domination over loading speed in terms of user feeling of
rewarding.

Hypothesis 3.9: Interactivity has domination over loading speed in terms of user emotional
fulfillment.
Hypothesis 3.10: Interactivity has domination over loading speed in terms of user revisit
intention.
Hypothesis 4: Purchase Influence has domination over Recommend-ability in terms of
positive user experience.
Hypothesis 4.1: Purchase Influence has domination over Recommend-ability in terms of
user satisfaction.
Hypothesis 4.2: Purchase Influence has domination over Recommend-ability in terms of
user enjoyment.
Hypothesis 4.3: Purchase Influence has domination over Recommend-ability in terms of
user feeling fun.
Hypothesis 4.4: Purchase Influence has domination over Recommend-ability in terms of
user entertainment.
Hypothesis 4.5: Purchase Influence has domination over Recommend-ability in terms of
user independence.
Hypothesis 4.6: Purchase Influence has domination over Recommend-ability in terms of
user motivation.
Hypothesis 4.7: Purchase Influence has domination over Recommend-ability in terms of
user aesthetic pleasantness.
Hypothesis 4.8: Purchase Influence has domination over Recommend-ability in terms of
user feeling of rewarding.
Hypothesis 4.9: Purchase Influence has domination over Recommend-ability in terms of
user emotional fulfillment.
Hypothesis 4.10: Purchase Influence has domination over Recommend-ability in terms of
user revisit intention.
Arunasalam Sambhanthan (*) researches on the application of human computer interaction techniques to key
application areas such as business, education and health. He holds a Bachelors degree in Technology
Management and Computing from the University of Portsmouth. His honors thesis investigated on an
appropriate model for achieving strategic advantage in web tourism promotion with specific focus to Sri Lankan
hotels as a case study for developing countries. Presently he is a researcher at the University of Portsmouth
investigating on a second life based virtual therapeutic community for patients with Borderline Personality
Disorder. Sam has published his research through international conferences and peer reviewed journals. He also
serves as a reviewer for the Journal of Information, Information Technology and Organizations and Electronic
Commerce Research and Applications. Recently he has been invited to serve as a member of the international
board of reviewers of the 2012 InSITE conference organized by the Informing Science Institute, USA.
Dr Alice Good lectures in Human Computer Interaction and Strategic Business IT, as well as previously
lecturing in e-commerce. She is also supervising a number of distance learning PhDs. Research expertise in
accessibility, user centered design and mental health support systems. Other research interests include e-learning
and e-commerce. Currently co-coordinating a multi-disciplinary project in providing virtual and mobile support
for people with mental health problems. Previous projects have looked at developing algorithms to rate the
accessibility of web pages and the evaluation of learning environments. Publications include refereed book
chapters, journal and conference papers. Invited reviewer for the: Interact conference in HCI, International
Conference on Intelligent User Interfaces and the Transaction on Interactive Intelligent Systems Journal.
Arunasalam Sambhanthan
Department of Computing,
University of Portsmouth,
Buckingham Building, Lion Terrace,
Portsmouth PO1 3HE,
United Kingdom
Alice Good
Department of Computing,
University of Portsmouth,
Buckingham Building, Lion Terrace,
Portsmouth PO1 3HE,
United Kingdom