critical review of the generalised frost-dugdale approach
TRANSCRIPT

Critical Review of the Generalised Frost-Dugdale Approach to Crack Growth in F/A-18 Hornet
Structural Materials
R. Jones* and L. Molent
Air Vehicles Division Defence Science and Technology Organisation
* DSTO Centre of Expertise in Structural Mechanics
DSTO-RR-0350
ABSTRACT The F/A-18 Hornet is one of the ADF’s premier defence assets. It utilises a highly optimised metallic structure to assist in achieving its performance objectives. Thus the structure (particularly the fracture critical wing attachment bulkheads or the “centre barrel”) is uniformly highly stressed and thus susceptible to fatigue cracking. In order to help assess the fatigue critical regions of the aircraft it is essential that the tools used to predict/assess fatigue crack growth are consistent with the known fatigue behaviour of the F/A-18 materials. This report provides a critical review of the current state of knowledge with respect to the use of the Generalised Frost-Dugdale model for assessing fatigue crack growth in F/A-18 structural metallic materials and evaluates the need for further research in this area.
RELEASE LIMITATION
Approved for public release

Published by Air Vehicles Division DSTO Defence Science and Technology Organisation 506 Lorimer St Fishermans Bend, Victoria 3207 Australia Telephone: (03) 9626 7000 Fax: (03) 9626 7999 © Commonwealth of Australia 2010 AR-014-719 March 2010 APPROVED FOR PUBLIC RELEASE
Critical Review of the Generalised Frost-Dugdale Approach to Crack Growth in F/A-18 Hornet
Structural Materials
Executive Summary The objective of this report was to critically evaluate the current state of knowledge related to the modelling of crack growth in F/A-18 Hornet structural materials, with a particular focus on the status of the Generalised Frost-Dugdale model and its equivalent block variant. This was achieved through:
1. A brief review of the published literature with respect to the use of the Generalised Frost-Dugdale model to model crack growth in F/A-18 structural materials.
2. A brief review of the published literature with respect to the equivalent block variant of the Generalised Frost-Dugdale model.
3. Comparing predicted crack length histories using the Generalised Frost-Dugdale model with those obtained experimentally at DSTO and those reported in the open literature, particularly for short cracks.
4. Evaluating the need for further research. 5. Proposing future work to meet the observed shortcomings, if any.
This report reveals that the so-called short crack effect associated with 7050-T7451 aluminium alloy arises as a consequence of attempting to relate crack length per cycle (da/dN) to the range of the stress intensity factor (ΔK) and that that cracking in both 7050 series aluminium alloys and Mil Annealed Ti-6Al-4V conforms to the Generalised Frost-Dugdale model. The report recommends how to best determine the constants used in the Generalised Frost-Dugdale model. Furthermore, when determining these constants it recommends using crack growth data obtained from simple surface flaw specimens subjected to the loading spectrum of interest, where the initial flaws are allowed to develop naturally. The results of this work will assist in the development of robust fatigue assessment tools in support of maintaining airworthiness in the RAAF fleets.
Authors
Professor R. Jones DSTO Centre of Expertise in Structural Mechanics Rhys is Professor of Mechanical Engineering at Monash University’s Clayton Campus where he is Head of the DSTO Centre of Expertise in (Aircraft) Structural Mechanics (CoE-SM) and Founding Professor Monash-BHP Institute for Maintenance Technology. With over 260 publications and several books and book Chapters, Professor Jones has made significant contributions to the fields of: fatigue, composite structures, failure assessment and fracture mechanics; repair technology; and experimental stress analysis. He has pioneered the development of advanced repair technology to both aging military and civilian aircraft. He works closely, with DSTO, NASA, Airbus (EADS Innovation Works, Germany) and Rosebank Engineering. He has pioneered a non-similitude based approach to fatigue assessment that is now in use the combat aircraft group at DSTO. Professor Jones is consulted widely on fracture and fatigue issues, and is currently an advisor to Nei-software the OEM for NEi-NASTRAN. As a result of his work on structural integrity he has been invited by the Head of the NASA Johnson Fracture Control Board to participate in a joint NASA Johnson NASA Marshall program to develop new test standards and new analysis methodologies. In 2004 he was presented with a plaque by the Institution of Engineers Australia in acknowledgement of his contributions to the Mechanics. In September 2008 his work on thermoelasticty was acknowledged by DSTO as being one of the ten top publications in the period 1907-2007.
____________________ ________________________________________________
L. Molent Air Vehicles Division Loris is currently Head, Structural Integrity (Combat and Trainer Aircraft) at the Air Vehicles Division. Loris graduated in 1983 with a Bachelor of Engineering (Aeronautical) from RMIT. Since commencing employment at the then Aeronautical Research Laboratories in 1984, he has worked in the fields of aircraft structural integrity, structural and fatigue testing, advanced bonded repair, aircraft accident investigation and aircraft vulnerability. He has over 200 publications in these technical areas. He has been attached to both the Civil Aviation Department (1985) and the US Navy (NAVAIR, 1990-1991) as an airworthiness engineer.
____________________ ________________________________________________

Contents
1. INTRODUCTION............................................................................................................... 1
2. A BRIEF REVIEW OF SIMILITUDE BASED GROWTH LAWS .............................. 3 2.1 On the concept of K dominance and similitude ................................................. 4 2.2 Implications for crack growth analysis and testing ........................................... 6
3. THE EQUIVALENT BLOCK VARIANT OF THE GENERALISED FROST-DUGDALE MODEL ........................................................................................................... 7 3.1 EBV predictions for centre cracked panels, surface and corner cracks........... 8
4. CRACKING IN MIL ANNEALED TI-6AL-4V AND D6AC STEEL ....................... 10
5. CRACKING IN 7050 SERIES ALUMINIUM ALLOYS ............................................. 14 5.1 Application of the equivalent block variant to represent crack growth in
7050 series aluminium alloys................................................................................ 20
6. DETERMINING THE CONSTANTS IN THE GENERALISED FROST-DUGDALE MODEL FOR SHORT CRACKS.............................................................. 24 6.1 Cracking in 7050-T7451 aluminium alloy under Mini-FALSTAFF loading 25 6.2 Errors resulting from using Method 2) when analysing short cracks........... 27
7. AREAS FOR FURTHER RESEARCH ........................................................................... 29
8. DISCUSSION .................................................................................................................... 30
9. CONCLUSION .................................................................................................................. 31
10. ACKNOWLEDGEMENTS .............................................................................................. 31
11. REFERENCES .................................................................................................................... 32
APPENDIX A: EFFECTS OF FIGHTER ATTACK SPECTRUM ON CRACK GROWTH .................................................................................................. 38
List of Abbreviations and Acronyms
a crack length ai, af initial and final crack lengths acr the critical crack length C constant in the Paris fatigue crack growth law C* fatigue crack growth constant in the Generalised Frost-Dugdale
model C , C
~ fatigue crack growth constants in the equivalent block variant of the
Generalised Frost - Dugdale model da/dN increment in crack length per cycle da/dB increment in crack length per block (da/dN)0 reflects both the fatigue threshold and the nature of the notch (da/dB)0 reflects both the fatigue threshold and the nature of the notch under
block loading EBV Equivalent Block Variant K stress intensity factor Kmax maximum applied stress intensity factor in a block K stress intensity range Kth threshold stress intensity range Kc apparent cyclic fracture toughness κ crack driving force non-dimensional function of the crack length B, N Block and cycle number Bi, Bf initial and final block number LEFM Linear Elastic Fracture Mechanics Ni, Nf initial and final cycle number p exponent of the Kmax dependency in the Walker law R stress ratio γ Generalised Frost - Dugdale fatigue crack growth equation exponent σ remote applied stress σy material yield stress r0 distance in front of the crack at which the stresses are evaluated
DSTO-RR-0350
1. Introduction
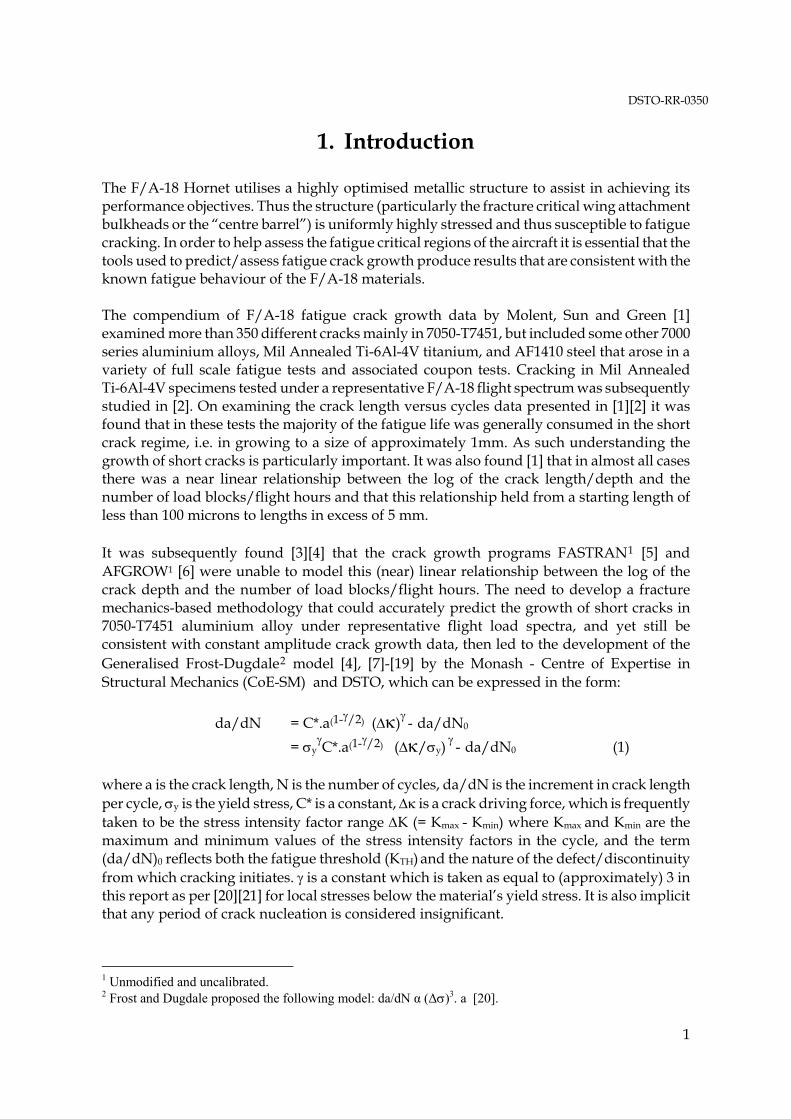
The F/A-18 Hornet utilises a highly optimised metallic structure to assist in achieving its performance objectives. Thus the structure (particularly the fracture critical wing attachment bulkheads or the “centre barrel”) is uniformly highly stressed and thus susceptible to fatigue cracking. In order to help assess the fatigue critical regions of the aircraft it is essential that the tools used to predict/assess fatigue crack growth produce results that are consistent with the known fatigue behaviour of the F/A-18 materials. The compendium of F/A-18 fatigue crack growth data by Molent, Sun and Green [1] examined more than 350 different cracks mainly in 7050-T7451, but included some other 7000 series aluminium alloys, Mil Annealed Ti-6Al-4V titanium, and AF1410 steel that arose in a variety of full scale fatigue tests and associated coupon tests. Cracking in Mil Annealed Ti-6Al-4V specimens tested under a representative F/A-18 flight spectrum was subsequently studied in [2]. On examining the crack length versus cycles data presented in [1][2] it was found that in these tests the majority of the fatigue life was generally consumed in the short crack regime, i.e. in growing to a size of approximately 1mm. As such understanding the growth of short cracks is particularly important. It was also found [1] that in almost all cases there was a near linear relationship between the log of the crack length/depth and the number of load blocks/flight hours and that this relationship held from a starting length of less than 100 microns to lengths in excess of 5 mm. It was subsequently found [3][4] that the crack growth programs FASTRAN1 [5] and AFGROW1 [6] were unable to model this (near) linear relationship between the log of the crack depth and the number of load blocks/flight hours. The need to develop a fracture mechanics-based methodology that could accurately predict the growth of short cracks in 7050-T7451 aluminium alloy under representative flight load spectra, and yet still be consistent with constant amplitude crack growth data, then led to the development of the Generalised Frost-Dugdale2 model [4], [7]-[19] by the Monash - Centre of Expertise in Structural Mechanics (CoE-SM) and DSTO, which can be expressed in the form:
da/dN = C*.a(1-/2) () - da/dN0
= yC*.a(1-/2) (/y) - da/dN0 (1)
where a is the crack length, N is the number of cycles, da/dN is the increment in crack length per cycle, y is the yield stress, C* is a constant, is a crack driving force, which is frequently taken to be the stress intensity factor range K (= Kmax - Kmin) where Kmax and Kmin are the maximum and minimum values of the stress intensity factors in the cycle, and the term (da/dN)0 reflects both the fatigue threshold (KTH) and the nature of the defect/discontinuity from which cracking initiates. is a constant which is taken as equal to (approximately) 3 in this report as per [20][21] for local stresses below the material’s yield stress. It is also implicit that any period of crack nucleation is considered insignificant.
1 Unmodified and uncalibrated. 2 Frost and Dugdale proposed the following model: da/dN α (Δ)3. a [20].
1

DSTO-RR-0350
This formulation has been used to accurately represent cracking in 7050-T7451 aluminium alloy in a range of DSTO laboratory tests [13], a DSTO F/A-18 Hornet centre barrel test [4][11][15], cracking under several representative Joint Strike Fighter load spectra [16], a representative helicopter spectrum [19], cracking in a number of laboratory coupon and sub-component tests involving a range of steels (including D6ac steel, a large cross-section of rail wheel steels, a 350 MPa Grade locomotive mild steel, and a propriety steel that is widely used in rail freight rolling stock), Grade 1 Austempered Ductile Iron, a range of 2000 and 7000 series aluminium alloys, and Mil Annealed Ti-6AL-4V ([4][7], [9]-[12], [14]-[19]). In the case of the F/A-18 centre barrel test reported in [4] it was found that, when the initial flaw size was approximately 3 microns, whilst there was excellent agreement between the Generalised Frost-Dugdale predictions for the crack depth history and the experimental results, FASTRAN predicted very long lives. In this instance unlike the predictions obtained using the Generalised Frost-Dugdale model the shape of the crack depth versus cycles curve predicted by FASTRAN differed markedly from the test data. Similar shortcomings were reported by Molent, Singh, and Woolsey [3] when using the crack growth program AFGROW to model crack growth in 7050-T7451 aluminium alloy specimens. The primary purpose of this report was to focus on the current status of the Generalised Frost-Dugdale model and its ability to represent cracking in F/A-18 Hornet structural materials, particularly the aluminium alloy 7050-T7541 and Mil Annealed Ti-6Al-4V, and the current status with respect to Region I crack growth (see Figure 1). As a result of this study it was found that cracking in 7050 series aluminium alloys and Mil Annealed Ti-6Al-4V conforms to the Generalised Frost-Dugdale model. Problem areas associated with the use of crack closure and other Paris-based crack growth laws for modelling crack growth in F/A-18 structures are also briefly considered, particularly for Region I crack growth. (It should be noted that the ability of the Paris-based crack growth laws to model the growth of large/long cracks in Region II is not questioned.) It has long been known [22]-[25] that in Region I, crack growth can be a function of the test geometry. This Region I dependency of da/dN versus K data on the specimen geometry and the test methodology means that the similitude hypothesis, which forms the basis of algorithms based on the Paris-based crack growth law, can not be assumed to be valid in Region I. In this context it will be shown that tests performed at DSTO, NASA and at the Monash-DSTO CoE-SM on the growth of both short and long cracks in 7050-T7451 confirm the breakdown of similitude in Region I. Furthermore, these tests reveal that the so called short crack effect appears to arise as a consequence of attempting to relate da/dN to the range of the stress intensity factor (ΔK).
2
DSTO-RR-0350
2. A Brief Review of Similitude Based Growth Laws
It is commonly thought that da/dN can be related to K, and/or the maximum stress intensity factor Kmax. This approach was first suggested in 1961 by Paris, Gomez and Anderson [26], who related da/dN to the maximum stress intensity factor Kmax. The work of Liu [27] subsequently implied that the crack growth was a function of the stress intensity factor range K (= Kmax - Kmin). A similar relationship was also proposed by Paris and Erdogan [28]. This led to the well known Paris equation:
da/dN = C K m (2) where C and m are experimentally obtained, and are considered to be a constant for a particular material and environment. Over the years this relationship has continued to be modified to account for a variety of observations [29], including R ratio (R= Kmin /Kmax), Kmax effects [30]-[32], crack tip plasticity e.g. Willenborg retardation models and plastic wake-induced crack closure [5][35]. The resulting crack growth laws are all based on the similitude hypothesis, viz: Two different cracks growing in identical materials and thicknesses with the same stress intensity factor range K, and the same Kmax, will grow at the same rate.
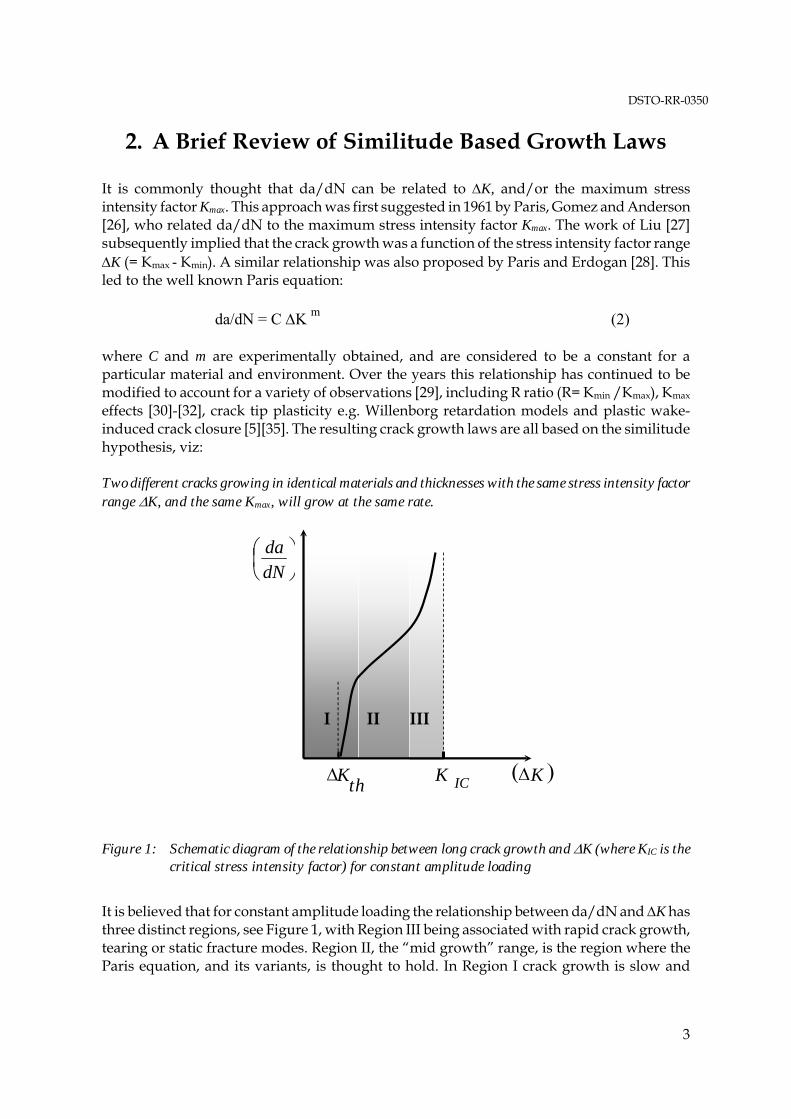
Figure 1: Schematic diagram of the relationship between long crack growth and K (where KIC is the critical stress intensity factor) for constant amplitude loading
It is believed that for constant amplitude loading the relationship between da/dN and K has three distinct regions, see Figure 1, with Region III being associated with rapid crack growth, tearing or static fracture modes. Region II, the “mid growth” range, is the region where the Paris equation, and its variants, is thought to hold. In Region I crack growth is slow and
I
II
K
III
dNda
IC K
tK h
3

DSTO-RR-0350
several authors have introduced the concept of a fatigue threshold stress intensity factor range, Kth, below which cracks seem not to grow [36]. It was originally thought that, for any given material and thickness, the da/dN versus K relationship was unique. Pearson [37], at the Royal Aircraft Establishment Farnborough, revealed that this belief to be false. In this work Pearson [37] showed that fatigue crack growth laws determined for macroscopic crack growth data could not be used to predict the growth of small sub-millimetre cracks, and that the constants in the crack growth law were a function of the size of the crack. He also stated that this inconsistency was not due to crack-tip plasticity effects. Subsequent studies into cracking in 7075-T6 aluminium alloys [38] confirmed that short fatigue cracks can propagate at rates faster than that of long cracks subjected to the same nominal ΔK, i.e. there is an apparent crack length dependency. Moreover, it is now known that short fatigue cracks can grow at stress intensities well below the long crack ΔK threshold. As a result when analysing the growth of short cracks it is common to use data that differs from the long crack da/dN versus K data [39]. More extensive reviews of fatigue crack growth are presented in [29], [40]-[44] and for short crack growth by Suresh and Ritchie [45] and by Miller [25][46], who suggested a comprehensive classification of short cracks viz: micro-structurally, mechanically, physically and chemically short cracks. The NASA finding [22],[47] that similitude was not valid in Region I and Miller’s conclusion [45] that: “perhaps more progress would be made if LEFM characterisation parameters were ignored, and only the basic da/dN versus a type data be analysed.” raises the questions of: how to determine which da/dN versus K relationship to use; and how to determine the true fatigue threshold ΔKth; or whether alternative non-similitude based approaches should be adopted. These questions take on added importance for short cracks since it is now known [25],[29],[37],[45]-[50] that for short cracks K dominance is lost and hence the similitude hypothesis, which underpins all Paris-based approaches, is highly questionable for short cracks. In this context it should be noted that Schijve [29] remarked that: “Actually, it should be recognised that the K-concept for such small cracks in a crystalline material becomes questionable. The plastic zone is a slip band and its size is not small compared to the crack length of the microcrack.” 2.1 On the concept of K dominance and similitude
The Paris growth law and its subsequent variants are founded on the belief that the crack tip stress field is uniquely characterised by the stress intensity factor. This belief arose as a result of the early papers by Griffiths [51][52] and Irwin [53]-[55]. In 1966 Sih [56] revealed that the Westergard solution [57] for a center crack in a large panel contained an error. Here [56] it was
4

DSTO-RR-0350
shown that a constant term, commonly referred to as the T stress, was missing in the series of expansion for the local stress field in the vicinity of the crack tip. Eftis [58] then used Sih’s corrected solution to reveal that both Griffiths’ and Irwin’s analyses were in error. Eftis, Jones and Liebowitz [59] subsequently revealed that: “The notion that only the leading term of the series expansion for stress, containing as it does the stress intensity factor and the square root singular term, can adequately describe the state of stress about the ends of the crack is erroneous in general.” Eftis, Jones and Liebowitz [59] also suggested that to evaluate crack growth and failure required the crack tip stress field to be evaluated at a length scale ro in front of the crack. The concept of a characteristic length scale is moderately widely used in the assessment of fatigue crack growth and fracture mechanics [59]-[63]. For long cracks growing in Mode I under uniaxial loading the ratio ro/a tends to be quite small and, as a result, the error in using ∆K and Kmax to characterise the crack tip stress field is also (generally) quite small. However, for short cracks with length scales of the order of 10 microns the ratio ro/a will not be small. (References [62][63] give values for r0 that ranged from 0.1 to 3.3 mm.) In this context it should be noted that [50][64] subsequently confirmed the conclusions reached in [59] i.e. that for short cracks the crack tip stress and strain fields were a function of both K and the T stress, which is proportional to K/√a and is defined as the non-singular component of the near tip stress acting parallel to the crack (see [59]). As a result [50][64] concluded that K dominance is lost for small (short) cracks. Consequently the similitude hypothesis is also invalid for small (short) cracks. With this in mind it is shown that the crack growth data given in [10][22] reveals that, in Region I, not only is similitude invalid for Mil Annealed Ti-6AL-4V titanium, but that the crack closure hypothesis is also at odds with the weak R ratio dependency seen in Mil Annealed Ti-6Al-4V crack growth rate data. At this point it should be noted that Forth, James, Johnston and Newman [47], have explained that crack closure approaches are inappropriate for modeling crack growth in materials that have a weak R ratio dependency. In this context it should be noted that in the original USAF-ASTM study [65] into the development of the ASTM fatigue testing standards it was found that in Region II crack growth in both 2219-T851 aluminium alloy and 10Ni steel was a weak function of the R ratio. Moreover, a recent NASA-Sikorsky investigation [66] into cracking in the ST direction in 7050-T7451 plate revealed that the da/dN versus K relationship was essentially R ratio independent in both Regions I and II. The conclusion that similitude cannot be assumed in Region I or for the growth of short cracks significantly degrades the confidence that can be placed in the ability of standard FASTRAN and AFGROW, and other similitude based computer programs, to address potential F/A-18 fleet lifing issues.
5

DSTO-RR-0350
2.2 Implications for crack growth analysis and testing
All similitude based crack growth models that attempt to model the growth of short cracks on a cycle by cycle basis need valid Region I data. For F/A-18 Hornet materials the recent findings that:
i) Region I test data generated using the ASTM load reducing technique produces crack growth data that does not represent the true material response [22][47][71],
ii) in Region I similitude was lost for Mil Annealed Ti-6al-4V [10][22],
iii) crack closure should not be used to model crack growth in high strength steels [47], and
iv) in Region I the da/dN versus K data for cracking in the ST direction in 7050-T7415 aluminium alloy is essentially independent of the R ratio [66],
when taken together with the findings that: in the LT direction the da/dN versus K relationship appears to be a function of the
test methodology;
that the apparent short crack effect arises as a result of attempting to relate da/dN to K based quantities, i.e. Kmax and or K; and
the conclusion that for short cracks K dominance is lost,
highlights the need to better understand and quantify the (Region I) growth of short cracks. For this to be done, valid Region I crack growth data as well as data on crack growth in simple specimens under representative flight load spectra is needed. The later is important as it may provide for a superior method for characterising crack growth under F/A-18 Hornet load spectra. It is clear that there is a need to develop alternative crack growth modeling approaches. The Generalised Frost-Dugdale model and its Effective Block Variant (EBV) formulation are two potential alternatives. However, for these to be routinely used to model cracking in F/A-18 structures methods for determining the associated constants need to be clearly defined. To this end the present paper reveals how to best determine these constants and recommends the use of simple surface flaw test specimens subjected to the loading spectrum of interest where the cracks are allowed to develop naturally, i.e. there is no artificial starter crack. This recommendation is important because for combat aircraft most of the life is generally consumed in the growth of these (naturally occurring) short cracks, see [1].
6

DSTO-RR-0350
3. The Equivalent Block Variant of the Generalised Frost-Dugdale Model
The Generalised Frost-Dugdale model [4],[7]-[19], i.e. Equation (1), was initially developed to account for the (near) linear relationship between the log of the crack depth and the number of load cycles/ blocks/flight hours seen in [1],[67]-[70] etc and to reformulate the original Frost-Dugdale model [20] in terms of ΔK, Kmax, and the crack length. The EBV formulation, which was first developed in [14], built on the works of [40], [68], [72]-[75], which revealed that repeated blocks of loads can, in certain circumstances, be treated as equivalent to load cycles, provided that:
i) the slope of the a versus block curve has a minimal number of discontinuities,
ii) there are a large number of blocks before failure,
to derive a variant of the Equation (1) crack growth model that accounts for the crack growth per block, da/dB, viz:
da/dB = ( a1- /2 Kmax - da/dBo)/(1.0 - Kmax/Kc) (3) C
~
where is a constant, Kmax is the maximum value of the stress intensity factor in a block (excluding rare overloads), Kc is the apparent cyclic fracture toughness and da/dB0 reflects both the fatigue threshold and the nature of the initial defect/discontinuity under block loading. This formulation has been shown to accurately compute the crack growth histories associated with a wide range of material and load spectra, see
C~
[7],[11],[14]-[16],[18] and Appendix A. Furthermore, in the context of this report it should be noted that this approach has been used [11][15] to accurately compute the growth of a small (approximately 3 micron) flaw in the F/A-18 centre barrel test described in [4], see Figure 2. These same references also showed that the addition of the (1.0-Kmax/Kc) term enabled the modelling of the quasi-static growth near the end of a crack’s life. Figure 2 also shows that standard FASTRAN failed to accurately model this short crack scenario.
7

DSTO-RR-0350
0.001
0.01
0.1
1
10
0 20000 40000 60000 80000
Flight Hours
Cra
ck D
epth
(mm
)
Y488 Experimental Results
FASTRAN
EBV Solution
Figure 2: Experimental and EBV predicted crack growth histories, from [11][15]
3.1 EBV predictions for centre cracked panels, surface and corner cracks
Let us next consider the application of the EBV approach to crack growth in centre cracked panels, also referred to as M(T) panels. In this case Kmax is proportional to max ( a), where is a function of the geometry and max is the maximum far field stress, so that, ignoring the region where Kmax approaches its cyclic fracture toughness Kc, and ignoring da/dB0 and (1.0-Kmax/Kc), Equation (3) can be written in the form:
da/dB = ( max 1/2) a (4) C~
When the crack length is small with respect to the width of the panel we can set 1 so that, ignoring finite width effects, integrating Equation (4) from a to af we obtain:
(B-Bi)/(Bf –Bi)= 1- ln(a/af) / ln(ai/af) (5) where ai and af are the initial and final crack sizes, and Bi and Bf are the corresponding number of blocks, or flights, and B is the number of blocks or flights at crack length a. Finally as the crack size approaches its critical length/depth we need to account for Kmax approaching its fracture toughness. To account for this we need to integrate Equation (3) rather than Equation (4). However, this effect often tends to be small and, as shown in [18], generally only affects the region a/af > 0.8. A similar deviation from Equation (5) occurs when the crack length is close to the size of the initial defect/discontinuity. In this case the “crack” is influenced by the geometry of the starting defect and, as such, is not (yet) acting as a crack of length a. To overcome this Molent et al. [76] suggested that a more accurate representation is obtained by using an equivalent
8

DSTO-RR-0350
pre-crack size (EPS) rather than the physical size of the initial discontinuity. In this report, however, we have taken ai to be the size of the initial discontinuity. As a result, the slope of the (B-Bi)/(Bf –Bi) versus (a) = (1- ln(a/af) / ln(ai/af)) curves sometimes differs slightly from that suggested by Equation (5). (This occurs when the term (B-Bi)/(Bf –Bi) approaches values of zero and one.) Nevertheless, this approach predicts that, for tests on centre cracked panels under repeated block loading, for the majority of the fatigue life there should be a near linear relationship between the number of load blocks and the log of the crack length. This relationship also arises for surface flaws, corner flaws and embedded cracks when remains approximately constant, see [18] for more details. As a result, this formulation provides the analytical framework for the observations reported in [1][2][68]. Further investigation is required for the case where changes significantly.
9

DSTO-RR-0350
4. Cracking in Mil Annealed Ti-6Al-4V and D6ac Steel
The data shown in Figure 3 (is reproduced from [18]) suggest that the response of D6ac3 steel [17] and Mil Annealed Ti-6Al-4V4 generated from ASTM standard CT specimens conform to the Generalised Frost-Dugdale model (see also [4]-[13]) of the form:
da/dN = C*.a(1-/2) () - da/dN0 = y
C*.a(1-/2) ((Kmax/ y)p (K/y)(1-p)) - da/dN0 (6) where , the crack driving force, is defined as per Walker [79], viz:
= Kmaxp K(1-p) (7) where p is a material constant. For D6ac the relation is shown to hold over three orders of magnitude (i.e. approximately ~8 x 10⁻⁹ m/cycle < da/dN < ~1 x 10⁻⁶ m/cycle). For Mil Annealed Ti-6Al-4V the range is also similar (i.e. ~8 x 10⁻⁹ mm/cycle < da/dN < ~4 x 10⁻⁵ mm/cycle). The nature of the D6ac tests referred to in Figure 3 is detailed in Table 1. Table 1: Test matrix, from [17]
Specimen Number Test details Ct3-5-tl Constant Kmax*=15
Ct3-10b-lt Constant R=0.3 LI+ Ct3-12-lt Constant R=0.9 LI Ct3-25-lt Constant R=0.7 LI Ct3-27-lt Constant R=0.9 LI Ct3-29-lt Constant R=0.3 LI Ct3-46-lt R=0.1 LI Ct3-47-lt R=0.8 LI
*LI = Load increasing test, + Kmax= constant Kmax test
(Note that by dividing the term by the yield stress y the resultant constant y
C* is dimensionless and hence can be used regardless of whether we are using SI or Imperial units. In this study we have taken y = 1137 MPa for D6ac steel and 900 MPa for Mil Annealed Ti-6Al-4V). For the Mil Annealed Ti-6Al-4V data shown in Figure 3 it is found that C* = 2.4x 10⁻³/y3, da/dN0 = - 1.8 x 10⁻¹⁰ and p = 0.085. The low value of p (= 0.08) reveals that cracking in Mil Annealed Ti-6Al-4V has a weak R ratio dependency.
3 Whilst not of direct relevance to the F/A-18, D6ac is discussed here due to it relevance to other legacy RAAF aircraft (e.g. F-111). 4 The Mil Annealed Ti-6Al-4V crack growth data shown in Figure 3 was taken from Hudson [77] and Porter [78], see [18] for more details.
5 Trail and error best fit to the da/dN versus K data [17][18].
10

DSTO-RR-0350
y = 2.40E-03x - 1.80E-10
1.0E-11
1.0E-10
1.0E-09
1.0E-08
1.0E-07
1.0E-06
1.0E-05
1.0E-04
1.E-08 1.E-07 1.E-06 1.E-05 1.E-04 1.E-03 1.E-02 1.E-01
((K 1-p Kmax p)/σy)
3 /a1/2 (metres)
da
/dN
(m
/cy
cle)
D6AC C3-5-ltD6ac Ct3-12-ltD6ac Ct3-27-ltD6ac Ct3-25-ltD6ac Ct3-47-ltD6ac Ct3-46-ltD6ac Ct3-29-ltD6ac Ct3-10b-ltHudson Ti-6AL-4V R =0.85Hudson Ti-6AL-4V R =0.66Hudson Ti-6AL-4V R =0.43Hudson Ti-6AL-4V R =0.25Hudson Ti-6AL-AV R = 0.0Porter Ti-6AL-4V R=0.03Porter Ti-6Al-4V R = 0.05Linear
Figure 3: Comparison of the Generalised Frost-Dugdale representation of crack growth in Mil
annealed Ti-6Al-4V, taken from [77][78], and D6ac steel [17][18]
Figure 4 presents Northrop-Grumman’s [80] long crack growth data from 12.7 mm wide and 7.34 mm thick centre cracked Mil Annealed Ti-6AL-4V panels subjected to a fighter load spectrum with a peak remote stress of 710 MPa. Figure 4 reveals that the resultant non-dimensional crack length history [80] conforms to Equation (5).
11

DSTO-RR-0350
y = 1.018x - 0.0334R2 = 0.9944
0
0.1
0.2
0.3
0.4
0.5
0.6
0.7
0.8
0.9
1
0 0.2 0.4 0.6 0.8 1
(B-Bi)/(Bf-Bi) - Non dimensional fatigue life
a N
ond
imen
sion
al c
rack
siz
e Test data
Equation (5)
Figure 4: Experimental and computed crack growth under a fighter spectrum, adapted from [80].
Dashed line is best fit
Having shown that the growth of long cracks in Mil Annealed Ti-6Al-4V follows the Generalised Frost-Dugdale model the growth of short cracks in Mil Annealed Ti-6Al-4V under a representative F/A-18 Hornet load spectrum are now addressed. The data presented by Zhuang, Barter and Molent [2] on the growth of small corner cracks in Mil Annealed Ti-6AL-4V rectangular bars under a representative F/A-18 flight load spectrum are considered. The tests were performed with the remote maximum stresses being 75%, 85% and 96% of the yield stress. The associated values of Bi, ai, Bf and af are shown in Table 2. The resultant experimental data is shown in Figure 5 where it is seen that the crack growth history again follows Equation (5). The (near) linear relationship between (a) and (B-Bi)/(Bf–Bi), implies that in this range, i.e. excluding the onset of static fracture modes, the crack growth model for
12

DSTO-RR-0350
Mil Annealed Ti-6AL-4V should have only two constants6. (It is interesting to contrast this with crack closure based laws where there are five constants and an additional constraint parameter that is varied as da/dN increases).
0
0.2
0.4
0.6
0.8
1
0 0.2 0.4 0.6 0.8 1
(B-Bi)/(Bf-Bi) Non dimensional fatigue life
a 96% test 1
96% test 2
85% test 1
85% test 2
75% test 1
75% test 2
Figure 5: Non-dimensional representation of cracking in Mil Annealed Ti-6AL-4V, under a RAAF
F/A-18 Hornet spectrum, adapted from [2]
Table 2: Values of Bi, ai, Bf and af
Test Bi ai (mm) Bf af (mm) 96 % test 1 67.2 0.0577 199 0.97 96 % test 2 23.2 0.0395 442 0.84 85 % test 1 75.5 0.049 898 1.89 85 % test 2 44 0.032 658 0.84 75% test 1 50.4 0.037 103 1.44 75% test 1 88 0.053 787 1.88
6 Namely C* and da/dN0; as 3, and p and y are material constants.
13

DSTO-RR-0350
5. Cracking in 7050 Series Aluminium Alloys
The da/dN versus K data obtained in a joint NASA-Sikorsky [66] study into cracking in the ST direction in 7050-T7451 is shown in Figure 6. In this work compact tension (CT) specimens were tested under ASTM constant R load reducing tests, with R ratio’s of 0.1 and 0.7, constant Kmax (= 15 MPa √m) tests, and a constant amplitude test with R = 0.1. Examining Figure 6 it is seen that in Region I, and well into Region II, each test gave (essentially) the same da/dN versus K data. This apparent lack of an R ratio effect on the da/dN versus K relationship in the ST direction implies that wake-induced crack closure does not apply in 7050-T7541 plate material for crack growth in the ST direction.
1.0E-05 Constant Kmax
R=0.7 1.0E-06
Figure 6: Crack growth in the ST direction in 7050-T7451 aluminium alloy, from [66]
NASA-Sikorsky [66] also examined cracking in the LT direction and the results are presented in Figure 7 together with those obtained by Sharp, Byrnes and Clark [81], and Finney [82] and unpublished7 constant amplitude short crack data [83]. The resultant da/dN versus K data for R = 0.7 and R = 0.1 are shown in Figure 7. Here it is seen that:
i) for R = 0.1 references [66],[81]-[83] give different da/dN versus K curves. For example whilst points A and B in Figure 7a) both have the same ΔK, approximately 2 MPa √m, the corresponding crack growth rates differ by more than an order of magnitude.
Note that the da/dN versus K curve associated with the R= 0.1 load reducing test [66] should be to the right of any curve associated with R = 0.1 non-load reducing
7 This will be the topic of a subsequent report.
1.0E-11
1.0E-10
1.0E-09
1.0E-08
1.0E-07
1.0 10.0 100.0
K (MPa m )
da/
dN
(m
/cyc
le)
R=0.1
Constant Amplitude R = 0.1
7050-T7451 Al plateS-T, 21 o C, Lab Air
28% Relative Humidity
14

DSTO-RR-0350
tests. However, the R = 0.1 load reducing data presented in [66], and shown in Figure 7 a), is to the left of the R = 0.1 data given in [81].
ii) As K increases Finney’s [82] R = 0.2 data essentially coincides with the R = 0.5 data given in [81] and the Kmax data8 given in [60], see Figure 7 b).
iii) At low K’s Finney’s R = 0.2 data approaches the R = 0.7 and the Kmax data given in [66], see Figure 7 b).
iv) Beneath da/dN < 10-8 m/cycle the short crack growth rates given in [83] are significantly greater than those presented in [66], see Figure 7 b).
As a result we see that for 7050-T7451 the da/dN versus K relationship appears to be a function of the test methodology9, i.e. similitude does not hold. This finding supports that reported in [81] which revealed a large variation in the da/dN versus K relationship obtained by numerous researchers. Figure 7 also reveals that at low crack growth rates the “short crack” da/dN versus ΔK curves [83] appear to reveal what is commonly thought to be a “short crack” effect in that for a given ΔK the growth rate appears to be greater than for long cracks [66][82]. Furthermore, the short crack fatigue threshold ΔKth is clearly significantly below the long crack fatigue threshold. We also see that the “short crack” R = 0.1 and R = 0.7 curves do not appear to show a significant R ratio effect beneath da/dN < ~ 10-8 m/cycle. Furthermore, the R = 0.1 “short crack” data appears to join/approach that of [82] (R = 0.2), and the Kmax test da/dN versus ΔK curves [66] at high da/dN’s. The R = 0.7 “short crack” data approaches both the R = 0.7 and the Kmax test data given in [66] at high da/dN’s.
8 At this stage R is approximately 0.4 9 Geometry of specimens, increasing or decreasing loads etc.
15

DSTO-RR-0350
da/dN = 5.27E-11K3.1222
R2 = 0.992
1.00E-11
1.00E-10
1.00E-09
1.00E-08
1.00E-07
1.00E-06
1.00E-05
0.1 1 10 100K MPa m
da/d
N (m
/cyc
le)
Sharp R = 0.1
Sharp R = 0.1
Forth R = 0.1
Sharp R = 0.5
Short crack R = 0.1
Short crack R = 0.7
Kmax Test
Short crack effect ?
A
B
Figure 7a: Representation of crack growth in 7050-T7451 aluminium alloy LT direction
16

DSTO-RR-0350
da/dN = 1.34 E-09 K2.059
R2 = 0.9613
da/dN = 2.89E-11K3.65
R2 = 0.987
1.00E-11
1.00E-10
1.00E-09
1.00E-08
1.00E-07
1.00E-06
1.00E-05
0.1 1 10 100K MPa m
da/d
N (m
/cyc
le)
Forth KmaxForth R = 0.7Forth R = 0.1Sharp R = 0.5Short crack R = 0.1Short crack R = 0.7Finney R = 0.2
Finney's R = 0.2 MT data is approaching the NASA R = 0.7 data
Short crack effect ?
Figure 7b: Representation of crack growth in 7050-T7451 aluminium alloy LT direction
Table 3: Test descriptors
Reference Initial flaw size Test geometry Test method
[66] Unknown 12.7 mm thick CT Kmax, R = 0.7 and load reduction
(R=0.1) as per ASTM E647 [81] ~ 28 mm 12 mm thick CT Fixed load, R = 0.1, 0.5, 0.8 [82] ~ 6.6 mm 9.95 mm thick MT Fixed load, R = 0.2
[83] 0.021 mm (Test 1) 0.0076 mm (Test 2)
11 mm thick dogbone specimen
Constant amplitude R =0.1 tests interspersed with R =0.7 marker loads.
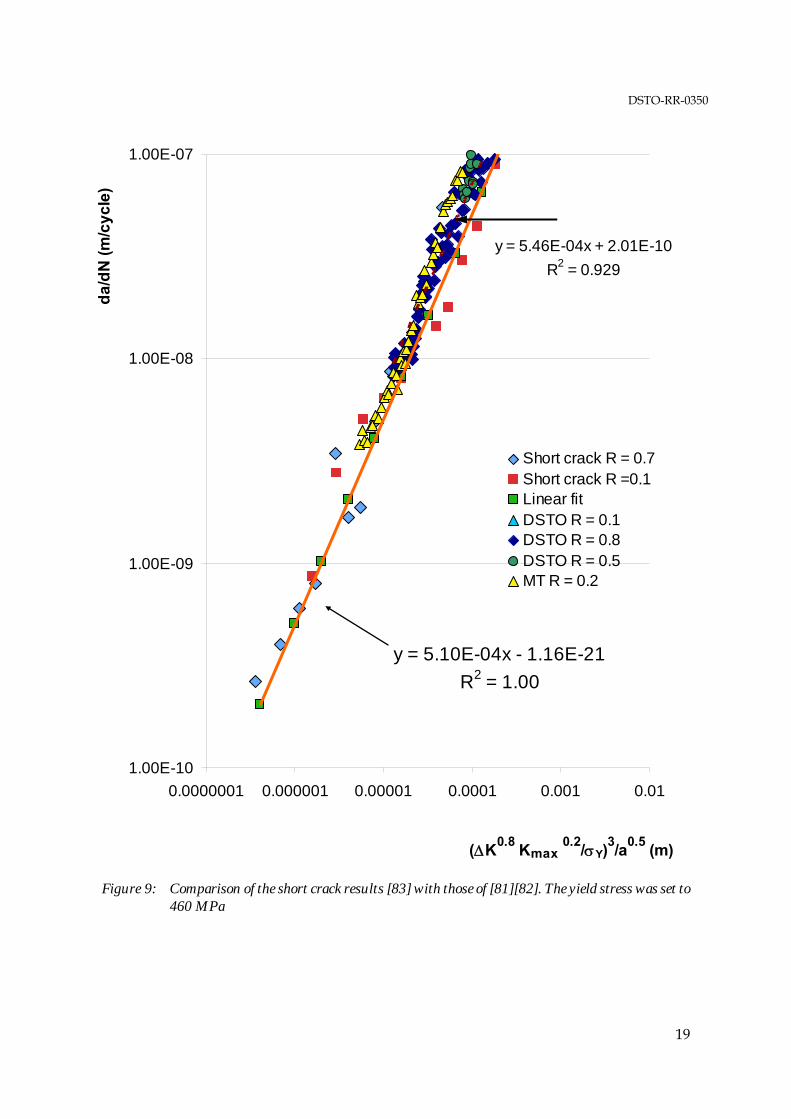
Figures 8 and 9 present plots of da/dN against a(1-/2) (/σy), with = 3, for the short crack tests [83] where is a crack driving force which, in this case as per Equation (7) with p =0.2, which is the similar to that of 2024-T3 and 7075-T6 [9]. Figure 8 reveals that, with this formulation, the R = 0.1 and the R = 0.7 data [83] appear to fall on the same straight line, see Figures 8 and 9, with C* ~ 5.1 10-4 and da/dN0 ~0.0. Furthermore, this linear relationship holds over more than 3 orders of magnitude ~7 x 10⁻¹⁰ < da/dN < ~1.5 x 10⁻⁶ m/cycle.
17

DSTO-RR-0350
Furthermore, Figure 9 reveals that when presented in this fashion the relationship obtained for the short crack data [83] and those obtained by Sharp, Byrnes and Clark [81], for R = 0.1, 0.5 and 0.8, and by Finney [82] for R = 0.2, which both tested crack growth from relatively large initial flaws, see Table 3, are very similar, i.e. when formulated in this fashion the “short crack” effect vanishes. Thus for 7050-T7451 aluminium it would appear that the so- called short crack effect arises as a consequence of attempting to relate da/dN to ΔK. Note that in [81][82] the cracks were (two dimensional) through the thickness cracks in approximately 11 mm thick material. As such they were in a constraint state that lay in between that of plane stress and plane strain. However, the short crack data [83] is associated with small surface flaws. As such the levels of constraint associated with the short crack study [83] can be expected to differ from those associated with the long cracks studied in [81][82].
y = 5.10E-04x
y = 4.20E-04x0.970
R2 = 0.970
1.00E-10
1.00E-09
1.00E-08
1.00E-07
1.00E-06
1.00E-05
1.00E-04
0.0000001 0.000001 0.00001 0.0001 0.001 0.01
(K0.8
Kmax 0.2
/Y)3/a
0.5 (m)
da
/dN
(m
/cy
cle
)
Short crack R = 0.7
Short crack R =0.1
Figure 8: The R = 0.1 and R = 0.7 short crack data [83] plotted as per the Generalised Frost-Dugdale
model, the yield stress is set to 460 MPa
18
DSTO-RR-0350
y = 5.10E-04x - 1.16E-21R2 = 1.00
y = 5.46E-04x + 2.01E-10R2 = 0.929
1.00E-10
1.00E-09
1.00E-08
1.00E-07
0.0000001 0.000001 0.00001 0.0001 0.001 0.01
(K0.8
Kmax 0.2
/Y)3/a
0.5 (m)
da
/dN
(m
/cy
cle
)
Short crack R = 0.7Short crack R =0.1Linear fitDSTO R = 0.1DSTO R = 0.8DSTO R = 0.5MT R = 0.2
Figure 9: Comparison of the short crack results [83] with those of [81][82]. The yield stress was set to
460 MPa
19

DSTO-RR-0350
Noting that the tests performed in [81]-[83] were performed at a range of stress levels and R ratios it would appear that the value of C* associated with short crack growth is (essentially) independent of the stress level and the test methodology.
A similar conclusion, i.e. that is stress independent, arises when using the EBV since: C~
The crack length history predictions, obtained using the EBV approach, presented in [18] for crack growth in a helicopter component under an Asterix (generic main rotor) load spectrum, where there was a large variation in the stress in the section, were in excellent agreement with experimental measurements.
The EBV computed crack length histories presented in [7] where (short) crack growth
at a fastener hole under a representative flight loading using a single value of C~
that was consistent with that obtained from a prior specimen test.
The crack length history predictions presented in Figure A-3 in Appendix A where the crack length history for a test performed under an F-15 load spectrum with a peak
remote stress of 207 MPa was predicted using the values of C~
and γ obtained from a similar test with a peak stress of 136 MPa.
At this stage it is should also be noted that White, Barter and Molent [84], who studied crack growth in 7050-T7451 aluminium under variable amplitude block loading interspersed with blocks of constant amplitude loading, revealed that the mechanisms underpinning crack growth under variable amplitude load differed from those seen under constant amplitude loading. Thus for short crack growth in 7050-T7451 plate under variable amplitude loading:
a) K dominance may not apply.
b) Similitude may not apply.
c) The crack growth mechanisms observed under constant amplitude tests may not apply to in-service cracking,
As such the da/dN versus K data determined from constant amplitude tests may not be applicable for assessing in-service cracking.
d) Similitude based crack growth laws, which utilise the da/dN versus K data determined from constant amplitude tests, may yield unrepresentative results for short cracks.
Fortunately the Generalised Frost-Dugdale model and the EBV formulation appear to reasonably accurately model short crack growth in 7050-T7451 aluminium alloys under both constant amplitude and representative flight loading. This will be discussed further in the next section where it is shown that variable amplitude crack growth in 7050 series aluminium alloy appears to conform to Equation (5). 5.1 Application of the equivalent block variant to represent crack growth in 7050 series aluminium alloys
Consider now the ability of the EBV approach, i.e. Equation (3), to represent crack growth in 7050 series aluminium. In Figure 2 it was (already) shown that the EBV approach accurately computed the crack depth history measured in the DSTO centre barrel test discussed in [11]. Furthermore, for 7050 series aluminium alloys Jones, Peng and Pitt [18] have shown that for
20
DSTO-RR-0350
small centre cracks, surface flaws, corner cracks, and embedded flaws in large structural components under repeated block loading the EBV formulation revealed that for the majority of the life there is a linear relationship between (B-Bi)/(Bf–Bi) and (a) (= 1- ln(a/af)/ ln(ai/af)). To further evaluate the EBV the coupon test program undertaken to study the fatigue behaviour of 7050-T7451 aluminium alloy under a spectrum obtained from the operational strain data from a RAAF fleet aircraft is considered, see [1]. The resultant non-dimensional crack growth history for specimens KDE10, KD1R23, KD1P24, and KS1G29 are shown in Figure 10. Wanhill [85] also presented data on 7050-T736 tested under FALSTAFF (generic fighter wing root spectrum) and MiniTWIST (generic transport wing root spectrum) flight spectra and the resultant non-dimensional plots are also shown in Figure 10, where they are referred to as FALSTAFF and MiniTWIST respectively. Figure 10 also shows the crack growth data presented by Hsu, Chan and Yu [86], which is labelled 7050 OL, for cracking in a 76.2 mm wide, 356 mm long, and 6 mm thick centre cracked 7050-T76 panel tested with overloads. Here the specimen was tested under repeated block loading where each block consisted of 2500 cycles of constant amplitude loading, with a peak stress of 62.7 MPa and R = 0.05, followed by a single 150% overload (OL). Figure 10 reveals that each test series collapses to essentially the same near linear relationship between (a) and the non-dimensional fatigue life (B-Bi)/(Bf–Bi ), i.e. cracking conforms to Equations (3) and (5). To further illustrate the ability of Equation (3) to represent cracking in 7050 series aluminium Figure 11 shows that the measured [86] and computed crack length histories, are in excellent
agreement. The computed results were obtained using C = 4.2 10-12, = 3, da/dBo = 0, and Kc = 79 MPa √m for the 7050-T76 M(T) test
~
[86][87] described above. This methodology can be compared with that used in the crack closure analysis presented in [86][87], which also gave a crack length history that was in excellent agreement with the measured data. The formulation used in [86][87] had five constants and an additional constraint parameter . Hsu, Chan and Yu [86][87], however, found that to reproduce the measured crack length history the parameter needed to be (almost continuously) changed with the crack length, and thus the crack growth rate, increased. A value of = 2.4 was used when the crack length was such that da/dN was less than 1.23 x10⁻³ mm/cycle. A value of = 1.1 was used for da/dN values greater than 0.01016 mm/cycle. Between these two functional fits the a versus Keff relationship was log-linearly interpolated, see [87]. Furthermore, as stated in [87], this relationship was arrived at by trial-and-error. Hsu, Chan and Yu [86] then used this methodology to predict crack growth in 12.7 mm and 6.35 mm thick 7050-T7452 hand forgings under a representative flight spectrum. Unfortunately, in these cases this “calibrated” approach yielded poor results, see Figure 12, and another approach for constructing a da/dN versus ΔKeff relationship had to be adopted [86]. This means that to fit the experimental data Hsu, Chan and Yu [86][87] needed to mimic a non-similitude law, i.e. they made da/dN dependent on both Kmax, K and da/dN (and hence on a). The resultant da/dN versus Keff relationships used in their analyses were thus constructs and not true, experimentally- measured curves. In contrast the analysis presented using the EBV formulation is both simpler and more transparent. It only has three constants
21

DSTO-RR-0350
C~
, and Kc which are true constants in that their values are kept constant throughout the analysis, Unlike crack closure-based analyses where the parameters can be manipulated to produce
results close to the experimental data the constants C* (and C ) and in the Generalised Frost-Dugdale and the EBV analysis can not be arbitrarily massaged in order to fit the data without compromising the fit to the entire crack growth history. Furthermore, when the crack length is small so that Kmax is small in comparison with Kc the term 1/(1- Kmax /Kc) on the right hand side of Equation (3) has only a small effect on the initial crack growth rate (da/dN).
Consequently the values of and can be estimated from the initial crack length history. In this respect the Generalised Frost-Dugdale model should either work or not at all
~
C~
10, and the representation is obtained with fewer constants used in the analysis.
0
0.2
0.4
0.6
0.8
1
0 0.2 0.4 0.6 0.8 1 (B-Bi)/(Bf-Bi) Non dimensional fatigue life
a
MiniTwist test 1MiniTwist test 2MiniTwist test 3Falstaff test 1Falstaff test 2Falstaff test 3Plate KDE10Plate KD1R23Plate KD1P24Plate KDS1G297050 OL
Figure 10: Non-dimensional representation of cracking in 7050 series aluminium alloys, adapted from
data in [1][85][86]
10 The authors are not currently aware of a case where this may be so.
22

DSTO-RR-0350
1
10
100
0 10000 20000 30000 40000 50000 60000 70000 80000 90000Cycles
a (m
m)
ExperimentComputed
Figure 11: Measured data from [87], and computed crack length histories for cracking in 7050-T76
under repeated constant amplitude plus overload block loading
1
10
100
0 5000 10000 15000 20000 25000
Load Blocks
a (m
m)
6.35 thick12.7 mm thickCalibrated FASTRAN
Figure 12: Comparison of crack growth curves with calibrated FASTRAN predictions, taken from
[86], for crack growth in 7050-T7452 under flight loads
23

DSTO-RR-0350
6. Determining the Constants in the Generalised Frost-Dugdale Model for Short Cracks
In the previous sections it was mentioned that the Generalised Frost-Dugdale model has been shown to accurately represent crack growth, in a range of materials, under a number of representative flight spectra (additional examples are given in the Appendix A). The accuracy of any representation is strongly dependent on the value of the constants used in these predictions. In the case of the Generalised Frost-Dugdale model the methodology for determining the associated constants is presently spread across several publications and has not yet been sufficiently well drawn together. Consequently it should be noted that when performing a cycle by cycle analysis for a problem which experiences repeated block loading, where each block consists of a number of variable amplitude load cycles, and where there are a large number of blocks to failure it should be stressed that it is only necessary to use a single value (the Region I value) of C* as per [4][7][9][13][17]. Indeed, a single value of C* can be used to predict crack growth (up to near failure) in both D6ac steel [4][17][18] and Mil Annealed Ti-6Al-4V [10][11][18]. This behaviour, that under constant amplitude loading crack growth can be characterised by a single value of C*, does not hold for all aluminium alloys. In this context it should be noted that Liu [88] in his 1961 paper was the first to show that for aluminium alloys the value of the Frost-Dugdale constant for crack growth under constant amplitude loading was different in Regions I and II, i.e. the slope differed in these two regions. As mentioned above this bi-linearity is not seen in D6ac steel or in Mil Annealed Ti-6Al-4V, see Figure 3 and [10][11][17][18]. The question of how to determine the constants in the Generalised Frost-Dugdale model is
addressed next. There are several possible methods for determining the values of and C*, two of which are:
C~
Method 1) By integrating the Generalised Frost - Dugdale model, i.e. Equations (1) or (3)
depending on whether the problem is to be analysed on a cycle by cycle basis or using the EBV formulation, and choosing the constants in the crack growth model to best represent the crack length versus cycles history.
This was the method used in Section 5.1 when analysing crack growth in 7050-T76.
Method 2) By differentiating the crack length versus cycles history and plotting either da/dN
against a(1-/2) (K)/(1-Kmax/Kc), or da/dB against a(1-/2) Kmax/(1-Kmax/Kc)
depending on whether a cycle by cycle basis or an EBV approach is being used. These approaches should be equivalent provided that the experimental measurement errors associated with the crack length are small, that there are sufficient measurements so that the values of da/dN (or da/dBlock) can be accurately determined, and that any artificially induced starter flaw does not overly influence the Region I crack growth.
24

DSTO-RR-0350
For constant amplitude loading the measurement errors associated with small cracks are often quite large and the nature of the initial defect/discontinuity can significantly influence the initial crack growth behaviour. Fortunately, under variable amplitude loading the markers on the crack front left as a result of overloads/underloads or the blocks themselves can be used to calibrate the data and provide a physical checkpoint [89]. For constant amplitude loading Barter and Wanhill [89] have suggested creating marker bands by interspersing the constant amplitude loads with a small number of constant amplitude cycles which have the same max
but a larger R ratio. The paper by White et al. [84] revealed that for crack growth in 7050-T7451 aluminium the mechanisms underpinning crack growth under variable amplitude load can differ from those seen under constant amplitude loading. This finding was subsequently confirmed by Barter
and Wanhill [89]. As a result it is recommended that the values of C and C* are determined from crack growth data obtained from simple surface, or edge, flaw specimens, tested under the spectrum of interest where the cracks are allowed to develop naturally, i.e. there is no artificial initial flaw. In this case either Methods 1) or 2) can (generally) be used. To ensure that the correct value of is obtained tests should ideally be performed at several different maximum stress (i.e. scale) levels as was done for some programs described in
~
[1] and the crack length history should be determined via quantitative fractography as per [89]. Of these two approaches to determining the constants in the Generalised Frost- Dugdale model the authors recommend the first, i.e. Method 1), since for small cracks differentiation of the crack length (a) with respect to N can introduce unwanted errors which can result in poor
estimates for C*, or for when determining the constants in the EBV formulation. The problems associated with Method 2) are evident in the report by Walker and Hu
C~
[90]. 6.1 Cracking in 7050-T7451 aluminium alloy under Mini-FALSTAFF loading
As mentioned above the two methods discussed should be equivalent provided that the experimental measurement errors associated with the crack length are small. To illustrate this the test coupon program results which are presented in [1] is considered, in which the specimens made from a 7050-T7451 aluminium alloy plate were intended to represent the “mould line flange” on the F/A-18 FS488 wing attachment carry-through bulkhead. These specimens, which were 125 mm long, 6.35 mm thick and had a working section of 25 mm, were tested under a Mini-FALSTAFF load spectrum with a peak stress of 390 MPa. The specimens developed surface cracks and the resulting crack depth histories are presented in Figure 13. Figure 13 also shows the crack depth versus blocks history predicted using Method 1). The
value of (= 2.05 10-9) was determined by integrating Equation (3) using the crack growth computer program NEi-Life-3D, which uses the stress field from an NEi-NASTRAN finite element model of the component to determine the stress intensity factors and then calculates
the component’s life using Equation (3), and adjusting the value of C until the time to grow from an initial depth of 0.0072 mm up to a depth of 0.237 mm matched the experimentally measured time for specimen KY48. Figure 13 also shows the associated predicted crack growth histories for two different test specimens KY51 and KY13. In this study the flaw was
C~
~
25

DSTO-RR-0350
assumed to be a semi-elliptical surface crack and the aspect ratio of the flaw was allowed to change during crack growth. These results illustrate the finding stated above that, when modelling cracking under repeated block loading where there are a large number of blocks to
failure, only one value of is C required. ~
To validate this analysis, Figure 13 also presents a prediction performed by integrating Equation (3) using the commercially available computer program Maple, a product of Maplesoft (Canada), which utilises symbolic logic to solve mathematical problems. In this study the initial flaw was assumed to be a 0.0072 mm radius semi-circular surface crack. It was also assumed that the crack remained semi-circular throughout the test. This
(approximate) approach yielded a value of C ~1.34 10-9 which was obtained as outlined above by matching the time to grow from a 0.0072 mm deep flaw to a depth of 0.237 mm. In each case the predicted and the measured crack depth histories are in good agreement.
~
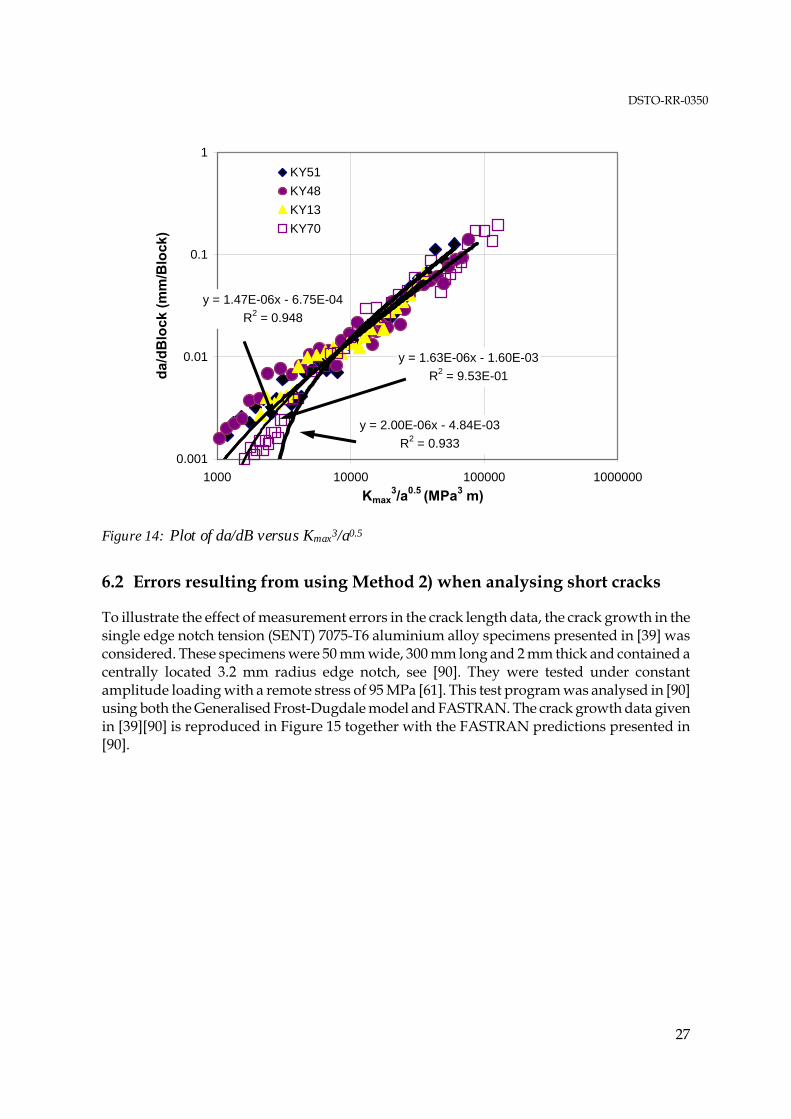
Method 2) was then used to determine the value of C and Figure 14 presents a plot of da/dB versus Kmax3/a0.5 for each of the four specimen tests. A regression analysis of the data
associated with each of these four tests yielded values of C that lay in the range
~1.50 10-9 < C < ~2.0 10-9.
~
~
~
It is thus clear that in this case the two methods are (essentially) equivalent. However, as we will now see when there is a significant error level in the experimental measurements this is not always the case.
y = 0.00714e0.129E-01x
R2 = 1.00
0.001
0.01
0.1
1
10
0 10 20 30 40 50 60
Blocks
a (m
m) KY51
KY51 PredictedKY13KY13 PredictedKY70KY48MaplePredicted KY 48
Figure 13: Measured [1] and predicted crack depth histories under Mini-FALSTAFF loading
26
DSTO-RR-0350
y = 2.00E-06x - 4.84E-03R2 = 0.933
y = 1.47E-06x - 6.75E-04R2 = 0.948
y = 1.63E-06x - 1.60E-03R2 = 9.53E-01
0.001
0.01
0.1
1
1000 10000 100000 1000000Kmax
3/a0.5 (MPa3 m)
da
/dB
loc
k (
mm
/Blo
ck)
KY51KY48KY13KY70
Figure 14: Plot of da/dB versus Kmax3/a0.5
6.2 Errors resulting from using Method 2) when analysing short cracks
To illustrate the effect of measurement errors in the crack length data, the crack growth in the single edge notch tension (SENT) 7075-T6 aluminium alloy specimens presented in [39] was considered. These specimens were 50 mm wide, 300 mm long and 2 mm thick and contained a centrally located 3.2 mm radius edge notch, see [90]. They were tested under constant amplitude loading with a remote stress of 95 MPa [61]. This test program was analysed in [90] using both the Generalised Frost-Dugdale model and FASTRAN. The crack growth data given in [39][90] is reproduced in Figure 15 together with the FASTRAN predictions presented in [90].
27

DSTO-RR-0350
0.01
0.1
1
0 20000 40000 60000 80000 100000
Cycles
2a (
mm
)Expt 1Expt 2Expt 3Expt 4Expt 5Expt 6FASTRANComputed 1Computed 2Computed 3Computed 4Computed 5
Figure 15: Measured and predicted 7075-T6, R= -1 short crack data from [39][90]. It can be seen that
the final life of each coupon is a function of the initiating discontinuity size.
In this case p = 0.25 and as per [90] = 3. Following Method 1) C* was determined from the experimental data set labelled “Expt 4” in Figure 15. This yielded a value for C* of approximately 1.2 x 10⁻¹². These values were then used to compute the other resultant crack length histories. As in [90] Figure 15 plots the total crack length (2a) history curves (Note that in this data set crack growth is essentially only in Region I.) From this figure it is clear that the computed crack length histories are in reasonably good agreement with the measured data and that they are a slightly superior representation of the crack length history than the FASTRAN analysis presented in [90]. In this example [90] used Method 2) and quoted two different values for C* depending on how the data was analysed, viz: 1.7864 x 10⁻¹³, and 5.0483 x 10⁻¹³. Both values differ significantly from that determined using Method 1). As a result, unlike the crack length versus cycles history obtained using Method 1), the C* predictions given in [90] were quite poor. Here it should be noted that the R2 values given in [90] for these fits were low, ~0.607 and 0.626 respectively, indicating a poor fit to the data. This example illustrates the problems that can arise when using Method 2) to determine the
value of C* or C~
when the experimental data has a reasonable amount of scatter. As such it highlights the fact that when the crack length is small and the associated measurement errors are relatively large, as is the case in the experimental data presented in Figure 15, then
28
DSTO-RR-0350
differentiation of the crack length with respect to the number of cycles can introduce
unwanted errors and can result in erroneous values for C*. The best value(s) of C* and C~
are clearly those that reproduce (as closely as possible) the crack length versus cycles history.
7. Areas for Further Research
As a result of this review it is clear that there are a range of areas that need further investigation, viz:
a) There is a scarcity of valid data on short crack growth in Region I in F/A-18 materials, i.e. for 7050 series aluminium alloys, and Mil Annealed Ti-6Al-4V, where N, Kmax, K, and a are known. As such attention should be paid to additional testing that is focused specifically on short crack Region I data. Note both materials are applicable to both the F/A-18 Hornet and the Super Hornet.
b) For 7050-T7451 the “short crack” effect appears to be due to the attempt to link the crack growth rate to quantities related solely to the stress intensity factor. This finding needs further study, particularly with respect to cracking in 7050-T7451 and Mil Annealed Ti-6AL-4V.
c) Research is needed into the types of tests required to determine valid Region I crack growth data, and how the associated test results can be interpreted so as to provide information that can be used to confidently predict the growth of small cracks and the associated threshold stress intensity factor(s) under operational loading.
d) Whilst the Generalised Frost-Dugdale model has been used to accurately predict crack growth at stress concentrators [7] and for problems where there was a large variation in the beta factors as the crack grew [19] the problem of the growth of short cracks at a stress concentrator under representative F/A-18 spectra needs further investigation.
e) The ability to represent the growth of short cracks under compression dominated spectra needs to be evaluated.
f) The conclusion reached in [59] that the stress intensity factor does not always adequately describe the state of stress about the tip of a crack appears to be confirmed by the short crack test data. This in-turn implies that long crack da/dN versus ΔK data cannot be used to predict short crack growth. For materials that exhibit a fatigue threshold ΔKth that varies with the specimen geometry it may be able to relate ΔKth to the constant term in the series expansion for the local stress field associated with the specimen geometry.
g) The role of sequence effects on cracking under representative flight spectra requires further investigation.
h) Standards for determining the constants in the EBV formulation are required.
i) The link between EBV and the equivalent block approach (EBA) [68] -[70] for modeling crack growth under variable amplitude loading should be established and bounds on these approaches delineated.
29

DSTO-RR-0350
8. Discussion
This report has revealed that:
It follows from the crack length versus flight hours data presented in [1][2] that, for cracking in 7050 series alloys and Mil Annealed Ti-6Al-4V under representative F/A-18 load spectra, most of the fatigue life is consumed in short crack growth.
There is a scarcity of validated data for short crack growth in Region I.
For 7050-T7451 the da/dN versus K data presented in this report supports the NASA finding that the Region I data appears to be a function of the test geometry.
As a result both long and short crack Region I da/dN versus K data should be viewed with a healthy degree of scepticism. Furthermore, the NASA finding that the Region I da/dN versus K data appears to be a function of the test method raises severe doubts on the fundamental science underpinning the use of similitude based crack growth laws for the analysis of short crack growth.
The conclusion that the stress intensity factor does not always adequately describe the state of stress about the tip of a crack appears to be confirmed by the short crack behaviour of 7050-T7451. This in-turn implies that long crack da/dN versus ΔK data should not be used to predict short crack growth.
For 7050-T7451 the “short crack” effect appears to be due to the attempt to link the crack growth rate to quantities related solely to the stress intensity factor.
The DSTO long crack CT and MT test data and the current short crack tests data, when expressed in terms of the Generalised Frost-Dugdale model, essentially coincide.
Mil Annealed Ti-6Al-4V titanium appears to have a weak R ratio dependency. As such crack closure approaches cannot be expected to represent crack growth in this material.
Cracking in 7050-T7451 and Mil Annealed Ti-6Al-4V titanium appears to follow the Generalised Frost-Dugdale model.
The EBV approach is able to accurately compute the crack growth history for a reasonably wide range of load spectra and materials.
Unlike FASTRAN and AFGROW analyses where the Region I crack growth parameters can be manipulated to produce results close to the experimental data, the constants in the Generalised Frost-Dugdale model cannot be arbitrarily adjusted in order to fit the data without compromising the fit to the entire crack growth history.
30

DSTO-RR-0350
9. Conclusion
This report has attempted to review, discuss progress and define problem areas associated with the use of the Generalised Frost-Dugdale model for predicting (short) crack growth in F/A-18 Hornet metallic structural materials. It has also attempted to briefly address related problem areas associated with characterising crack growth in Region I. As a result of this review it has been shown that the science base underpinning similitude and crack closure based crack growth models is often at odds with material behaviour. Consequently, given that linear elastic fracture mechanics studies have shown that for short cracks K dominance is lost, alternative crack growth formulations should be further investigated. In this context it was shown that the Generalised Frost-Dugdale model can address crack growth in both 7050-T7451 aluminium alloy, and Mil Annealed Ti-6AL-4V. Furthermore, preliminary short crack tests suggest that for 7050-T7451 the short crack effect arises as a consequence of attempting to relate da/dN to ΔK. This report has recommended how to best determine the constants in the Generalised Frost-Dugdale model and has recommended the use of simple surface flaw test specimens subjected to the loading spectrum of interest where the initial flaws are allowed to develop naturally. This approach is important because for combat aircraft most of the life is generally consumed in the growth of these (naturally occurring) short cracks. The report also recommends further research to establish bounds on the usefulness of the Generalised Frost-Dugdale model. The results of this work will assist in the development of robust fatigue assessment tools in support of maintaining airworthiness in the RAAF fleets.
10. Acknowledgements
This report meets the deliverable requirements of task CoE-SM-2008-01. The authors would like to acknowledge the assistance of Dr. Scott Forth, Chairman of the Fracture Control Board, NASA Johnson Space Centre, Houston, Texas, Dr. Simon Barter and Dr. Wyman Zhuang, DSTO, GPCAPT John Baker (retired), Dr. Bob Farahmand, Chief Scientist, TASS Inc, Seattle, USA, and Professor Chris Rodopolous, University of Patras, Greece, and the University of Sheffield Hallam, UK.
31

DSTO-RR-0350
11. References
[1] Molent L, Sun Q, Green AJ. The F/A-18 fatigue crack growth data compendium, DSTO-TR-1677, Feb 2005.
[2] Zhuang, W., Barter, S., Molent, L., Flight-by-flight fatigue crack growth life assessment, International Journal of Fatigue 29 (2007), 1647-1657.
[3] Molent L., Singh R. and Woolsey J., A method for evaluation of in-service fatigue cracks, Engineering Failure Analysis 12 (2005) 13–24.
[4] Jones R., Molent L, and Pitt S., Crack growth from small flaws, International Journal of Fatigue, Volume 29, (2007), pp 1658-1667.
[5] Newman, J. C., FASTRAN-II – A Fatigue Crack Growth Structural Analysis Program, NASA Technical Memorandum 104159, February 1992.
[6] Harter, J. A., AFGROW Users Guide and Technical Manual, Air Vehicles Directorate, Air Force Research Laboratory OH, AFRL-VA-WP-TR-2004-XXXX, June 2004.
[7] Jones R., Pitt S. and Peng D, The Generalised Frost–Dugdale approach to modelling fatigue crack growth, Engineering Failure Analysis, Volume 15, (2008), pp 1130-1149.
[8] Jones R., Molent L., Pitt S., Similitude and the Paris crack growth law, International Journal of Fatigue 30 (2008) 1873–1880.
[9] Jones R, Molent L, Pitt S, and Siores E., Recent developments in fatigue crack growth modelling, Proceedings 16th European Conference on Fracture, Alexandropoulos, Greece, July 2006.
[10] Jones R., Farahmand B. and Rodopoulos C., Fatigue crack growth discrepancies with stress ratio, Theoretical and Applied Fracture Mechanics, (2009), Volume 51, Issue 1, pp 1-10.
[11] Jones R. and Peng D., Tools for assessing the damage tolerance of primary structural components, Virtual Testing and Predictive Modelling: Fatigue and Fracture Mechanics Allowables, Edited by B. Farahmand, Springer, 2009.
[12] Jones R, Chen B. and Pitt S., Similitude: cracking in steels, Theoretical and Applied Fracture Mechanics, Volume 48, Issue 2, (2007), pp 161-168.
[13] Jones R., Wallbrink C., Pitt S. and Molent L., A Multi-scale approach to crack growth, Proceedings Mesomechanics 2006: Multiscale Behaviour Of Materials And Structures: Analytical, Numerical And Experimental Simulation, Porto, Portugal, 19-22 July 2006.
[14] Jones R., Molent L. and Krishnapillai K., An equivalent block method for computing fatigue crack growth, International Journal of Fatigue 30 (2008) 1529–1542.
[15] Jones R., Pitt S., and Peng D., An Equivalent block approach to crack growth, Multiscale Fatigue Crack Initiation and Propagation of Engineering Materials: Structural Integrity and Microstructural Worthiness, ISBN 978-1-4020-8519, Edited by G. C. Sih, Springer Press, June 2008.
[16] Molent L., Barter S. and Jones R., Some Practical Implications of Exponential Crack Growth, Multiscale Fatigue Crack Initiation and Propagation of Engineering Materials:
32

DSTO-RR-0350
Structural Integrity and Microstructural Worthiness, ISBN 978-1-4020-8519-2, Edited by G. C. Sih, Springer Press, June 2008.
[17] Jones R. and Forth SC., Cracking in D6ac Steel, Proceedings International Conference on Fracture, Ottawa, 2009.
[18] Jones R., Peng D. and Pitt S., Thoughts on the physical processes underpinning crack growth, Fatigue and Fracture of Engineering Materials and Structures, (Invited Review Paper), 2009.
[19] Tiong UH., Jones R., Damage tolerance analysis of a helicopter component, Int. J. Fatigue, International Journal of Fatigue, 31, 6, (2009), pp 1046-1053.
[20] Frost N.E., Dugdale D.S., The propagation of fatigue cracks in test specimens, Journal Mechanics and Physics of Solids, 6, (1958), pp 92-110.
[21] Barter S, Molent L, Goldsmith N and Jones R. An experimental evaluation of fatigue crack growth. Engng Fail Anal, 12/1, (2005), pp 99-128.
[22] Forth SC., The purpose of generating fatigue crack growth threshold data, NASA Johnson Space Center, available on line at http://ntrs.nasa.gov/
[23] Vecchio RS., Crompton JS., Hertzberg DRW., The influence of specimen geometry on near threshold fatigue crack growth, Fatigue Fract. Engng Mater. Struct. 10, 4, (1987), pp. 333-342.
[24] Hutar P., Seitl S. and Knesl Z., Quantification of specimen geometry on the fatigue crack growth response by two parameter fracture mechanics, Materials Science and Engineering A, (2004), pp 491-494.
[25] Miller, K. J., The Behaviour of short fatigue cracks and their initiation. Part I - A review of two recent books. Fatigue and Fracture of Engineering Materials and Structures, (1987), Vol. 10, No. 1: 75-91.
[26] Paris PC, Gomez RE, Anderson WE., A rational analytic theory of fatigue. The Trend in Engineering 1961; 13/1:9-14.
[27] Liu HW., Fatigue crack propagation and applied stress range. ASME Trans., J. Basic Eng. 1963; 85D(1): 116-122.
[28] Paris PC, Erdogan F., Critical analysis of crack growth propagation laws. ASME Trans., J. Basic Eng. 1963; 85D(4):528-534.
[29] Schijve J., Fatigue of structures and materials in the 20th century and the state of the art. International Journal of Fatigue, 25, (2003), 679-702.
[30] Noroozi AH., Glinka G., Lambert S., A two parameter driving force for fatigue crack growth analysis, International Journal of Fatigue, 27, (2005), 1277–1296.
[31] Dinda S., Kujawski D., Correlation and prediction of fatigue crack growth for different R-ratios using Kmax and K+ parameters, Eng Fract Mech 2004; 71: 1779–1790.
[32] Sadananda K, Vasudevan AK., Analysis of fatigue crack closure and threshold, Fracture Mechanics, edited by F. Erdogan, ASTM, STP, (1993), p484-501.
[33] Willenborg J., Engle RM. And Wood H., A crack growth retardation model using an effective stress concept. American Rockwell Technical Report TFR 71-701, LA, USA, 1971.
33

DSTO-RR-0350
[34] Newman JC Jr., FASTRAN-II - A fatigue crack growth structural analysis program, NASA Technical Memorandum 104159, USA, Feb 1992.
[35] Elber W., The significance of fatigue crack closure, Damage Tolerance of Aircraft Structures, ASTM STP-486; 1971: 230-242.
[36] Suresh, S. Fatigue of Materials, Cambridge University Press, UK, 2001.
[37] Pearson S. Initiation of fatigue cracks in commercial aluminium alloys and the subsequent propagation of very short cracks, Engineering Fracture Mechanics, 7, (1975), 235-247.
[38] Lankford, J., The growth of small fatigue cracks in 7075-T6 aluminum. Fatigue and Fracture of Engineering Materials and Structures. 5, 3, (1982), pp 233-248.
[39] Newman, JC., Wu, XR., Venneri, SL., and Li, CG., Small-crack effects in high-strength aluminium alloys, NASA Reference Publication, May 1994.
[40] Schijve J., Fatigue crack growth under variable-amplitude loading, Engineering Fracture Mechanics, Engineering Fracture Mechanics, (1979), pp 20-44.
[41] Schijve J, Fatigue damage in aircraft structures, not wanted, but tolerated?, International Journal of Fatigue (2009) Volume 31, Issue 6, pp998-1011.
[42] Skorupa M., Load interaction effects during fatigue crack growth under variable amplitude loading—a literature review. Part II: qualitative interpretation, Fatigue Fract. Engng. Mater. Struct. 22, (1999), pp 905–926.
[43] Maddox SJ., The effect of mean stress on fatigue crack propagation: A literature review, Int. Journal of Fracture, 11, 3, (1975), pp 389- 408.
[44] Davidson, DL., How fatigue cracks grow, interact with microstructure, and lose similitude, Fatigue and Fracture Mechanics: 27th Volume, ASTM STP 1296, R. S. Piascik, J. C. Newman, and N. E. Dowling, Eds, American Society for Testing and Materials, 1997, pp. 287-300.
[45] Suresh S, Ritchie RO. Propagation of short cracks. Int Metals Reviews 1984; 29(6): pp 445-476.
[46] Miller, KJ. The behaviour of short fatigue cracks and their initiation. Part II - A general summary. Fatigue and Fracture of Engineering Materials and Structures. 10, 1, (1987), 75-91.
[47] Forth S.C., James M.A., Johnston W.M., and Newman, J.C. Jr., Anomalous fatigue crack growth phenomena in high-strength steel, Proceedings Int. Congress on Fracture, Italy, 2005.
[48] Sih GC., Crack tip mechanics based on progressive damage of arrow: Hierarchy of singularities and multiscale segments, Theoretical and Applied Fracture Mechanics 51, (2009),11–32.
[49] Sih GC., Segmented multiscale approach by microscoping and telescoping in material science, in: G.C. Sih (Ed.), Multiscaling in Molecular and Continuum Mechanics: Interaction of Time and Size from Macro to Nano, Springer, 2006, pp. 259–289.
[50] Kardomateas GA., Carlson R.L., Soediono AH. and Schrage D.P., Near tip stress and strain fields for short elastic cracks, International Journal of Fracture, 62, (1993), pp 219-232.
34

DSTO-RR-0350
[51] Griffith AA., The phenomena of rupture and flow in solids. Phil. Trans. R. Soc A, 221, (1921), pp 163-181.
[52] Griffith AA., The theory of rupture. Proc. First Int. Congress of Applied Mechanics, Delft, p. 55, 1924.
[53] Irwin GR, Analysis of stress and strains near the end of a crack traversing a plate. J. Appl. Mech., 79, (1957), pp 361-368.
[54] Irwin GR., Fracture, Encyclopedia of Physics, Band VI, Vol. VI, (Edited by S. Flugge), Springer, Berlin, 1958.
[55] Irwin GR., Fracture Mechanics, in Structural Mechanics. Edited by J. N. Goodier and N. Holt. Pergamon Press, New York, 1960.
[56] Sih, G.C., On the Westergaard method of crack analysis, International Journal of Fracture Mechanics, 2, (1966) p. 628.
[57] Westergaard, H.M., Bearing pressure and cracks. Journal of Applied Mechanics, 1939, 6: pp. A49-A53.
[58] Eftis J., Load biaxiality and fracture: A two-sided history of complementing errors. Engng Fracture Mech. 26, (1987), pp 567-592.
[59] Eftis J., Jones DL., and Liebowitz H., Load biaxiality and fracture: Synthesis and summary, Engineering Fracture Mechanics, 36, 4, (1990), pp. 537-574.
[60] Sih GC., Experimental fracture mechanics: Strain energy density criterion, Mechanics of Fracture 7, Edited by G.C. Sih, Martinus Nijhoff, 1972. .
[61] Taylor D., Geometrical effects in fatigue: a unifying theoretical model, International Journal of Fatigue 21 (1999), pp 413–420.
[62] Bellett D., Taylor D., Marco S., Mazzeo E., Guillois J., Pircher T., The fatigue behaviour of three-dimensional stress concentrations, International Journal of Fatigue 27, (2005), pp 207–221.
[63] Ritchie R.O., Knott JF. and Rice JR., On the relationship between critical tensile stress and fracture toughness in mild steel, Journal of the Mechanics and Physics of Solids, 21, (1973), pp 395-410.
[64] Harlin G. and Willis JR., The influence of crack size on the fracture behaviour of short cracks, International Journal of Fracture 42, (1990), 341-355.
[65] Hudak, SJ. Jr., Saxena A., Bucci RJ. and Malcolm RC., Development of standard methods of testing and analyzing fatigue crack growth rate data, AFML-TR-78-40, May 1978.
[66] Forth SC., Urban MR., Fatigue crack growth thresholds for 7050-T7451 aluminum, NASA Johnson Space Centre, Houston, Texas, Private communication. April 2009.
[67] Molent L and Barter SA, A comparison of crack growth behaviour in several full-scale airframe fatigue tests, Int J Fatigue, 29, (2007), pp 1090-1099.
[68] Molent, L., McDonald, M., Barter, S., Jones, R., Evaluation of spectrum fatigue crack growth using variable amplitude data, International Journal of Fatigue, 30, 1, (2007), pp 119-137.
35

DSTO-RR-0350
[69] Wyman, Z and Molent L, Block-by-block approaches for spectrum fatigue crack growth prediction. Engineering Fracture Mechanics 75 (2008) 4933–4947.
[70] Zhuang W.Z., McDonald M, Phillips M and Molent L. Effective block approach for aircraft damage tolerance analyses. Journal of Aircraft Vol. 46, No. 5, September–October 2009.
[71] Forth SC., Newman JC. Jr, Forman RG., On generating fatigue crack growth thresholds, International Journal of Fatigue 25, (2003), pp 9–15.
[72] Gallagher JP. and Stalnaker HD., Developing normalised crack growth curves for tracking damage in aircraft, American Institute of Aeronautics and Astronautics, Journal of Aircraft, 15, 2, (1978), pp 114-120.
[73] Miedlar PC., Berens AP., Gunderson A., and Gallagher JP., Analysis and support initiative for structural technology (ASIST), AFRL-VA-WP-TR-2003-3002.
[74] Barsom JM. and Rolfe ST., Fracture and fatigue control in structures: Applications of fracture Mechanics, Butterworth-Heinemann Press, November 1999.
[75] Miller M., Luthra VK., and Goranson UG., Fatigue crack growth characterization of jet transport structures, Proc. of 14th Symposium of the International Conference on Aeronautical Fatigue (ICAF), Ottawa, Canada, June 10-12, 1987.
[76] Molent L., Sun Q., and Green AJ., Characterisation of equivalent initial flaw sizes in 7050 aluminium alloy, Fatigue Fract Engng Mater Struct 29, (2006), 916–937.
[77] Hudson C. M., Fatigue-crack propagation in several titanium and one superalloy stainless-steel alloys, NASA TN D-2331, October 1964.
[78] Porter TR., Method of analysis and prediction for variable amplitude fatigue crack growth, Eng. Fract. Mech., 4, (1972), pp717-736.
[79] Walker EK. The effect of stress ratio during crack propagation and fatigue for 2024-T3 and 7076-T6 aluminium. In: Effect of Environment and Complex Load History on Fatigue Life, ASTM STP 462, Philadelphia: American Society for Testing and Materials, 1970, pp.1-14.
[80] Bell PD., Creager M., Crack growth analysis for arbitrary spectrum loading, Volume I - Results and discussion, Final Report: June 1972 - October 1974, Technical Report AFFDL-TR-74-129, USA.
[81] Sharp PK., Byrnes R., Clark G., Examination of 7050 fatigue crack growth data and its effect on life prediction, DSTO-TN-0729, Australia,1998.
[82] Finney J., Centre cracked panel tests, Private Communication, Nov. 1992.
[83] Chen F., Jones R. and Barter SA. Crack growth data for 7050-T7451, work in progress, unpublished data.
[84] White P., Barter SA., and Molent L., Observations of crack path changes under simple variable amplitude loading in AA7050-T7451, Int. Journal of Fatigue, 30, (2008) 1267–1278.
[85] Wanhill RJH., Damage tolerance engineering property evaluations of aerospace aluminium alloys with emphasis on fatigue crack growth, NLR TP 94177, 1995.
36

DSTO-RR-0350
[86] Hsu C., Chan KK., and Yu J., Effect of thickness on plasticity induced fatigue crack closure: Analysis and experiment, Advances in Fatigue Crack Closure Measurement and Analysis: Second Volume, ASTM STP 1343, Edited by R. C. McLung and J. C. Newman Jr., ASTM, West Conshohken, PA, pp 285-303, 1999.
[87] Hsu C., Chan KK., and Yu J., Evaluation of closure based crack growth model, Proceedings NASA FAA Symposium on the Continuing Airworthiness of Aircraft Structures, DOT/FAA/AR-97/2, 1, pp 250-266, 1997.
[88] Liu HW. Crack propagation in thin metal sheet under repeated loading, Wright Air Development Center WADC TN 59-383, 1959. Also published as Liu HW. Crack propagation in thin metal sheet under repeated loading, ASME Trans., J. Basic Eng. 1961; 83D(1): pp 23-31.
[89] Barter SA. and Wanhill R., Marker loads for quantitative fractography (QF) of fatigue in aerospace alloys, NLR-TR-2008-644, November 2008.
[90] Walker KF. and Hu W., Evaluation of the C Star model for addressing short fatigue crack growth, DSTO-TR-1825, October 2008.
[91] Dill HD. and Saff CR., Effect of fighter attack spectrum on crack growth, AFFDLTR-76-112, Air Force Flight Dynamics Laboratory (FBE), Wright-Patterson Air Force Base, March 1977.
37

DSTO-RR-0350
Appendix A: Effects of Fighter Attack Spectrum on Crack Growth
Dill and Saff [91] conducted an extensive test program to systematically evaluate the effect of variations in flight stress spectra on crack propagation. The specimen used for the spectrum tests was a 7075-T7351 aluminium alloy with a thru-thickness crack emanating from an open hole, see Figure A1. Electrical discharge machined starter notches were introduced at each pilot hole located as shown in Figure A2. The specimens were pre-cracked at a stress ratio of 0.02 and peak cyclic stress of 10 ksi (68.94 MPa) until the visible length of the longer of the two cracks was 0.05 inches (1.27 mm). Subsequently, the pilot holes were reamed to a diameter of .2500 inches (6.35 mm). The pre-crack geometry was measured and recorded. This procedure left a fatigue pre-crack of approximately 0.48 mm emanating from one of the holes in the specimen. The specimens were tested under a number of baseline spectra, which were based on the planned operational usage for the F-15 aircraft. Each of the baseline spectra represented 1000 hours of anticipated usage. The spectra analysed in this section are:
Air-to-Air - The Air-to-Air (A-A) Baseline spectrum represented 1000 hours of air-to-air combat flying. The spectrum consisted of 768 air-to-air missions.
Air-to-Ground - The Air-to-Ground (A-G) Baseline spectrum represented 1000 hours of air-to-ground combat flying. The spectrum consisted of 1092 airto-ground missions.
Instrumentation and Navigation - The Instrumentation and Navigation Baseline (INB) spectrum represented 1000 hours of instrumentation and navigation flying. The spectrum consisted of 480 instrumentation and navigation missions.
Composite - The Composite Baseline (CB) spectrum represented 1000 hours of A-A, A-G, and I&N flying. This spectrum consisted of: 475 hours of A-A (= 365 A-A missions), 325 hours of A-G (= 355 A-G missions) and 200 hours of I&N( = 96 I&N missions).
38
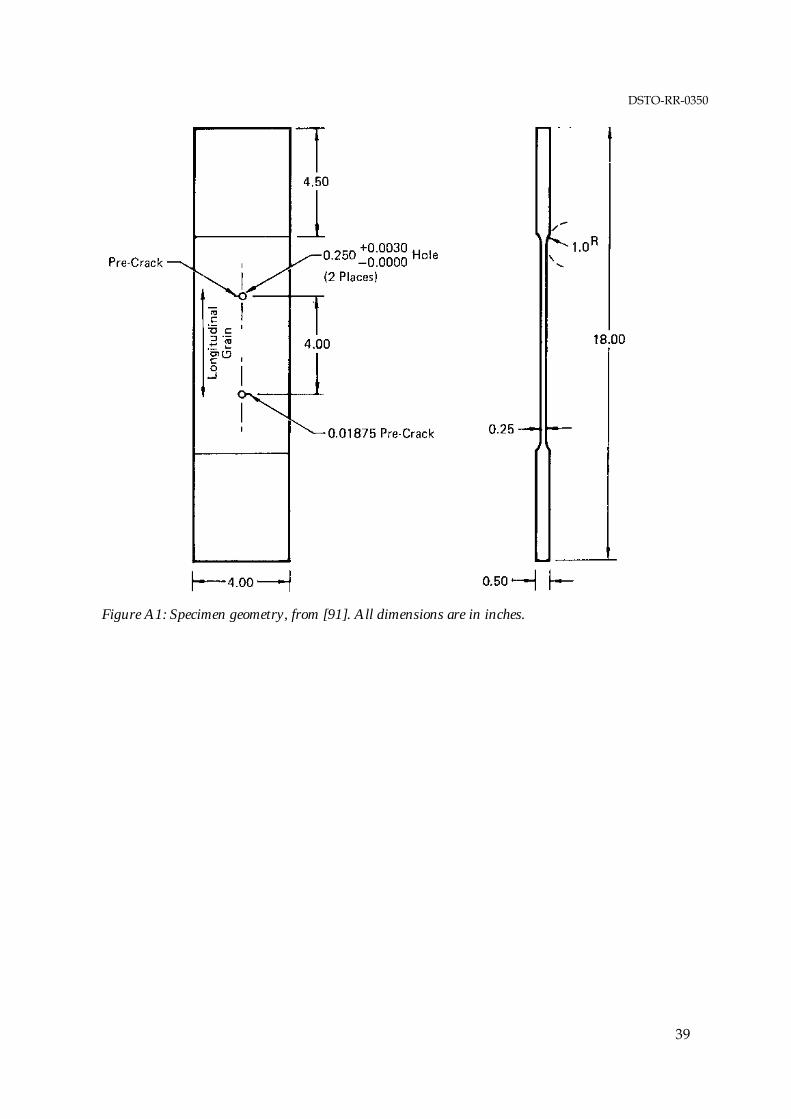
DSTO-RR-0350
Figure A1: Specimen geometry, from [91]. All dimensions are in inches.
39

DSTO-RR-0350
Figure A2: Starter crack details for the open hole specimen, from [91]
Tests were also performed on variations of the Composite Baseline spectrum, viz:
1. Truncation Variation 6, where the loads in the spectrum were reordered.
2. Truncation Variation 5, where the low load level cycles were eliminated by truncating the Composite Baseline at 55% of the design limit stress (DLS).
3. Combined Variation 4, which had more severe Air-to-Air missions.
In each case the agreement between the measured and the crack length histories computed
using Equation (3) with the values of C~
, and Kc as given in Table A1 is quite good, see Figures A3 to A7. Here the effect of the hole in the expression for K is accounted for via the associated beta function.
40
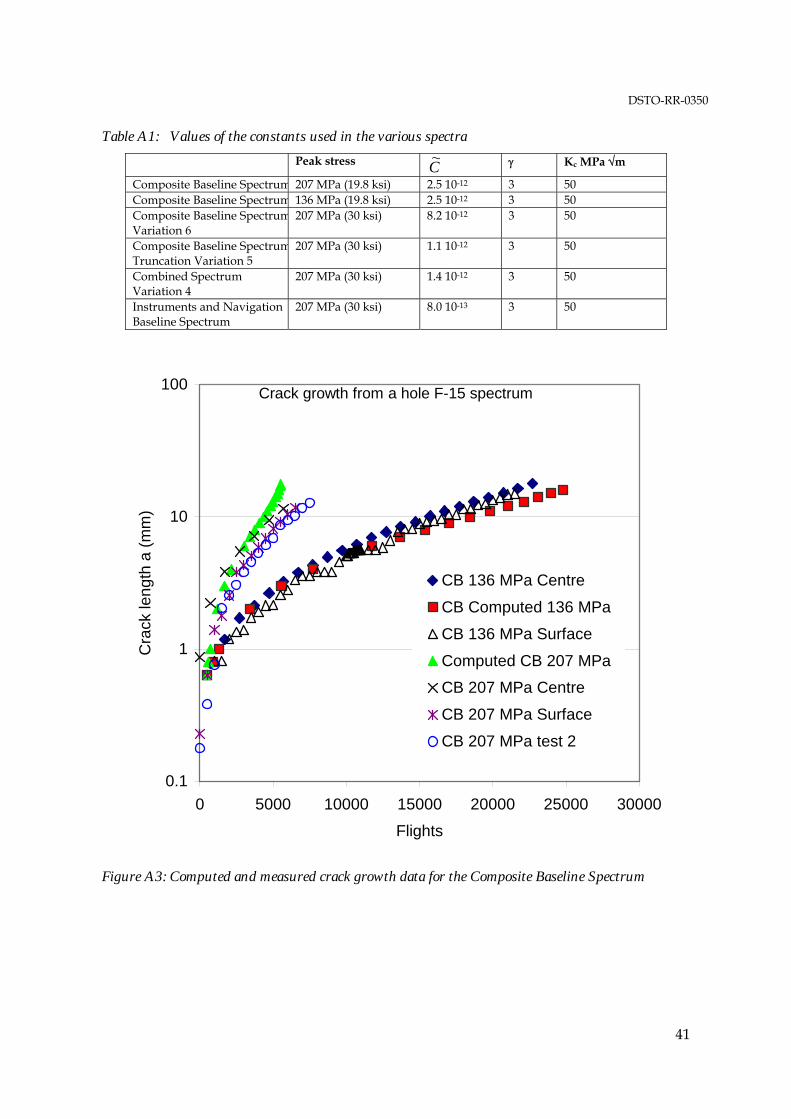
DSTO-RR-0350
Table A1: Values of the constants used in the various spectra
Peak stress C~
Kc MPa m
Composite Baseline Spectrum 207 MPa (19.8 ksi) 2.5 10-12 3 50 Composite Baseline Spectrum 136 MPa (19.8 ksi) 2.5 10-12 3 50 Composite Baseline SpectrumVariation 6
207 MPa (30 ksi) 8.2 10-12 3 50
Composite Baseline SpectrumTruncation Variation 5
207 MPa (30 ksi) 1.1 10-12 3 50
Combined Spectrum Variation 4
207 MPa (30 ksi) 1.4 10-12 3 50
Instruments and Navigation Baseline Spectrum
207 MPa (30 ksi) 8.0 10-13 3 50
Crack growth from a hole F-15 spectrum
0.1
1
10
100
0 5000 10000 15000 20000 25000 30000
Flights
Cra
ck le
ngth
a (m
m)
CB 136 MPa Centre
CB Computed 136 MPa
CB 136 MPa Surface
Computed CB 207 MPa
CB 207 MPa Centre
CB 207 MPa Surface
CB 207 MPa test 2
Figure A3: Computed and measured crack growth data for the Composite Baseline Spectrum
41

DSTO-RR-0350
1
10
100
0 1000 2000 3000 4000 5000Flight Hours
Cra
ck le
ngth
a (m
m)
F-15 Composite spectrum Variation 6 Side A
Computed
F-15 Composite spectrum Variation 6 Side B
Figure A4: Computed and measured crack growth data for Variation 6 of the Composite Baseline
Spectrum
42

DSTO-RR-0350
0.1
1
10
100
0 2000 4000 6000 8000 10000
Flight hours
Cra
ck le
ngth
a (m
m)
Truncation Variation 5Computed
Figure A5: Computed and measured crack growth data for Truncation Variation 5 of the Composite
Baseline Spectrum
43

DSTO-RR-0350
0.1
1
10
100
0 1000 2000 3000 4000 5000 6000 7000 8000Flight hours
Cra
ck le
ngth
a (m
m)
Combined Variation 4Computed
Figure A6: Computed and measured crack growth data for the Combined Baseline Spectrum
Variation 4
44

DSTO-RR-0350
45
0.1
1
10
100
0 20000 40000 60000 80000 100000
Flight hours
Cra
ck le
ngth
a (m
m)
INS 207 MPA
Computed INS 207 MPa
Figure A7: Computed and measured crack growth data for the INS Baseline Spectrum

Page classification: UNCLASSIFIED
DEFENCE SCIENCE AND TECHNOLOGY ORGANISATION
DOCUMENT CONTROL DATA 1. PRIVACY MARKING/CAVEAT (OF DOCUMENT)
2. TITLE Critical Review of the Generalised Frost-Dugdale Approach to Crack Growth in F/A-18 Hornet Structural Materials
3. SECURITY CLASSIFICATION (FOR UNCLASSIFIED REPORTS THAT ARE LIMITED RELEASE USE (L) NEXT TO DOCUMENT CLASSIFICATION) Document (U) Title (U) Abstract (U)
4. AUTHOR(S) R. Jones and L. Molent
5. CORPORATE AUTHOR DSTO Defence Science and Technology Organisation 506 Lorimer St Fishermans Bend Victoria 3207 Australia
6a. DSTO NUMBER DSTO-RR-0350
6b. AR NUMBER AR-014-719
6c. TYPE OF REPORT Research Report
7. DOCUMENT DATE March 2010
8. FILE NUMBER 2009/1136537
9. TASK NUMBER AIR 07/048
10. TASK SPONSOR DGTA
11. NO. OF PAGES 45
12. NO. OF REFERENCES 91
13. URL on the World Wide Web http://www.dsto.defence.gov.au/corporate/reports/DSTO-RR-0350.pdf
14. RELEASE AUTHORITY Chief, Air Vehicles Division
15. SECONDARY RELEASE STATEMENT OF THIS DOCUMENT
Approved for public release OVERSEAS ENQUIRIES OUTSIDE STATED LIMITATIONS SHOULD BE REFERRED THROUGH DOCUMENT EXCHANGE, PO BOX 1500, EDINBURGH, SA 5111 16. DELIBERATE ANNOUNCEMENT No Limitations 17. CITATION IN OTHER DOCUMENTS Yes 18. DSTO RESEARCH LIBRARY THESAURUS http://web-vic.dsto.defence.gov.au/workareas/library/resources/dsto_thesaurus.shtml Fatigue tests, crack propagation, fractography, aluminium alloys, F/A-18 aircraft, military aircraft, wings, aircraft fatigue 19. ABSTRACT The F/A-18 Hornet is one of the ADF's premier defence assets. It utilises a highly optimised metallic structure to assist in achieving its performance objectives. Thus the structure (particularly the fracture critical wing attachment bulkheads or the "centre barrel") is uniformly highly stressed and thus susceptible to fatigue cracking. In order to help assess the fatigue critical regions of the aircraft it is essential that the tools used to predict/assess fatigue crack growth are consistent with the known fatigue behaviour of the F/A-18 materials. This report provides a critical review of the current state of knowledge with respect to the use of the Generalised Frost-Dugdale model for assessing fatigue crack growth in F/A-18 structural metallic materials and evaluates the need for further research in this area.
Page classification: UNCLASSIFIED