critical materials for low-carbon infrastructure: the ... purnell.pdf · phil purnell (iri, school...
TRANSCRIPT
School of something FACULTY OF OTHER
SRI and iRI FACULTIES OF ENVIRONMENT and ENGINEERING
Earth Systems Engineering Symposium, U Newcastle 3-5 July 2012
Critical materials for low-carbon
infrastructure: the analysis of local vs
global properties
Phil Purnell (iRI, School of Civil Engineering)
Katy Roelich (iRI & SRI, School of Earth & Environment)
Julia Steinberger (SRI)
David Dawson (iRI), Jonathan Busch (SRI)
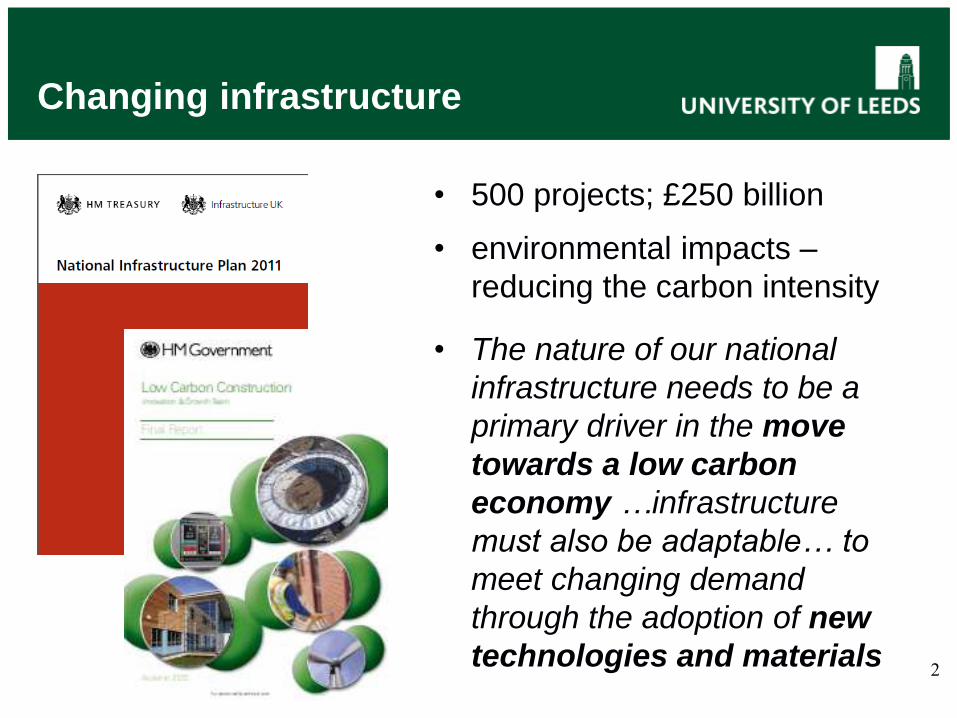
• 500 projects; £250 billion
• environmental impacts –
reducing the carbon intensity
Changing infrastructure
• The nature of our national
infrastructure needs to be a
primary driver in the move
towards a low carbon
economy …infrastructure
must also be adaptable… to
meet changing demand
through the adoption of new
technologies and materials 2
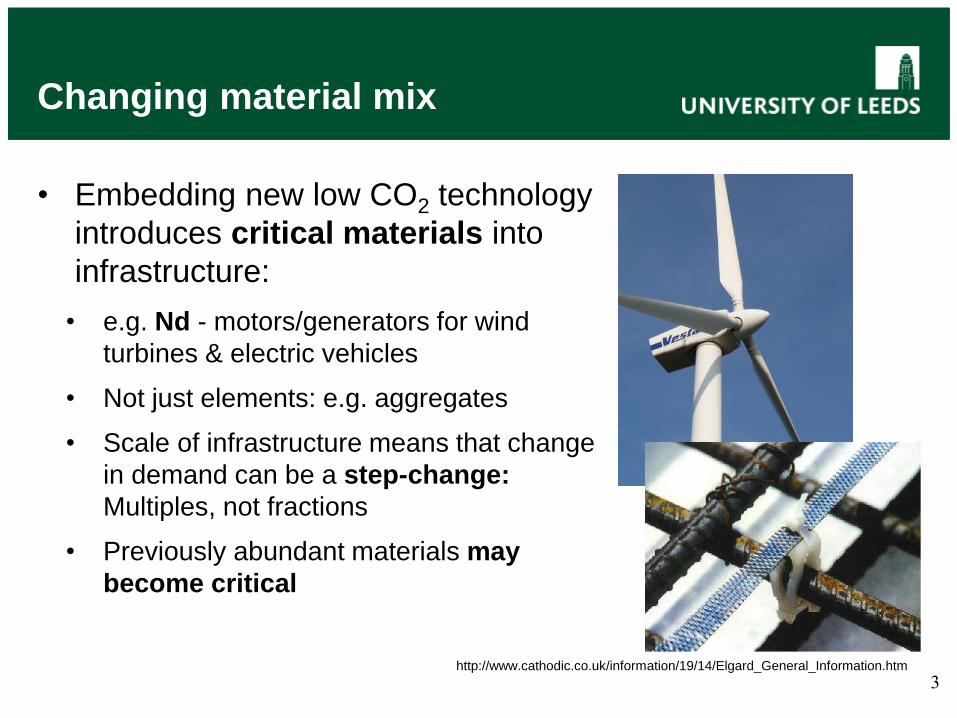
• Embedding new low CO2 technology
introduces critical materials into
infrastructure:
• e.g. Nd - motors/generators for wind
turbines & electric vehicles
• Not just elements: e.g. aggregates
• Scale of infrastructure means that change
in demand can be a step-change:
Multiples, not fractions
• Previously abundant materials may
become critical
Changing material mix
http://www.cathodic.co.uk/information/19/14/Elgard_General_Information.htm
3
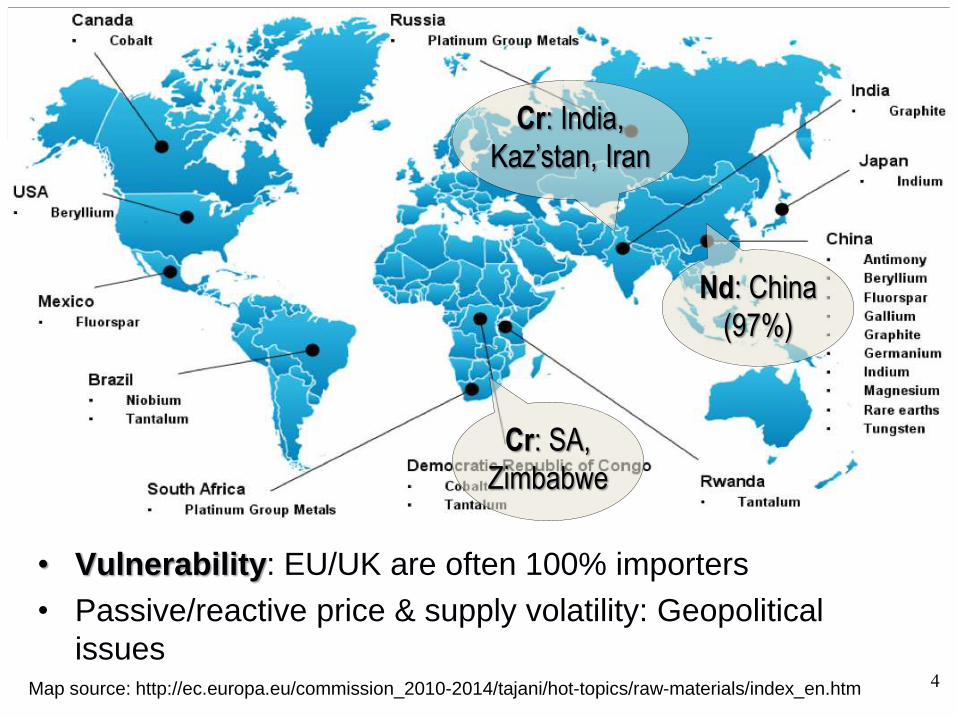
• Vulnerability: EU/UK are often 100% importers
• Passive/reactive price & supply volatility: Geopolitical
issues Map source: http://ec.europa.eu/commission_2010-2014/tajani/hot-topics/raw-materials/index_en.htm 4
Cr: SA,
Zimbabwe
Nd: China
(97%)
Cr: India,
Kaz’stan, Iran
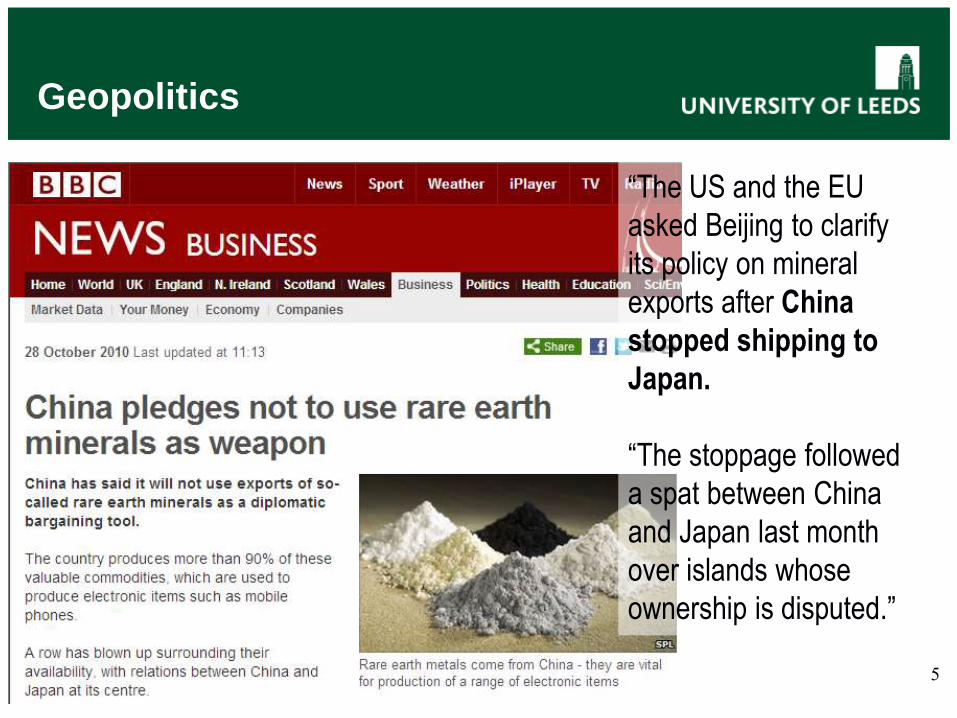
Geopolitics
5
“The US and the EU
asked Beijing to clarify
its policy on mineral
exports after China
stopped shipping to
Japan.
“The stoppage followed
a spat between China
and Japan last month
over islands whose
ownership is disputed.”
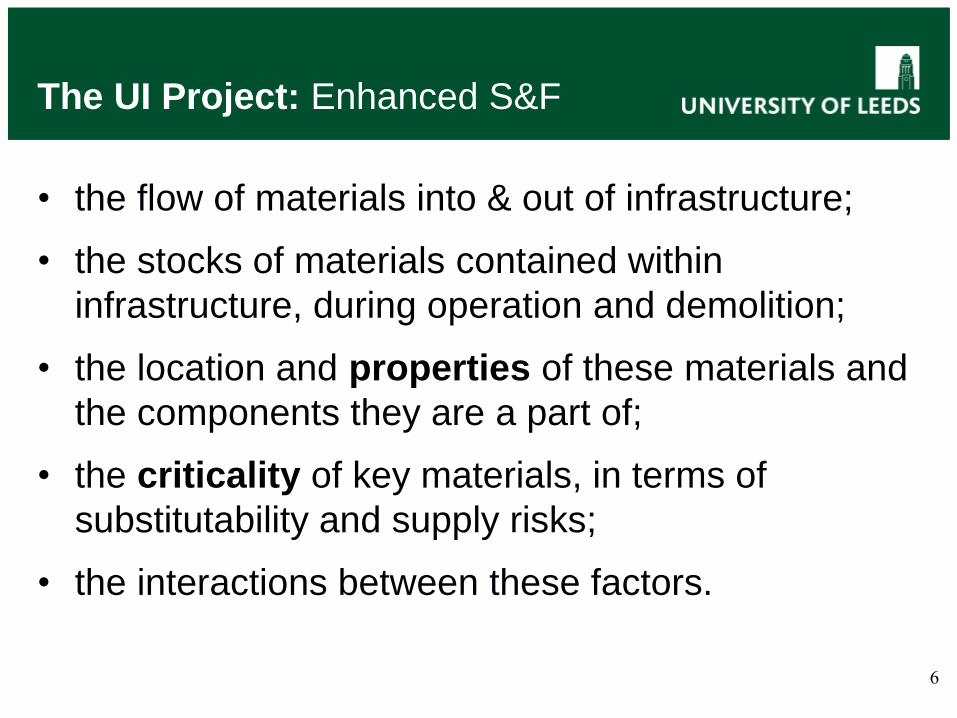
• the flow of materials into & out of infrastructure;
• the stocks of materials contained within
infrastructure, during operation and demolition;
• the location and properties of these materials and
the components they are a part of;
• the criticality of key materials, in terms of
substitutability and supply risks;
• the interactions between these factors.
The UI Project: Enhanced S&F
6
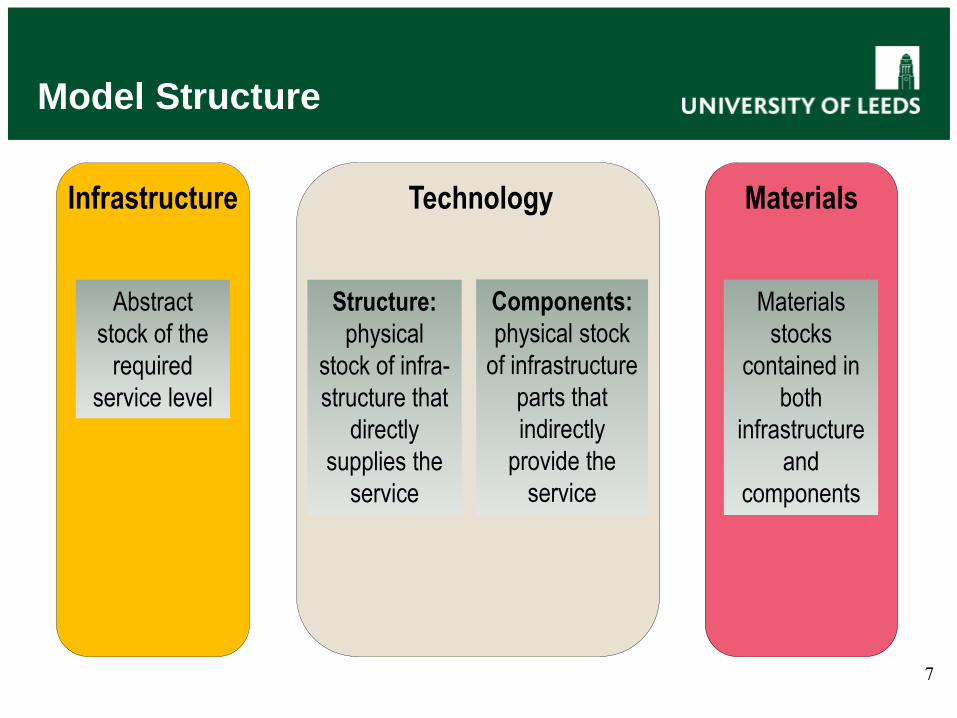
Model Structure
7
Infrastructure Technology Materials
Abstract
stock of the
required
service level
Structure:
physical
stock of infra-
structure that
directly
supplies the
service
Components:
physical stock
of infrastructure
parts that
indirectly
provide the
service
Materials
stocks
contained in
both
infrastructure
and
components
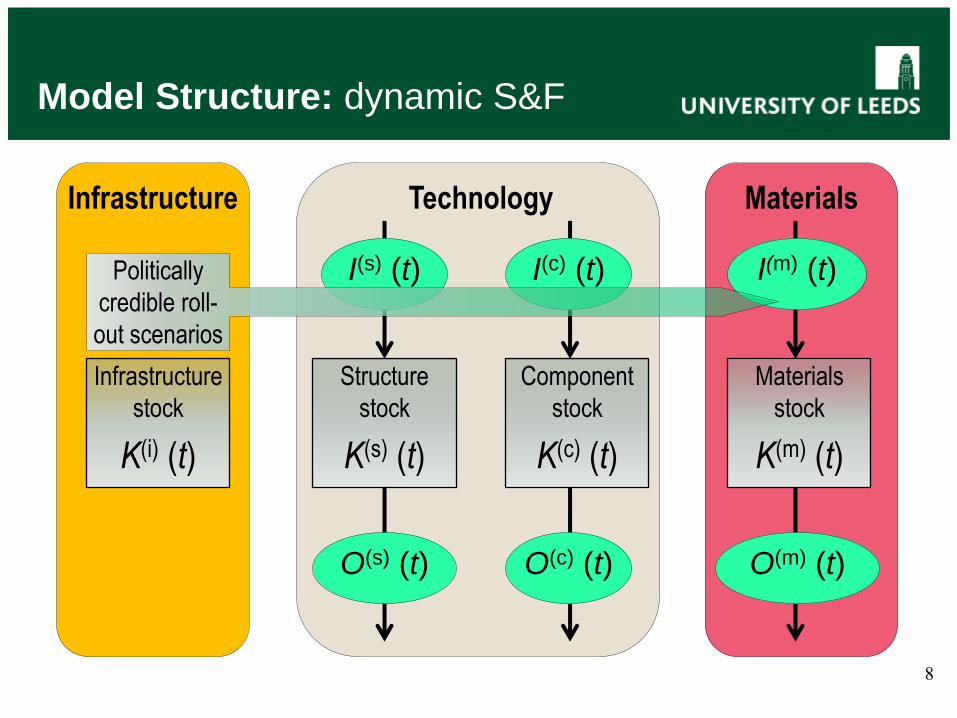
Model Structure: dynamic S&F
8
Infrastructure Technology Materials
Infrastructure
stock
K(i) (t)
Structure
stock
K(s) (t)
Component
stock
K(c) (t)
I(s) (t) I(c) (t)
O(s) (t) O(c) (t)
Materials
stock
K(m) (t)
I(m) (t)
O(m) (t)
Politically
credible roll-
out scenarios
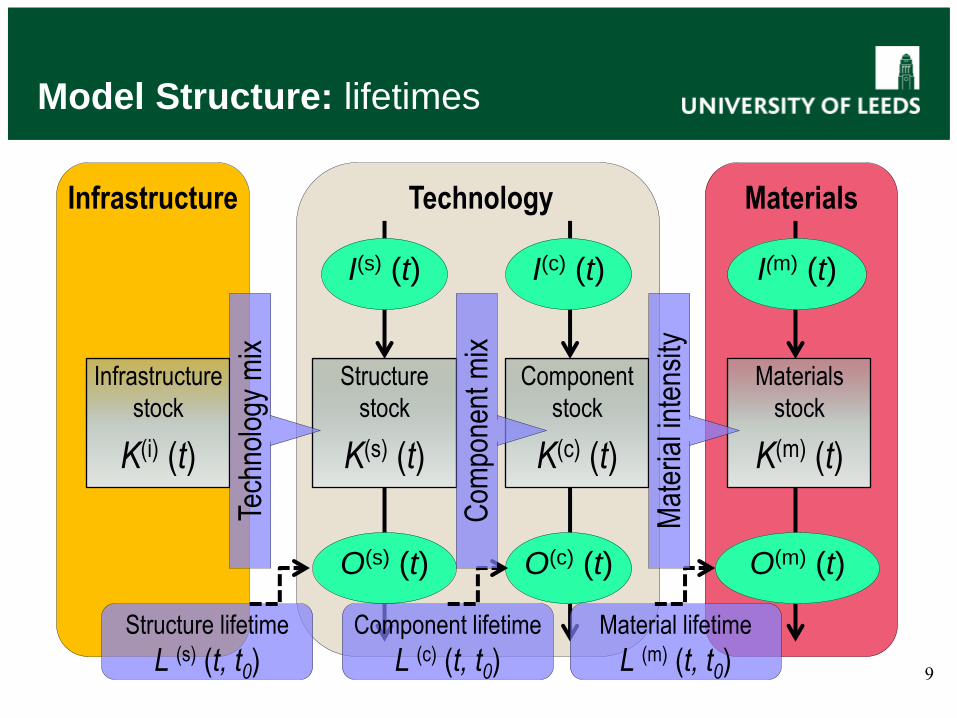
Model Structure: lifetimes
9
Infrastructure Technology Materials
Infrastructure
stock
K(i) (t)
Structure
stock
K(s) (t)
Component
stock
K(c) (t)
I(s) (t) I(c) (t)
O(s) (t) O(c) (t)
Materials
stock
K(m) (t)
I(m) (t)
O(m) (t)
Structure lifetime
L (s) (t, t0) Component lifetime
L (c) (t, t0) Material lifetime
L (m) (t, t0)
Tech
nolo
gy m
ix
Com
pone
nt m
ix
Mat
eria
l int
ensi
ty
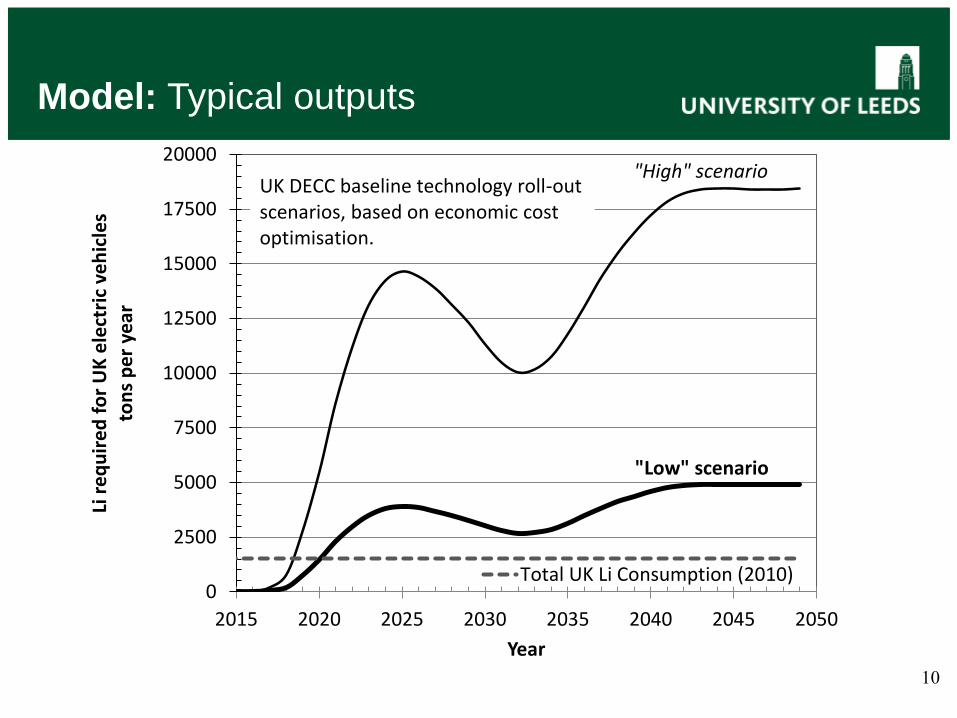
Model: Typical outputs
10
0
2500
5000
7500
10000
12500
15000
17500
20000
2015 2020 2025 2030 2035 2040 2045 2050
Li r
eq
uir
ed
fo
r U
K e
lect
ric
veh
icle
s to
ns
pe
r ye
ar
Year
Total UK Li Consumption (2010)
"Low" scenario
"High" scenarioUK DECC baseline technology roll-out scenarios, based on economic cost optimisation.
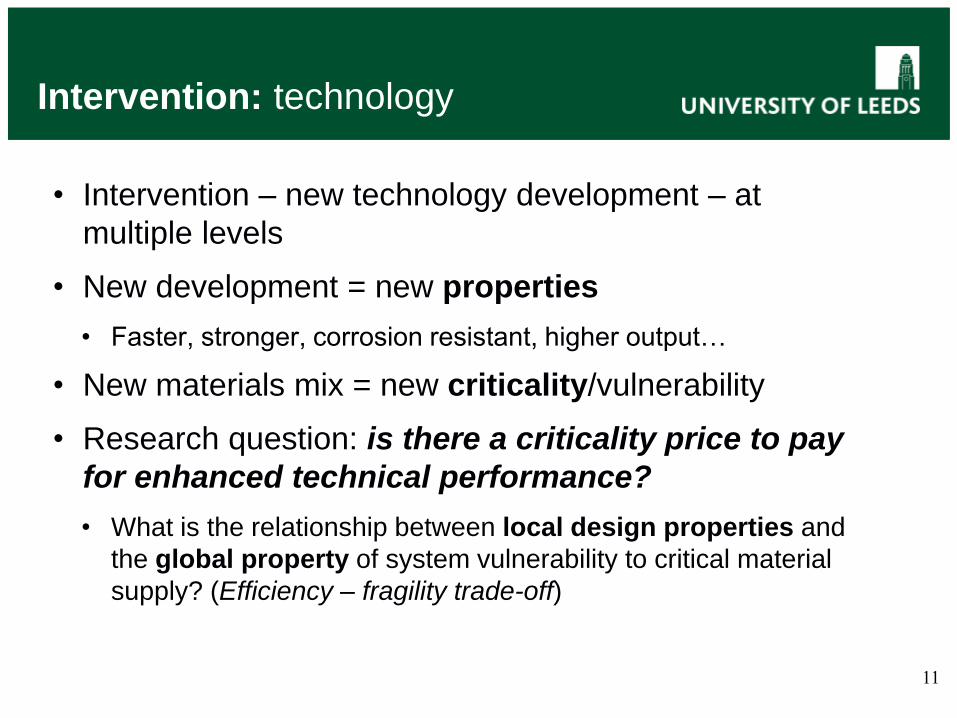
• Intervention – new technology development – at
multiple levels
• New development = new properties
• Faster, stronger, corrosion resistant, higher output…
• New materials mix = new criticality/vulnerability
• Research question: is there a criticality price to pay
for enhanced technical performance?
• What is the relationship between local design properties and
the global property of system vulnerability to critical material
supply? (Efficiency – fragility trade-off)
Intervention: technology
11
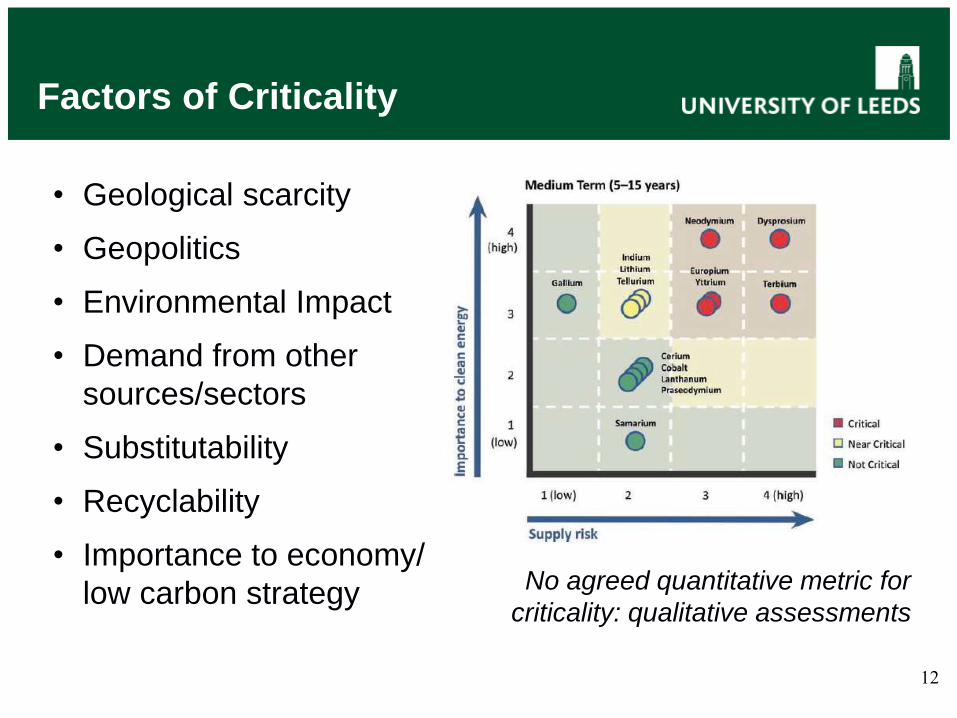
• Geological scarcity
• Geopolitics
• Environmental Impact
• Demand from other
sources/sectors
• Substitutability
• Recyclability
• Importance to economy/
low carbon strategy
Factors of Criticality
12
No agreed quantitative metric for
criticality: qualitative assessments
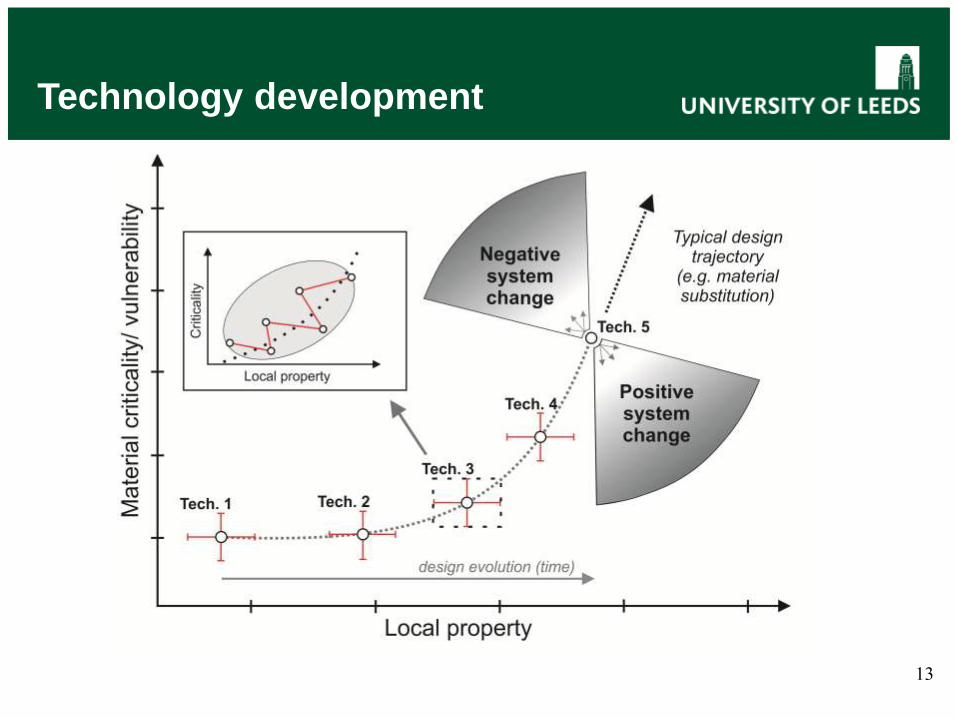
Technology development
13
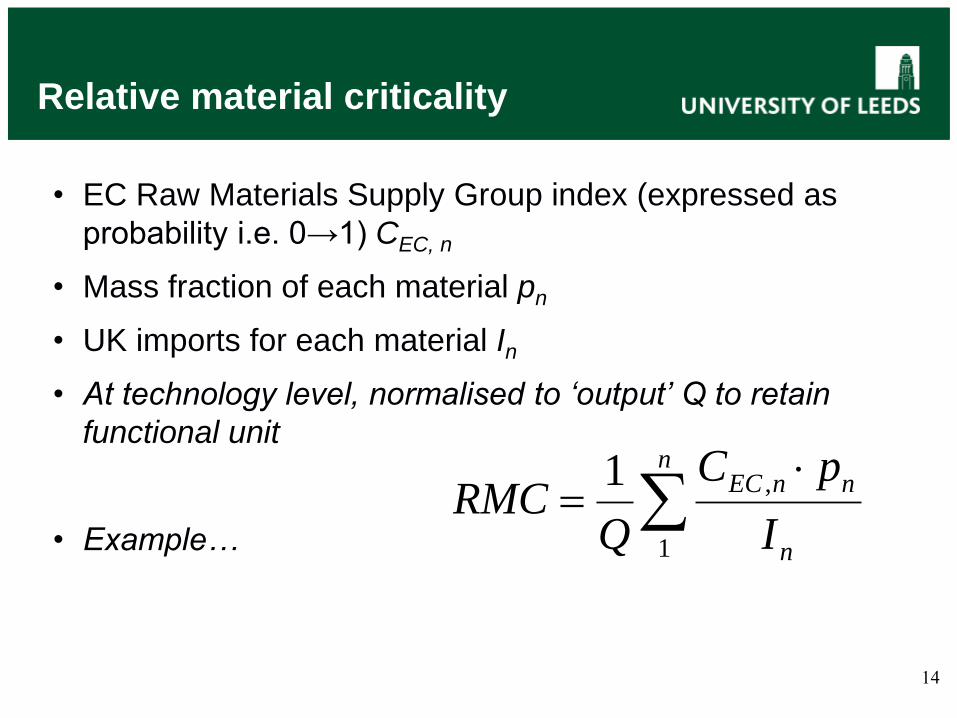
• EC Raw Materials Supply Group index (expressed as
probability i.e. 0→1) CEC, n
• Mass fraction of each material pn
• UK imports for each material In
• At technology level, normalised to ‘output’ Q to retain
functional unit
• Example…
Relative material criticality
14
n
n
nnEC
I
pC
QRMC
1
,1
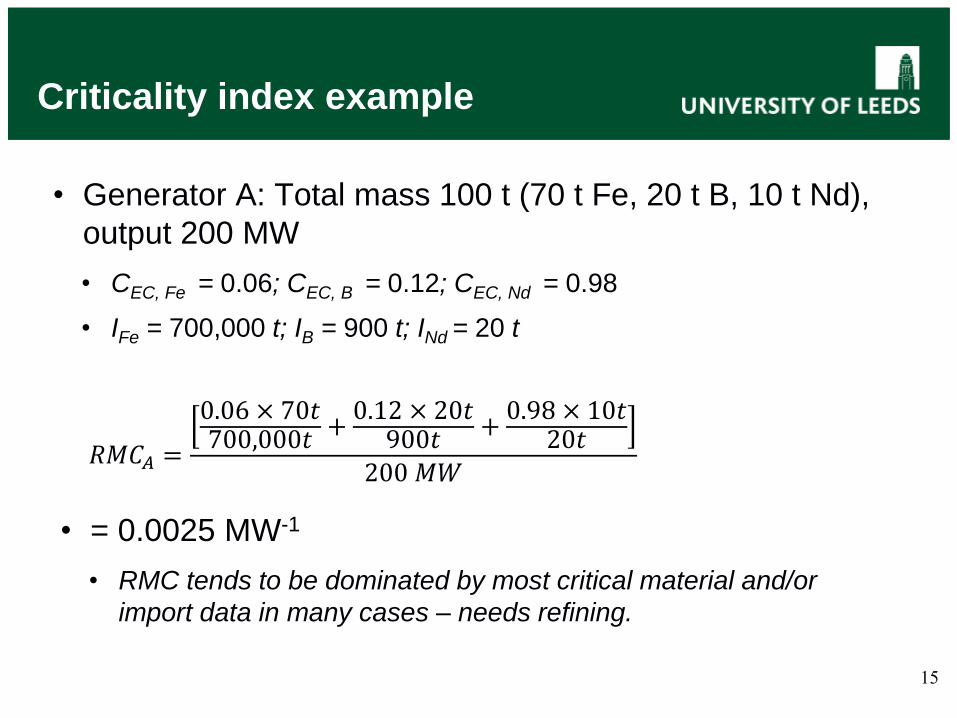
• Generator A: Total mass 100 t (70 t Fe, 20 t B, 10 t Nd),
output 200 MW
• CEC, Fe = 0.06; CEC, B
= 0.12; CEC, Nd = 0.98
• IFe = 700,000 t; IB = 900 t; INd = 20 t
Criticality index example
15
𝑅𝑀𝐶𝐴 =
0.06 × 70𝑡700,000𝑡
+0.12 × 20𝑡
900𝑡+
0.98 × 10𝑡20𝑡
200 𝑀𝑊
• = 0.0025 MW-1
• RMC tends to be dominated by most critical material and/or
import data in many cases – needs refining.
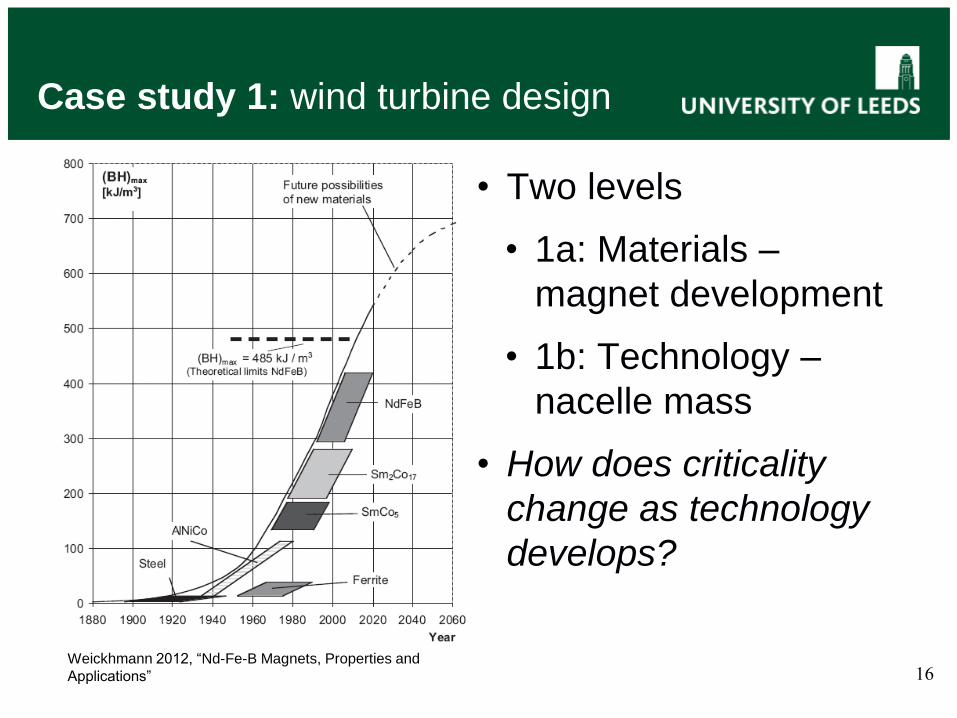
Case study 1: wind turbine design
16 Weickhmann 2012, “Nd-Fe-B Magnets, Properties and
Applications”
• Two levels
• 1a: Materials –
magnet development
• 1b: Technology –
nacelle mass
• How does criticality
change as technology
develops?
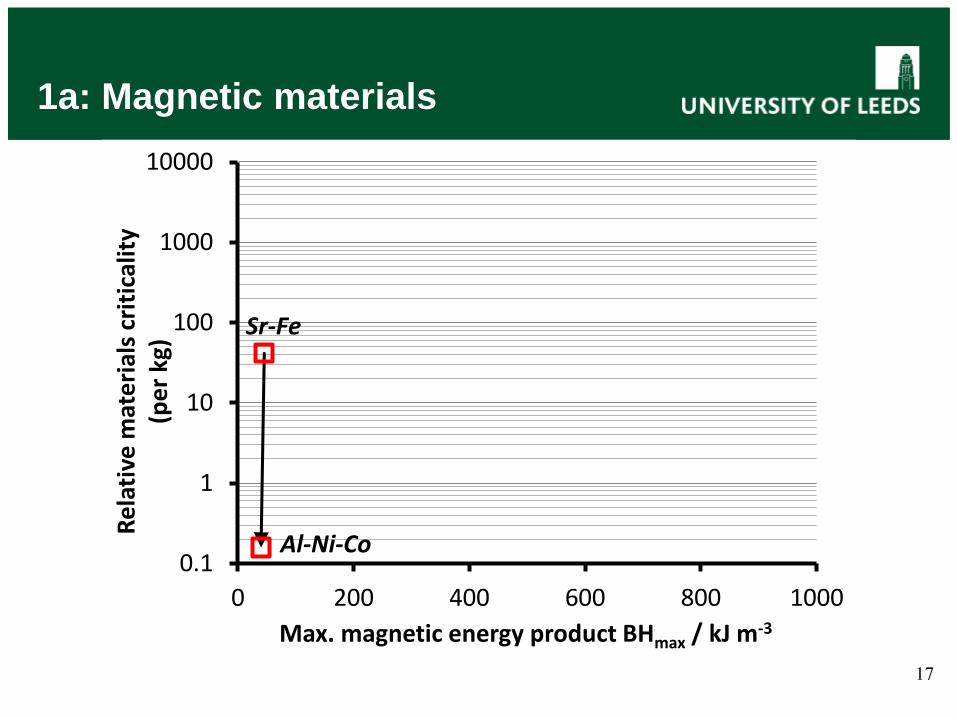
1a: Magnetic materials
17
0.1
1
10
100
1000
10000
0 200 400 600 800 1000
Re
lati
ve m
ate
rial
s cr
itic
alit
y(p
er
kg)
Max. magnetic energy product BHmax / kJ m-3
Sr-Fe
Al-Ni-Co
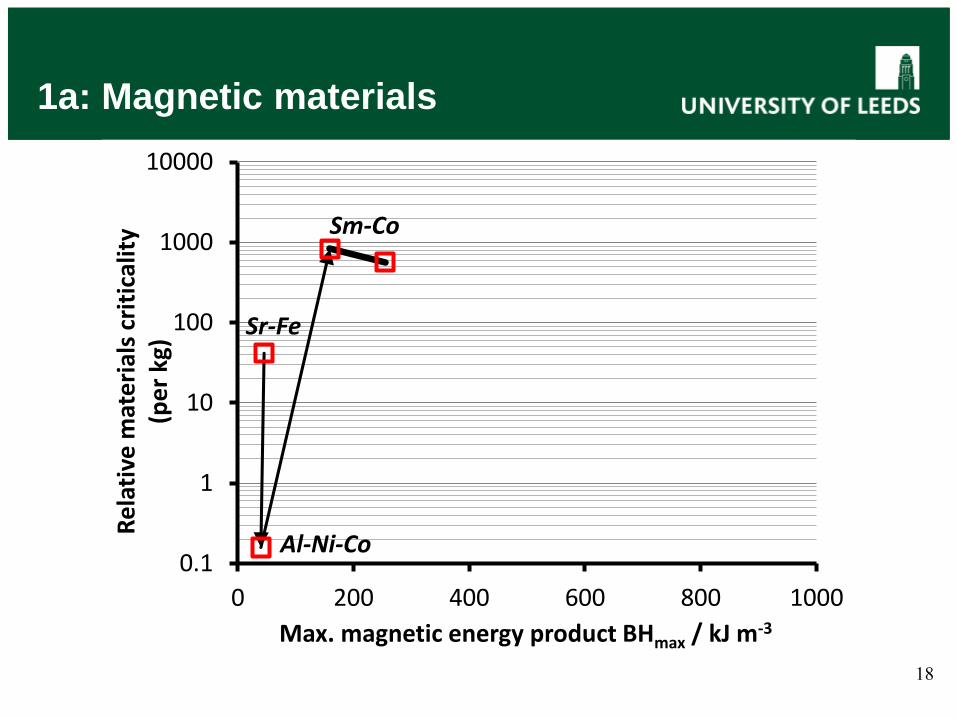
1a: Magnetic materials
18
0.1
1
10
100
1000
10000
0 200 400 600 800 1000
Re
lati
ve m
ate
rial
s cr
itic
alit
y(p
er
kg)
Max. magnetic energy product BHmax / kJ m-3
Sr-Fe
Al-Ni-Co
Sm-Co
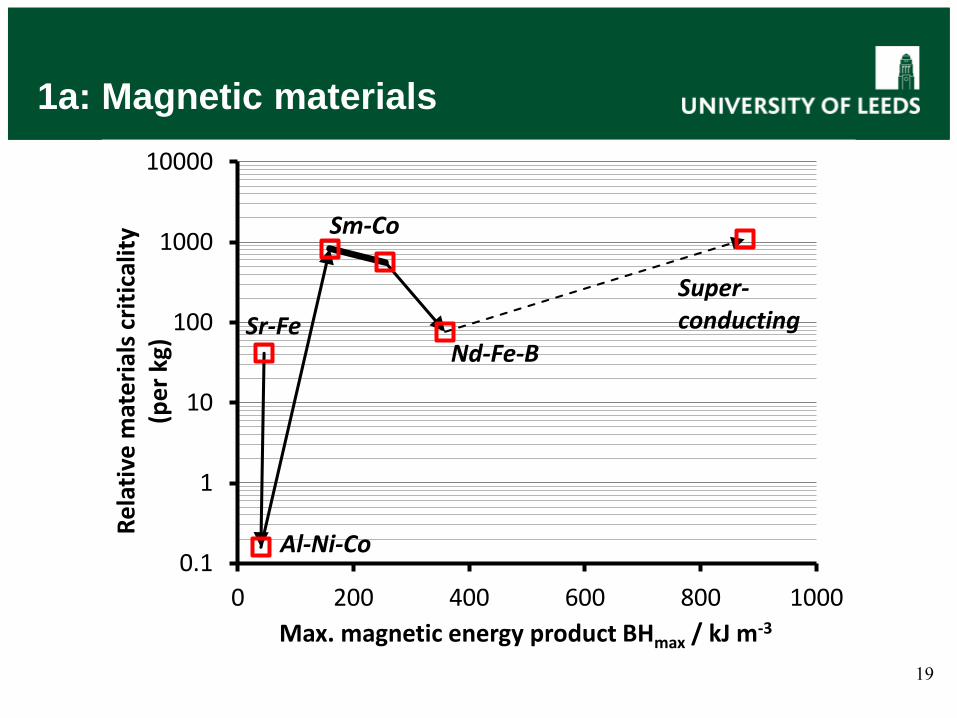
1a: Magnetic materials
19
0.1
1
10
100
1000
10000
0 200 400 600 800 1000
Re
lati
ve m
ate
rial
s cr
itic
alit
y(p
er
kg)
Max. magnetic energy product BHmax / kJ m-3
Sr-Fe
Al-Ni-Co
Sm-Co
Nd-Fe-B
Super-conducting
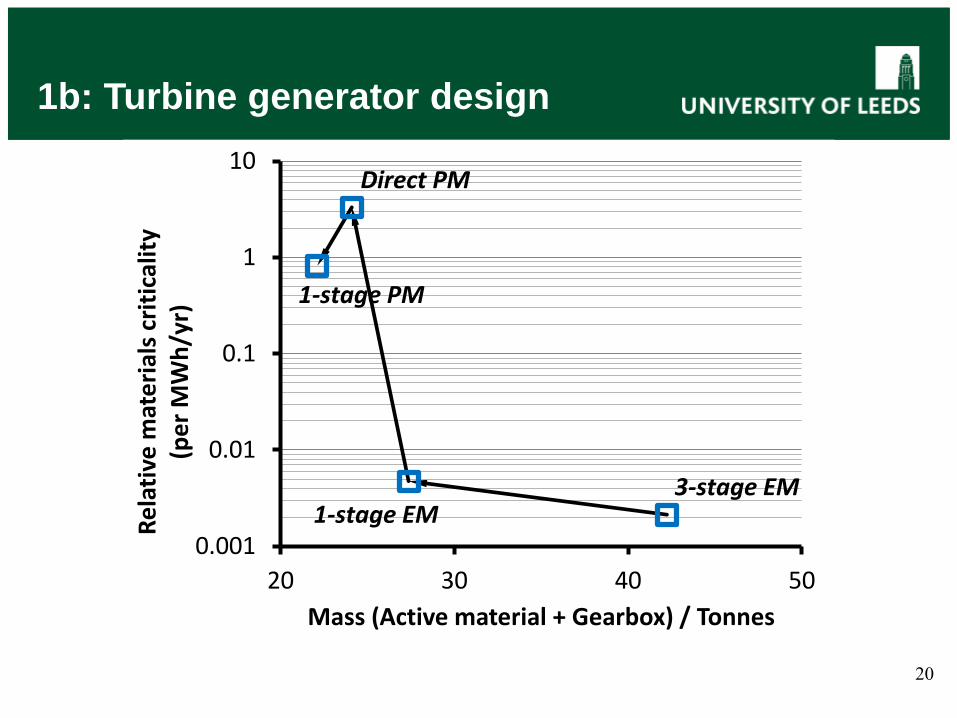
1b: Turbine generator design
20
0.001
0.01
0.1
1
10
20 30 40 50
Re
lati
ve m
ate
rial
s cr
itic
alit
y(p
er
MW
h/y
r)
Mass (Active material + Gearbox) / Tonnes
3-stage EM1-stage EM
Direct PM
1-stage PM
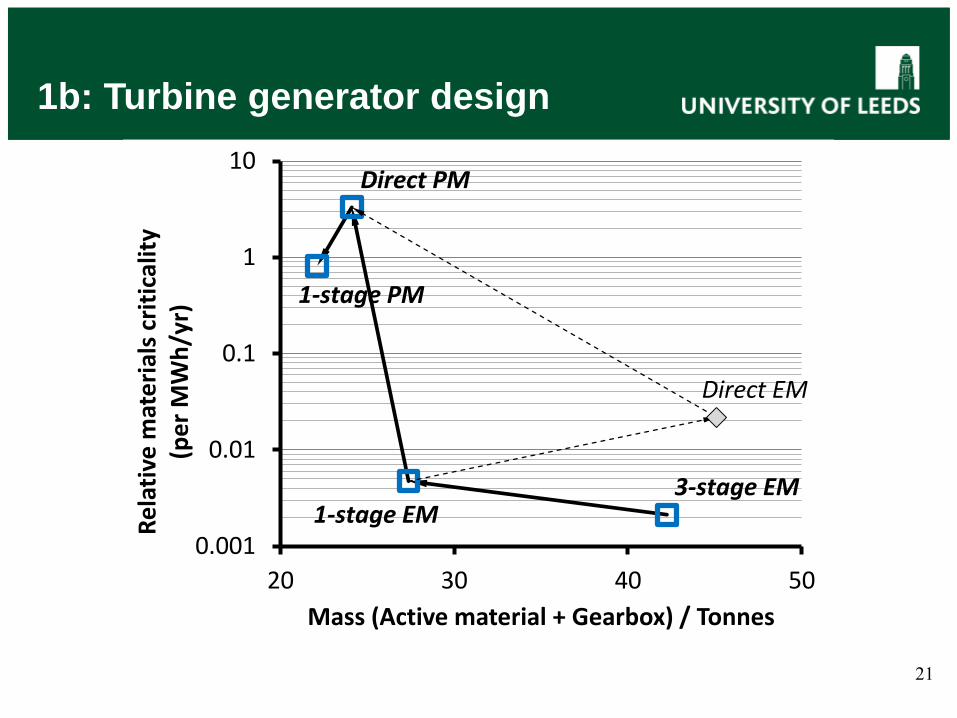
1b: Turbine generator design
21
0.001
0.01
0.1
1
10
20 30 40 50
Re
lati
ve m
ate
rial
s cr
itic
alit
y(p
er
MW
h/y
r)
Mass (Active material + Gearbox) / Tonnes
3-stage EM1-stage EM
Direct EM
Direct PM
1-stage PM
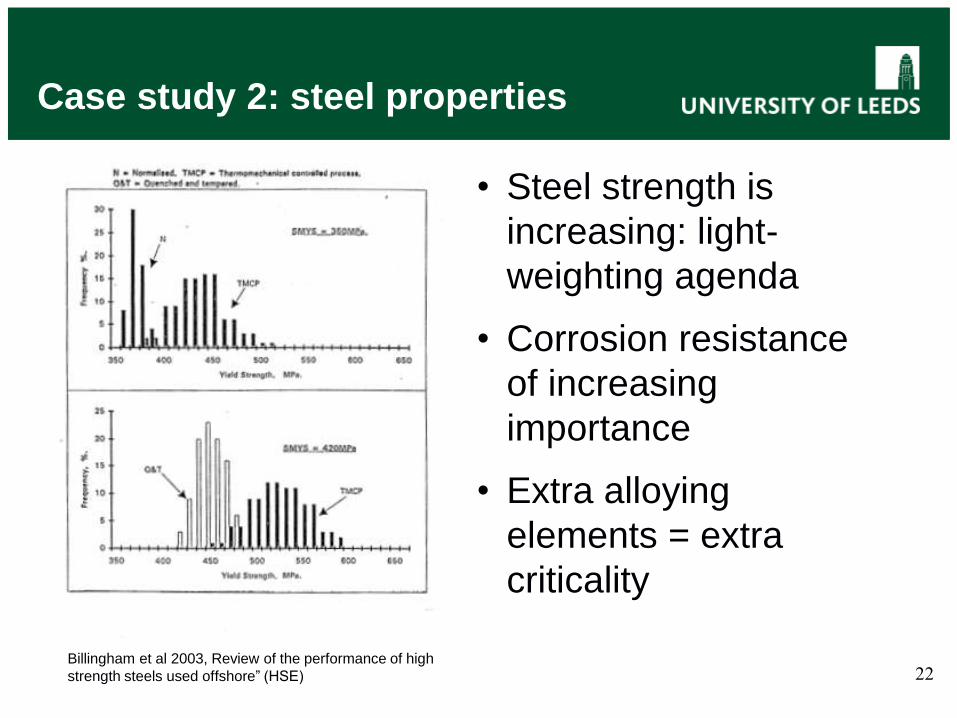
Case study 2: steel properties
22
• Steel strength is
increasing: light-
weighting agenda
• Corrosion resistance
of increasing
importance
• Extra alloying
elements = extra
criticality
Billingham et al 2003, Review of the performance of high
strength steels used offshore” (HSE)
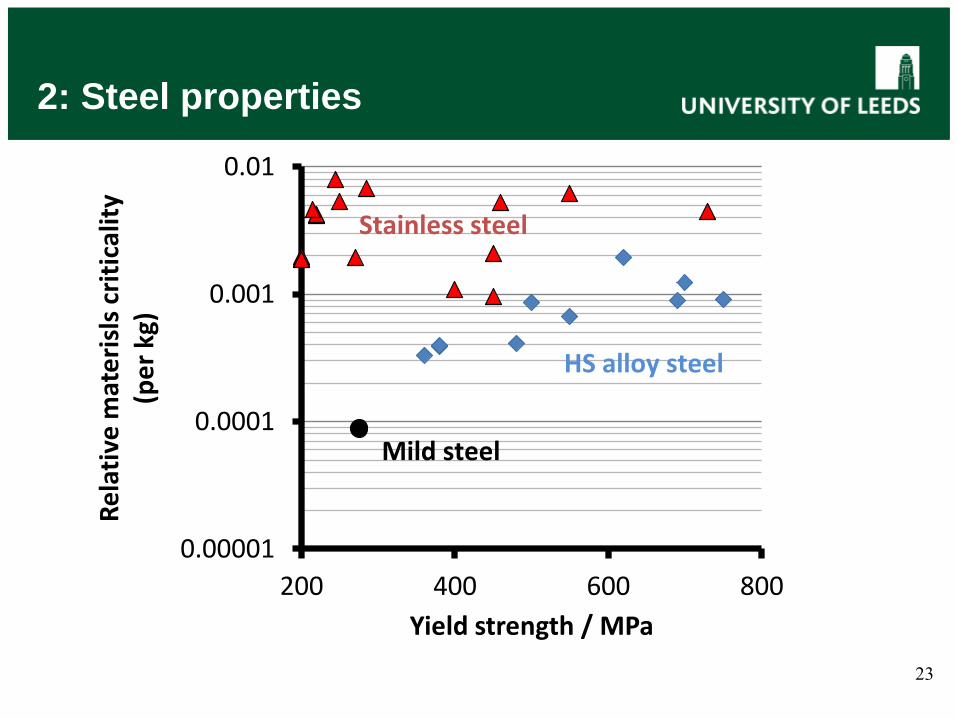
2: Steel properties
23
0.00001
0.0001
0.001
0.01
200 400 600 800
Re
lati
ve m
ate
risl
s cr
itic
alit
y (p
er
kg)
Yield strength / MPa
Mild steel
HS alloy steel
Stainless steel
• Technological responses to climate change
are vulnerable to critical materials supply;
• An enhanced stocks & flows methodology can
be used to analyse this;
• Preparing criticality-property charts can help
assess the change in relative vulnerability
induced by a material and/or technology
change;
• A more robust metric for criticality is required.
Conclusions
24