critical gaps and follow-up headways at congested...
TRANSCRIPT

CRITICAL GAPS AND FOLLOW-UP HEADWAYS AT CONGESTED
ROUNDABOUTS
Dongxi Zheng
Research Assistant
TOPS Laboratory, Department of Civil and Environment Engineering
University of Wisconsin-Madison
1415 Engineering Drive, Room 1241, Madison, WI, 53706
Phone number: (608)335-0889, E-mail: [email protected]
Madhav V. Chitturi, PhD Assistant Researcher
TOPS Laboratory, Department of Civil and Environment Engineering
University of Wisconsin-Madison
B243 Engineering Hall, 1415 Engineering Drive, Madison, WI 53706
Phone number: (608) 890-2439, Fax: (608)262-5199, E-mail: [email protected]
Andrea R. Bill
Associate Researcher
TOPS Laboratory, Department of Civil and Environment Engineering
University of Wisconsin-Madison
B243 Engineering Hall, 1415 Engineering Drive, Madison, WI 53706
Phone number: (608) 890-3524, Fax: (608)262-5199, E-mail: [email protected]
David A. Noyce, PhD, PE
Associate Professor
Director, Traffic Operations and Safety (TOPS) Laboratory
University of Wisconsin-Madison
Department of Civil and Environment Engineering
1204 Engineering Hall, 1415 Engineering Drive
Madison, WI 53706
Phone number: (608) 265-1882, Fax: (608)262-5199, E-mail: [email protected]
Submitted on: 8/1/2011
Word count: Text (5155) + 250*Figure (4) + 250*Table (6) = 7655

ABSTRACT 1
Roundabouts are relatively new to the United States but are being constructed rapidly. Critical 2
gap and follow-up headway are two important factors in determining capacity of roundabouts. . 3
Data were collected at four approaches of three congested roundabouts in Wisconsin to estimate 4
critical gaps and follow-up headways. Congestion was determined by presence of queued 5
vehicles on the approach. . Primary analyses on critical gap and follow-up headway include 6
value comparison 1) between current study and previous findings, 2) between vehicle types, and 7
3) between whether or not exiting vehicles are considered. The analyses results show that 1) 8
critical gap and follow-up headways were typically lower at congested roundabouts, 2) larger 9
vehicles had higher critical gap and follow-up headway values, 3) by considering exiting 10
vehicles, critical gap and follow-up headway estimates decreased significantly,. Critical gap and 11
follow-up headway estimates were slightly more consistent across sites as queue length increased, 12
and the variability of gap acceptance was reduced. The reduced variability in gap acceptance 13
provides a better approximate for the upper bound of driver randomness. 14

Zheng, Chitturi, Bill, and Noyce 3
INTRODUCTION 1
A modern roundabout is an unsignalized intersection where entering traffic is required to yield to 2
the circulating traffic. The yield-to-circulating rule is one of the main differences between 3
modern roundabouts and traditional traffic circles. While modern roundabouts were first 4
designed in the United Kingdom in the 1960s, their prevalence in the United States (U.S.) did not 5
begin until 1990 (1). A number of research studies have shown that roundabouts are successful 6
in not only reducing the frequency of crashes but also the injury severity of crashes (1-7). Studies 7
have shown that roundabouts operate more efficiently than signalized intersections and 8
conventional unsignalized intersections (two-way stop and four-way stop) (8). 9
According to the 2010 Highway Capacity Manual roundabout capacity depends on 10
critical gap and follow-up headway (ref?). However, limited studies have been performed on 11
operational characteristics of congested roundabouts in the US. (1,9). Additionally, critical gaps 12
and follow-up headways were not reported for different vehicle types. Heavy vehicles are 13
expected to have significantly larger critical gaps and follow-up headways at roundabouts than 14
passenger cars as is the case at other unsignalized intersections (9). Previous research reported 15
that considering exiting vehicles significantly decreased critical gaps at single-lane roundabouts 16
(10). However, no research has studied effect of exiting vehicles on follow-up headways or at 17
multi-lane roundabouts. 18
The primary objective of this research is to study critical gaps and follow-up headways at 19
congested roundabouts. Data were collected at three congested roundabouts in Wisconsin. 20
Results are compared with previously reported values and effects of vehicle type and exiting 21
vehicles on critical gaps and follow-up headways are determined. 22
LITERATURE REVIEW 23
Critical gap and follow-up headway (also termed critical headway and follow-up time in 24
literature, respectively) are key parameters for most of the capacity models of roundabouts. A 25
gap is the time difference between two successive circulating vehicles passing the conflicting 26
line. A critical gap is the minimum gap that an entering driver would use to enter the roundabout. 27
A follow-up headway is the time difference between two successive vehicles entering the 28
roundabout using a same gap, under saturated condition. 29
Many methods have been proposed to estimate critical gap from gap data (11-19). Miller 30
and Brilon, et al. evaluated several critical gap estimation methods and both reported that the 31
maximum likelihood method gives the best results (20, 21). Maximum likelihood method was 32
originally introduced by Miller and Pretty in calculating the critical gap of overtaking behavior 33
(19). Due to the similarity of gap acceptance mode, maximum likelihood method can be applied 34
in many scenarios such as two-way-stop controlled intersections, permissive left turns at 35
signalized intersections, roundabouts, etc. Troutbeck further specified how to use maximum 36
likelihood method to determine critical gaps from traffic movements (22). The maximum 37
likelihood method was adopted by NCHRP 572 as the method of estimating critical gaps (1). 38
NCHRP Report 572 reported critical gaps and follow-up headways based on data 39
collected from 25 approaches of 15 roundabouts (11 single-lane roundabouts and 4 multi-lane 40
roundabouts) (1). Most queues at the 15 roundabouts were one or two minutes in duration, 41
although the maximum continuous queue recorded was 31 minutes. Default values of critical 42
gaps and follow-up headways were suggested in Highway Capacity Manual (HCM) (9). Some 43

Zheng, Chitturi, Bill, and Noyce 4
recent studies also studied critical gaps and follow-up headway (23, 24). Unfortunately, neither 1
critical gaps nor follow-up headways have been reported by vehicle type. 2
Mereszczak et al. were the first to incorporate the effect of exiting vehicles on critical 3
gaps at single-lane roundabouts (10). When the effect of exiting vehicles is considered, critical 4
gap was found to be smaller than that when the effect of exiting vehicles is not considered. 5
Capacity predictions improved when the effect of exiting vehicles was considered (10). However 6
the effects of exiting vehicles on critical gaps at multi-lane roundabouts and on follow-up 7
headways (single/multi-lane roundabouts) have not been studied. 8
A number of studies have been done to identify factors that influence driver’s gap 9
acceptance. Polus, et al. examined the critical gap as a function of average waiting time at 10
roundabouts and found critical gap reduces with increasing waiting time (25). This finding was 11
similar to what has been discovered in scenarios other than roundabouts (26). Mensah, et al. also 12
reported that as people got accustomed to roundabouts, critical gaps decreased (27). Wang, et al. 13
modeled the inconsistency of drivers’ gap acceptance behaviors at roundabouts using Cellular 14
Automata and reproduced many features of traffic flow using the model (28). The above findings, 15
together with the randomness of driver behavior and observation errors, could explain why a 16
driver’s largest rejected gap was sometimes larger than the accepted gap. Additionally, whether 17
the variability of gap acceptance would change by including exiting vehicles is worth studying. 18
19
Zheng, Chitturi, Bill, and Noyce 5
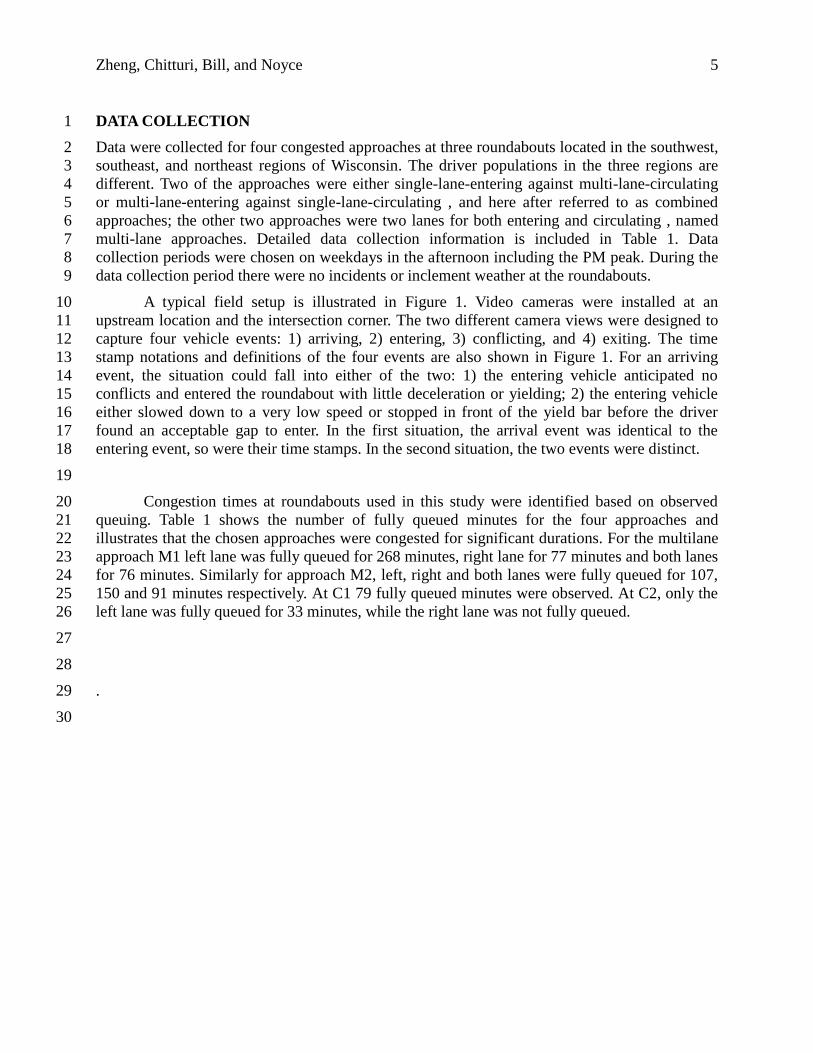
DATA COLLECTION 1
Data were collected for four congested approaches at three roundabouts located in the southwest, 2
southeast, and northeast regions of Wisconsin. The driver populations in the three regions are 3
different. Two of the approaches were either single-lane-entering against multi-lane-circulating 4
or multi-lane-entering against single-lane-circulating , and here after referred to as combined 5
approaches; the other two approaches were two lanes for both entering and circulating , named 6
multi-lane approaches. Detailed data collection information is included in Table 1. Data 7
collection periods were chosen on weekdays in the afternoon including the PM peak. During the 8
data collection period there were no incidents or inclement weather at the roundabouts. 9
A typical field setup is illustrated in Figure 1. Video cameras were installed at an 10
upstream location and the intersection corner. The two different camera views were designed to 11
capture four vehicle events: 1) arriving, 2) entering, 3) conflicting, and 4) exiting. The time 12
stamp notations and definitions of the four events are also shown in Figure 1. For an arriving 13
event, the situation could fall into either of the two: 1) the entering vehicle anticipated no 14
conflicts and entered the roundabout with little deceleration or yielding; 2) the entering vehicle 15
either slowed down to a very low speed or stopped in front of the yield bar before the driver 16
found an acceptable gap to enter. In the first situation, the arrival event was identical to the 17
entering event, so were their time stamps. In the second situation, the two events were distinct. 18
19
Congestion times at roundabouts used in this study were identified based on observed 20
queuing. Table 1 shows the number of fully queued minutes for the four approaches and 21
illustrates that the chosen approaches were congested for significant durations. For the multilane 22
approach M1 left lane was fully queued for 268 minutes, right lane for 77 minutes and both lanes 23
for 76 minutes. Similarly for approach M2, left, right and both lanes were fully queued for 107, 24
150 and 91 minutes respectively. At C1 79 fully queued minutes were observed. At C2, only the 25
left lane was fully queued for 33 minutes, while the right lane was not fully queued. 26
27
28
. 29
30

Zheng, Chitturi, Bill, and Noyce 6
TABLE 1 Summary of Data Collection Information 1
Approach No. C1 C2 M1 M2
Direction SB WB NB EB
Roundabout Canal Street
at 25th Street
STH 78
at CTH ID
STH 32
at STH 57
STH 32
at STH 57
Geometry 1 lane entering
2 lanes circulating
2 lanes entering
1 lane circulating
2 lanes entering
2 lanes circulating
2 lanes entering
2 lanes circulating
Date April 15th, 2010
Thursday
April 8th, 2010
Thursday
May 19th, 2010
Wednesday
May 19th, 2010
Wednesday
Time Span 1:50 PM
to
6:00 PM
1:20 PM
to
5:50 PM
1:20 PM
to
6:20 PM
2:50 PM
to
6:00 PM
Peak Hour
Entering
Volume
(veh/hr/lane)
554 635 325 1045
Sum of Fully
Queuing
Minutes
79 33 (left lane**) 268 (left lane) 107 (left lane)
0 (right lane**) 77 (right lane) 150 (right lane)
0 (both lanes**) 76 (both lanes) 91 (both lanes)
Equivalent
Travel Time
(s) *
1.3 (inner lane) 1.7 1.1 (inner lane) 1.2 (inner lane)
2.2 (outer lane) 1.9 (outer lane) 2.6 (outer lane)
* Equivalent Travel Time: a parameter for including the exiting vehicles into gap measuring. The equivalent
travel time will be explained and defined later in the “Two Gap Measuring Techniques” section.
** left lane: either only queued in the left lane or queued in both lanes; right lane: either only queued in the
right lane or queued in both lanes; both: queued in both lanes.
2

Zheng, Chitturi, Bill, and Noyce 7
1
FIGURE 1 A typical field setup. 2
3
Entering vehicle
Circulating vehicle
Exiting vehicle
Upstream boundary
Exiting line
Time Stamp
Notation
Event Name Event Definition
Tarr Arrival An entering vehicle comes to a stop or reaches the lowest
speed in front of the yield bar before it enters the
roundabout. If the entering vehicle does not stop, the event
refers to the vehicle’s front reaches the yield bar and is the
same as Tent.
Tent Entering The front of an entering vehicle reaches the yield bar,
followed instantly by the vehicle getting into the circulating
roadway.
Tcon Conflicting The front of a circulating vehicle reaches the conflicting line.
Text Exiting The front of an exiting vehicle reaches the exiting line.
Conflicting line Yield bar

Zheng, Chitturi, Bill, and Noyce 8
METHODOLOGY 1
Using the videos collected at the roundabouts, time stamps for the four vehicle events were 2
manually extracted. Also, every entering vehicle was classified into one of three categories: 3
passenger cars (including sedans, sport/utility vehicles, minivans, vans, and pick-up trucks), 4
trucks (single-unit trucks, truck tractor-semitrailer combinations, and truck tractors with 5
semitrailers in combination with full trailers), and motorcycles (29). Additionally, for every 6
entering vehicle, the number of vehicles waiting behind it in the same lane (queue length) was 7
also recorded. The queue length information was used to ensure that the vehicles were queued as 8
well as to study the effect of queue length on critical gap and follow-up headway. For follow-up 9
headway, the samples were collected only when the vehicles were in queue . Gap and headway 10
data were computed using the time stamps. Critical gaps and follow-up headways were estimated 11
based on the gap and headway data, respectively, and categorized by vehicle type. 12
Two Gap Measuring Techniques 13
A gap is defined as the time difference between two consecutive conflicting events (Equation 1). 14
For the two lane roundabouts, gaps were measured across both lanes, as was done in the NCHRP 15
572 study. 16
( 1) ( )i i
g con cont T T (1)
Where
gt = A gap between circulating vehicle i and circulating vehicle i+1, second;
( )i
conT = Time stamp of the conflicting event of circulating vehicle i, second;
( 1)i
conT = Time stamp of the conflicting event of circulating vehicle i+1, second.
17
Another term usually associated with gap is a lag. A lag is defined as the time difference 18
between an arrival event and next conflicting event (Equation 2). 19
20
l con arrt T T (2)
where
lt = A lag, second;
conT = Time stamp of the conflicting event of the first circulating vehicle faced by the
entering vehicle, second;

Zheng, Chitturi, Bill, and Noyce 9
arrT = Time stamp of the arrival event of the entering vehicle, second.
Above definitions of gap and lag do not consider the effect of exiting vehicles. The 1
technique used by Mereszczak et al. to measure gaps and lags considering the effect of exiting 2
vehicles is summarized in Equation 3 (10): 3
4
2 1( )event eventt T t T (3)
where
t = A gap when event 1 is a conflicting event or an exiting event; or a lag when
event 1 is an arrival event, seconds;
1eventT = The time stamp of a conflicting event, an exiting event, or an arrival event,
seconds;
2eventT = The time stamp of a conflicting event or an exiting event, seconds;
t = 0 second, when event 2 is a conflicting event;
Equivalent travel time (ETT), when event 2 is an exiting event.
5
In Equation 3, Tevent 2 comes successively after Tevent 1. The equivalent travel time (ETT) 6
assigned to t when event 2 is an exiting event was first proposed by Mereszczak et al. as “the 7
travel time that would have occurred between the exit point and conflict point had the exiting 8
vehicle remained in the circulating flow”(10). Mereszczak et al. calculated the ETT by dividing 9
the distance from the middle point of the exiting line to the conflicting line with the average 10
circulating speed. For the present study, a modified approach was taken to measure ETTs for 11
both single-lane roundabouts and multi-lane roundabouts. The approach is to equal the ETT to 12
the sample average travel time of circulating vehicles running through an “equivalent segment”. 13
The concept of equivalent segment is illustrated in Figure 2 for both single-lane and multi-lane 14
roundabouts. In Figure 2, Point D is the point from which the circulating center path and the 15
exiting center path diverge; Point M is the intersection between the exiting line and the exiting 16
center path; Point E is located such that the length of segment DE (of the circulating center path) 17
equals the length of segment DM (of the exiting center path); and Point C is the intersection 18
between the circulating center path and the conflicting line. Since segment DE equals segment 19
DM, Point E is approximately where an exiting vehicle would have reached if it had continued 20
circulating. Therefore, segment EC (of the circulating center path) is the equivalent segment of 21
which the travel time matches the idea of ETT. About 20 vehicles per hour per lane were 22
sampled to measure ETTs. The ETTs used for the studied approaches are summarized in Table 1. 23
For the current study, two techniques were used for measuring a gap (or a lag). The first 24
technique did not consider the exiting vehicles, and thus only counts gaps between conflicting 25
vehicles. The second technique considered the exiting vehicles as virtual conflicting vehicles, 26

Zheng, Chitturi, Bill, and Noyce 10
and counts gaps between both circulating vehicles and exiting vehicles, by applying an 1
equivalent travel time when an exiting vehicle is involved. 2
3
FIGURE 2 Illustrations of equivalent segments. 4
5
Estimation Methods of Critical Gap and Follow-up Headway 6
Maximum Likelihood Method (MLM) is the state-of-the-practice to estimate critical gaps (20, 7
21). In the current study, MLM was used to estimate the mean and the standard deviation of 8
critical gap, assuming a log-normal distribution for critical gap. Only entering vehicles that 9
rejected at least one gap (or lag) were used as samples for MLM. Procedures of finding the MLM 10
D
M
E C
D
M
E C
D
M
E
C
Single-lane Roundabout Equivalent Segment
Multi-lane Roundabout Inner Circulating Lane Equivalent Segment
Multi-lane Roundabout Outer Circulating Lane Equivalent Segment

Zheng, Chitturi, Bill, and Noyce 11
solutions were based on Troutbeck (22). For follow-up headway, averages and standard 1
deviations were taken from sample follow-up headways. Only those vehicles that were in queue 2
were used for computing follow-up headway. 3
RESULTS AND ANALYSES 4
Table 2 summaries the sample sizes, means, and standard deviations of critical gaps (nc, tc, and 5
sdc, respectively) and of follow-up headways (nf, tf , and sdf, respectively). The sample size nc for 6
critical gaps only included vehicles that rejected a lag. The estimates were categorized by vehicle 7
type for both scenarios of considering and not considering the exiting vehicles. When the sample 8
sizes of the three vehicle types did not sum up to that of all vehicle types, one bike or one bus 9
could have appeared and resulted in the minor difference. 10
11
TABLE 2 Critical Gaps and Follow-Up Headways 12
Not considering exiting vehicles Considering exiting vehicles
nc tc (s) sdc (s) nf tf (s) sdf (s) nc tc (s) sdc (s) nf tf (s) sdf (s)
Approach C1
Passenger Cars 536 5.5 1.9 1203 2.6 1.4 575 4.6 1.2 814 2.3 1.0
Trucks 10 6.3 0.1 5 3.9 2.1 10 5.1 1.5 2 1.9 0.1
Motorcycles 2 4.9 5.5 15 1.6 0.9 2 3.2 2.3 12 1.5 1.0
All 548 5.5 1.9 1223 2.6 1.4 587 4.6 1.2 828 2.3 1.0
Approach C2
Left lane
Passenger Cars 236 4.9 1.5 765 4.4 2.5 263 3.8 0.9 459 3.7 2.1
Trucks 3 9.3 1.5 9 6.3 3.6 4 7.2 2.0 5 5.4 3.3
Motorcycles -1 -
1 -
1 -
1 -
1 -
1 -
1 -
1 -
1 -
1 -
1 -
1
All 239 5.0 1.7 774 4.4 2.5 267 3.9 1.0 464 3.7 2.1
Right lane
Passenger Cars 58 4.4 0.4 121 4.9 2.7 64 4.0 0.7 60 4.0 2.4
Trucks 2 2.8 0.4 1 2.36 -2 2 4.1 0.1 1 2.4 -
2
Motorcycles -1 -
1 -
1 1 4.67 -
2 -
1 -
1 -
1 1 4.7 -
2
All 60 4.4 0.4 123 4.9 2.7 66 4.0 0.7 62 4.0 2.3
Approach
Passenger Cars 294 4.9 1.4 886 4.4 2.5 327 3.9 0.9 519 3.7 2.1
Trucks 5 7.8 3.9 10 5.9 3.7 6 6.0 2.2 6 4.9 3.2
Motorcycles -1 -
1 -
1 1 4.67 -
2 -
1 -
1 -
1 1 4.7 -
2
All 299 4.9 1.5 897 4.4 2.5 333 3.9 1.0 526 3.7 2.1
Approach M1
Left lane
Passenger Cars 870 4.1 0.9 638 3.1 1.2 787 3.3 0.6 214 2.5 0.9
Trucks 76 5.0 1.1 36 3.7 1.2 73 3.6 0.7 6 3.1 0.9
Motorcycles 20 3.7 0.6 23 2.0 1.4 15 2.9 0.6 12 1.5 1.1
All 966 4.2 1.0 698 3.1 1.3 875 3.3 0.6 233 2.5 1.0
Right lane
Passenger Cars 638 3.3 1.0 406 3.0 1.2 610 3.0 0.6 125 2.6 1.2
Trucks 20 4.7 2.1 15 3.4 0.8 18 3.6 1.0 2 2.3 0.7
Motorcycles 12 3.4 0.3 4 2.5 1.2 11 3.0 0.3 1 0.7 -
All 670 3.4 1.0 425 3.0 1.2 639 3.1 0.6 128 2.6 1.2
Approach

Zheng, Chitturi, Bill, and Noyce 12
Not considering exiting vehicles Considering exiting vehicles
nc tc (s) sdc (s) nf tf (s) sdf (s) nc tc (s) sdc (s) nf tf (s) sdf (s)
Passenger Cars 1508 3.8 1.1 1044 3.0 1.2 1397 3.2 0.6 339 2.6 1.0
Trucks 96 4.9 1.4 51 3.6 1.1 91 3.6 0.8 8 2.9 0.9
Motorcycles 32 3.6 0.5 27 2.1 1.4 26 3.0 0.5 13 1.4 1.1
All 1636 3.8 1.1 1123 3.0 1.2 1514 3.2 0.6 361 2.5 1.1
Approach M2
Left lane
Passenger Cars 332 4.2 1.2 1700 2.9 1.1 402 3.7 0.7 450 2.2 0.7
Trucks 4 7.4 1.0 23 3.1 1.0 5 3.8 0.9 6 2.6 0.6
Motorcycles 7 3.6 0.8 45 2.1 1.3 7 3.4 0.6 19 1.6 0.8
All 343 4.2 1.2 1768 2.8 1.2 414 3.7 0.7 475 2.2 0.7
Right lane
Passenger Cars 255 3.8 1.1 2087 2.8 1.1 306 3.5 0.8 560 2.3 0.8
Trucks 10 4.8 0.9 61 3.8 1.7 9 3.8 0.5 14 2.5 0.8
Motorcycles 3 5.1 0.4 57 1.9 0.9 4 3.5 1.1 26 1.5 1.0
All 268 3.8 1.2 2206 2.8 1.1 319 3.5 0.8 600 2.2 0.8
Approach
Passenger Cars 587 4.0 1.2 3787 2.8 1.1 708 3.6 0.8 1010 2.3 0.7
Trucks 14 4.9 0.9 84 3.6 1.5 14 3.8 0.6 20 2.5 0.7
Motorcycles 10 3.6 0.8 103 2.0 1.0 11 3.5 0.6 46 1.6 0.9
All 611 4.0 1.2 3975 2.8 1.1 733 3.6 0.8 1076 2.2 0.8 1 -: missing data
2 -: value not applicable
1

Zheng, Chitturi, Bill, and Noyce 13
Comparison with Previous Studies 1
A number of U.S. studies have been conducted to estimate critical gaps and follow-up headways 2
at roundabouts. Among them, NCHRP Report 572 is one of the most comprehensive studies 3
based on 18 single-lane roundabout approaches and seven multi-lane roundabout approaches (1). 4
Also, some default critical gap and follow-up headway values are suggested in the HCM (9). In 5
2011, Schroeder, et al and Wei, et al. presented estimates of critical gaps and follow-up 6
headways for two congested triple-lane roundabout approaches in Michigan and three single-lane 7
roundabout approaches in Carmel, IN, respectively (23, 24). Except for the study by Schroeder, 8
et al in Michigan, all the above findings were not solely focused on congested roundabouts. 9
Table 3 compares the critical gaps and follow-up headways between the current study and the 10
above studies, with particular anticipation of the current congested values being lower than 11
general estimates. Standard deviations are given, if available, inside parentheses. 12
Approaches M1 and M2 (two lanes entering and circulating) had significant congestion 13
as reflected in the number of fully queued minutes (shown in Table 1). Critical gaps observed at 14
M1 and M2 are lower than the average critical gaps reported in NCHRP 572 report, but similar 15
to the minimum critical gaps observed in the NCHRP 572 study. The critical gaps found in this 16
research are lower than the critical gaps reported from the two Michigan roundabouts, possibly 17
because the roundabouts in the Michigan study were not congested. Follow-up headways at M1 18
and M2 are similar to values reported in the NCHRP 572 study and slightly smaller than values 19
reported in Michigan study. 20
Critical gaps at approach C2 (two lanes entering and one lane circulating) were slightly 21
higher than the average but within the range of values reported in the NCHRP 572 study. Follow-22
up headways at C2 were considerably higher than the average values reported in NCHRP 572 23
study. The higher critical gaps and follow-up headways could be due to limited congestion as 24
well as an upgrade of four percent on the approach to the roundabout. 25
Critical gap observed at C1 was higher than the average but within the range of critical 26
gap values reported in NCHRP 572 study for a single lane approach. Also the critical gap at C1 27
(5.5 s) is considerably higher than the critical gaps reported in the Carmel study (3.79 and 3.39 s). 28
Possible reasons could be higher congestion as well as better driver familiarity with roundabouts 29
in Carmel which has over 60 roundabouts currently. The follow-up headway at C1 was same as 30
the lower bound reported in NCHRP 572 study but higher than the values reported in Carmel 31
study. 32
33
34
35
36
Table 3 COMPARISON WITH PREVIOUS FINDINGS 37
Single entering lane Multiple entering lanes
Critical gap (s)
Current study** C1 (1e-2c*) 5.5 (1.9) C2 Left 5.0 (1.7)
(2e-1c*) Right 4.4 (0.4)
Both 4.9 (1.5)

Zheng, Chitturi, Bill, and Noyce 14
M1 Left 4.2 (1.0)
(2e-2c*) Right 3.4 (1.0)
Both 3.8 (1.1)
M2 Left 4.2 (1.2)
(2e-2c*) Right 3.8 (1.2)
Both 4.0 (1.2)
NCHRP 572 Average 5.0 (1.2) Left Average 4.8 (2.1)
(Method 2) Range 4.2 – 5.9 Range 4.2 – 5.5
Right Average 4.3 (1.5)
Range 3.4 – 4.9
Both Average 4.5 (1.7)
HCM 2010 1e-1c* 5.19 2e-1c* 5.19
1e-2c* 4.11 2e-2c* 4.29
Carmel study Site A - WB 3.79 (0.59)
Site B - SB -
Site B - EB 3.39 (0.49)
Michigan study** Site 1 4.58
Site 2 5.41
Combined 4.66
Follow-up headways (s)
Current study** C1(1e-2c*) 2.6 (1.4) C2 Left 4.4 (2.5)
(2e-1c*) Right 4.9 (2.7)
Both 4.4 (2.5)
M1 Left 3.1 (1.3)
(2e-2c*) Right 3.0 (1.2)
Both 3.0 (1.2)
M2 Left 2.8 (1.2)
(2e-2c*) Right 2.8 (1.1)
Both 2.8 (1.1)
NCHRP 572 Average 3.4 (1.2) Left Average 3.1 (1.4)
(Method 2) Range 2.6 – 3.7 Range 2.9 – 5.0
Right Average 3.0 (1.2)
Range 2.8 – 4.4
Both Average 3.1 (1.3)
HCM 2010 Default 3.2 Default 3.2
Carmel study Site A - WB 2.43 (0.63)
Site B - SB 2.10 (0.66)
Site B - EB -
Michigan study** Site 1 3.37 (1.36)
Site 2 3.27 (1.40)
Combined 3.34 (1.37)
* 1e (2e) - 1c (2c): one (or two) entering lane(s) against one (or two) circulating lane(s);
** : studies on congested roundabouts
- : data not available
Differences among Vehicle Types 1
In HCM, for a minor stream of a two-way stop-control intersection, the critical gap and the 2
follow-up headway are calculated in the form of a base value plus one or more adjustments (9). 3
The proportion of heavy vehicles is considered one of the adjustments for both critical gap and 4
follow-up headway (9). However, for roundabouts, the differences in critical gaps and follow-up 5

Zheng, Chitturi, Bill, and Noyce 15
headways among vehicle types have not been examined yet. In the current study, critical gaps 1
and follow-up headways were estimated for three vehicle types. The comparisons between 2
vehicle types are summarized in Table 4, where PC stands for passenger car, TK stands for truck, 3
and MC stands for motorcycle. 4
For M1 and M2, a consistent decreasing trend was observed from trucks to motorcycles. 5
When the exiting vehicles were not considered, the trucks were 0.9 – 1.1 seconds higher than 6
passenger cars in critical gap and 0.6 – 0.8 seconds higher in follow-up headway. The passenger 7
cars were 0.2 – 0.4 seconds higher than motorcycles in critical gap and 0.8 – 0.9 seconds higher 8
in follow-up headway. When the exiting vehicles were considered, the differences generally 9
reduced. The trucks were 0.2 – 0.4 seconds higher than passenger cars in critical gap and 0.2 – 10
0.3 seconds higher in follow-up headway. The passenger cars were 0.1 – 0.2 seconds higher than 11
motorcycles in critical gap and 0.7 – 1.2 seconds higher in follow-up headway. 12
For C1 and C2, the sample sizes were relatively small and the trends from trucks to 13
motorcycles were less consistent. However, without considering the estimates based on small 14
samples (* values in Table 4), , the trucks still had highest critical gaps and follow-up headways 15
than passenger cars, and the passenger cars were higher than motorcycles in follow-up headway. 16
17
TABLE 4 Comparison of Critical Gaps and Follow-up Headways among Vehicle Types 18
Actual Values (s)
Not Considering Exiting Vehicles Considering Exiting Vehicles
Approach TK PC MC TK PC MC
Approach based critical gap (s)
C1 6.3 5.5 4.9 * 5.1 4.6 3.2 *
C2 7.8 * 4.8 - 6.0 * 3.9 -
M1 4.9 3.8 3.6 3.6 3.2 3.0
M2 4.9 4.0 3.6 3.8 3.6 3.5
Approach based follow-up headway (s)
C1 3.9 * 2.6 1.6 1.9 * 2.3 1.5
C2 5.9 4.4 4.7 * 4.9 * 3.7 4.7 *
M1 3.6 3.0 2.1 2.9 2.6 1.4
M2 3.6 2.8 2.0 2.5 2.3 1.6
- : data not available
* : estimates based on no more than ten samples
19

Zheng, Chitturi, Bill, and Noyce 16
Effects of Considering Exiting Vehicles 1
Consideration of exiting vehicles changes the samples for gaps. With a new sample of gaps, the 2
estimated critical gap is subject to change as well. By considering the influence of exiting 3
vehicles, two successively entering vehicles that used the same circulating gap might be using 4
different gaps. As a result, the headway between two such successively entering vehicles is no 5
longer a follow-up headway sample. Such change in follow-up headway samples could change 6
the average follow-up headway. Further, since critical gap and follow-up headway might change 7
with considering exiting vehicles, so might their trends with certain factors, such as queue length. 8
More fundamentally, the change in gaps could also affect the observation of drivers’ gap 9
acceptance behavior. 10
Reduction of Estimates 11
In the research by Mereszczak, et al., a significant average reduction of 1.0 seconds in critical 12
gap was found at single-lane roundabouts when exiting vehicles were considered (10). In the 13
current study, effects of exiting vehicles was considered on critical gap and follow-up headway 14
and at single-lane and multi-lane entry roundabout approaches. 15
Comparison results are shown in Table 2. Standard t-test was used for testing significance. 16
For critical gaps, since log-normal distribution is assumed, a transformation to normal 17
distribution is needed before applying t-test. All reductions were found to be significant at the 18
0.05 level. For single entry lane approach C1, the reduction of critical gap is 0.9 seconds, close to 19
what Mereszczak et al. found for single-lane roundabouts (10). Additionally, the follow-up 20
headway was reduced by 0.3 seconds. For multi entry lane approaches (C2, M1, and M2), the 21
reductions of critical gap range from 0.5 seconds to 0.9 seconds in left lanes, 0.3 seconds to 0.4 22
seconds in right lanes, and 0.4 seconds to 1.0 seconds in both lanes. The reductions of follow-up 23
headway range from 0.6 seconds to 0.7 seconds in the left lanes, 0.4 seconds to 1.0 seconds in 24
right lanes, and 0.5 seconds to 0.7 seconds in both lanes. 25

Zheng, Chitturi, Bill, and Noyce 17
TABLE 5 Primary Effects of Considering the Exiting Vehicles 1
Not Considering
Exiting Vehicles
Considering
Exiting Vehicles Reduction(s) p
Significant
Difference?
α = 0.05 Approach
Samples Mean (s) Std.
Dev (s) Samples Mean (s)
Std.
Dev (s)
Critical gap
C1 548 5.5 1.9 587 4.6 1.2 0.9 < 10-67
Yes
C2 Left 239 5.0 1.7 267 3.9 1.0 1.1 < 10-48
Yes
Right 60 4.4 0.4 66 4.0 0.7 0.4 < 10-5
Yes
Both 299 4.9 1.5 333 3.9 1.0 1.0 < 10-55
Yes
M1 Left 966 4.2 1.0 875 3.3 0.6 0.9 < 10-191
Yes
Right 670 3.4 1.0 639 3.1 0.6 0.3 < 10-15
Yes
Both 1636 3.8 1.1 1514 3.2 0.6 0.6 < 10-145
Yes
M2 Left 343 4.2 1.2 414 3.7 0.7 0.5 < 10-22
Yes
Right 268 3.8 1.2 319 3.5 0.8 0.3 < 10-6
Yes
Both 611 4.0 1.2 733 3.6 0.8 0.4 < 10-25
Yes
Follow-up headway
C1 1223 2.6 1.4 828 2.3 1.0 0.3 < 10-18
Yes
C2 Left 774 4.4 2.5 464 3.7 2.1 0.7 < 10-6
Yes
Right 123 4.9 2.7 62 3.9 2.3 1.0 < 10-1
Yes
Both 897 4.4 2.5 526 3.7 2.1 0.7 < 10-7
Yes
M1 Left 698 3.1 1.3 233 2.5 1.0 0.6 < 10-32
Yes
Right 425 3.0 1.2 128 2.6 1.2 0.4 < 10-10
Yes
Both 1123 3.0 1.2 361 2.5 1.1 0.5 < 10-39
Yes
M2 Left 1768 2.8 1.2 475 2.2 0.7 0.6 < 10-71
Yes
Right 2206 2.8 1.1 600 2.2 0.8 0.6 < 10-102
Yes
Both 3975 2.8 1.1 1076 2.2 0.8 0.6 < 10-184
Yes
2
Effect of Queue Length 3
Previous studies have shown that longer waiting times result in shorter critical gaps (25, 26). 4
Whether or not critical gaps and follow-up headways would change with the queue length behind 5
the vehicle is worth studying. As a result, critical gaps and follow-up headways from the four 6
studied approaches were plotted against queue length behind the vehicle, under both scenarios of 7
considering and not considering exiting vehicles (Figure 3). For critical gaps, the queue lengths 8
refer to the numbers of vehicles behind the entering vehicles. For follow-up headways, the queue 9
lengths refer to the numbers of vehicles behind the following vehicles. A minimum sample size 10
requirement of six was chosen for estimating each data point in Figure 3. In fact, most of the 11
sample sizes ranged from 10 to 300. Only eight data points (out of the entire 123 data points) had 12
sample sizes below ten. 13
In Figure 3a, the critical gaps are randomly distributed across the range of 3 to 6 seconds, 14
no particular trend could be found as the queue length increases. When the exiting vehicles were 15
considered (Figure 3b), the bandwidth of critical gaps narrows between 3 and 5 seconds, and as 16
the queue length increases, the critical gaps converge slightly better. In Figure 3c, the follow-up 17
headway of C2 decreases dramatically as the queue length increases, while the follow-up 18
headways of other approaches remain relatively constant within a 1-second bandwidth. When the 19
exiting vehicles were considered (Figure 3d), the decreasing trend of S2 is alleviated, and the 20
follow-up headways of other approaches decrease further but still remain approximately in a 1-21
second bandwidth, with only a slight decreasing trend. In summary, without considering exiting 22

Zheng, Chitturi, Bill, and Noyce 18
vehicles, no consistent trend was found for critical gap or follow-up headway as queue length 1
changed; when exiting vehicles were considered, both critical gap and follow-up headways 2
tended to be slightly more consistent across roundabout sites as queue length increased. 3
4
(a) (b)
(c) (d)
FIGURE 3 Effects of queue length: (a) critical gap vs. queue length without exiting vehicles; (b) 5 critical gap vs. queue length with exiting vehicles; (c) follow-up headway vs. queue length without 6
exiting vehicles; (d) follow-up headway vs. queue length with exiting vehicles. 7
3
3.5
4
4.5
5
5.5
6
0 1 2 3 4 5 6 7 8 9 10 11
Cri
tica
l Ga
p (
s)
Queue Length
Critical Gap vs. Queue Length(not considering exiting vehicles)
C1 C2
M1 M2
3
3.5
4
4.5
5
5.5
6
0 1 2 3 4 5 6 7 8 9 10 11
Cri
tica
l Ga
p (
s)
Queue Length
Critical Gap vs. Queue Length(considering exiting vehicles)
C1 C2
M1 M2
1.5
2
2.5
3
3.5
4
4.5
0 1 2 3 4 5 6 7 8 9 10 11
Foll
ow
-up
He
ad
wa
y (s
)
Queue Length
Follow-up Headway vs. Queue Length(not considering exiting vehicles)
C1 C2
M1 M2
1.5
2
2.5
3
3.5
4
4.5
0 1 2 3 4 5 6 7 8 9 10 11
Foll
ow
-up
He
ad
wa
y (s
)
Queue Length
Follow-up Headway vs. Queue Length(considering exiting vehicles)
C1 C2
M1 M2

Zheng, Chitturi, Bill, and Noyce 19
Reducing Variability of Gap Acceptance 1
In the current study, when exiting vehicles were not considered, 187 drivers were observed with 2
smaller accepted gaps compared with the largest rejected gaps, which violated the assumption of 3
MLM and have been called “inconsistent drivers” (22). Several reasons could have resulted in 4
these observations. First, with certain factors, such as increased waiting time, drivers might tend 5
to accept smaller gaps and become inconsistent in critical gaps (25-27, 30). Second, randomness 6
might exist when drivers evaluated gaps. Third, random errors could occur during the data 7
collection (e.g., time stamp extraction) and lead to imprecise gap measuring. Last, without 8
considering exiting vehicles, two or more small gaps involving exiting vehicles might be counted 9
as a large gap but still be rejected. Thus, the below analysis aims to answer to what extent the 10
variability of gap acceptance could be affected by including exiting vehicles. 11
For quantitative measurement, acceptance variation is defined as the difference between 12
accepted gap and largest rejected gap, when the former is smaller than the later. Table 6 13
summarizes the statistics of acceptance variations. The cumulative distributions of acceptance 14
variations are shown in Figure 4. The results indicate that when the exiting vehicles were 15
considered, 1) the range of average acceptance variations dropped from 0.73 – 2.15 seconds to 16
0.66 – 1.20 seconds and 2) the whole cumulative distribution of acceptance variations shifted to 17
the smaller side. However, shown by Figure 4, the reduction shift is much larger at approach C2 18
than at M1 and M2, while that of C1 is in between. The potential explanation is, since M1 and 19
M2 are multi-lane approaches, gaps were measured across circulating lanes and were already 20
small. By considering the exiting vehicles, the sample gaps had little to decrease in length; while 21
on the other hand, C2 is multi-entry against single circulating lane, large gaps were measured 22
within lane and could be reduced considerably when exiting vehicles were considered. C1, 23
although has two circulating lane, only showed heavy volume in one circulating lane for most of 24
the data collection period, thus, resulting in a reduction between C2 and multi-lane approaches. 25
For practical purposes, the average reduced acceptance variation of 0.92 seconds 26
(considering exiting vehicles) is recommended as an upper bound of driver randomness. Drivers 27
with acceptance variation smaller than 0.92 seconds could be excluded from “inconsistent 28
drivers”. Further study is needed to determine if such drivers can be included in the calculation 29
of critical gap and how the estimate will be affected. 30
31
TABLE 6 Statistics of Acceptance Variation (in second) 32
Sample
Size
Maximum
(s)
3rd
Quartile
(s)
Median (s)
1st
Quartile
(s)
Minimum
(s)
Average
(s)
Standard
Deviation (s)
Not Considering Exiting Vehicles
C1 25 5.37 2.43 1.30 0.52 0.26 1.69 1.49
C2 5 4.13 2.56 1.53 1.31 1.22 2.15 1.23
M1 127 4.31 1.18 0.60 0.23 0.01 0.73 0.64
M2 30 7.15 1.72 1.17 0.44 0.04 1.37 1.39
Considering Exiting Vehicles
C1 73 6.43 1.33 0.84 0.28 0.03 1.08 1.12
C2 20 2.08 0.94 0.57 0.16 0.02 0.66 0.55
M1 411 4.24 1.10 0.60 0.23 0.01 0.73 0.64
M2 225 6.42 1.66 0.91 0.48 0.01 1.20 1.04

Zheng, Chitturi, Bill, and Noyce 20
(a) (b)
(c) (d)
FIGURE 4 Cumulative distributions of acceptance variations: (a) approach S1; (b) approach S2; (c) 1 approach M1; (d) approach M2. 2
CONCLUSIONS AND RECOMMENDATIONS 3
With the roundabouts being relatively new to the U.S., there is limited knowledge on the 4
operational characteristics of congested roundabouts. Field data were collected at four 5
approaches of three congested roundabout in Wisconsin. A roundabout was defined as congested 6
if at least one approach had persistent queues. The objectives included investigating critical gap 7
and follow-up headway and how vehicle type, queue length, and exiting vehicles influence those 8
values needed for modeling capacity. In addition driver inconsistency was also studied. 9
Critical gaps were estimated using the maximum likelihood method assuming a log-10
normal distribution. The average critical gaps (for all vehicles) computed at the two approaches 11
(M1 and M2) that were most congested, were similar to the lower bound values reported in 12
NCHRP 572, although the standard deviations were considerably lower. Critical gaps observed 13
at C1 and C2 were higher than the average but within the range of values reported by NCHRP 14
0%
10%
20%
30%
40%
50%
60%
70%
80%
90%
100%
0 0.5 1 1.5 2 2.5 3 3.5 4 4.5 5 5.5 6 6.5 7 7.5
Cu
mu
lati
ve P
erc
enta
ge
Acceptance Variation (s)
Approach C1
C1: Without Exiting Vehicles C1: With Exiting Vehicles
0%
10%
20%
30%
40%
50%
60%
70%
80%
90%
100%
0 0.5 1 1.5 2 2.5 3 3.5 4 4.5 5 5.5 6 6.5 7 7.5
Cu
mu
lati
ve P
erc
enta
ge
Acceptance Variation (s)
Approach C2
C2: Without Exiting Vehicles C2: With Exiting Vehicles
0%
10%
20%
30%
40%
50%
60%
70%
80%
90%
100%
0 0.5 1 1.5 2 2.5 3 3.5 4 4.5 5 5.5 6 6.5 7 7.5
Cu
mu
lati
ve P
erc
enta
ge
Acceptance Variation (s)
Approach M1
M1: Without Exiting Vehicles M1: With Exiting Vehicles
0%
10%
20%
30%
40%
50%
60%
70%
80%
90%
100%
0 0.5 1 1.5 2 2.5 3 3.5 4 4.5 5 5.5 6 6.5 7 7.5
Cu
mu
lati
ve P
erc
enta
ge
Acceptance Variation (s)
Approach M2
M2: Without Exiting Vehicles M2: With Exiting Vehicles

Zheng, Chitturi, Bill, and Noyce 21
572. Follow-up headways at three approaches (C1, M1, and M2) were similar to values reported 1
in NCHRP 572 study. Follow-up headway at C2 was considerably higher possibly due to limited 2
congestion and presence of an upgrade of four percent on the approach. 3
Vehicle type was found to have considerable effect on average critical gap and follow-up 4
headway. Similar to other intersection types, trucks had the highest values for both critical gap 5
and follow-up headway followed by passenger cars and motorcycles. Results from two 6
approaches with substantial trucks and motorcycles suggest that average critical gap (when 7
exiting vehicles were not considered) of trucks was about 1.0 seconds higher than that of cars 8
while cars were about 0.3 seconds higher than motorcycles. Average follow-up headway (without 9
considering exiting vehicles) followed a similar trend with trucks greater than cars by 0.7 10
seconds and cars greater than motorcycles by 0.8 seconds. The differences in critical gaps and 11
follow-up headways between vehicle types reduced when exiting vehicles were considered. 12
Considering the significant difference in average critical gap and follow-up headway between 13
vehicle types, it is strongly recommended that a weighted average of critical gaps/follow-up 14
headways be used in capacity analysis, especially at locations with significant trucks. Data 15
would need to be collected at more sites to validate critical gap and follow-up headway for 16
specific vehicle types. 17
Considering exiting vehicles was found to reduce average critical gap and follow-up 18
headway significantly. Data showed a decreasing trend in critical gap and follow-up headway 19
(when exiting vehicles are considered) as the number of vehicles queued behind a vehicle 20
increase. The average and range of difference between accepted gap and largest rejected gap for 21
inconsistent drives reduced considerably when exiting vehicles were considered. Further analysis 22
should examine at what level drivers can perceive differences in gaps so that useful data are not 23
lost. 24
This study illustrates the effects of vehicle type, queue length, and exiting vehicles on 25
critical gap and follow-up headway values. Since critical gap and follow-up headway are the 26
main variables in the capacity model, care should be used in understanding what values should 27
be used. 28
29
30

Zheng, Chitturi, Bill, and Noyce 22
ACKNOWLEDGEMENTS 1
The authors gratefully acknowledge support of this study from the Wisconsin Department of 2
Transportation under the supervision of Rebecca Szymkowski. Brian Porter, Kelvin Santiago, 3
Michael DeAmico, Julia McAdams, and Caralee Corcoran from the University of Wisconsin-4
Madison are recognized for their help with data collection and reduction. 5
REFERENCES 6
1. Rodegerdts, L., M. Blogg, E. Wemple, E. Myers, M. Kyte, M. Dixon, G. List, A. Flannery, R. 7
J. Troutbeck, W. Brilon, and Others. NCHRP Report 572: Roundabouts in the United States, 8
2007. 9
2. Johnson, M. T., and H. N. Isebrands. Access Management Considerations for High Capacity 10
Multi-Lane Roundabout Design and Implementation. In 8th National Access Management 11
Conference - Sustainable Solutions for Transportation, Baltimore, MD, 2008, pp. 16. 12
3. Troutbeck, R. Capacity and Design of Traffic Circles in Australia. In Transportation 13
Research Record, No. 1398, 1993. 14
4. Schoon, C., and Van Minnen J. The Safety of Roundabouts in the Netherlands. In Traffic 15
Engineering & Control, Vol. 35, No. 3, Hemming, 1994, pp. 142-148. 16
5. Elvik, R., A. B. Mysen, and T. Vaa. Traffic Safety Handbook (Norwegian). Institute of 17
Transport Economics, Oalo, Norway; T\O I, 1997. 18
6. Flannery, A., and L. Elefteriadou. A Review of Roundabout Safety Performance in the 19
United States. In Proceedings of the 69th Annual Meeting of the Institute of Transportation 20
Engineers (CD-ROM), Institute of Transportation Engineers, Washington, DC, 1999. 21
7. Persaud, B. N., R. A. Retting, P. E. Garder, and D. Lord. Safety Effect of Roundabout 22
Conversions in the United States: Empirical Bayes Observational Before-After Study. In 23
Transportation Research Record: Journal of the Transportation Research Board, Vol. 1751, 24
No. 01, Transportation Research Board, 2001, pp. 1-8. 25
8. Rodegerdts, L., J. Bansen, C. Tiesler, J. Knudsen, E. Myers, M. Johnson, M. Moule, B. 26
Persaud, C. Lyon, S. Hallmark, H. Isebrands, B. R. Crown, B. Guichet, and A. O'Brien. 27
NCHRP Report 672: Roundabouts in the United States. Transportation Research Board, 28
Washington, D.C., 2010. 29
9. Highway Capacity Manual. Transportation Research Board, 2010. 30
10. Mereszczak, Y., M. P. Dixon, M. Kyte, L. A. Rodegerdts, and M. L. Blogg. Including 31
Exiting Vehicles in Capacity Estimation at Single-Lane U.S. Roundabouts. In Transportation 32
Research Record: Journal of the Transportation Research Board, Vol. 1988, 2006, pp. 23-30. 33
11. Drew, D. Gap Acceptance Characteristics for Ramp-Freeway Surveillance and Control. In 34
Highway Research Record, Vol. 157, 1967, pp. 108-143. 35
12. Raff, M. S. A Volume Warrant for Urban Stop Signs. Saugatuck, Conn., 1950. 36
13. Blunden, WR and Clissold, CM and RB. Distribution of Acceptance Gaps for Crossing and 37
Turning Manoeuvres. In Proc. Australian Road Res., 1962. 38

Zheng, Chitturi, Bill, and Noyce 23
14. Ashworth, R., and B. Green. Gap Acceptance at an Uncontrolled Intersection. In Traffic 1
Engineering Control, 1966. 2
15. Moran, P. A. P. Estimation from Inequalities. In Australian & New Zealand Journal of 3
Statistics, Vol. 8, No. 1, 1966, pp. 1-8. 4
16. Ashworth, R. A Note on the Selection of Gap Acceptance Criteria for Traffic Simulation 5
Studies. In Transportation Research, 1968. 6
17. Hondermarcq, H. Essais De Priorité á Gauche. In 9th International Study Week on Road 7
Traffic Flow and Safety, Munich, 1968. 8
18. McNeil, D., and J. Morgan. Estimating Minimum Gap Acceptances for Merging Motorists. 9
In Transportation Science, Vol. 2, No. 3, 1968, pp. 265-277. 10
19. Miller, A., and R. Pretty. Overtaking on Two-Lane Rural Roads. In Proc. Aust. Road Res. 11
Board, Vol. 4, 1968, pp. 582-591. 12
20. Miller, A. Nine Estimators of Gap-Acceptance Parameters. In Traffic Flow and 13
Transportation, 1972, pp. 215-236. 14
21. Brilon, W., R. Koenig, and R. J. Troutbeck. Useful Estimation Procedures for Critical Gaps. 15
In Transportation Research Part A: Policy and Practice, Vol. 33, No. 3-4, Elsevier, 1999, pp. 16
161-186. 17
22. Troutbeck, R. J. Estimating the Critical Acceptance Gap from Traffic Movements. In 18
Physical Infrastructure Centre Research Report, Queensland University of Technology. 19
Physical Infrastructure Center., Queensland, 1992, pp. 1-23. 20
23. Schroeder, B., K. Salamati, N. M. Rouphail, and C. Cunningham. Empirical Evaluation of 21
Lane-by-Lane Capacities of Congested Triple-Lane Roundabout Approaches. In 3rd 22
International Conference on Roundabouts, Transportation Research Board, Carmel, Indiana, 23
2011. 24
24. Wei, T., J. Grenard, and H. Shah. Developing Capacity Models for Local Roundabouts: A 25
Streamlined Process. In 3rd International Conference on Roundabouts, Transportation 26
Research Board, Carmel, Indiana, 2011. 27
25. Polus, A., S. S. Lazar, and M. Livneh. Critical Gap as a Function of Waiting Time in 28
Determining Roundabout Capacity. In Journal of Transportation Engineering, Vol. 129, 29
2003, pp. 504. 30
26. Cassidy, M., S. Madanat, M. H. Wang, F. Yang, and R. J. Troutbeck. Unsignalized 31
Intersection Capacity and Level of Service: Revisiting Critical Gap. In Transportation 32
Research Record, No. 1484, National Research Council, 1995, pp. 16-23. 33
27. Mensah, S., S. Eshragh, and A. Faghri. A Critical Gap Analysis for Modern Roundabouts. In 34
Transportation Research Board 89th Annual Meeting, 2010. 35
28. Wang, R., W. ZHANG, and M. Qinghai. Effects of Driver Behavior on Traffic Flow at 36
Three-lane Roundabouts. In International Journal of Intelligent Control and Systems, Vol. 10, 37
No. 2, 2005, pp. 123-130. 38

Zheng, Chitturi, Bill, and Noyce 24
29. A Policy on Geometric Design of Highways and Streets. American Association of State 1
Highway And Transportation Officials, Washington DC, 2001. 2
30. Daganzo, C. Estimation of Gap Acceptance Parameters within and across the Population 3
from Direct Roadside Observation. In Transportation Research Part B: Methodological, Vol. 4
15B, 1981, pp. 1-15. 5