critical care capacity management: understanding the role ...cc3179/icusdu_2017.pdf · sizing...
TRANSCRIPT

Critical Care Capacity Management:Understanding the role of a Step Down Unit
Mor ArmonyStern School of Business, New York University [email protected]
Carri W. ChanDecision, Risk, and Operations, Columbia Business School [email protected]
Bo ZhuCourant Institute of Mathematical Sciences, New York University [email protected]
In hospitals, Step Down Units (SDUs) provide an intermediate level of care between the Intensive Care Units (ICUs)
and the general medical-surgical wards. Because SDUs are less richly staffed than ICUs, they are less costly to operate;
however, they also are unable to provide the level of care required by the sickest patients. There is an ongoing debate in
the medical community as to whether and how SDUs should be used. On one hand, an SDU alleviates ICU congestion by
providing a safe environment for post-ICU patients before they are stable enough to be transferred to the general wards.
On the other hand, an SDU can take capacity away from the already over-congested ICU. In this work, we propose a
queueing model of patient flow through the ICU and SDU in orderto determine when an SDU is needed, what size it
should be, and what are the main drivers influencing these decisions. Using first and second order analysis, we examine the
tradeoff between reserving capacity in the ICU for the most critical patients versus gaining additional capacity achieved
by allocating nurses to the SDU due to the lower staffing requirement. We find that under some circumstances the optimal
size of the SDU is zero, while in other cases, having a sizableSDU may be beneficial. Moreover, we identify two
parameters which play a prominent role in the SDU sizing decision:p, which captures the demand for SDU beds, andν,
which captures the supply gains by moving nurses to the SDU. The insights from our work provide rigorous justification
for the variation in SDU use seen in practice as well as highlight which factors should be considered when making such
sizing decisions for critical care.
Key words: Healthcare, critical care, patient flow, queueing, fluid analysis, diffusion analysis, state-space collapse
1. Introduction
Step Down Units (SDUs) provide an intermediate level of carebetween the Intensive Care Units (ICUs) and
the general medical-surgical wards. These units, which arealso commonly referred to as intermediate care
units and transitional care units, are found in many, but notall, hospitals in developed nations. Typically,
these units are staffed at a higher nurse to patient ratio than general medical-surgical wards but not as high
as ICUs. ICUs care for the sickest patients and consume a disproportionate share of total health care costs
(nearly $82 billion annually (Halpern and Pastores 2010), which amounts to 20-35% of total hospital costs
with ICU beds occupying only 5-10 percent of inpatient beds (Joint Commission Resources 2004)). Con-
sequently, a voluminous literature in both the medical and operations communities exists that addresses the
1

2
need to understand and improve how these units function (see, for example, Chalfin et al. (2007), Chan et al.
(2012), Kc and Terwiesch (2012), Kim et al. (2015), Shmueli et al. (2003)). In contrast, very few studies
address these issues with respect to SDUs, despite the fact that, in hospitals that have them, the SDU plays
an important role in patient flow through the ICU.
The purpose of an SDU is to treat patients who are more severe than the typical ward patient, but who do
not require as intense monitoring as the most critical ICU patients. The basic premise of having an SDU is
that it can both care for sicker patients and, at the same time, take pressure off the ICU, thereby resulting
in both better patient outcomes as well as increased efficiency (Byrick et al. 1986, Zimmerman et al. 1995).
Despite this promise, there is high variation in the presence and size of SDUs as the medical community
debates the use of these units. Our goal in this work is to identify the main drivers which dictate how these
units should be sized.
Semi-critical patients who can be treated in the SDU can generally be treated in the ICU without any
impact on their quality of care. Conversely, due to the lowerstaffing requirements in the SDU, critical
patients who are treated in the SDU will not be able to receivethe high level monitoring and care provided
in the ICU, resulting in substantial degradation of their quality of care. Hence, not only do ICUs provide
care for the sickest patients, they can also be considered ‘flexible servers’ in the sense that they can also
treat moderately severe patients. However, largely due to the high nurse-to-patient ratio requirement, they
are more costly to operate than SDUs. In California, an ICU islegally obligated to have at least one nurse
for every two ICU patients; in practice, many hospitals operate with one nurse per patient. In contrast, SDUs
can be staffed anywhere from one nurse per two to four patients. In particular, the SDU can accommodate
more patients for the same number of nurses. This creates a delicate tradeoff between overall capacity gains
(SDU) for all critical patient severities versus maintaining more capacity for the most severely ill patients
(ICU).
In theory, having a single large unit where the level of care of each bed can be dynamically flexed up
or down would be more desirable than fixing the nurse allocation, as discussed in a recent opinion/survey
article (Vincent and Rubenfeld 2015). However, the authorsadmit there is no evidence that such a solution is
better than separate units and implementing this large unitmay be practically infeasible at many institutions.
First, all the beds would need to be equipped and legally certified to provide critical care. If some of these
beds are only rarely, if ever, used in a critical care capacity, this would incur unnecessary overhead costs.
Second, not having a dedicated unit for semi-critical patients will likely result in critical patients receiving
priority in bed assignment over semi-critical patients in the large common unit. This would potentially lead
to higher than desirable levels of off-placement of semi-critical patients. Third, nursing staff have been very
reluctant to adopt such a solution as they prefer to have a level of predictability during their shift, which
changing the level of care provided would not allow. Due to the high stress required to provide critical
care, ICU nurses have the highest turnover. Implementing flexible staffing would increase dissatisfaction
3
which could result in higher turnover and more medical errors (Strachota et al. 2003). While a few hospitals
have tried to implement units with these flexible capabilities, achieving such benefits in practice has been
extremely challenging due to a number of logistical hurdles(see Kwan (2011) and related references). Unit
reconfigurations typically occur once or twice a year, if they happen at all. As such, we focus on the strategic
decision of nurse allocation to determine the fixed ICU and SDU capacity.
While physical space, beds, or specialized equipment couldbe the constraining resource, in many cases,
nurses staffing is the bottleneck. For example, in California, despite availability of more physical beds, only
75% of adult ICU beds are staffed (State of California Office of Statewide Health Planning & Development
2010-2011). Thus, our primary focus will be on how to allocate nurses between the ICU and SDU. Many
hospitals use critical-care nurses to staff the SDU (e.g. Eachempati et al. (2004), Harding (2009)) in order to
ensure that the nurses are capable of dealing with any complications which could arise in the unit. However,
if a hospital (e.g. Aloe et al. (2009)) elected to use medical-surgical nurses in their SDU, allocating more
beds to the SDU would have an additional benefit (over capacity gains) of lower staffing costs. Because of
strict nurse-to-patient ratios, the number of nurses fullydictates the number of beds and we will use the two
terms (nurse versus bed allocation) interchangeably.
Patient flows into SDUs can come from various sources. For instance, patients can be directly admitted
to an SDU from the Emergency Department if they are deemed toosick for the ward, but not so sick that
they require ICU care. Alternatively, some SDUs are used forpost-operative patients with fairly standard
recovery patterns, but who need additional monitoring in the event of complications due to surgery. While
the original intent of the SDU was to provide ‘Step-Down’ care for patients post-ICU, patients are some-
times placed in the SDU prior to ICU care if the ICU is too congested to immediately admit the patient.
These complex flow patterns make studying SDUs quite challenging. A number of hospitals (e.g. Cady et al.
(1995) and Eachempati et al. (2004)) only admit post-ICU patients into their SDU, while others allow dif-
ferent admission patterns as described above. In order to maintain tractability and gain some insight into
the role of SDUs in the care of critical patients, we focus ouranalytic model on the case where the SDU is
a true ‘Step Down Unit’ and patients are admitted only after being discharged from the ICU. We will then
use simulation to examine how our insights translate to morecomplex patient flow patterns.
One could consider utilizing a simulation study (e.g. Mathews and Long (2015)) to exhaustively search
over different possible ICU and SDU bed allocations. While this can provide useful prescriptive insight for a
specific hospital setting, simulation studies can obscure the type of insights made possible via analysis of an
analytic model, which is what we focus on in this work. In identifying important parameters which drive the
bed allocation and balking threshold decisions, we also provide an initial framwork for hospital administra-
tors to think about collecting data when making sizing decisions for their own institution. Another approach
one could consider is to utilize Dynamic Programming (e.g. Best et al. (2015)). Given the complexity of
bed allocation problem, Best et al. (2015) rely on heuristicsolutions–this likely would also be required in

4
our setting given the additional patient flow dynamics we incorporate into our model. As such, we turn to a
queueing model approach and rely on fluid and diffusion approximations to gain insights.
We introduce a queueing model of critical patients who arrive to the ICU. If there is an available bed,
a patient will be treated immediately. If there is a long queue of critical patients waiting for an ICU bed,
the patient will immediately balk and be sent for care at another hospital. Otherwise, he will be treated
in another hospital bed while waiting to be admitted to the ICU. If the wait is too long, the patient will
eventually recover and no longer need ICU care or, in the mostextreme case, die due to the long wait–we
refer to such events as patient ‘abandonment’. A critical patient who is admitted to the ICU will be treated
until reaching either a stable enough state to leave the ICU/SDU system or a semi-critical state where he
can be treated in the SDU or stay in the ICU. To capture the factthat demand pressures from sicker patients
can lead to patient discharges from the ICU (Kc and Terwiesch2012), we allow for semi-critical patients to
be bumped out of the ICU if a critical patient requires a bed.
The hospital’s objective is to determine the size of the SDU and ICU and the balking threshold in order
to minimize the costs associated with patient balking, abandonment, holding in queue, and bumping. Cost
minimization and reward maximization formulations are common in the healthcare literature (see for exam-
ple, Green et al. (2006a), Chan et al. (2012), Mills et al. (2013), Mason et al. (2014), Best et al. (2015),
Mills et al. (2015) among others).
Our main contributions can be summarized as follows:
• We find that even under the optimal SDU sizing decisions, the number of beds allocated to the SDU
is likely to be highly varied in practice. In particular, we find there exist two operational regimes which
depend on the relative costs between lack of access for critical and semi-critical patients. In one–the ICU
Driven (ID) regime–virtually all nurses are allocated to the ICU (so the SDU is very small or is of size zero),
and the system only incurs costs related to the bumping of semi-critical patients. While in the other–the
Capacity Driven (CD) regime–a significant number of nurses are allocated to both units, and only costs
related to critical patients (balking, abandonment and holding) are incurred.
• We identify main drivers which influence the joint sizing decision of ICUs and SDUs. In particular,
we find two parameters which arise in our first and second orderanalysis of the optimal nurse allocation
between ICUs and SDUs. The first factor relates to the demand of SDUs, as captured by the proportion
of critical patients who become semi-critical,p. The second factor related to the supply of capacity, as
captured by the ratio between effective ICU capacity and effective SDU capacity,ν. These two factors arise
additively, suggesting they both have equal importance in influencing the ICU and SDU sizing decision.
We find that optimizing the balking threshold is a second (or higher) order factor. As such, the tradeoff
between balking and waiting is a second order effect, while the tradeoff between capacity for critical patients
(ICU) and overall capacity (SDU) is a first order factor.

5
• Via simulation analysis, we examine whether our insights translate to a more complex model of patient
flow. We find that the solutions obtained from our first and second order approximations result in good out-
comes compared to an exhaustive search, despite our analytic model not incorporating all patient dynamics.
This suggests that the main drivers of the unit sizing decision are robust to model specifications.
1.1. Literature Review
Our work is most related to three bodies of research: 1) medical literature on ICU and SDU care, 2) work in
healthcare operations management on capacity and patient flow management, and 3) the queueing literature.
While there exists an extensive body of literature in the medical community on ICUs–there are multiple
journals, includingCritical CareandIntensive Care Medicine, devoted to this topic–much less attention has
been directed towards SDUs. The majority of work related to SDUs has focused on the impact of SDUs on
ICU care. Though there may not be a general consensus as to whether SDUs can be cost-effective for treating
semi-critical patients (Keenan et al. 1998), there are a number of studies focused on either specific ailments
or at individual institutions which suggest the presence ofan SDU can benefit patients. For instance, having
an SDU can reduce ICU length-of-stay (LOS) (Byrick et al. 1986); this is intuitive because patients do not
have to reach as high a level of stability to be discharged from the ICU to the SDU rather than the general
medical/surgical floor. In a study of patients with Acute Myocardial Infarction, the presence of an SDU was
shown to reduce cost by $1.5 million a year for the treatment of patients with moderate risk (Tosteson et al.
1996). It is also argued there that high risk patients shouldnot be treated in the SDU.
There has been some work in operations management looking atstaffing in healthcare (e.g. Green et al.
(2006b), de Vericourt and Jennings (2008), Yankovic and Green (2011), Yom-Tov and Mandelbaum
(2014)). Most of the prior work focuses on a single unit and have not considered the impact of a step-down
unit. In recent work, Best et al. (2015) takes a utilization maximization approach to partitioning hospitals
into different units. The focus is on how many beds to allocate to eachtypeof medical service in the general
ward. In contrast, we consider multiplelevelsof care: the ICU and SDU. Chan et al. (2014a) also looks
at patient flows through the ICU and SDU, but takes an empirical approach to consider how SDU bed
availability impacts patient outcomes. In contrast, this work uses a queueing approach to gain insights into
management of ICU and SDU capacity and patient flows in a scenario where increasing the capacity of
the SDU necessarily results in reduced ICU capacity. Indeed, we find scenarios where, due to this capacity
tradeoff, it is optimal to have no SDU. Recent work by Mathewsand Long (2015) uses a simulation model
to examine the role of an SDU in critical care. In contrast to our work, the authors do not consider the
operational impact of proposed changes. As such, they find, for example, that allocating all beds to the ICU
results in the best outcomes; however, they do not consider the need to hire additional nurses to enable such
a configuration.
In capturing the patient flow dynamics through an ICU and an SDU, we consider a modification to
the commonly used N-model queueing system (see Figure 16 in Gans et al. (2003)). The N-model arises
6
in our case due to the fact that the ICU consists of flexible beds (servers), while the SDU does not.
In our setting, once a critical patient completes treatment(service) in the ICU, he may transition into a
semi-critical patient who can be treated in either the ICU orSDU. This patient flow dynamic introduces
a feedback into our model, which is not captured by existing N-models. In various settings, a thresh-
old priority policy for routing patients to the flexible servers (Bell and Williams 2001, Tezcan and Dai
2010, Ghamami and Ward 2012), and a generalized C-µ priority policy (Mandelbaum and Stolyar 2004,
Dai and Tezcan 2008, Gurvich and Whitt 2009b) have been shownto minimize costs for the N-model in
heavy traffic asymptotic regimes. With the exception of Wallace and Whitt (2005) and Gurvich and Whitt
(2010), in all of these works, prioritization and routing ofcustomers is the primary concern. In contrast, in
the hospital setting, routing is largely dictated by medical necessity, so we focus on the question of staffing
and sizing of units while assuming that a prioritization androuting rule is given.
There is a rich literature on flexibility in queueing systems(e.g. Green (1985), Hopp et al. (2004),
Iravani et al. (2005), Ata and Van Mieghem (2009), Bassambooet al. (2012), Tsitsiklis and Xu (2012)). An
important aspect discussed in this literature is how to design the network topology (pairing, chaining, full
flexibility, etc.). Another focus is quantifying how to split the resources between flexible and dedicated
servers. For example, there has been a series of recent work which considers this question with respect to
tandem systems (Andradottir et al. 2012, Zhang and Ayhan 2013, Kirkizlar et al. 2012). Our work is related
to this second category as we determine how to allocate the nurses between the ICU (flexible) and the SDU
(dedicated). While we also look at a tandem system, the flow patterns exhibit different dynamics, such as
bumping, which arise in a hospital setting.
In developing an understanding of the hospital system, we utilize a number of analytic methods. To
start, we examine the system using fluid analysis (e.g. Whitt(2006), Bassamboo and Randhawa (2010)),
that uses law-of-large-number principles to evaluate costterms that are of the order of the arrival rate.
Next, we refine our analysis by using diffusion approximations as in Jagerman (1974), Garnett et al. (2002),
Mandelbaum and Zeltyn (2009), Kocaga and Ward (2010), that leverage central-limit-theorem type results
to evaluate fluctuations about the fluid limit that are of order square-root of the arrival rate. Through the
diffusion analysis, we establish a state-space collapse result similar to Gurvich and Whitt (2009a), albeit
for different dynamics in a different queueing system. Using these methodologies, we are able to evaluate
the average abandonment, holding, balking and bumping costs and optimize the balking threshold and the
size of the units to minimize these costs. In our asymptotic analysis we take formal fluid and diffusion
limits of the nurse allocation problem and then analyze the corresponding fluid and diffusion optimization
problems directly. Using simulations we demonstrate the efficacy of the asymptotic solutions for the original
system. This approach is similar to the one taken by Harrisonand Zeevi (2004), Rubino and Ata (2009),
Kostami and Ward (2009), Akan et al. (2013) and Ata et al. (2013).

7
2. Model
Patient flows through the ICU and SDU can be very complex, so westart by focusing on a streamlined
model in order to allow for tractability and to highlight themain factors which influence the optimal sizing
of these units. In Section 5, we use simulation to examine whether our insights derived from our analytic
model extend to more general patient flow dynamics.
Similar to Mathews and Long (2015), we consider two possiblehealth states for each patient:Critical or
Semi-critical. If a patient is in the critical state, hemustbe treated in the ICU. Once the patient is admitted
to the ICU, the time he is physiologically considered to be inthe critical state is exponentially distributed
with rateµC . Once a patient is no longer in the critical state, he will become a semi-critical patient with
probabilityp; with probability1− p, he leaves the ICU/SDU system. Practically, this can correspond to a
number of different situations, such as the patient being transferred to the ward, being discharged home,
or dying. Semi-critical patients can be treated in the SDU orICU. Regardless of the type of bed, the time
a patient is considered to be semi-critical is exponentially distributed with rateµSC . Note the recovery
pattern for all patients of a single type is homogenous and these rates specify ‘service times’, defined as the
expected time a patient is in a specific health state when being treated in one of the units; these times do not
necessarily correspond to the time a patient is treated in any particular unit.
We consider the case where nursing costs are the bottleneck,so we must determine how to allocate a fixed
number ofN nurses. These nurses are flexible in the sense that they can work in either the ICU or SDU.
While not all hospitals use critical-care nurses to staff the SDU, many–such as that in Eachempati et al.
(2004)–do. In such instances, the costs for each nurse is invariable to the unit she is assigned. However,
if nurses without critical care credentials are used in the SDU, the costs for SDU nurses would be lower
than that for ICU nurses. For safety reasons, a strict nurse-to-patient ratio must be maintained in each unit.
Let rI (< rS) be the given number of patients each nurse can manage in the ICU (SDU). Our goal is to
determine how to allocate nurses between the two units, which is analogous to determining the number of
ICU and SDU beds,BI andBS . Thus, the nurse allocation and bed capacity decisions are interchangeable.
We assume that no additional nurses can be hired. This means that
BI
rI+BS
rS≤N, (1)
so that we allocate up toN nurses to the ICU and SDU while satisfying the nurse-to-patient ratios. We
refer to any pair(BI ,BS) of non-negative integers that satisfy (1) as a feasible bed (nurse) allocation. As
critical-care is often a bottleneck in the hospital (Ryckman et al. 2009, Kc and Terwiesch 2012, Beck 2011),
we will assume there is ample space in the general medical-surgical ward. This will allow us to focus on
the flow of critical and semi-critical patients. In AppendixEC-2, we consider the case where physical beds
are the bottleneck and find that many of our insights also carry over.

8
See Figure 1 as an example of an allocation of nurses amongst the ICU and SDU. The nurse-to-patient
ratio–i.e. the maximum number of patients a nurse can treat at once–in the ICU isrI = 1 and in the SDU it
is rS =3. There areN = 8 nurses who are allocated toBI = 6 ICU beds andBS = 6 SDU beds.
ICU 1:1 SDU 3:1
Figure 1 Nurses are depicted as circles, patients are depict ed at squares. Critical patients are served in the
ICU. A critical patient may become a semi-critical patient u pon finishing service in the ICU. semi-
critical patients are depicted in gray and are served in the S DU or ICU. One semi-critical patient is
currently being served in the ICU.
New critical patients arrive to the ICU according to a Poisson process with rateλ. If there is space in the
ICU, the patient will begin treatment immediately. If thereis no space in the ICU, he will wait in a virtual
queue. For instance, the patient could wait for ICU admission in the Emergency Department (ED). This
queue has length of up toK ∈ [0,∞], which is a design parameter the system administrator must select.
That is, if a new critical patient arrives and there are alreadyK critical patients waiting for ICU admission,
the new patient will balk and be sent to a different hospital for care. A cost ofwBC is incurred for each critical
patient who balks from the queue.
Each critical patient in the queue incurs a holding cost withratewHC to capture the undesirability of
making critical patients wait. This is undesirable in termsof patient care as well as operationally, as these
patients must be treated elsewhere–often in the ED, consuming many resources. If the critical patient waits
too long, he will abandon the queue after an exponential timewith rate θ and an abandonment cost of
wAC is incurred. Note that abandonment corresponds to a patientwaiting for ICU care and then eventually
rescinding the request after receiving care elsewhere, recovering or dying. This is in contrast to balking
which occurs when a patient’s request for ICU care is immediately cancelled upon arrival. For tractability,
we use costs for patient balking, abandonment, and holding to capture the undesirability of lack of access
to ICU care. Other adverse events of patient wait, such as an increase in LOS (Chan et al. 2016), could also
be considered.
If there is a semi-critical patient in the ICU and all ICU bedsare occupied, he can be bumped out by an
incoming critical patient. If there is space for him in the SDU, this bumping comes at no cost. However, if

9
there is no space in the SDU, a current semi-critical patientwill be bumped to the general ward resulting
in costwSC . Our queueing model is depicted in Figure 2. The ‘?’ in the figure represents the assignment
decision for the semi-critical patient.
? ICU SDU
l
q
mSC mSC
mC
1-p
p
K
Figure 2 ICU-SDU queueing model: The ‘?’ represents the assi gnment decision of a semi-critical patient.
Solid lines depict critical patient flows while dotted lines depict semi-critical patient flows.
Our objective is to minimize the long run average balking, holding, abandonment, and bumping costs.
These costs capture the impact of lack of access to care. LetZC(t) andZSC(t) denote the number of critical
and semi-critical patients in the ICU or SDU at timet.Q(t) denotes the number of critical patientswaiting
in a (virtual) queue. We define a balking functionξ(Q(t)) : Z+ → {0,1} as a function which specifies
whether a new arrival would enter the queue given queue length Q(t). In particular, ifQ(t) ≥ K, the
patient balks andξ = 1; if Q(t) < K, the patient enters the queue andξ = 0. ψ(Q(t),ZC(t),ZSC(t)) :
Z3+ →{0,1} is a function which specifies whether a semi-critical patient will be bumped given system state
(Q(t),ZC(t),ZSC(t)). Note that a patient cannot be bumped if he departs the systemwithout becoming a
semi-critical patient (either by balking, abandoning or leaving after completing ICU service). Additionally,
a patient cannot abandon if he balks upon arrival. Our objective is thus to determine the balking threshold,
K, as well as to specify the number of ICU and SDU beds in order tominimize the following cost function:
Optimization Problem 1
minK,BI ,BS
limsupT→∞
1
T
∫ T
0
[
wBCλξ(Q(t))+wQ
CQ(t)+wSC(pµc[BI ∧ZC(t)]+λ)ψ(Q(t),ZC(t),ZSC(t))]
dt,
(2)
wherewQC ,wH
C +wACθ, and∧ denotes the minimum function. The first component of(2) corresponds to the
balking costs; the second component represents the queue length costs, which is the sum of the holding plus
the abandonment costs; and the third captures the bumping costs. The bumping costs depend on the decision
epochs when a semi-critical can be bumped: 1) when a criticalpatient becomes semi-critical, which occurs
at ratepµC [BI ∧ZC(t)] and 2) when a new critical patient arrives.

10
In this work, we examine a stylized model of patient flows through the ICU and SDU. Byrick et al. (1986)
found that having an SDU can reduce ICU LOS–this reduction iscaptured by our service requirements
of critical and semi-critical patients. With an SDU, the mean LOS of a patient in the ICU will be1/µC
plus some additional time depending on if there is space in the ICU to treat him while in the semi-critical
state. However, without an SDU, more semi-critical patients will be treated in the ICU, thus increasing
overall ICU LOS. While there are some practical elements ourmodel does not capture, such as external
arrivals to the SDU, readmissions, or treatment of criticalpatients in the SDU, it does capture the essence of
the tradeoff between increasing capacity for all patient severities versus maximizing capacity for the most
vulnerable patients. We will see this is a main driver in effectively managing ICUs and SDUs. In analyzing
the patient flows described in this section, we can gain many insights into the role of the SDU and, in
Section 5, we find that they extend to a more general model of patient flows.
In considering the possible types of patient dynamics in oursystem, we found a general consensus
amongst physicians we consulted with that critical patients are typically given priority over semi-critical
patients in the ICU. In what follows, we will assume that strict priority is given to critical patients, so that
a semi-critical patient will be bumped out of the ICU if a new critical patient needs the bed. Formally, we
make the following assumption throughout the paper:
Assumption 1 Critical patients obtain strict preemptive priority over semi-critical patients in the ICU.
Note that Assumption 1 implies that a critical patient neverbalks or queues if there are semi-critical patients
in the ICU.
2.1. Cost parameters
It is reasonable to assume the optimal policy will depend on the different cost parameters:wBC ,w
QC , and
wSC . Our formulation allows foranyquality metric–it could capture clinical costs such as the net decrease
in quality-adjusted life years (QALYs) or financial costs, such as loss in revenue due to not treating a patient
in the ICU and/or the differences in reimbursement rates depending on where patients are treated. We now
discuss a number of clinically relevant costs, which hospitals are likely to consider when making decisions
surrounding ICUs and SDUs.
Mortality Risk: A natural cost metric is mortality. Specifically, there is some risk of death associated
with each patient, even if the patient follows the ‘desired’care pathway. However, if a Critical patient is
unable to get ICU care and must wait, possibly so long he eventually abandons the queue, or is sent to
another hospital, then it is reasonable to consider how thismay impact the patient’s nominal mortality risk.
Similarly, bumping a Semi-critical patient out of the SDU may increase the likelihood of death. In these
cases,wQC , wB
C andwSC could capture theincrease in mortality riskdue to waiting/abandonment, balking
or bumping, respectively. Then, solving the optimization problem in (2) would correspond to selecting the

11
ICU and SDU sizes which would minimize the mortality rate of Critical and Semi-critical patients. In some
practical settings, this cost metric may be too crude to be ofvalue as access to care is typically granted
for patients whose mortality risk would be significantly increased. Thus, we also consider other clinical
measures of interest.
Readmission Risk: Another measure the medical community has focused on is patient readmissions,
and more specifically, the probability of readmission. Thiscost metric has clear clinical implications as
readmitted patients tend to be worse off (Durbin and Kopel 1993). It also has operational implications as
readmitted patients will utilize ICU and SDU beds, which could have been used for new patients.
For each of these clinical measures, the cost parameterswQC , wB
C andwSC would correspond to the
increase in mortality risk or readmission risk due to waiting/abandonment, balking, or bumping. Then, solv-
ing the optimization problem in (2) would correspond to selecting the ICU and SDU sizes which would
minimize the number of corresponding adverse patient outcomes. While a hospital administrator may wish
to focus on one clinical outcome, one could also consider a weighted sum and/or other potential cost mea-
sures.
3. Balancing capacity needs with capacity gains
We begin our analysis via a fluid modeling approach to examinethe optimal allocation of nurses and balking
threshold given the balking, queue length, and bumping costparameters. We find that the optimal allocation
of nurses can be characterized by a well-defined threshold which captures the balance between capacity
needs and capacity gains. The fluid analysis is based on scaling the arrival rate and the number of beds
and nurses by1/N and ignoring quantities that are of order that is less thanN . This way, we can focus on
the main drivers of the balking threshold and nurse allocation. We begin by defining our fluid scaling. For
notational compactness, we omit the indexing ofλ byN . Let λ := λ/N, bi :=Bi/N,k :=K/N for i= I,S
and note that by (1),bIrI
+bSrS
≤ 1. (3)
We say a functionf(x) := o(x) if f(x)/x→ 0 asx→∞ andf(x) :=O(x) if f(x)/x≤ c > 0 asx→∞.
The following proposition provides conditions such that the fluid costs are non-zero.
Proposition 1 1. If λrSµSC
(
p+ rSµSC
rIµC
)
≤ N , then there exists a feasible bed allocation and balking
threshold such that the total cost rate in Eqn.(2) is o(N).
2. Otherwise, if λrSµSC
(
p+ rSµSC
rIµC
)
>N , then for any feasible bed allocation and balking thresholdthe
total cost rate in Eqn.(2) is at leastO(N).
It is easy to see that in scenario 1, settingK =∞, BI = λ/µC andBs = λp/µSC will result in zero fluid
costs. As such, in order to focus on the more interesting cases of non-zero costs, we consider the case where
the following assumption is satisfied:

12
Assumption 2 The system operates in overload. That is,
λ
rSµSC
(
p+rSµSC
rIµC
)
>N. (4)
The following proposition helps simplify the fluid analysissubstantially.
Proposition 2 Under Assumption 2 and under any optimal bed allocation, we have that neither unit is
underloaded. That is, we have that if(BI ,BS) is optimal, thenBI ≤ λ/µC+o(N) andBS ≤ pBIµC/µSC+
o(N).
The proof of the proposition follows simply by observing that if either of the units is underloaded, one could
strictly improve the cost by transferring nurses to the other unit.
Corollary 1 Under Assumption 2, the number of ICU beds occupied by semi-critical patients under the
optimal allocation iso(N).
The implications of this corollary is that the interaction between the two units is minimal at the fluid scale
in the sense that the patient types are effectively treated as separate units, and the system reduces to two
queues in tandem with zero buffer in front of the second queue.
3.1. Balking Threshold
In this section we consider an arbitrary nurse allocation and show that, in the fluid scaling, the optimal
balking threshold is either∞ or 0, independent of this allocation. In determining the optimal fluid-level
balking threshold,k∗, we must consider two cases depending on a relationship between the abandonment
rate, the balking cost and the queue length cost.
• Queue-Dominated Case (wQC/θ≤wB
C ): Because the queue length cost is less than that of balking, it
is easy to see that patients should never balk. By allowing each critical patient into the system, at worst,
he will wait and abandon, incurring expected costwQC/θ, rather than the largerwB
C if the patient is blocked
upon arrival. Indeed, following Proposition 1 of Kocaga et al. (2015) we have that, in this casek∗ =∞.
• Balking-Dominated Case (wQC/θ >w
BC ): We letqmax , (λ−µCbI)/θ≥ 0 denote the maximum queue
length on the fluid scale if balking were not allowed. The non-negativity ofqmax follows from Proposition 2.
Due to the overloaded assumption and the priority given to critical patients, for any fixedk≤ qmax, the queue
length will be equal tok. If k > qmax, then the queue length is equal toqmax. Then the corresponding queue
length cost incurred iswQC min{k, qmax} and the balking cost is(λ− bIµC −θmin{k, qmax})+wB
C . Because
we are in the overloaded regime, the ICU isalwaysfilled with critical patients. As such, the balking thresh-
old only impacts the queue length and balking costs, but not the bumping costs (recall Corollary 1). We
determine thresholdk∗, which minimizes the cost functionmin0≤k≤qmax
{
(wQC − θwB
C )k+wBC (λ− bIµC)
}
.
SincewQC/θ >w
BC , we have thatk∗ =0. That is, having no queue is optimal.
13
The following proposition summarizes the above discussion.
Proposition 3 In the fluid model, under the overloaded regime, the optimal balking threshold is given as:
k∗ =∞, if wC =wQC/θ≤wB
C ;k∗ =0, if wC =wB
C <wQC/θ.
The proof is embedded in the above discussion and is hence omitted.
3.2. Nurse Allocation
We now consider the optimal nurse allocation. We start by defining a critical cost as:
wC =min{wQC/θ,w
BC}
Note thatwC captures the costs of lack of ICU access for critical patients. IfwC =wQC/θ (Queue-Dominated
Case), there is no balking. Under our overloaded assumptions we have, by Corollary 1,b∗I ≤ λ/µC. Thus,
the fluid-scaled abandonment rate is equal to the scaled arrival rate minus the scaled service capacity, or(
λ− bIµC
)
. Under this allocation, the ICU is always full with criticalpatients as there is not enough (or just
enough) capacity to serve all critical patients. Hence, there is no room for semi-critical patients in the ICU.
Thus, the fluid-scaled queue length is equal to the scaled aggregate abandonment rate divided by the individ-
ual abandonment rate:(λ− bIµC)/θ. This results in an expected scaled queue length cost equal towQC
θ(λ−
bIµC) =wC(λ− bIµC). Using a similar argument, ifwC =wBC (Balking-Dominated Case), then there is no
queue and, under our overloaded assumptions, the fluid-scaled balking rate is equal to(
λ− bIµC
)
. Thus, in
both regimes, the total balking and queue length costs incurred will be:wC
(
λ− bIµC
)
.
The fluid-scaled bumping rate from the SDU is equal to the positive part of the scaled SDU arrival rate
minus its service rate:(bIµCp− bSµSC)+. Combining these two expressions together gives us the average
cost. Recognizing that constraint (3) is satisfied as an equality under the optimal allocation, we can specify
our fluid objective in terms ofbI .
Optimization Problem 2 (Fluid Cost) Our goal is thus to determine,0 ≤ bI ≤(
rI ∧ λµC
)
and0 ≤ bS ≤rS, the allocation of nurses to ICU and SDU beds, respectively,so as to minimize the cost function:
min0≤bI≤
(
rI∧ λµC
)
{
wC
(
λ− bIµC
)
+wSC
(
bIµCp− rS
(
1− bIrI
)
µSC
)+}
(5)
We can solve the preceding optimization problem to determine how to allocate nurses between the ICU and
SDU. Note that the objective in Equation (5) is piecewise linear inbI . As such, the minimization is obtained
at the boundary points, which essentially proves Proposition 4 (below), so the proof is omitted.
We find that the optimal policy is highly dependent on the relationship betweenwC andwSC . When the
cost for lack of ICU access (wC ) is very large, the optimal policy is to allocate as many nurses to the ICU

14
as needed in order to satisfy all critical patients demand (if possible). If there are not enough nurses to meet
all of this demand (i.e.rIµC < λ), then all nurses should be allocated to the ICU. We call thisregime the
ICU-Driven (ID) regime. On the other hand, when the cost of lack of access to care for semi-critical patients
(wSC ) is close to that for critical patients, then the optimal policy is to allocate some nurses to the SDU and
reduce access to care for critical patients. We call this regime the Capacity-Driven (CD) regime: the larger
the capacity gained by transferring a nurse from the ICU to the SDU (increasingν), the more likely the
CD regime is to be optimal. Additionally, if many critical patients become semi-critical (largep) the SDU
becomes more beneficial. More formally, we have:
Proposition 4 In the fluid model, under the overloaded regime, the optimal allocation of nurses can be split
into two cases. The cost minimizing allocation of nurses to ICU beds is given by:
b∗I =
rI ∧ λµC, if wC
wSC>κ, ID regime
rIνκ, if wC
wSC≤ κ, CD regime
and b∗S = rS
(
1− b∗IrI
)
where
ν =rSµSC
rIµC
andκ= p+ ν
Our proposed nurse allocation to ICU and SDU beds, respectively, based on fluid analysis is thus:
B∗I = b∗IN, B∗
S = b∗SN.
Note that for notational simplicity, from here on we ignore the integrality constraints. Naturally, our numer-
ical solutions in Section 5 will incorporate integrality constraints. Note that one must verify that the value
of b∗I under the second scenario does not exceedλ/µC, which is true due to the overloaded condition.
In interpreting the threshold,κ, which specifies the nurse allocation regime, we notice thatit is comprised
of p andν. We make particular note of this quantity as it continues to arise as a main driver of the nurse
allocation decision.p is a measure of the demand to the SDU as it indicates the proportion of patients who
become semi-critical and can be treated in the SDU. In contrast,ν captures the supply side of the SDU as
it indicates the effective capacity gains by moving a nurse from the ICU to the SDU. Hence, we see that
the optimal nurse allocation is a matter of carefully balancing the supply gains and the demand needs of the
semi-critical patients with the relative cost of lack of timely access to the ICU for critical patients. The fact
that these parameters are additive also suggests that they play an equally important role.
We observe that the fluid regime is ‘bang-bang’ so that, whenever possible, one would incur either critical
patients related costs or semi-critical patients related costs, but not both. Indeed, in the ID regime only
bumping costs are incurred, as long as there is enough capacity to accommodate all critical patients. In
contrast, in the CD regime, the system will only incur critical patients related costs. Moreover, in the latter
regime, the system incurs either balking costs or queue costs, but not both. We additionally observe that the

15
bed-allocation scheme proposed by our fluid analysis is veryrobustwith respect to the system parameters,
as long as the system operates away from the thresholdwC
wSC= κ.
In further interpreting the results of Proposition 4, we have that in the CD regime, the SDU size is selected
such that the SDU iscritically loaded,λSDU ≈ B∗IµCp ≈ B∗
SµSC , while the ICU is strictly overloaded
(by Proposition 1). This is surprising because it occurs even when lack of access to the ICU, via balking
or queue length costs, is more costly than bumping an SDU patient. Yet, this allocation results in having
balking rate (or queue length cost) which is of orderN and bumping rate which is of ordero(N). In the
CD regime, the capacity gains of allocating nurses to the SDUare more substantial than the gain of keeping
the nurses in the ICU to serve the high priority (critical) patients. In the ID regime, the needs of the critical
patients dominate. In fact, we see that in both the ID and CD regime, if it is possible, the optimal solution is
such that enough nurses should be allocated to one of the two units to make it critically loaded, necessarily
making the other unit overloaded. The dominating unit depends on the relationship between the system
parameters,wC =min{wQC/θ,w
BC}, wSC , andκ= p+ ν.
In practice, we see that some hospitals have SDUs while others do not. Our analysis suggests that, under
the optimal sizing decision of ICU and SDU, one should expectto see variation in the use of SDUs. While
we cannot assess whether each hospital is sizing their SDU(s) in a reasonable manner, our analysis suggests
that some of the variation seen in practice may be justified. Indeed, the thresholdκ defined in Proposition 4
is the main driver dictating whether having an SDU is optimalor not. This threshold depends on the capacity
needs of critical and semi-critical patients (as captured by rIµC and(rSµSC , p), respectively), which will
vary based on patient mix and regulation, thereby resultingin different thresholds for different hospitals. We
will see that these factors will again have a prominent role in the sizing decision as we refine our analysis.
4. Second order drivers of the nurse allocation and balking decision
In this section, we consider refining our analysis from Section 3 by examining the impact of reallocating a
small number of nurses to either the ICU or SDU. Our starting point is the analysis of the fluid approxima-
tion in Section 3, which identifiedκ as a key parameter influencing the management of the ICU and SDU.
Under the ID regime it is optimal to have as big of an ICU as necessary/possible, while in the CD regime,
it is optimal to have an SDU which is comparable in size to the ICU. In this section, we consider how the
reallocation of a small number of nurses may help. We find thatin some cases, this reallocation can be quite
impactful. Moreover, the parameterκ= p+ ν again proves to be a critical component in determining how
such reallocations should be determined.
The fluid analysis finds the optimal allocation of nurses to the ICU and SDU up to an order ofo(N).
In particular, the fluid analysis excludes these lower ordered terms and so it might still be beneficial to
reallocate a small number of nurses, say of orderO(√N) to the SDU or ICU. We will usediffusionanalysis
to examine these two regimes. This approach involves centering the system byN times its fluid limit and

16
then scaling by1/√N , so that only fluctuations which are on the order of
√N are considered. More details
about diffusion analysis can be found in Halfin and Whitt (1981), Ward (2012) and Chapter 10.4 of Whitt
(2002a).
4.1. Diffusion Analysis in the ID regime
In this section we assume that
wC
wSC
>κ= p+ ν andNrI ≥λ
µC
+ o(N). (6)
As such, by Proposition 4, the fluid solution determines thatit is optimal to operate in the ID regime and
allocate enough nurses to the ICU so that all critical demandis met. That is, the number of nurses allocated
to the ICU satisfiesB∗I = λ/µC + o(N), and the ICU is considered to be critically loaded with respect to
the critical patients (Mandelbaum and Zeltyn 2009). Note that if NrI < λµC
+o(N), then the ICU would be
overloaded and reallocating any nurses to the SDU would onlyincrease costs.
We now postulate the following refinement of the above nurse allocation scheme:
BI =λ
µC
+β
√
λ
µC
+ o(√N ), BS =
rSrI
(
NrI −λ
µC
−β
√
λ
µC
)
+ o(√N), (7)
whereβ is only restricted by the non-negativity constraints onBI andBS . In particular, the ICU is critically
loaded and operates in the QED (Quality and Efficiency Driven) regime with respect to the critical patients
(Halfin and Whitt 1981, Garnett et al. 2002). Because, under the QED regime, there will be times when
some ICU beds are not occupied by critical patients, the flow of the semi-critical patients is more intricate
in this setting than in the fluid scale.
Before we can determine the optimal allocation of nurses, wemust first understand more precisely when
and to what extent semi-critical patients will be treated inthe ICU. Theorem 1 in the Appendix precisely
characterizes the patient dynamics at the diffusion level.Specifically, the dynamics of our system–according
to Theorem 1–can be summarized as follows:
1. The ICU is operated in the QED-regime with respect to critical patients, so the number of critical
patients can be approximated by the diffusion analysis of anErlang-A (M/M/BI +M ) model with finite
or infinite buffer (Garnett et al. 2002, Kocaga and Ward 2010).
2. Both units are always full when considering fluctuations which are of order√N or larger. If there are
fewer thanBI critical patients in the system, then semi-critical patients fill the remaining ICU beds. We
refer to this result as a ‘State-space collapse’, because the two-dimensional queueing system collapses to
one dimension in this regime.
The second point implies that even if the ICU is not overly crowded with critical patients it will always be
full and thus appear as if it is operating in the overloaded regime. This raises an important practical insight:
an ICU that is always full may appear to be the system bottleneck when, in fact, the reason why it is full

17
could be due to spillover from the SDU. While a natural reaction to observing ICUs which are constantly
full is to add more ICU capacity, the real culprit of such congestion may be inadequate SDU capacity.
The intuition behind Theorem 1 is as follows: The SDU is overloaded. In particular, the rate at which it
is losing patients due to lack of space is of orderN . At the same time the ICU is in the QED regime with
respect to critical patients. In particular, the number of ICU beds that are not occupied by critical patients
is at most of orderO(√N). As soon as some of these beds are empty, they almost instantaneously become
occupied by semi-critical patients. Hence, all beds are always full.
We now leverage our results from above to examine the nurse allocation and balking threshold problem.
Our aim is to derive expressions for the cost function using adiffusion approximation. LetQN := QN√λ
and
IN = IN√λ
be the scaled queue length and “idleness” processes, whereIN is the number of ICU beds not
occupied by critical patients. Note that due to Theorem 1,IN is also approximately equal to the number of
semi-critical patients who are being treated in the ICU. With a slight abuse of notation we also letQN and
IN represent these quantities in steady-state. Also, letLN be the steady-state balking rate.
To evaluate the steady-state cost, over which we will optimize, we leverage results from Kocaga and Ward
(2010) (Theorem 2 in the appendix) who generalize results from Garnett et al. (2002) and Browne and Whitt
(1995) to include a balking threshold. Consistent with thatpaper, we consider a balking thresholdKN which
is of orderO(√N). Specifically, we assume thatKN = k
√N . For a fixed balking threshold and nursing
allocation, Theorem 2 provides diffusion approximations for the balking rate,L, and queue length,E[Q],
which can be used to determine the balking and queue costs, respectively.
We now derive diffusion approximations for the bumping rates in order to evaluate the bumping costs–the
last component of our cost function. To do this, we leverage the state-space collapse results of Theorem
1. The starting point is that the bumping rate is approximately equal to the semi-critical arrival rate minus
its total service rate. The arrival rate may be expressed as:E[ZC ]µCp, whereZC is the number of critical
patients in ICU beds. By Theorem 1, the number of semi-critical patients in an SDU or ICU bed is equal
to the total number of SDU beds plus the ‘idle’ ICU beds, whichare not currently occupied by critical
patients. Thus, the departure rate may be expressed as:BSµSC + E[I]µSC + o(√N). Putting all of the
above together we can determine, under the ID regime and the nurse allocation (7), the corresponding cost
function (centered bywSC
(
λp+ rSrI
(
NrI − λµC
)
µSC
)
and scaled by1/√λ) which we wish to optimize
over.
Optimization Problem 3 (Diffusion Cost in ID regime) We optimize overβ and k, which determine the
nursing allocation and balking threshold, respectively.
minβ,k
C(β, k) := minβ,k
wBC L+wQ
CE[Q] +wSC
[
β√µC (p+ ν)− (µSC +µCp)E[I]
]
, (8)
where the expressions forL, E[Q] andE[I ] are explicitly given in Theorem 2.

18
As in our fluid analysis of Section 3, we see in the expression above that the ratio of capacity gains,ν,
and the semi-critical demand, measured byp, play a prominent role in the optimal balking threshold and
nurse allocation decision. Again, they are additive, suggesting their comparable importance. As semi-critical
demand,p, or SDU capacity gains,ν increase,β will decrease, meaning more nurses will be allocated to
the SDU.
Let (β∗, k∗) := argminβ,kC(β, k), where we choose the supremum onβ (and k) if there are multiple
values ofβ (k) that minimize the costC(β, k). Then our proposed solution in the ID regime is:
B∗I :=
λ
µC
+β∗
√
λ
µC
, B∗S =
rSrI
(
NrI −λ
µC
−β∗
√
λ
µC
)
, K∗ = k∗√N.
Note that in the queue-dominated case (wQC/θ≤wB
C ), one can verify that it is never optimal to let a patient
balk and thatK∗ =∞ as is stated by Proposition 1 of Kocaga et al. (2015).
Recall that by assumption, the system operates in the ID regime. However, when computingβ∗, it is
possible that its value will be so small that, in fact, the solution proposed is effectively in the CD regime.
By the fluid analysis we know that this is first-order suboptimal. Thus, we set a lower bound onB∗I and an
upper bound onB∗S in order to guarantee that the solution is still in the ID regime as dictated by the fluid
solution. In doing so, the allocation of nurses is given by:
B∗I :=max
{
λ
µC
+β∗
√
λ
µC
, rIν
κN
}
,
and
B∗S =min
{
rSrI
(
NrI −λ
µC
−β∗
√
λ
µC
)
, rS
(
1− ν
κ
)
N
}
.
In Section 5, we see cases where the values of both the optimalk andβ are non-trivial.
In the ID regime, the ICU is operated in QED with respect to thecritical patients. Hence, some semi-
critical patients will be treated in the ICU, so we can see that the reallocation of beds in this regime translates
to balancing the tradeoff between capacity for the most critical patients (ICU beds) versus overall capacity
(SDU beds). Note that in the ID regime, this tradeoff only arises in this second order analysis. In the fluid
analysis, ensuring enough capacity for the critical patients was all that mattered.
4.2. Diffusion Analysis in the CD regime
Recall that the fluid analysis identified two operating regimes for the system: the ID and CD regimes. Now
we take a closer look at the CD regime. In particular, we focuson the case where
wC
wSC
≤ κ= p+ ν.
In this case, according to Proposition 4, we have that
B∗I = b∗IN + o(N), b∗I = rI
ν
κ, andB∗
S = b∗SN + o(N), b∗S = rS
(
1− ν
κ
)
.

19
In particular, we have that the ICU is overloaded and the SDU is critically loaded. Our aim here is to see
whether an order of√N refinement for theo(N) terms above can lead to a lower cost. We further assume
thatλ=O(N) so that the ICU operates in the efficiency-driven (ED) regime(Gans et al. 2003). Otherwise,
the ICU will be ‘super’ overloaded, and refinements of this order will not make a noticeable difference. Set
BI = b∗IN + o(N) = γRI + δ√
RI + o(√
RI), RI :=λ
µC
, (9)
whereγ = NrSµSC
λ(p+ν)is less than 1 due to Assumption 2. Also, let
BS = b∗SN + o(N) =RS +β√
RS + o(√
RS), RS :=BIµCp
µSC
, (10)
The relationBI
rI+ BS
rS=N + o(
√N) gives us
δ := δ(β) =−β√
NrSp
λµC
µSC
(p+ ν)3/2,
whereβ is only restricted by the non-negativity constraints onBI andBS. We aim to find a value forβ that
minimizes the expected balking plus queue plus bumping cost.
By definition,RI is the offered load of the ICU. We argue thatRS is the offered load of the SDU. To
see this, note that, sinceγ < 1, the ICU is operated in the overloaded regime. In particular, all ICU beds are
full with critical patients all the time, almost surely. Hence, the arrival rate into the SDU is equal toBIµCp,
and the offered load is indeed equal toBIµCp
µSC. As expected, the SDU is critically loaded, and operates in the
QED regime.
We first argue that in the CD regime, the optimal balking threshold isK∗ =∞ orK∗ = o(√N ) depending
on whether the queue or the balking dominated case holds, respectively. This implies that the system incurs
either queue or balking cost, but not both (up to an order ofo(√N)). We have already established that in
the queue-dominated case the optimal threshold is equal to∞. It turns out that in the balking-dominated
caseK∗ = o(√N) (see Corollary 3 in the appendix). Unlike in the ID regime, wedo not see a second order
impact of optimizing the balking threshold in the CD regime.
An interesting conclusion from these results is that, in theCD regime, the system will either incur queue
costs or balking costs but not both. In the balking-dominated case the balking rate is equal toλ−µCBI +
o(√N), and the corresponding balking cost iswB
C · (λ− µCBI) + o(√N). In the queue-dominated case
we have that the average queue length satisfiesEQ= λ−µCBI
θ+ o(
√N ), and the corresponding queue cost
is wQC · λ−µCBI
θ+ o(
√N ). Thus, recalling thatwC =min{wQ
C/θ,wBC}, we have that the total queue plus
balking cost in the CD regime is
wC · (λ−µCBI)+ o(√N) =wC ·λ
(
1− γ− δ/
√
λ
µC
)
+ o(√N).

20
We leverage results from Jagerman (1974) to determine the probability of bumping:
Pr{Bump} := limsupT→∞
1
T
∫ T
0
ψ(Q(t),ZC(t),ZSC(t)) =1√BS
h(−β)+ o(1/√λ).
Adding the two cost components together, centering bywCλ(1−γ), scaling by1/√N , and lettingN →∞,
we obtain the relevant diffusion cost function.
Optimization Problem 4 (Diffusion Cost in CD regime) In this regime, the optimal balking threshold
(up to order√N ) is either 0 or∞. Thus, we are left to optimize overβ, which determines the nursing
allocation.
minβC(β) =min
βµSC
√
rSp
p+ ν
(
wC
β
p+ ν+wSCh(−β)
)
. (11)
Again, we see the parameterp+ ν plays a vital part in determining the optimal nursing allocation.
Let β∗ := argminβC(β), and letδ∗ := δ(β∗). Similar to the ID regime, we set an upper bound onB∗I
and a lower bound onB∗S to ensure the allocation is still in the CD regime as given by the fluid solution.
Then our proposed solution in the CD regime is:
B∗I =min
{
γRI + δ∗√
RI , rIN,λ
µC
}
, RI :=λ
µC
, (12)
and
B∗S =max
{
R∗S +β∗√R∗
S ,rSrI
(
NrI −λ
µC
)}
, R∗S :=
B∗IµCp
µSC
. (13)
5. Simulation: Robustness of Main Drivers
We have utilized fluid and diffusion analysis to identify themain drivers which dictate how nurses should
be allocated to ICU and SDU beds and when patients should be blocked from entering the system. We find
that two operational regimes exist: the ID regime in which the SDU has very few beds, if any, and the CD
regime in which the SDU is comparable in size to the ICU. Moreover, we find that the balance between
semi-critical demand,p, SDU capacity gains,ν, and the relative cost of lack of access to care for critical
patients drive the nurse allocation decision. Our analysiswas based upon a parsimonious model of patient
flows through the ICU and SDU. While this model captures many salient features of the patient dynamics,
we wish to examine whether our insights translate to a more complex system which includes additional
features which arise in practice, such as SDU arrivals from units other than the ICU, patient returns to the
ICU or SDU after transferring elsewhere, and off-placementof critical patients in the SDU. To do so, we
use simulation to examine the quality of our approximationsas deriving closed form expressions for this
more general model seems unlikely.

21
5.1. Simulation Model
We begin by describing our simulation model. We consider a system withNI andNS nurses in the ICU
and SDU, respectively. This dictates that the number of bedsin each unit isBI = rINI andBS = rSNS. In
order to focus on the ICU and SDU nurse / bed allocation decision, we assume there is ample capacity in
the general ward. As in our original model, we consider two types of patients:Critical andSemi-Critical.
Critical patients arrive to the system according to a Poisson processwith (possibly time-varying) rate
λC . If a critical patient arrives and there is an available bed in the ICU, he is immediately admitted to the
ICU and his ‘service time’, i.e. the time spent in the critical state, is log-normally distributed with mean
1/µC and standard deviationσC . We use a log-normal distribution as it has been found to accurately capture
LOS in the hospital (Armony et al. 2015) and ICU (Litvak et al.2008). If there are no available beds in the
ICU a number of things can happen: 1) if there is a semi-critical patient in the ICU, she will be bumped
and the critical patient will take her ICU bed. 2) If all ICU beds are occupied by critical patients, but there
are available SDU beds, the critical patient is admitted to the SDU but is ‘served’ at a rateµ= µ/x, where
x > 1. Thus, if the patient would have been critical forT time in the ICU, the same patient would require
x× T time if treated in the SDU. We refer to such a critical patientas an ‘off-placed’ critical patient. The
dis-utility to a critical patient who is off-placed in the SDU is not equivalent to waiting in the queue (outside
of the ICU and SDU). Thus, instead of incurring costwQC , we assume these patients incur a cost at rate
y ×wQC wherey ∈ [0,1]. 3) If there are no available ICU and SDU beds, the patient will enter the queue
(and potentially abandon later) as long as the total number of critical patients in the system is less than the
balking thresholdK. If there are more thanK critical patients in the system, the patient will balk.
Once a patient is no longer in the critical state, one of four events can occur 1) he will immediately
become semi-critical with probabilityp, 2) he will return to the system as critical after an exponentially
distributed delay with meanδ with probability pRC,C, 3) he will return to the system as semi-critical after
an exponentially distributed delay with meanδ with probability pRC,SC , or 4) he will leave the ICU/SDU
system.
If an ICU bed becomes available, priority for that bed is given as follows: 1) if the critical patient occu-
pying that bed becomes semi-critical, she keeps the bed. 2) Otherwise, if there are any off-placed critical
patients in the SDU, the patient with the longer remaining time in the critical state is transferred into the
ICU. 3) A critical patient who is in the queue will be admittedto the ICU bed (potentially bumping a
semi-critical patient) with priority given to patients whoare in the return queue. 4) Finally, if there are any
semi-criticalpatients who are off-placed outside of the ICU and SDU, the one with the longest remaining
time in the semi-critical state is transferred into the ICU.
Semi-critical patients can arrive to the system via three pathways: 1) as anexternal arrival which is
given by a Poisson process with (possibly time-varying) arrival rateλEXTSC , 2) transitioning to semi-critical
immediately after being critical, or 3) returning to the system after some time. If an SDU or ICU bed is

22
available, the semi-critical patient will be immediately admitted to the bed. The time spent in the semi-
critical state is log-normally distributed with mean1/µSC and standard deviationσSC , irrespective of the
unit in which the patient resides. If there are no SDU or ICU beds available, the semi-critical patient will be
off-placed in the general medical-surgical ward. If a bed becomes available, priority is given to the patient
with the longest remaining time in the semi-critical state.If a semi-critical patient completes service in the
ward (while off-placed), this is counted as part of the bumping rate.
Once a patient is no longer in the semi-critical state, one ofthree events can occur 1) she will return to
the system as critical after an exponentially distributed delay with meanδ with probability pRSC,C , 2) she
will return to the system as semi-critical after an exponential delay with meanδ with probabilitypRSC,SC, or
3) she will leave the ICU/SDU system.
If a patient returns to the system as critical (semi-critical) and there are no ICU (ICU/SDU) beds available,
the patient will wait in a virtual queue. Practically, this could correspond to the patient being treated in the
Emergency Department or general ward.
Figure 3
Figure 3 depicts our simulation model. We consider the allocation ofN nurses between the ICU and SDU
to care for patients who enter the system as critical. In our simulations, we consider five different policies:
1. No SDU: All N nurses are allocated to the ICU.
2. Half-half: Half of theN nurses are allocated to the ICU and the remainingN/2 are allocated to the
SDU.
3. Fluid: We use our fluid solution from Section 3, which ignores readmissions, off-placements, and
external arrivals.
4. Diffusion: We use our diffusion solution from Section 4, which ignores readmissions, off-placements,
and external arrivals.

23
5. Simulation: We use simulation to run an exhaustive search over all possible allocations and present
the best performing option.
In our original model of Section 2, we did not incorporate external arrivals of semi-critical patients. To
account for these additional patients, we include an additionalBEXTSDU = λEXT
SC /µSC beds and, correspond-
ingly,NEXTSDU =BEXT
SDU /rS nurses (in addition to theN nurses) to treat the external semi-critical arrivals.
We also optimize over the balking threshold. For the No SDU, Half-Half and fluid policies, we use the
balking threshold dictated by the fluid solution in Proposition 3. For the Diffusion solution, we use the
balking threshold specified by the solution of equation (8) or (11), depending on whether the system is in
the ID or CD regime, respectively. For the Simulation policy, we search over all possible balking thresholds
K ∈ [0,50] in the balking dominated regime, and setK =∞ in the queue dominated regime.
5.2. Calibrating our Simulation
To start, we must first calibrate the parameters of our model.To do this, we utilize the existing medical
literature. We leverage the results of Cady et al. (1995) wholook at the impact of adding an SDU to the
cardiothoracic ICU at the University of Missouri Hospitalsto calibrate many of our parameters. We have
that1/µC = 2.5 days ,1/µSC = 1.2 days,p= .65 of the patients become semi-critical after being critical,
and the nurse to patient ratio in the SDU is1 : rS = 1 : 3. The ICU nurse-to-patient ratio is not given in
this article, so we assume it to be one-to-one,rI = 1. We set the probability of return to critical and semi-
critical pRC,C = pRC,SC = pRSC,C = pRSC,SC = .07, which is similar to the rates given in Chan et al. (2016).
Based on estimates from personal communication with medical professionals, we setθ= 1 so that patients
can tolerate waits of 1 day on average andx= 1.5 so that treating critical patients in the SDU takes 50%
as long as in the ICU. Because the queue cost,wQC , incorporates holding and abandonment costs, which are
likely more detrimental than being off-placed, we assume that y < 1. Specifically, we assume that the cost
of off-placement of critical patients is 30% less than the queue cost, i.e.y = .3. We consider the average
time to return to service as 1 day, so thatδ = 1, based on estimates from conversations with clinicians. In
Section 5.5, we consider other values ofδ as robustness checks. We set the arrival rate of new criticaland
external semi-critical patients to beλC = λEXTSC = 8 patients per day, withBEXT
SDU = 10, and we consider
how to allocateN = 20 nurses amongst the ICU and SDU. This corresponds to an ICU which is critically
loaded if all nurses are allocated to the ICU, i.e.λC = µCrIN. We use a warmup of 1,000 days and average
our results over 1,000,000 days.
Because the use of SDUs varies, we also use data from the surgical ICU/SDU at New York-Presbyterian
Hospital (Eachempati et al. 2004). For this set of parameters, we have that1/µC = 4.8 days ,1/µSC = 2.3
days,p= .8, rI = 2, andrS = 4. As before,we set the arrival rates toλC = µCrIN = 8.33 andλEXTSC = 8.
Table 1 summarizes our simulation parameters.
Lastly, we note that we also ran simulations with a time-varying arrival rate with a daily period to mimic
the daily-cycles documented in the literature (e.g. Armonyet al. (2015)). Similar to Chan et al. (2014b), we

24
Model Primitives Additional ParametersSource 1/µC 1/µSC p rI rS θ λ pR x y δ
Cady et al. (1995) 2.5 days 1.2 days 0.65 1† 2-31
8.07 1.5 .3 1
Eachempati et al. (2004)4.8 days 2.3 days 0.8 2 4 8.33Table 1 Summary of patient flow parameters for simulation mod el. The parameters 1/µC ,1/µSC , p, rI and rS
are from the corresponding article on SDUs. †The ICU nurse-to-patient ratio is not given in this article, so we
assume it to be one-to-one. The model primitives are the para meters which overlap between the analytic
model in Section 2 and the simulation model of Section 5. The a dditional parameters are those which have
been added to be included in the simulation model. Note that λ= λC = λEXTSC and pR = pRi,j for i, j ∈ {C,SC}.
find that ignoring the time-variability, by simply using a fixed arrival rate equal to the daily average, results
in practically the same performance and policy. This is not surprising due to the fact that the time-scale of
variability is on the order of hours whereas the average ‘service times’ are in days.
5.3. Simulation Results
We start by examining the average costs incurred under various cost settings. In considering the staffing level
in the ICU, we expect the number of ICU beds to be non-decreasing in the ratio between the critical cost and
bumping cost:wC/wSC . It turns out that because we have two different solution regimes (ID and CD) at
the diffusion level, it is possible the monotonicity is violated near the transition between these two regimes,
i.e. whenwC/wSC = κ := p+ν. Indeed, we encounter this issue in our numeric analysis in some scenarios.
For such scenarios, in order to translate our diffusion solution to maintain the desired monotonicity, atκ,
we assigned the number of ICU beds to be the average between the ID and CD diffusion solutions. That
is, letB∗I (ID, κ) be the ID solution (minimizes Eqn. (8)) and letB∗
I (CD, κ) be the CD solution (minimizes
Eqn. (11)) whenwC/wSC = κ. Then, our diffusion solution isB∗I =
12[B∗
I (ID, κ)+B∗I (CD, κ)], which also
serves as a lower (upper) bound for the number of ICU beds in the ID (CD) regime.
Figure 4 compares the number of SDU beds from our analysis to the exhaustive search when there are 20
nurses to split amongst the ICU and SDU in the balking and queue dominated cases. The number of ICU
beds can be easily determined via the following relationship:BI = rI × (20−BS/rS). Note that because 1
nurse can treat up to 3 patients in the SDU, we see discrete jumps in multiples of 3 in the number of beds.
As we can see in these figures, the solution determined by minimizing the cost in (8) and (11) is very close
to the solution determined by using exhaustive search over simulations. The fluid model is fairly accurate
for many different weights, but can be quite coarse at times.
Though we see discrepancies in the number of beds in the ICU and SDU under the diffusion approxima-
tions, we find that the actual average cost incurred performsquite well. Figure 5 compares the simulated
costs under the diffusion and fluid solutions to the minimum cost achieved via exhaustive search. We do
not plot the cost incurred by the half-half allocation as itsperformance is much worse than all policies. In
some cases, the performance of the diffusion and fluid policies is practically indistinguishable from that

25
wCB/W
SC
0 2 4 6 κ 8 10
# S
DU
Bed
s
0
2
4
6
8
10
12
14
SimulationDiffusionFluid
IDCD
(a) Balking-Dominated Case:wQC/θ =15
wCQ/W
SC
0 2 4 6 κ 8 10
# S
DU
Bed
s
0
10
20
30
40
50
SimulationDiffusionFluid
IDCD
(b) Queue-Dominated Case:wBC/θ =15
Figure 4 Optimal allocation of nurses to SDU beds via fluid and diffusion analysis compared to an exhaus-
tive search. N = 20 nurses. wSC = 1. Hospital parameters given by Cady et al. (1995).
of the exhaustive search. We do see that the quality of the proposed solutions appear to degrade in the
Queue-dominated case (whenwQC/wSC is very small). We explore why this might be the case in Section
5.4.
wCB/W
SC
0 2 4 6 κ 8 10
Tot
al C
ost
0
5
10
15
20
25
30
35
DiffusionFluidSimulationNo SDU
IDCD
(a) Balking-Dominated Case:wQC/θ =15
wCQ/W
SC
0 2 4 6 κ 8 10
Tot
al C
ost
0
5
10
15
20
25
30
35
DiffusionFluidSimulationNo SDU
IDCD
(b) Queue-Dominated Case:wBC/θ =15
Figure 5 Cost incurred by various strategies to determine th e balking threshold and nurse allocation. N =20
nurses. wSC =1. Hospital parameters given by Cady et al. (1995).
We can also see that in the ID regime, it is certainly reasonable to put all nurses in the ICU. When the
system is in the CD regime, it is very important to consider introducing an SDU; not having an SDU can
result in costs which are an order of magnitude higher than that achieved via the optimal allocation.
In the balking-dominated case, the balking threshold from the diffusion analysis is quite close to that
from the simulation. In fact the discrepancies between the solutions is at most 1. For the sake of space, the
corresponding figure is not included, but is available upon request. In the queue-dominated case, all of the
balking thresholds coincide withK =∞.

26
Figures 6 and 7 are the analogs of Figures 4 and 5 with the hospital parameters given by Eachempati et al.
(2004). Because the nurse-to-patient ratios in Eachempatiet al. (2004) require fewer nurses per patient than
in Cady et al. (1995), the sizes of the units are twice as largefor the Eachempati et al. (2004) parameters.
In this case, the balking threshold is equal to 0 for all solutions in the balking-dominated case. We find that
the qualitative results are similar, though the differences in performance of the fluid and diffusion solutions
compared to the exhaustive search are more pronounced. Going forward, we will only provide results for
the hospital parameters given by Cady et al. (1995).
wCB/W
SC
0 2 4 κ 6 8 10
# S
DU
Bed
s
0
5
10
15
20
SimulationDiffusionFluid
CD ID
(a) Balking-Dominated Case:wQC/θ =15
wCQ/W
SC
0 2 4 κ 6 8 10
# S
DU
Bed
s
0
5
10
15
20
25
30
SimulationDiffusionFluid
IDCD
(b) Queue-Dominated Case:wBC/θ =15
Figure 6 Optimal allocation of nurses to SDU beds via fluid and diffusion analysis compared to an exhaus-
tive search. N = 20 nurses. wSC = 1. Hospital parameters given by Eachempati et al. (2004).
wCB/W
SC
0 2 4 κ 6 8 10
Tot
al C
ost
0
5
10
15
20
25
30
35
40
DiffusionFluidSimulationNo SDU
IDCD
(a) Balking-Dominated Case:wQC/θ =15
wCQ/W
SC
0 2 4 κ 6 8 10
Tot
al C
ost
0
5
10
15
20
25
30
35
40
DiffusionFluidSimulationNo SDU
IDCD
(b) Queue-Dominated Case:wBC/θ =15
Figure 7 Cost incurred by various strategies to determine th e balking threshold and nurse allocation. N =20
nurses. wSC =1. Hospital parameters given by Eachempati et al. (2004).

27
5.4. Transition from Markovian Model to High Fidelity Model
In Figures 5 and 7, we saw that – especially in the queue dominated case – the quality of the fluid and
diffusion solutions derived from our analytic model can deviate from the optimal solution, as determined by
exhaustive simulation, in the high fidelity model. We now aimto understand better what factors contribute
to this degradation in performance. In particular, it is possible there are two sources of errors. First, the
fluid and diffusion solutions themselves are approximations for finite systems. Second, our high fidelity
simulation model incorporates a number of features which are not present in our analytic model and they
may be causing the errors.
wCB/W
SC
0 2 4 6 κ 8 10
Tot
al C
ost
0
2
4
6
8
10
12
14
16
(a) Markovian
wCB/W
SC
0 2 4 6 κ 8 10
Tot
al C
ost
0
2
4
6
8
10
12
14
16
(b) log-normal service times
wCB/W
SC
0 2 4 6 κ 8 10
Tot
al C
ost
0
5
10
15
20
(c) Off-placement
wCB/W
SC
0 2 4 6 κ 8 10
Tot
al C
ost
0
5
10
15
20
25
(d) External Arrivals
wCB/W
SC
0 2 4 6 κ 8 10
Tot
al C
ost
0
5
10
15
20
25
(e) Returns
wCB/W
SC
0 2 4 6 κ 8 10
Tot
al C
ost
0
5
10
15
20
25
(f) Ext. Arr. + Off-place.
wCB/W
SC
0 2 4 6 κ 8 10
Tot
al C
ost
0
5
10
15
20
25
(g) Returns + Off-place.
wCB/W
SC
0 2 4 6 κ 8 10
Tot
al C
ost
0
5
10
15
20
25
30
35
(h) Returns + Ext. Arr.
wCB/W
SC
0 2 4 6 κ 8 10
Tot
al C
ost
0
5
10
15
20
25
30
35
DiffusionFluidSimulationNo SDU
IDCD
(i) High Fidelity
Figure 8 Balking-Dominated Case: Cost incurred by various s trategies to determine the balking threshold
and nurse allocation. N = 20 nurses. wSC =1. Hospital parameters given by Cady et al. (1995).
Figure 8 and 9 present the cost incurred by the various strategies to determine the balking threshold and
nurse allocation where the hospital parameters given by Cady et al. (1995). Each subfigure corresponds to
a different simulation model. Specifically, we begin with the Markovian model which corresponds to our
analytic model presented in Section 2. We incrementally addfeatures to the model – log-normal service

28
times, off-placement of patients, external arrivals of semi-critical patients, and returns to service – until all
features are incorporated into our high fidelity simulationmodel described in Section 5.1.
wCQ/W
SC
0 2 4 6 κ 8 10
Tot
al C
ost
0
2
4
6
8
10
12
14
16
(a) Markovian
wCQ/W
SC
0 2 4 6 κ 8 10
Tot
al C
ost
0
2
4
6
8
10
12
14
16
(b) log-normal service
wCQ/W
SC
0 2 4 6 κ 8 10
Tot
al C
ost
0
5
10
15
20
(c) Off-placement
wCQ/W
SC
0 2 4 6 κ 8 10
Tot
al C
ost
0
5
10
15
20
25
(d) External Arrivals
wCQ/W
SC
0 2 4 6 κ 8 10
Tot
al C
ost
0
5
10
15
20
25
(e) Returns
wCQ/W
SC
0 2 4 6 κ 8 10
Tot
al C
ost
0
5
10
15
20
25
(f) Ext. Arr. + Off-place.
wCQ/W
SC
0 2 4 6 κ 8 10
Tot
al C
ost
0
5
10
15
20
25
(g) Returns + Off-place.
wCQ/W
SC
0 2 4 6 κ 8 10
Tot
al C
ost
0
5
10
15
20
25
30
35
(h) Returns + Ext. Arr.
wCQ/W
SC
0 2 4 6 κ 8 10
Tot
al C
ost
0
5
10
15
20
25
30
35
DiffusionFluidSimulationNo SDU
IDCD
(i) High Fidelity
Figure 9 Queue-Dominated Case: Cost incurred by various str ategies to determine the balking threshold
and nurse allocation. N = 20 nurses. wSC =1. Hospital parameters given by Cady et al. (1995).
We can see that in both the Balking and Queue Dominated cases,the solutions from our analysis of
the Markovian model perform very well when comparing the performance under the simulated Markovian
model. This suggests the deviations in performance are not due to the fact that our model has a finite number
of nurses while the fluid and diffusion solutions are solutions in asymptotic regimes withN →∞.
We notice that the presence of off-placement and external arrivals of semi-critical patients appears to have
a substantial impact on the quality of our proposed solutions. This is most evidence in the queue-dominated
case, as seen in Figure 9. We believe this is likely because our model considers off-placed patients as part
of the queue, even though they are receiving some ‘treatment’ in the off-placed unit, altering the queueing
dynamics. In the balking-dominated case, there will be veryfew off-placed patients, so the impact on the
quality of the solutions is diminished. The external arrivals seem to slightly deteriorate the performance of

29
our solutions in both the queue and balking dominated cases –particularly near the thresholdκ between the
ID and CD regimes. It is in this regime that second order effects really drive the SDU sizing decision. As
such, the external arrivals of semi-critical patients, which are of the first order, can have a marked impact
on our proposed solutions.
5.5. Robustness Checks
We also conducted a number of robustness checks of our high fidelity simulation to examine how sensitive
our results are to changes in the parameters. First, we considered the case where off-placement of patients
increased the probability of return to service by 10% and then 20%. Next, we varied the average time to
return to service fromδ = 1 to δ = 2 andδ = 3. Finally, we considered arrival rates so that the system was
not critically loaded. Recall that we setλ = µCrIN , so that the system would be critically loaded if all
nurses were allocated to the ICU. We then considered three scenarios whereλ= .8×µCrIN, .85×µCrIN,
and.9×µCrIN . In all of these experiments, the qualitative performance of our proposed policies remains
consistent (although there are very slight quantitative variations). Specifically, both the fluid and diffusion
solutions perform quite well in the Balking-dominated case, while their performance degrades in the Queue-
dominated case, especially by the threshold between the ID and CD regimes,κ.
We also examined the impact of the off-placement cost,ywQC , by varyingy ∈ [0,1]. The results in the
Queue dominated case can be found in Figure EC.1 of EC-3. The performance of the diffusion/fluid solu-
tions are reasonably accurate for moderate values ofy (e.g. 10%-60%). We find that wheny ∼ 1, there are
substantial deviations between the fluid and diffusion solutions with the optimal solution. As seen in Figure
EC.1, the off-placement results in these deviations and increasing the costs associated with off-placement
seems to magnify this effect. Interestingly, wheny = 0, the optimal solution puts all nurses in the SDU
(having no ICU). All patients are off-placed at no cost, resulting in very poor performance of the fluid and
diffusion solutions. That said, it seems unreasonable to believe that off-placement would come at zero cost.
Next we examine the robustness of our insights to systems of different sizes. In particular, we simu-
late systems withn = 5,10,20, and40 nurses to allocate between the ICU and SDU. Note that for these
simulations we scale the arrival rate so thatλ= rIµCN . Figures 10 and 11 show the performance of our
proposed policies under Markovian dynamics (i.e. our analytic model presented in Section 2) in the Balking
and Queue dominated cases, respectively. We can see that, asexpected, the performance of the fluid and
diffusion policies improve as the system size increases.
Figures 12 and 13 depict the high fidelity simulation model for different number of nurses. Here, we
see that the quality of the solutions does not seem to improvewith system size. In particular, it seems that
the impact of the external arrivals and off-placement, which degrades the performance of our policies (see
Section 5.4), outweighs the impact of system size. Thus, we find that while the performance of the fluid and
diffusion policies improve under the Eachempati et al. (2004) parameters than under the Cady et al. (1995)

30
wCB/W
SC
0 2 4 6 κ 8 10
Tot
al C
ost
0
2
4
6
8
10
(a) N = 5
wCB/W
SC
0 2 4 6 κ 8 10
Tot
al C
ost
0
2
4
6
8
10
12
14
(b) N = 10
wCB/W
SC
0 2 4 6 κ 8 10
Tot
al C
ost
0
2
4
6
8
10
12
14
16
DiffusionFluidSimulationNo SDU
IDCD
(c) N = 20
wCB/W
SC
0 2 4 6 κ 8 10
Tot
al C
ost
0
5
10
15
20
25
(d) N = 40
Figure 10 Markovian model: Cady Costs - Balk Dominated
wCQ/W
SC
0 2 4 6 κ 8 10
Tot
al C
ost
0
1
2
3
4
5
6
7
8
9
(a) N = 5
wCQ/W
SC
0 2 4 6 κ 8 10
Tot
al C
ost
0
2
4
6
8
10
12
(b) N = 10
wCQ/W
SC
0 2 4 6 κ 8 10
Tot
al C
ost
0
2
4
6
8
10
12
14
16
DiffusionFluidSimulationNo SDU
IDCD
(c) N = 20
wCQ/W
SC
0 2 4 6 κ 8 10
Tot
al C
ost
0
5
10
15
20
25
(d) N = 40
Figure 11 Markovian Model: Cady Costs - Queue Dominated
parameters in the Markovian simulation model due to the higher nurse to patient ratio which results in larger
systems, this is not true for the high fidelity simulation model. For the sake of space, we do not include
figures for the Eachempati et al. (2004) simulations, but they are available from the authors upon request.

31
wCB/W
SC
0 2 4 6 κ 8 10
Tot
al C
ost
0
2
4
6
8
10
12
(a) N = 5
wCB/W
SC
0 2 4 6 κ 8 10
Tot
al C
ost
0
5
10
15
20
(b) N = 10
wCB/W
SC
0 2 4 6 κ 8 10
Tot
al C
ost
0
5
10
15
20
25
30
DiffusionFluidSimulationNo SDU
IDCD
(c) N = 20
wCB/W
SC
0 2 4 6 κ 8 10
Tot
al C
ost
0
10
20
30
40
50
(d) N = 40
Figure 12 High Fidelity Model: Cady Costs - Balk Dominated
wCQ/W
SC
0 2 4 6 κ 8 10
Tot
al C
ost
0
2
4
6
8
10
12
(a) N = 5
wCQ/W
SC
0 2 4 6 κ 8 10
Tot
al C
ost
0
2
4
6
8
10
12
14
16
18
(b) N = 10
wCQ/W
SC
0 2 4 6 κ 8 10
Tot
al C
ost
0
5
10
15
20
25
DiffusionFluidSimulationNo SDU
IDCD
(c) N = 20
wCQ/W
SC
0 2 4 6 κ 8 10
Tot
al C
ost
0
5
10
15
20
25
30
35
40
45
(d) N = 40
Figure 13 High Fidelity Model: Cady Costs - Queue Dominated
6. Conclusions and Discussion
In this work, we consider the optimal allocation of nurses for the inpatient units used to treat the hospital’s
most critical patients: the ICU and SDU. In doing so, we provide insight into when and how the SDU can
be useful in managing patient flow and what factors drive the optimal use of SDUs. Within the medical
community, there is an ongoing debate with regards to how hospitals should manage and size SDUs. Our

32
work is an important first step towards helping to resolve this debate.
We propose a queueing model which allows us to examine how to optimally tradeoff capacity needs with
capacity gains given the costs associated with lack of access to ICU and/or SDU care. Via our fluid anal-
ysis, we identify two parameter regimes–the ICU-Driven andCapacity-Driven regimes–which dictate the
optimality of allocating a very small (including zero) or a substantial number of nurses to the SDU. Our
results suggest that the first-order optimal solution is ‘bang-bang’ in that, depending on the regime, only
costs associated with critical or semi-critical patients will be incurred, but not both. On the other hand, costs
associated with both critical and semi-critical patients will be incurred when second order terms are con-
sidered. Through our analysis, we identify the main driversin managing the ICU/SDU sizing decision and
balking threshold. We isolate two main parameters which impact the manner in which the nurse allocation
decision should be made. One captures the demand for SDU bedsas measured by the fraction of critical
patients who become semi-critical; the other captures the supply gain from SDU beds as measured by the
ratio of the effective capacity of a nurse in the SDU versus the ICU. We see that these two parameters play
a critical role in the nurse allocation decision at both the fluid and diffusion level. Additionally, we find that
optimizing the balking threshold beyond the dichotomy of allowing or not allowing balking only has a sec-
ond order impact on reducing costs, if that. Using simulation, we find that our analysis in these asymptotic
regimes can be quite accurate, even as we relax our initial model assumptions.
In practice, there is high variation across hospitals as to whether it has an SDU and if so, how large the
unit is in comparison to the ICU. In some cases, this variation could be attributed to the fact there is limited
consensus in the medical community as to the management of SDUs. However, our analysis provides a
complementary explanation. The optimal size of an SDU is highly dependent on patient mix (including
differences in service times and the likelihood of becominga semi-critical patient following ICU care),
staffing requirements in the ICU versus SDU, as well as the relative cost of lack of access to care for a
critical versus semi-critical patient. Because these factors are likely to vary substantially across different
hospitals and geographic areas, it is reasonable–and highly desirable–that hospitals utilize and size SDUs
in a heterogenous manner; one size does not fit all. As such, wefind that even if hospitals were sizing their
SDUs in an optimal manner, we would still expect to see high variation in the use of SDUs. Moreover, our
analysis allows us to isolate supply and demand characteristics of the ICU and the SDU which can be used
to identify how hospitals should think about managing theseunits.
This work suggests several potential directions for futureresearch. In our analytic model, we focused
on patient flows from the ICU into the SDU and did not incorporate other patient flows through the ICU.
These modeling choices were necessary for tractability andwe used extensive simulations to develop and
understanding of how our insights might translate to other settings. An interesting direction would be to
consider other patient flows through the SDU. In our simulations, we see that our proposed policies work
reasonably well even with alternative flows, so we conjecture that similar insights will carry over. That

33
said, in the queue-dominated case off-placement and external arrivals contributed to deviations from our
proposed solutions, so these are two features that one mightwant to consider as a reasonable next step. One
could also consider different priority rules, so that in some cases a critical patient will have to wait (and
potentially abandon), even if there is a semi-critical patient in the ICU which could be bumped. Another
interesting direction one could consider is the impact of state-dependent dynamics. A number of recent
works (e.g. Chan et al. (2014b, 2016)) have found that patient flow parameters (e.g.µC , µSC , p) can be
dependent on congestion, which begs the question as to how these dynamics may impact the management
of the ICU and SDU. Finally, in this paper we have focused on sizing the ICU and SDU, while ignoring the
size of the general wards. This is because the ICU is often considered the hospital bottleneck. An interesting
direction for future research is to explicitly model the size and dynamics of the general ward along with the
other two units.
Despite some of these limitations of our model, our work provides an important first step into addressing
the substantial debate in the medical community as to if and how SDUs should be used. The prevailing
sentiment amongst SDU supporters is that they are a cost effective way to provide care to semi-critical
patients. This is true in some cases (CD regime). However, inthe ID regime, we see that the need of the high
priority patients outweighs the additional capacity generated by moving nurses to the SDU. Still, even in this
regime, asmallSDU can be beneficial in serving as a buffer between the ICU andthe hospital wards. The
insights from our work will be useful for hospital managers to assess the pros and cons of SDUs and whether
one is warranted at their hospital. Indeed, we are currentlyworking with a large academic hospital which
treats an underserved population that recently opened a newSDU. This unit is only used as a true Step-
Down Unit, so that patients are only admitted following ICU discharge. Upon learning of our findings, the
critical care team reached out to us for help assessing the management of their new SDU. We are currently
working with them to collect data in order to calibrate system parameters for their patient population. While
we do not expect the hospital to directly implement the precise sizing and balking threshold decision our
model recommends, we do expect to be able to isolate the main parametersp andν driving the management
of the SDU in order to assess i) whether a sizable SDU is warranted and ii) whether most critical patients
should wait or balk immediately upon arriving to a full ICU.
Acknowledgements
We are grateful to Feryal Erhun, Linda Green and Avi Mandelbaum for providing us with invaluable feed-
back throughout the various stages of this project. We also thank Michael Huang his research assistance
with our simulation study. The research by C. W. Chan was partially supported by the National Science
Foundation [CMMI-1233547].
ReferencesAkan, M., B. Ata, T. Olsen. 2013. Congestion-based leadtimequotation for heterogeneous customers with convex-
concave delay costs: Optimality of a cost-balancing policybased on convex hull functions.Operations Research
60(6) 1505–1519.
34
Aloe, K., L. Raffaniello, M. Ryan, L. Williams. 2009. Creation of an Intermediate Respiratory Care Unit to Decrease
Intensive Care Utilization.Journal of Nursing Administration39(11) 494–498.
Andradottir, S., H. Ayhan, H. Eser Kirkizlar. 2012. Flexible servers in tandem lines with setups.Queueing Systems
70(2) 165–186.
Armony, M., S. Israelit, A. Mandelbaum, Y.N. Marmor, Y. Tseytlin, G.B. Yom-tov. 2015. Patient flow in hospitals: A
data-based queueing-science perspective.Stochastic Systems5(1) 146–194.
Ata, B., B.L. Killaly, T.L Olsen, R.P. Parker. 2013. On hospice operations under medicare reimbursement policies.
Management Science59(5) 1027–1044.
Ata, B., J. A. Van Mieghem. 2009. The Value of Partial Resource Pooling: Should a Service Network Be Integrated
or Product-Focused?Management Science55(1) 115–131.
Bassamboo, A., R. S. Randhawa. 2010. On the accuracy of fluid models for capacity sizing in queueing systems with
impatient customers.Operations Research58 1398–1413.
Bassamboo, A., R.S. Randhawa, J.A. Van Miegham. 2012. A Little Flexibility is All You Need: On the Asymptotic
Value of Flexible Capacity in Parallel Queuing Systems.Operations Research60(6) 1423–1435.
Beck, M. 2011. Critical (Re)thinking: How ICUs are getting amuch-needed makeover.Wall Street Journal, March
28 .
Bell, S. L., R. J. Williams. 2001. Dynamic Scheduling of a System with Two Parallel Servers in Heavy Traffic with
Resource Pooling: Asymptotic Optimality of a Threshold Policy. Annals of Applied Probability11(3) 608–649.
Best, T., B. Sandikci, D. Eisenstein, D. Meltzer. 2015. Managing hospital inpatient bed capacity through partitioning
care into focused wings.Manufacturing & Service Operations Management17(2) 157–176.
Browne, S., W. Whitt. 1995. Piecewise-linear diffusion processes. Dshalalow, ed.,Advances in queueing: Theory,
methods, and open problems. CRC Press, Boca Raton, FL, 463–480.
Byrick, R.J., J.D. Power, J.O. Ycas, K.A. Brown. 1986. Impact of an intermediate care area on ICU utilization after
cardiac surgery.Critical care medicine14(10) 869.
Cady, N., M. Mattes, S. Burton. 1995. Reducing Intensive Care Unit Length of Stay: A Stepdown Unit for First-Day
Heart Surgery Patients.Journal of Nursing Administration25(12) 29–35.
Chalfin, D. B., S. Trzeciak, A. Likourezos, B. M. Baumann, R. P. Dellinger. 2007. Impact of delayed transfer of
critically ill patients from the emergency department to the intensive care unit.Critical Care Medicine35
1477–1483.
Chan, C. W., V. F. Farias, N. Bambos, G. Escobar. 2012. Optimizing ICU Discharge Decisions with Patient Readmis-
sions.Operations Research60 1323–1341.
Chan, C. W., V. F. Farias, G. Escobar. 2016. The Impact of Delays on Service Times in the Intensive Care Unit.
Management Science, to appear.

35
Chan, C. W., L. V. Green, L. Lu, G. Escobar. 2014a. The role of astep-down unit in improving patient outcomes.
working paper, Columbia Business School.
Chan, C.W., G. Yom-Tov, G. Escobar. 2014b. When to use Speedup: An Examination of Service Systems with Returns.
Operations Research62(2) 462 – 482.
Dai, J. G., T. Tezcan. 2008. Optimal Control of Parallel Server Systems with Many Servers in Heavy Traffic.Queueing
Systems59 95–134.
de Vericourt, F., O.B. Jennings. 2008. Dimensioning large-scale membership services.Operations Research56(1)
173–187.
Durbin, C.G., R.F. Kopel. 1993. A Case-Control Study of Patients Readmitted to the Intensive Care Unit.Critical
Care Medicine21 1547–1553.
Eachempati, S. R., L. J. Hydo, P. S. Barie. 2004. The effect ofan intermediate care unit on the demographics and
outcomes of a surgical intensive care unit population.Archives of Surgery139(3) 315–319.
Gans, N., G. Koole, A. Mandelbaum. 2003. Telephone Call Centers: Tutorial, Review, and Research Prospects.Man-
ufacturing & Service Operations Management5(2) 79–141.
Garnett, O., A. Mandelbaum, M. Reiman. 2002. Designing a call center with impatient customers.Manufacturing &
Service Operations Management4(3) 208–227.
Ghamami, S., A. R. Ward. 2012. Dynamic Scheduling of a Two-Server Parallel Server System with Complete Resource
Pooling and Reneging in Heavy Traffic: Asymptotic Optimality of a Two-Threshold Policy.Mathematics of
Operations Research38(4) 761–824.
Green, L. 1985. A Queueing System with General-Use and Limited-Use Servers.Operations Research33 168–182.
Green, L. V., S. Savin, B. Wang. 2006a. Managing patient service in a diagnostic medical facility.Operations Research
54(1) 11–25.
Green, L. V., J. Soares, J. F. Giglio, R. A. Green. 2006b. Using queuing theory to increase the effectiveness of
emergency department provider staffing.Academic Emergency Medicine13 61–68.
Gurvich, I., W. Whitt. 2009a. Queue-and-Idleness-Ratio Controls in Many-Server Service Systems.Mathematics of
Operations Research34 363–396.
Gurvich, I, W Whitt. 2009b. Scheduling flexible servers withconvex delay costs in many-server service systems.
Manufacturing and Service Operations Management11(2) 237–253.
Gurvich, I, W Whitt. 2010. Service-level differentiation in many-server service systems via queue-ratio routing.
Operations Research58(2) 316–328.
Halfin, S., W. Whitt. 1981. Heavy-Traffic Limits for Queues with Many Exponential Servers.Operations Research
29 567–588.
Halpern, N.A., S.M. Pastores. 2010. Critical care medicinein the United States 2000-2005: an analysis of bed numbers,
occupancy rates, payer mix, and costs.Crit Care Med38 65–71.

36
Harding, A. D. 2009. What Can An Intermediate Care Unit Do ForYou? Journal of Nursing Administration39(1)
4–7.
Harrison, J.M., A. Zeevi. 2004. Dynamic scheduling of a multiclass queue in the halfin and whitt heavy traffic regime.
Operations Research52 243–257.
Hopp, W.J., E. Tekin, M.P. Van Oyen. 2004. Benefits of skill chaining in serial production lines with cross-trained
workers.Managemet Science50(1) 83–98.
Iravani, S.M.R., M.P. Van Oyen, K.T. Sims. 2005. Structuralflexibility: A new perspective on the design of manufac-
turing and service operations.Management Science51(2) 151–166.
Jagerman, D. L. 1974. Some properties of the erlang loss function. Bell Systems Tech. J.53 525–551.
Joint Commission Resources. 2004.Improving Care in the ICU. Joint Commission on Accredidation of Healthcare
Organizations.
Kc, D., C. Terwiesch. 2012. An econometric analysis of patient flows in the cardiac intensive care unit.Manufacturing
& Service Operations Management14(1) 50–65.
Keenan, S. P., W. J. Sibbald, K. J. Inman, D. Massel. 1998. A Systematic Review of the Cost-Effectiveness of Non-
cardiac Transitional Care Units.Chest113 172–177.
Kim, S-H, C. W. Chan, M. Olivares, G. Escobar. 2015. ICU Admission Control: An Empirical Study of Capacity
Allocation and its Implication on Patient Outcomes.Management Science61 19–38.
Kirkizlar, H. Eser, S. Andradottir, H. Ayhan. 2012. Flexible servers in understaffed tandem lines.Production and
Operations Management21(4) 761–777.
Kocaga, Y. L., M. Armony, A. R. Ward. 2015. Staffing call centers with uncertain arrival rates and co-sourcing.
Production and Operations Management24(7) 1101–1117.
Kocaga, Y. L., A. R. Ward. 2010. Admission control for a multi-server queue with abandonment.Queueing Systems
65(3) 275–323.
Kostami, V., A.R. Ward. 2009. Managing service systems withan offline waiting option and customer abandonment.
Manufacturing & Service Operations Management11(4) 644–656.
Kwan, M.A. 2011. Acuity-adaptable nursing care: Exploringits place in designing the future patient room.Health
environments research & design5(1) 77 – 93.
Litvak, N., M. Van Rijsbergen, R. J. Boucherie, M. van Houdenhoven. 2008. Managing the overflow of intensive care
patients.European journal of operational research185(3) 998–1010.
Mandelbaum, A, A Stolyar. 2004. Scheduling flexible serverswith convex delay costs: Heavy-traffic optimality of the
generalized cµ -rule. Operations Research52(6) 836–855.
Mandelbaum, A., S. Zeltyn. 2009. Staffing many-server queues with impatient customers: constraint satisfaction in
call centers.Operations Research57 1189–1205.
37
Mason, J.E., B.T. Denton, N.D. Shah, S.A. Smith. 2014. Usingelectronic health records to monitor and improve
adherence to medication.working paper, University of Virgina.
Mathews, K. S., E. F. Long. 2015. A conceptual framework for improving critical care patient flow and bed utilization.
Annals of the American Thoracic Society, to appear.
Mills, A., N. T. Argon, S. Ziya. 2013. Resource-based patient prioritization in mass-casualty incidents.MSOM15
361–377.
Mills, A., N. T. Argon, S. Ziya. 2015. Dynamic distribution of casualties to medical facilities in the aftermath of a
disaster.working paper, Kelley School of Business, Indiana University .
Reiman, M.I. 1984. Some diffusion approximations with state space collapse. F. Baccelli, G. Fayolle, eds.,Modelling
and Performance Evaluation Methodology. Springer-Verlag, 209–240.
Rubino, M., B. Ata. 2009. Dynamic control of a make-to-orderparallel-server system with cancellations.Operations
Research57(1) 94–108.
Ryckman, F.C., P.A. Yelton, A.M Anneken, P.E. Kiessling, P.J. Schoettker, U.R. Kotagal. 2009. Redesigning intensive
care unit flow using variability management to improve access and safety.Joint Commission journal on quality
and patient safety / Joint Commission Resources35 535–43.
Shmueli, A., C.L. Sprung, E.H. Kaplan. 2003. Optimizing admissions to an intensive care unit.Health Care Manage-
ment Science6(3) 131–136.
State of California Office of Statewide Health Planning & Development. 2010-2011. Annual Financial Data. URL
http://www.oshpd.ca.gov/HID/Products/Hospitals/AnnFinanData/CmplteDataSet/index.asp,accesse
Stolyar, Alexander L. 2014. Tightness of stationary distributions of a flexible-server system in the halfin-whitt asymp-
totic regime.arXiv preprint arXiv:1403.4896.
Strachota, Ellen, Pamela Normandin, Nancy OBrien, Mary Clary, Belva Krukow. 2003. Reasons registered nurses
leave or change employment status.Journal of Nursing Administration33(2) 111–117.
Tezcan, T., J.G. Dai. 2010. Dynamic Control of N-Systems with Many Servers: Asymptotic Optimality of a Static
Priority Policy in Heavy Traffic.Operations Research58 94–110.
Tosteson, A., L. Goldman, I. S. Udvarhelyi, T. H. Lee. 1996. Cost-effectiveness of a coronary care unit versus an
intermediate care unit for emergency department patients with chest pain.Circulation 94(2) 143–150.
Tsitsiklis, J.N., K. Xu. 2012. On the power of (even a little)resource pooling.Stochastic Systems2 1–66.
Vincent, J.-L., G. D. Rubenfeld. 2015. Does intermediate care improve patient outcomes or reduce costs?Critical
Care19(1) 89–94.
Wallace, R.B., W. Whitt. 2005. A staffing algorithm for call centers with skill-based routing.Manufacturing and
Service Operations Management7 276–294.
Ward, A. R. 2012. Asymptotic analysis of queueing systems with reneging: A survey of results for fifo, single class
models.Surveys in Operations Research and Management Science17(1) 1–14.

38
Whitt, W. 2002a. Stochastic-process limits: an introduction to stochastic-process limits and their application to
queues. Springer Science & Business Media.
Whitt, W. 2002b. Stochastic-Process limits: An Introduction to StochasticProcess Limits and their applications to
Queues. Spring-Verlag, New York.
Whitt, W. 2006. Fluid Models for Multiserver Queues with Abandonments.Operations Research54 37–54.
Yankovic, N., L. Green. 2011. Identifying Good Nursing Levels: A Queuing Approach.Operations Research59
942–955.
Yom-Tov, G., A. Mandelbaum. 2014. Erlang-r: A time-varyingqueue with reentrant customers, in support of health-
care staffing.Manufacturing & Service Operations Management16(2) 283–299.
Zhang, Bo, H. Ayhan. 2013. Optimal admission control for tandem queues with loss.IEEE Transactions on Automatic
Control 58(1) 163–167.
Zimmerman, J.E., D.P. Wagner, W.A. Knaus, J.F. Williams, D.Kolakowski, E.A. Draper. 1995. The use of risk
predictions to identify candidates for intermediate care units. Chest108(2) 490.

39
Electronic CompanionEC-1. Technical Results and Proofs
PROOF OFPROPOSITION1:
1. Suppose thatlimsupN→∞ λ(
1rIµC
+ prSµSC
)
≤N . Note, this implies that the offered load in the ICU
can be met:limsupN→∞λ
rIµC≤ N . Consider the case where there is no balking, i.e.K = ∞. Then, the
number of critical patients in the ICU behaves like anM/M/BI +M queue. With traffic intensity λBIµC
≤1, we have that, by (Garnett et al. 2002, Theorem 4) withβ > −∞, the rate of abandonment is equal to
[λ−BIµC ]++ o(N) = o(N).
As for the semi-critical patients, the arrival rate into this state is equal topµCEZC , whereEZC stands for
the expected steady-state number of ICU beds that are occupied by critical patients. The service rate is equal
to (BS +BI −EZC)µSC. By Little’s law,EZC = (λ− o(N))/µC, where theo(N) term is contributed by
the critical patient abandonment rate. The bumping rate is hence equal to
[pµCEZC − (BS +BI −EZC)µSC ]+= µSC [µT (λ+ o(N))− (BS +BI)]
+= o(N).
2. Suppose now thatlim infN→∞ λ(
1rIµC
+ prSµSC
)
> N . We let 1/µT =(
1µC
+ pµSC
)
be the mean
amount of time a new patient should be treated while in the critical and semi-critical states if the system has
ample capacity. For any bed allocation(BI ,BS), we letρC = λBIµC
andρT = λ(BI+BS)µT
. In this case, we
have that for any sequence of bed allocation(BI ,BS), eitherlim infN→∞ ρC > 1, or lim infN→∞ ρT > 1,
or both. If limsupN→∞ ρC > 1, then we have that the aggregated abandonment and balking rate is at least
λ− bIµC, which isO(N) (it could be less if semi-critical patients are occupying ICU beds, so that less
thanbI beds are available to treat critical patients). On the otherhand, iflimsupN→∞ ρC ≤ 1, then by 1. the
abandonment iso(N). Therefore, the bumping rate is again equal to
[pµCEZC − (BS +BI −EZC)µSC]+= µSC [µT (λ+ o(N))− (BS +BI)]
+=O(N).
If neither of these cases applies, the argument works analogously when considering converging subse-
quences such that eitherlimN→∞ ρC > 1 or limN→∞ ρC ≤ 1. ✷
EC-1.1. Diffusion Analysis in the ID regime
We examine the two-dimensional process with state(Q+ZC ,ZSC), whereQ denotes the queue length and
ZC (ZSC ) denotes the number of critical (semi-critical) patients occupying a bed. This process is clearly a
Markov process under the strict priority of critical patients over semi-critical patients in the ICU; however,
the dynamics of this process are intricate. While the dynamics of the critical patients follow that of a fairly
standard multiserver queue with finite/infinite waiting room and abandonment, the dynamics of the semi-
critical patients cannot be analyzed separately from the critical patients; the dynamics of the critical patients
determine precisely the arrival rate into the semi-critical state and also how many beds are available in

40
the ICU to treat these patients. Despite the challenges which arise with the two-dimensional Markovian
model, we are able to show that this two-dimensional processmay be accurately approximated by a one-
dimensional process. Let
ZNC :=
1√λ
(
ZNC −BN
I
)
, ZNSC :=
1√λ
(
ZNSC −BN
S
)
,
describe the diffusion scaled number of patients occupyinga bed within each of the two states, respectively.
Also, let⇒ represent weak convergence. Then we have:
Theorem 1 (State-Space Collapse) In the ID regime and under the nurse allocation of (7) we have astate-
space collapse. More formally, assuming that at time 0,ZNC (0)+ ZN
SC(0)⇒ 0, asN →∞, then
ZNC + ZN
SC ⇒ 0, asN →∞,
where the convergence is inD the space of all RCLL (Right Continuous with Left Limits) functions with
values inR, equipped with the SkorohodJ1 metric (see Whitt (2002b)).
PROOF OFTHEOREM 1: Suppose that (4) holds in the limit. That is, assume that
lim infN→∞
λ
NrSµSC
(p+ ν)> 1. (EC-1)
Additionally, assume that the system operates in the ID regime and that (6) and (7) hold. LetUN := ZNC +
ZNSC . And suppose thatUN(0) = 0. It is our goal to show that for anyǫ > 0,
P
{
inf0≤t≤1
UN (t)<−ǫ}
→ 0, as N →∞.
The proof follows along the lines of Reiman (1984). Fixǫ > 0 and let τN = inf{t ≥ 0; UN (t) <
−ǫ} andτ ′N = sup{t ≤ τN ; UN(t) ≥ −ǫ/2}. During [τ ′N , τN ] there are empty beds in either the ICU or
SDU (or both), so no bumping will occur. In particular, during this interval
ZNC (t)+ZN
SC(t) =ZNC (τ ′N)+ZN
SC(τ′N)+AN(τ ′N , t)+ΦN(τ ′N , t)−DN
C (τ′N , t)−DN
SC(τ′N , t),
where, fors < t, AN(s, t) is the number of critical patients that arrived directly into the ICU (and did not
wait in queue) during(s, t]; ΦN(s, t) is the number of critical patient arrivals into the ICU from the queue in
(s, t];DNC (s, t] is the number of critical patients who have completed their stay in the ICU and did not switch
to a semi-critical state during(s, t]; and,DNSC(s, t) is the number of service completions of semi-critical
patients in(s, t]. More specifically, letSi, i= 1,2,3 be independent unit Poisson processes, then
AN(s, t)+ΦN(s, t) = S1
(∫ t
s
λ1{ZNC
(r)<BI} +µCZNC (r)1{ZN
C(r)=BI , Q>0} · dr
)
= (t− s) · (λ+ o(λ)),
DNC (s, t) = S2
(
(1− p)µC
∫ t
s
ZNC (r) · dr
)
= (t− s) · ((1− p)λ+ o(λ)), (EC-2)

41
DNSC = S3
(
µSC
∫ t
s
ZNSC(r) · dr
)
≤ S3
(
µSC
∫ t
s
(
BNS +BN
I −ZNC (r)
)
· dr)
= (t− s) ·(
µSCrSrI
(
NrI −λ
µC
)
+ o(λ)
)
.
Recall that the ICU is operating in the QED regime with respect to critical patients; therefore,µCZNC =
λ+ o(λ) andBI −ZNC = o(λ). Finally, we have:
P{
inf0≤t≤1 UN(t)<−ǫ
}
≤P{
inf0≤s≤t≤1AN (s,t)+ΦN (s,t)−DN
C (s,t)−DNSC(s,t)√
λ<−ǫ/2
}
= P
{
inf0≤s≤t≤1
t−sµCrI
·(λ·(prIµC+µSCrS)−µSCµCrSrIN)+o(√λ)
√λ
<−ǫ/2}
→ 0, by (EC-1).✷
Given the state-space collapse result that applies to the process(Q+ZC ,ZSC), it is reasonable to expect
that a similar state-space collapse applies in steady-state and in expectation (e.g. Gurvich and Whitt (2009a),
Stolyar (2014)). A lengthy and rather technical mathematical argument is required to formally establish this
result. This is outside the scope of this work; we simply postulate here that the same state-space collapse
holds in steady-state and in expectation.
According to Theorem 1, in the diffusion scale, all beds are always full. In particular, it is sufficient to
know the value of the one dimensional processXNC :=QN +ZN
C in order to figure out the value of the two
dimensional process(XNC ,Z
NSC) (up to ordero(
√N )). For example, if there is no queue (XN
C ≤BI so that
QN = 0), then we know that any ICU bed which is not occupied by a critical patient will be used to treat
a semi-critical patient. Hence the term ‘State-space collapse’. We will leverage this result to evaluate the
steady-state cost. To do so, we will rely on a result that follows directly from the results in Kocaga and Ward
(2010). Note that these results generalize those of Garnettet al. (2002) and Browne and Whitt (1995).
Theorem 2 (ID Diffusion performance) In the ID regime, and under the nurse allocation in (7) and for
balking thresholdKN = k√N , we have that(QN , IN , LN)⇒ (Q, I, L), asN →∞,
E[Q] =1
θ√µC
·1− exp
(−θσ2
(
k2 +2mθk))
+ 2σ
√
πθme
m2
θσ2
(
Φ(
mσ
√
2θ
)
−Φ(√
2θσ
(
k+ mθ
)
))
2σ
√π
(
1õCe
m2
µCσ2Φ(
mσ
√
2µC
)
+ 1√θe
m2
θσ2
(
Φ(√
2θσ
(
k+ mθ
)
)
−Φ(
mσ
√
2θ
))
)
and
E[I ] =1õC
·1µC
(
1+ 2σ
√
πµCme
m2
µCσ2Φ(
mσ
√
2µC
)
)
2σ
√π
(
1õCe
m2
µCσ2Φ(
mσ
√
2µC
)
+ 1√θe
m2
θσ2
(
Φ(√
2θσ
(
k+ mθ
)
)
−Φ(
mσ
√
2θ
))
)
wherem := βµC andσ2 = 2µC. Additionally, we have that the scaled balking rate is:
L=1õC
· e−θ
σ2 (k2+2m
θk)
2σ
√π
(
1õCe
m2
µCσ2Φ(
mσ
√
2µC
)
+ 1√θe
m2
θσ2
(
Φ(√
2θσ
(
k+ mθ
)
)
−Φ(
mσ
√
2θ
))
) .

42
EC-1.2. Diffusion Analysis in the CD Regime
We start by examining the optimal balking threshold. First notice that by Theorem 4.3 of
Mandelbaum and Zeltyn (2009), we have that in this regime, when no balking occurslimλ→∞EQN/λ=
(1− γ)/θ. We now argue that whenever the balking thresholdKN is smaller thanEQN , then the queue
length is always equal toKN up to an order ofo(√N).
Proposition 5 (Balking threshold in the CD regime) In the CD regime and under the nurse allocation of
(9) and (10) if a threshold policy is used with thresholdKN that satisfies
limsupN→∞
KN
(1− γ)λ/θ= 1− η, 0< η≤ 1, (EC-3)
then, the buffer is always full. More formally, assuming that at time 0, ZNC (0)+QN (0)−(BN
I +KN )√N
⇒ 0, as
N →∞, thenZN
C +QN − (BNI +KN)√
N⇒ 0, asN →∞,
where the convergence is inD the space of all RCLL (Right Continuous with Left Limits) functions with
values inR, equipped with the SkorohodJ1 metric.
PROOF OFPROPOSITION5: Suppose that (EC-1) holds. Additionally, assume that thesystem operates
in the CD regime and that (9) and (10) hold. LetUN :=ZNC +QN−(BN
I +KN )√λ
, and suppose thatUN (0) = 0. It
is our goal to show that for anyǫ > 0,
P
{
inf0≤t≤1
UN (t)<−ǫ}
→ 0, as N →∞.
The proof follows along the lines of Reiman (1984). Fixǫ > 0 and let τN = inf{t ≥ 0; UN (t) <
−ǫ} andτ ′N = sup{t≤ τN ; UN(t)≥−ǫ/2}. During the interval[τ ′N , τN ], we have thatZN
C +QN <BNI +
KN , so no balking would occur. In particular, during this interval
ZNC (t)+QN(t) =ZN
C (τ ′N)+QN(τ ′N)+AN (τ ′N , t)−DNC (τ ′N , t)−ΦN(τ ′N , t),
where, fors < t, AN(s, t) is the number of critical patients that arrived to the systemduring(s, t],DNC (s, t]
is the number of critical patients who have completed their stay in the ICU and either switched to a semi-
critical state during(s, t] or not. Finally,ΦN(s, t) is the number of abandonment from the queue in(s, t].
More specifically, letSi, i= 1,2,3 be independent unit Poisson processes, and letτ ′N ≤ s < t≤ τN . Then
AN(s, t) = S1
(∫ t
s
λ1{QN (r)<KN} · dr)
= (t− s) · (λ+ o(λ)),
DNC (s, t) = S2
(
µC
∫ t
s
ZNC (r) · dr
)
≤ S2 (µCBI(t− s)) = (t− s) · (γλ+ o(λ)), (EC-4)

43
ΦN(s, t) = S3
(
θ
∫ t
s
QN(r) · dr)
≤ S3
(
θKN(t− s))
≤ S3 ((1− γ)(1− η/2)(t− s)+ o(λ))= (t− s) · ((1− γ)(1− η/2)+ o(λ)) .
Finally, we have:
P{
inf0≤t≤1 UN(t)<−ǫ
}
≤P{
inf0≤s≤t≤1AN (s,t)−DN
C (s,t)−ΦN (s,t)√λ
<−ǫ/2}
= P{
inf0≤s≤t≤1(t−s)·λ·(1−γ)η/2+o(λ)√
λ<−ǫ/2
}
= P{
inf0≤s≤t≤1 (t− s) ·√λ · (1− γ)η/2+ o(
√λ)<−ǫ/2
}
→ 0, by (EC-1).
✷
Corollary 2 Under the conditions of Proposition 5, we have that the number of ICU beds that are occupied
by critical patients is equal toBI − o(√N).
Corollary 3 Under the conditions of Proposition 5, the optimal threshold in the balking-dominated case
satisfiesK∗N = o(√N).
PROOF OFCOROLLARY 3: By the fluid analysis we have thatK∗N = o(N). Therefore,K∗N satisfies
(EC-3) withη = 1. By Corollary 2, the number of ICU beds available for semi-critical patients iso(√N)
and therefore, the bumping cost is independent of the threshold levelKN (up to o(√N )). It is therefore
sufficient to focus on the queue and balking costs. As a function of the threshold levelKN we have that, by
Proposition 5, the total queue plus balking cost rate is equal to
wQCK
N +wBC ·(
λ−µCBI − θKN)
+ o(√N ) = θKN ·
(
wQC/θ−wB
C
)
+wBC · (λ−µCBI)+ o(
√N).
Under the balking-dominated case, the cost above is minimized byKN = o(√N). ✷
EC-2. When beds are the constrained resources
Consider a hospital withB critical care beds. The goal is to determine how to split these beds between the
ICU (BI ) and SDU (BS). Due to the strict nurse-to-patient ratios which must be maintained, determining
the number of beds at each level of care will dictate how many nurses (N ) are required to staff the units.
We make this decision in order to minimize staffing costs in addition to the cost of lack of access to care,
which are given by balking, abandonment, holding and bumping costs in our original model of Section 2.
For simplicity, we consider the case with no balking. Thus the problem we aim to solve is
minBI ,BS ,N≥0
wNN +wCRAb +wSCRBump (EC-5)
Subject to BI/rI +BS/rS ≤N
44
BI +BS ≤B,
wherewN is the staffing cost rate per nurse,wC =wQC/θ is the critical cost,wSC is the bumping cost, and
RAb andRBump are the abandonment and bumping rates, respectively.
By observing that the maximum number of nurses needed given afixed number of bedsB isN =B/rI
(obtained when all beds are designated as ICU beds,BI =B), the overload Assumption 2 translates into
Assumption 3 The system operates in overload. That is,
λ
rSµSC
(
p+rSµSC
rIµC
)
>B
rI. (EC-6)
Assuming a setting with a large number of bedsB, we now consider fluid analysis to obtain insights
into the first order drivers of the bed allocation decision. Redefineλ = λ/B, bI = BI/B, bS =
BS/B, and n=N/B. then the corresponding fluid problem that only considers terms of orderB is
minbI ,bS ,n≥0
wNn+wC
(
λ− bIµC)+ +wSC(p
(
bIµC ∧ λ)
− bSµSC
)+(EC-7)
Subject to bI/rI + bS/rS ≤ n
bI + bS ≤ 1.
To solve the problem (EC-7), we first fix0≤ bI ≤ 1∧ λ/µC and consider the optimal values ofbS andn
as a function ofbI . We will then optimize overbI . Note that it is sufficient to consider values ofbI ≤ λ/µC
due to Proposition 2. The next lemma helps to identify the optimal value ofbS given a value ofbI , by using
the tradeoff between staffing and bumping costs, as well as the value ofn in optimality.
Lemma 1 Given0≤ bI ≤ 1∧ λ/µC , then
n=bIrI
+bSrS, (EC-8)
and
bS =
{
min{
1− bI , pbIµC
µSCµSC
}
, if wN
wSC< rSµSC ;
0, if wN
wSC≥ rSµSC ;
PROOF: Given0 ≤ bI ≤ 1 and0 ≤ bS ≤ 1− bI , we haven ≥ bI/rI + bS/rS from feasibility. Now if
n > n0 := bI/rI + bS/rS, then the solution(bI , bS , n) is feasible and incurs a higher staffing cost than the
feasible solution(bI , bS, n0) without improving the abandonment or bumping cost. This proves (EC-8).
Next fix 0 ≤ bI ≤ 1 ∧ λ/µC. For feasibility, we must have that0 ≤ bS ≤ 1− bI , so by (EC-8), we have
thatn= bI/rI + bS/rS. We start by considering the case where1− bI <p bIµC
µSC. For anybS ∈ (0,1− bI), let
us examine the marginal value of increasing (decreasing)n. Whenn increases bydn, the marginal staffing
cost increases bywN · dn. At the same time, this increase inn allows us to correspondingly increasebS

45
by rS · dn. BecausebS < p bIµC
µSC, the bumping cost is non-zero and this additional capacity decreases the
bumping cost bywSCrSµSC · dn. All together, the marginal effect on the cost is(wN −wSCrSµSC) · dn.
Thus, depending on whether this marginal cost is positive ornegativebS should be minimal (0) or maximal
(1− bI), respectively.
Now we consider the case where1− bI ≥ p bIµC
µSC. In this case, ifbS = p bIµC
µSCthe bumping cost is equal
to zero. Therefore, increasingbS beyond this point will only increase the overall cost. Thus,depending on
whether the marginal cost of increasingn (calculated above) is positive or negativebS should be minimal
(0) or maximal (p bIµC
µSC), respectively. ✷
We can now reformulate the objective function (EC-7) in terms of bI and optimize over this variable.
Specifically, we wish to solve:
min0≤bI≤1∧λ/µC
wN (bI/rI + bS/rS)+wC(λ− bIµC)+wSC(pbIµC − bSµSC), (EC-9)
wherebS is determined according to Lemma 1. We have two cases to consider depending on the relationship
betweenwN
wSCandrSµSC .
Proposition 6 (No SDU) If wN
wSC≥ rSµSC then the optimal solution of (EC-9) is to have no SDU (b∗S = 0),
an ICU withb∗I beds, with
b∗I =
{
1∧ λ/µC if wN
wC−pwSC≤ rIµC , ID regime
0 otherwise, No critical care(EC-10)
andn∗ = b∗I/rI.
The intuition behind this result is thatwN is the marginal cost increase of increasingn, while rIwCµC
and rIwSCpµC are the marginal decrease in abandonment cost and marginal increase in bumping cost,
respectively. Thus, depending on whether the marginal costis positive or negative,b∗I will obtain its minimal
or maximal possible value.
PROOF: BecausewN
wSC≥ rSµSC , b∗S =0 by Lemma 1. Minimizing (EC-9) then becomes:
min0≤bI≤1∧λ/µC
wNbI/rI +wC(λ− bIµC)+wSCpbIµC .
This is a linear function ofbI which obtains its minimum at 0 or1 ∧ λ/µC when the coefficient ofbI is
positive or negative, respectively. ✷
We now examine the case wherewN
wSC< rSµSC .
Proposition 7 If wN
rSµSC<wSC then
b∗I =
1∧ λ/µC if wCµC ≥wN(1/rI − 1/rS)+wSC(pµC +µSC), ID regime
0 if wC
wN< 1
rSµSC
(
p+ rSµSC
rIµC
)
, No critical careµSC
pµC+µSCotherwise, CD regime
(EC-11)
b∗S = (1− b∗I)∧ pb∗IµC/µSC andn∗ = b∗I/rI + b∗S/r∗S.

46
PROOF: BecausewN
wSC< rSµSC, by Lemma 1,bS = (1 − bI) ∧ pbIµC/µSC . We have two cases to
consider depending on the relationship between1− bI andpbIµC/µSC.
1. 1− bI ≤ pbIµC/µSC: Minimizing (EC-9) becomes:
minµSC
pµC+µSC≤bI≤1∧ λ
µC
{wN (bI/rI +(1− bI)/rS)+wC(λ− bIµC)+wSC(pbIµC − (1− bI)µSC)}
which is a linear function ofbI . Thus, on the interval[
µSC
pµC+µSC,1∧ λ
µC
]
the optimal value ofbI is
b∗I =
{
1∧ λµC
if wCµC ≥wN (1/rI − 1/rS)+wSC(pµC +µSC),µSC
pµC+µSCotherwise,
(EC-12)
where we note that µSC
pµC+µSC≤ λ
µCdue to Assumption 3.
2. 1− bI > pbIµC/µSC: There are no bumping costs in this case. Minimizing (EC-9) becomes:
min0≤bI≤
µSCpµC+µSC
{wN(bI/rI + pbIµC/µSCrS)+wC(λ− bIµC)}.
Similar to case #1, on the interval[
0, µSC
pµC+µSC
]
the optimal value ofbI is
b∗I =
{
µSC
pµC+µSCif wC
wN< 1
rSµSC
(
p+ rSµSC
rIµC
)
,
0 otherwise.(EC-13)
To complete the proof, we need to see which is the optimal value of bI if both conditionswCµC ≥wN(1/rI − 1/rS) + wSC(pµC + µSC) and wC
wN< 1
rSµSC
(
p+ rSµSC
rIµC
)
are satisfied. In this case, the two
candidate values forb∗I are either1∧ λµC
or 0. But note that under the assumptions of the proposition,the two
inequalities hold if and only ifwCµC =wN(1/rI−1/rS)+wSC(pµC+µSC) =wN(1/rI+pµC/(µSCrS))
andwN/wSC = rSµSC, in which case both values ofb∗I are optimal. ✷
We make a few observations about the bed allocation solutions in this alternative formulation. First, we
note that, again, the optimal SDU size may be substantial or zero. Similar to before, whether or not the
hospital should have an SDU depends on the effective capacity of a single nurse in the SDU (rsµSC);
however, because nurses are no longer the bottleneck, the corresponding cost ratio is now between the cost
of that additional nurse,wN , andwSC instead of the cost of misplacing a critical patient,wC .
In allocating beds to the ICU and SDU, we see there is still an ID-like regime where all (or as much as
possible) of the critical patient demand is met, and a CD-like regime where a substantial number of beds
is allocated to the SDU and all of the Semi-critical demand ismet. The inclusion of nursing costs in the
optimization framework introduces a third regime where thestaffing costs are so high that it is optimal to
have no ICU and no SDU (Note that the parameterκ= p+ ν again plays a key role in this decision). While
some (typically small, rural) hospitals do not have an ICU, it is generally due to strategic reasons, rather
than because staffing costs are extraordinarily high.
EC-3. Supplemental Figure
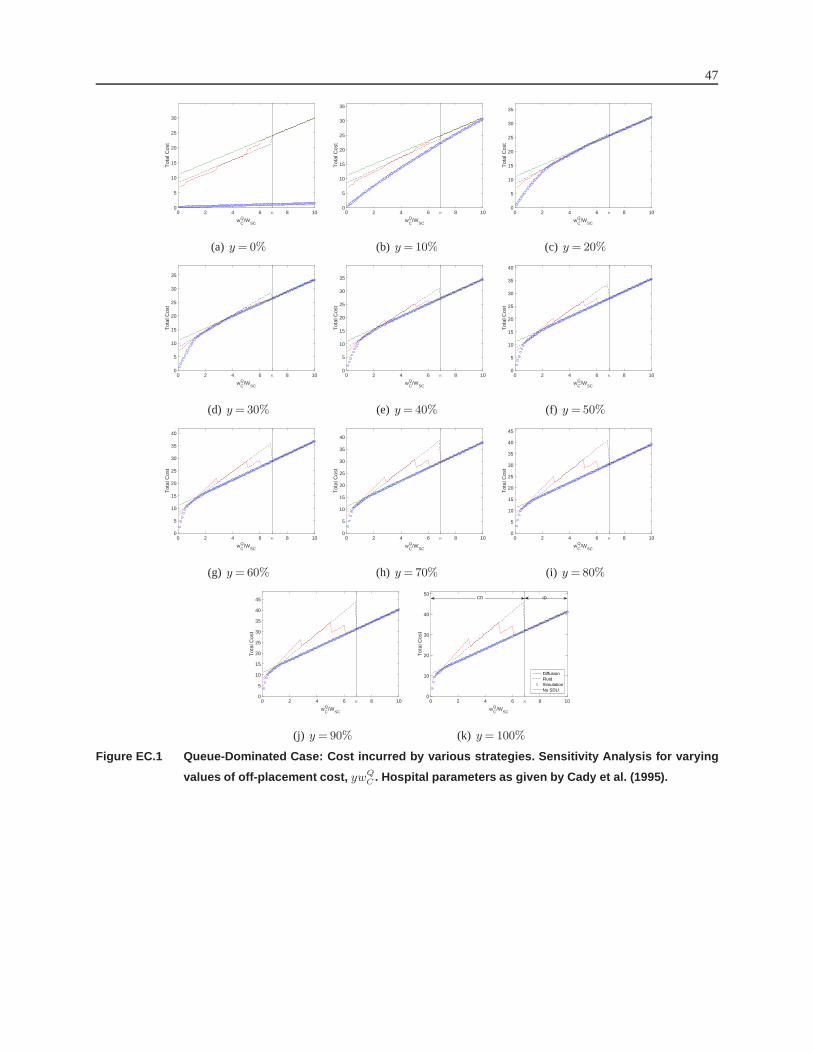
47
wCQ/W
SC
0 2 4 6 κ 8 10
Tot
al C
ost
0
5
10
15
20
25
30
(a) y= 0%
wCQ/W
SC
0 2 4 6 κ 8 10
Tot
al C
ost
0
5
10
15
20
25
30
35
(b) y =10%
wCQ/W
SC
0 2 4 6 κ 8 10
Tot
al C
ost
0
5
10
15
20
25
30
35
(c) y = 20%
wCQ/W
SC
0 2 4 6 κ 8 10
Tot
al C
ost
0
5
10
15
20
25
30
35
(d) y= 30%
wCQ/W
SC
0 2 4 6 κ 8 10
Tot
al C
ost
0
5
10
15
20
25
30
35
(e) y =40%
wCQ/W
SC
0 2 4 6 κ 8 10
Tot
al C
ost
0
5
10
15
20
25
30
35
40
(f) y =50%
wCQ/W
SC
0 2 4 6 κ 8 10
Tot
al C
ost
0
5
10
15
20
25
30
35
40
(g) y= 60%
wCQ/W
SC
0 2 4 6 κ 8 10
Tot
al C
ost
0
5
10
15
20
25
30
35
40
(h) y =70%
wCQ/W
SC
0 2 4 6 κ 8 10
Tot
al C
ost
0
5
10
15
20
25
30
35
40
45
(i) y =80%
wCQ/W
SC
0 2 4 6 κ 8 10
Tot
al C
ost
0
5
10
15
20
25
30
35
40
45
(j) y =90%
wCQ/W
SC
0 2 4 6 κ 8 10
Tot
al C
ost
0
10
20
30
40
50
DiffusionFluidSimulationNo SDU
IDCD
(k) y= 100%
Figure EC.1 Queue-Dominated Case: Cost incurred by various strategies. Sensitivity Analysis for varying
values of off-placement cost, ywQC . Hospital parameters as given by Cady et al. (1995).