criteria for broadening the sdr currency basket - imf · 1 this paper was prepared by messrs....
TRANSCRIPT
INTERNATIONAL MONETARY FUND
Criteria for Broadening the SDR Currency Basket
Prepared by the Finance and Strategy, Policy, and Review Departments
(In consultation with other departments)
Approved by Andrew Tweedie and Reza Moghadam
September 23, 2011
Contents Page
Executive Summary ...................................................................................................................3
I. Introduction ............................................................................................................................4
II. Background ...........................................................................................................................5 A. SDR Valuation Principles and Current Criteria ........................................................5
B. SDR and the International Monetary System ............................................................7
III. Freely Usable Currency .......................................................................................................8
A. Definition, Underlying Principles, and Past Application ..........................................8
B. Potential Indicators Going Forward ..........................................................................9
IV. A Possible New Tailored Criterion....................................................................................19
V. Comparison of Indicators and Scenario Analysis ...............................................................23
VI. Exports Criterion ...............................................................................................................24
VII. Number of Currencies ......................................................................................................28
VIII. Concluding Remarks and Issues for Discussion .............................................................30
Tables
1. International Debt Securities—Currency Composition, 2001–2011—Top 25 Currencies .17
2. Global Foreign Exchange Market Turnover—Currency Composition ...............................18
3. Global Foreign Exchange Derivatives Market Turnover—Currency Composition, 2010 ..21
4. Comparison of Possible Indicators for the Freely Usable Currency Criterion and the
Reserve Asset Criterion ...........................................................................................................23
5. Exports and Financial Inflows: Top-20 Exporters ...............................................................29

2
Figures
1. Composition of Foreign Exchange Reserves: 2001 and 2011 .............................................14
2. International Banking Liabilities—Currency Composition (2000-2011) ............................15
Boxes
1. Principles Guiding SDR Valuation Decisions .......................................................................6
2. Assessing Freely Usable Currencies ....................................................................................11
3. Currency Composition of Official Foreign Exchange Reserves (COFER) .........................13
4. Inertia in the International Use of Currencies ......................................................................16
5. Trends in the Use of Currencies: Scenario Analysis ...........................................................26
Appendixes
I. Scenario Analysis .................................................................................................................35
II. Data Issues...........................................................................................................................43
Appendix Tables
1. Countries Holding More than 5 percent of their Foreign Exchange Reserves in Each
Currency ...................................................................................................................................32
2. Average Daily Foreign Exchange Spreads between Spot Bid and Ask Quotations against
the US Dollar in New York .....................................................................................................33
3. Over-The-Counter (OTC) Derivatives: Currency Composition, 2001–10 ..........................34
I1. Illustrative Scenarios: Global Foreign Exchange Market Turnover (Methodology 1) ......37
I2. Illustrative Scenarios: Derivative Transactions (Methodology 1) ......................................38
I3. Illustrative Scenarios: International Debt Securities (Methodology 1) ..............................39
I4. Illustrative Scenarios: Global Foreign Exchange Market Turnover (Methodology 2) ......40
I5. Illustrative Scenarios: Derivative Transactions (Methodology 2) ......................................41
I6. Illustrative Scenarios: International Debt Securities (Methodology 2) ..............................42
3
Executive Summary
This paper discusses a number of reform options for the eligibility criteria for the SDR
currency basket. It responds to a request by the Executive Board, and to calls by the IMFC
and the G-20 Ministers for developing a criteria-based path to broaden the composition of the
basket. The paper is guided by long-standing principles underlying SDR valuation and by
considerations related to a stable evolution of the international monetary system.
The paper explores the pros and cons of maintaining the current “freely usable
currency” criterion, and clarifies indicators for assessing it. The freely usable concept
and its two key elements—currencies should be ―widely used‖ and ―widely traded‖—are set
out in the Articles and serve important operational purposes. A formal requirement for a
currency to be freely usable was adopted for SDR valuation only in 2000, although
considerations relating to this concept had been taken into account earlier. Indicators for
assessing freely usable currencies were first discussed in 1977, and are updated to reflect
subsequent developments in financial markets and data availability. The paper suggests as
indicators for ―wide use‖ the currency composition of foreign exchange reserves,
international debt securities, and international bank liabilities; and for ―wide trading‖ it
proposes foreign exchange spot market turnover.
As an alternative to the freely usable criterion, the paper discusses a new criterion
tailored explicitly to the reserve asset characteristics of the SDR. This reserve asset
criterion would be based on three key characteristics: liquidity in foreign exchange markets;
hedgeability; and availability of appropriate interest rate instruments. Four indicators are
proposed to assess these characteristics: currency composition of foreign exchange reserves,
spot and derivatives market turnover, and an appropriate market-based interest rate
instrument.
Scenario analysis suggests that the possible new criterion, while safeguarding the
reserve characteristics of the SDR, may provide scope to broaden the SDR basket
within a shorter time frame. Reflecting to some extent inertia and network externalities that
influence the ―wide use‖ of currencies, meeting the possible new criterion, while challenging,
may be achievable for some currencies within a shorter time period.
Issues related to a size-related criterion, and to the number of basket currencies are
also examined. The paper concludes that, while it would be desirable in principle to augment
exports with financial flows, current data limitations suggest that it may be appropriate to
maintain exports as the size criterion at this stage. The paper also argues that there are merits
in not pre-judging the number of currencies in the SDR basket. The issue of whether a new
currency would replace or be added to existing SDR basket currencies could be assessed on a
case-by-case basis.

4
I. INTRODUCTION1
1. At their April 2011 meetings, the IMFC and the G-20 Ministers called for
further work on a criteria-based path to broaden the composition of the SDR basket.
This followed earlier Board endorsement of a work program on issues relating to SDR
valuation and the SDR interest rate basket.2 Directors have also noted that expanding the
SDR basket to major emerging market currencies under appropriate conditions, and based on
transparent criteria, could further expand the role of the SDR in the international monetary
system (IMS).3
2. Against this background, this paper reviews the eligibility criteria for the SDR
currency basket. Since the 2000 decision on SDR basket composition, the basket consists of
the four currencies that are: (i) issued by Fund members (or monetary unions that included
Fund members) which are the largest exporters, and (ii) have been determined by the Fund to
be ―freely usable‖ (FU). While exports have played a role since the adoption of the SDR
basket formula in 1974, the requirement for a currency to be freely usable—a concept that
lies at the core of the Fund‘s operations since the Second Amendment of the Articles in
1978—was added as a formal criterion only in 2000.
3. The paper discusses reform options for the eligibility criteria as well as
indicators to assess them. Building on the informal Board briefing in July and a note
prepared for the G-20 last month, it discusses the existing FU criterion and a potential new
alternative criterion—tailored to preserve the reserve asset status of the SDR and one that
could help promote a smooth evolution of the IMS. The paper also explores indicators that
could be considered to assess these two criteria. In addition, it reviews issues relating to the
current export criterion, which provides a size-based condition for SDR basket inclusion, and
to the number of currencies in the SDR basket. More operational issues, notably those related
to currency weights in the SDR basket and the SDR interest rate, will be covered in a
subsequent paper.
4. The paper is organized as follows. After providing background in Section II,
Section III discusses the concept of a freely usable currency and potential indicators to assess
this criterion. Section IV describes a possible alternative to the FU criterion for SDR basket
selection, and Section V compares the indicators under the freely usable criterion and the
possible new alternative criterion. Sections VI and VII discuss issues relating to the exports
1 This paper was prepared by Messrs. Kumar, De Broeck, Rossi, Kohler, Rodriguez, Perez, and Ms. Bacall (all
FIN) and Ms. Mateos y Lago, Ms. Maziad, and Mr. Wang (all SPR).
2 The Acting Chair’s Summing Up, Review of the Method of Valuation of the SDR (11/17/2010) http://www.imf.org/external/np/sec/pn/2010/pn10149.htm.
3 The Chairman’s Summing Up, Enhancing International Monetary Stability—A Role for the SDR? (2/04/2011) http://www.imf.org/external/np/sec/pn/2011/pn1122.htm.

5
criterion and the number of currencies in the SDR basket, respectively. Section VIII provides
concluding remarks and issues for discussion.
II. BACKGROUND
A. SDR Valuation Principles and Current Criteria
5. SDR valuation has been guided by several long-standing principles. These
principles aim to enhance the attractiveness of the SDR as a reserve asset (Box 1). Based on
these principles, regular 5-yearly reviews of the SDR basket have been conducted, covering
the currencies to be included in the SDR basket and the weights of those currencies. The
reviews have been based on criteria adopted by the Executive Board, which the Board has the
authority to modify.4
6. In practice, there has been a high degree of stability in the method of SDR
valuation. As the SDR valuation principles have remained broadly unchanged since the SDR
basket‘s inception, revisions in the valuation method have been linked to major changes in
the roles of currencies in the world economy. These included the current criteria for SDR
valuation, which were adopted in 2000 following the introduction of the euro. The 2000
decision, in turn, modified criteria that had been in place since 1980, when the SDR valuation
basket was streamlined from 16 to 5 currencies.5 The high degree of stability also reflects
concerns about the effect of changes in the SDR basket valuation framework and the SDR
basket composition on official users of SDR. In particular, SDR users have stressed to staff
that changes in the basket affect their risk exposure until portfolios or hedging activities can
be rebalanced to reflect a new basket.
4 Article XV, Section 2, provides: ―The method of valuation of the special drawing right shall be determined by
the Fund by a seventy percent majority of the total voting power, provided, however, that an eighty-five percent
majority of the total voting power shall be required for a change in the principle of valuation or a fundamental
change in the application of the principle in effect.‖
5 Decision No. 12281-(00/98) G/S October 11, 2000.

6
Box 1. Principles Guiding SDR Valuation Decisions
While not stated in any decision of the Fund, a number of broad principles have guided Board
decisions on the valuation of the SDR since the 1970s with the aim of enhancing the attractiveness of
the SDR as a reserve asset. According to these principles, the SDR‘s value should be stable in terms
of the major currencies, and the currencies included in the basket should be representative of those
used in international transactions.
In addition:
the relative weights of currencies included in the basket should reflect their relative importance in
the world’s trading and financial system;
the composition of the SDR currency basket should be stable and change only as a result of
significant developments from one review to the next; and
there should be continuity in the method of SDR valuation such that revisions in the method of
valuation occur only as a result of major changes in the roles of currencies in the world economy.
7. Reflecting the SDR valuation principles, the 2000 decision set out the following
criteria for SDR basket composition.
(i) Exports: Countries or monetary unions are ranked based on export data. This
―gateway‖ criterion has been in place since the adoption of the basket formula for
SDR valuation in 1974;
(ii) Freely usable currency: The 2000 decision added the requirement that
eligible currencies must be determined by the Fund to be freely usable (FU).
Considerations underlying decisions on the SDR basket even before 2000 had in
fact taken account of currency use and trading, and thus of aspects that are at the
heart of the FU criterion. The 2000 decision change brought formal recognition to
the notion that a country‘s share of world exports is not necessarily a reliable
indicator of the use of its currency in international transactions, with the FU
concept allowing for the consideration of several other indicators of the breadth
and depth of financial markets.
(iii) Number: the decision provides for a specific number of basket currencies (4).
7
B. SDR and the International Monetary System
8. In recent years, a new set of considerations for SDR basket selection relating to a
stable evolution of the international monetary system (IMS) has received attention.6
Interest in the SDR has been boosted by the global debate over reform of the IMS and the
SDR‘s role in it. While there continue to be divergences of views regarding the precise role
the SDR can play in the IMS, there is a broad consensus that the composition of the SDR
basket is an important parameter. Therefore, the adoption of clear rules regarding the
valuation of the SDR could contribute to a smooth evolution of the IMS.
9. Global economic developments suggest possible benefits of greater plurality in
the IMS, with possible implications for the SDR basket. The role of large emerging
market countries in the global economy has increased dramatically in recent years, reflected
most notably in their increasing trade integration and their large and growing contributions to
global growth. However, real economic developments have proceeded much faster than
developments in currency and financial markets. Although some emerging market currencies
show potential for becoming international currencies, their role in the IMS lags far behind
their real economic weight, partly reflecting inertia and network externalities, and partly also
insufficient supply of relevant assets.7 Nevertheless, growing interest in non-SDR currency
assets is evident in financial flows and trading volumes, and has been accompanied by
improvements in the quality and credibility of macroeconomic policy frameworks. The
composition of the SDR basket could take into account these developments, provided the
relevant currencies also possess the requisite characteristics that would preserve the role of
the SDR as a reserve asset. In some cases, this will require issuers of candidate currencies to
pursue further policy reforms that deepen their financial sectors and support the international
use of their currencies.
10. Setting a criteria–based path for broadening the composition of the SDR basket
could play a useful role in the smooth evolution of the IMS. It could provide the issuers of
candidate currencies with an incentive to accelerate the prerequisite policy reforms. It could
also facilitate acceptance and use of these currencies as reserve assets, with diversification
benefits for users. From there on, a dynamic conducive to further financial deepening and
6Bénassy-Quéré et al., Global Currencies for Tomorrow: A European Perspective (2011); Goldman Sachs
Global Economics (2010), ―Global Reserve Currencies and the SDR‖, Global Economics Paper No. 196; IMF,
(2011), Enhancing International Monetary Stability—A Role for the SDR?, IMF Policy Paper,
http://www.imf.org/external/np/pp/eng/2011/010711.pdf.
7 A recent note by the staff surveyed the evolving landscape of international currencies; examined the potential
for internationalizing a select number of emerging market (EM) currencies; and explored benefits/risks to
individual countries and the IMS more broadly—both from policy and operational perspectives– from having
additional international currencies. See ―Internalization of Emerging Market Currencies –A Balance between
Risks and Rewards‖ (10/19/2011) http://www.imf.org/external/pubs/ft/sdn/2011/sdn1117.pdf.
8
additional reforms that encourage a wider role of these currencies could emerge, which could
contribute to a smooth evolution of the IMS.
III. FREELY USABLE CURRENCY
11. This section reviews the concept of a freely usable currency and its role in SDR
basket valuation. It begins with a discussion of the FU concept, as set out under the Articles
of Agreement, and of the principles that have guided past assessments of FU. The section
also seeks to clarify the indicators that could be used to assess a freely usable currency,
taking into account developments in market structures and data availability since the late
1970s, when the Board last discussed these issues in-depth. Clarifying the FU indicators
would be an important step toward a criteria-based path to expand the SDR basket, if FU
were to be maintained as an SDR-basket entry criterion.
A. Definition, Underlying Principles, and Past Application
12. The concept of a freely usable currency is defined under the Fund’s Articles and
was established for the Fund’s operations. As set out in Article XXX (f), a freely usable
currency is a member‘s currency that the Fund determines (i) is, in fact, widely used to make
payments for international transactions, and (ii) is widely traded in the principal exchange
markets.8 The concept of freely usable currency, as noted, was not formally linked to the
SDR basket until the 2000 SDR valuation decision, although it was considered at the time as
a logical extension of previous decisions by the Executive Board.
13. Freely usable currency lies at the core of the Fund’s financial operations.
Developed in the context of the Second Amendment of the Articles, it was designed to ensure
that a member purchasing another member‘s currency from the Fund would be able to use it
to meet its balance of payments need. In this regard, the Second Amendment introduced the
obligation of members to exchange balances of their currencies sold by the Fund that were
not freely usable for a freely usable currency (Article V, Section 3(e) (i)).9
14. From an operational perspective, it is desirable that freely usable currencies be
close substitutes. A purchasing member receiving a freely usable currency should expect to
be able to use it, directly through members‘ reserves or indirectly via market exchange. If a
market exchange is required, it could be executed readily in broad and deep markets without
8 It should be noted that there are differences between the Fund‘s operational definition as set out in the
Articles, and the statistical definition of ―freely usable currency.‖ The latter is a currency that is liquid,
convertible, and used for settlement of international transactions (BPM6; paragraph 6.72, p.113). This paper
focuses on the Fund‘s operational definition.
9 For members that are determined to have a freely usable currency, there is no obligation under the Articles to
exchange their currency for the freely usable currency of another member. Such members are only under the
obligation ―to collaborate with the Fund and other members‖ to enable their currency to be exchanged for the
freely usable currencies of other members (see Article V, Section 3(e)(ii)).
9
adverse effects on the exchange rate so that no member is at a disadvantage by receiving one
freely usable currency rather than another. In practice, Fund borrowers in the recent period
have preferred to receive only two of the four existing freely usable currencies (the US dollar
and the euro) in most transactions.
15. The two characteristics of freely usable (FU) currencies, i.e., widely used and
widely traded, are interrelated. While these two characteristics encompass somewhat
different aspects of freely usable currencies‘ attributes, they share common fundamentals and
reflect the same basic objective that the Fund could use all currencies held in the General
Resources Account (GRA) in its operations, especially in transactions to address members‘
balance of payments needs, at the lowest possible cost.10 However, while a widely used
currency is likely to be also widely traded, the reverse may not be the case because of inertia
in currency use related, for example, to transaction costs of currency switching and to
network externalities.11
16. The currencies deemed to be “freely usable” are designated by the Board. There
is no Board-approved set of indicators for such an assessment, nor a formal limit on the
number of currencies that can be deemed freely usable. However, when the issue was last
discussed in depth in the late 1970s, the staff proposed, and the Executive Board based its
assessment on, a set of indicators that took into account data availability and the state of
development of international financial markets at that time (Box 2). While there has not been
a substantive stand-alone discussion since then, the issue was considered indirectly in the
context of the 2010 SDR Valuation Review which examined a range of indicators to assess
whether the RMB could meet the freely usable criterion.
B. Potential Indicators Going Forward
17. Staff has revisited the indicators used in the past for assessing whether a
currency could be determined by the Fund as freely usable. The considerations discussed
by the Board in 1977 still appear valid but need to be judged in terms of subsequent
improvements in data availability and developments in financial markets. In particular, there
continues to be merit in assessing the wide use of a currency for international transactions by
examining the degree to which trade and service payments as well as financial account
transactions are undertaken in the currency. With regard to currencies widely traded in the
principal exchange markets, importance would continue to be given to the ―reasonable
assurance” that the market for the currency in question has sufficient depth so that no
appreciable change in the exchange rate would occur when a member country transacts a
10
Report on Second Amendment, Part II, Chap. D, sec. 11. Commentary on Comprehensive Draft Amendment
of the Articles of Agreement (DAA/75/3, 3/15/75).
11 Examples of currencies that may be considered to be widely traded but are not widely used include the Swiss
franc, the Canadian dollar, and the Australian dollar.
10
sizable amount of the currency. Minimal transaction costs in a freely usable currency
transaction conducted in connection with a Fund operation would also be desirable.
18. Since 1977, data availability has improved significantly, although there continue
to be important limitations. Staff in the 1977 review sought to measure the extent of
currency use broadly, encompassing current and capital/financial account ―transactions
undertaken in the currency.‖ However, data limitations narrowed the scope to the use of
exports of goods and services and official reserve holdings. Exports remain an unreliable
measure of currency use and data on currency invoicing are still not available on a systematic
basis; there are also some significant shortcomings in measuring the currency composition of
total external assets. However, additional measures of currency use by the private sector are
now available from the BIS. To assess widely traded, staff relied in 1977 on foreign
exchange turnover and bid-ask spreads, and on the existence of regular market quotations.
Below, staff proposes using similar indicators, but data coverage in terms of markets and
currencies has improved very substantially allowing for a more comprehensive reflection of
market depth and transaction costs. The proposed indicators also reflect discussions held by
staff with market participants, including FX traders and strategists, fund managers and
selected SDR users.12
19. Potential indicators of wide use going forward should seek to capture the relative
importance of a currency for international transactions. In light of the above
considerations on data availability, staff proposes use of the following indicators:
Currency composition of official reserve holdings (and, as a secondary indicator, the
number of countries holding a currency in reserves);
Currency denomination of international banking liabilities;
Currency denomination of international debt securities.
12
These market participants were generally supportive of the indicators, and made a number of suggestions that
are incorporated in the proposals.
11
Box 2. Assessing Freely Usable Currencies
In 1977, staff proposed the following indicators to determine which currencies are freely
usable:
the assessment of the use of a currency for international transactions should be based on
the extent to which trade in goods and services is paid for in that currency, as well as on
the relative volume of capital transactions denominated in that currency. Given the
limited data availability, however, the staff suggested to use the shares in members‘
exports of goods and services and the currency denomination of official reserve holdings
as the relevant indicators of the degree to which a currency was widely used in
international payments;
the assessment of whether a currency was widely traded in the principal foreign
exchange markets should be based on the volume of transactions, the existence of
forward markets, and the spread between buying and selling quotations for transactions
denominated in that currency. A sufficiently deep and broad foreign exchange market
was considered as being necessary to ensure that a member country would be able to sell
or buy a sizable amount of the currency at any time without occurrence of an appreciable
change in the exchange rate in the transaction.
Following discussion of the staff paper, the Executive Board determined, in 1978, that the
Deutsche mark, French franc, Japanese yen, pound sterling, and the U.S. dollar were freely
usable currencies. In 1998, the euro was added to the list of freely usable currencies and the
deutsche mark and French franc were removed from the list.
More recently, in the context of the 2010 SDR valuation review, the Chinese renminbi was
considered to not yet meet the criteria to be a freely usable currency.
20. The currency composition of official reserve holdings can provide a revealed
preference indicator of usability. It reflects reserve managers‘ preferences regarding
reserve asset currencies. As a secondary or supplementary indicator, consideration could be
given to the number of countries holding, say, more than 5 percent of their reserves in a
currency. This information, among others, was used in 1977 to determine the distribution and
magnitude of official reserve holdings and could provide a broader perspective of reserve
holdings by central banks.
21. While the currency composition of reserves is an important indicator of use, the
available data have limitations. The source of data for this indicator is the IMF‘s currency
―composition of foreign exchange reserves‖ (COFER) survey (Box 3), but there are at least
three limitations. First, an increasingly significant proportion of reserves is unallocated,
representing about 45 percent of total reserves by the end of the first quarter of 2011. A
related limitation is the definition of foreign exchange reserves reported for COFER
purposes, which is based on the sixth edition of the IMF‘s Balance of Payments and

12
International Investment Position Manual (BPM6; paragraph 6.72) and entails requirements
related to liquidity and convertibility of currencies designated as reserve assets. Thus, total
foreign currency holdings of monetary authorities could include currencies that are not tallied
in COFER but that members consider useful for meeting certain balance of payments needs.13
Second, the 5-currency breakdown (the four SDR currencies and the Swiss franc) currently
sought by COFER surveys limits the scope of currency assessment. Third, not all countries
are currently reporting to COFER. The IMF Executive Board recently indicated broad
support for renewed efforts to expand country participation and increase the currency
breakdown.
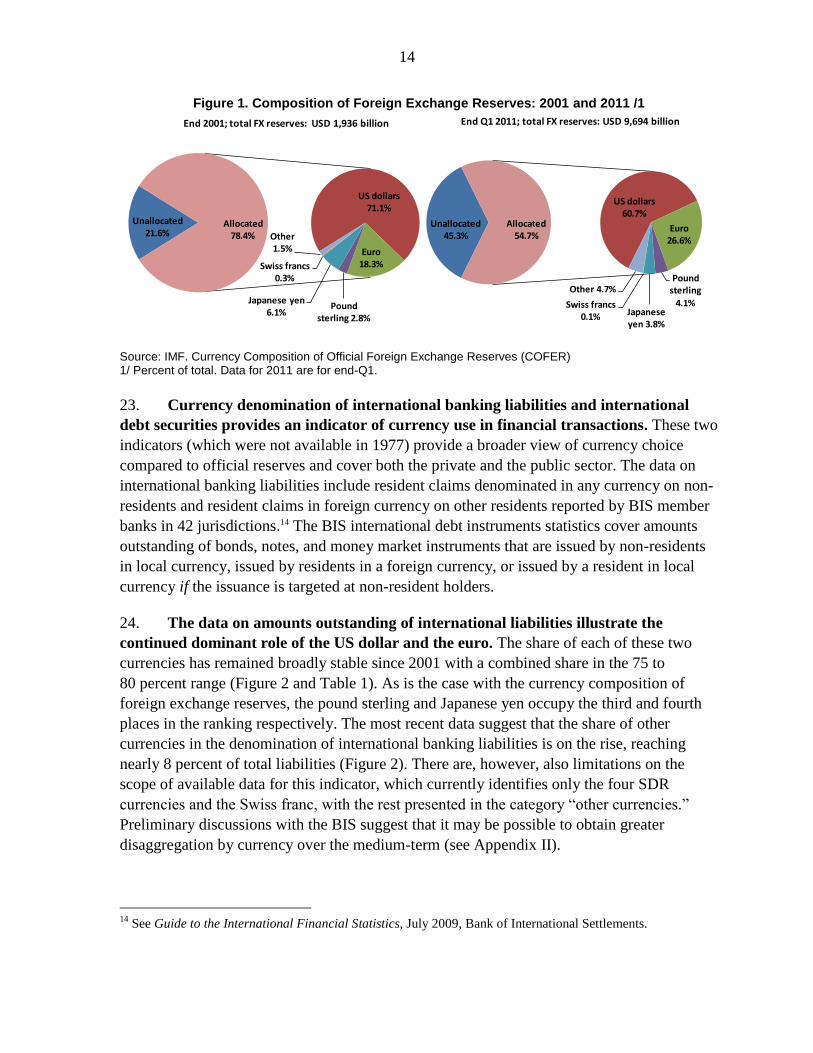
22. Available data on currency composition of reserves point towards a growing but
still limited diversification. The latest data suggest that at the end of 2011Q1, of the
reported currency composition of reserves, 60.7 percent was denominated in US dollars, and
26.6 percent in euro. The rest of the allocated reserves were held in pound sterling
(4.1 percent), Japanese yen (3.8 percent), Swiss franc (0.1 percent), and other currencies
(4.7 percent) (Figure 1). In recent years, the relative importance of ―other currencies‖ has
been rising (it accounted for 3.1 percent of the allocated reserves at end-2009). Concerning
the possible supplementary indicator (i.e., the number of countries holding a currency),
96 percent and 68 percent of Fund members held the US dollar and euro, respectively, as part
of their reserves at the end of 2011Q1. At the same time, 45 percent of reporting members
held at least 5 percent of their reserves in ―other‖ than the five identified currencies (see
Appendix Table 1).
13
Analysis based on International Financial Statistics data suggests that central banks‘ foreign assets that did
not qualify as official reserves (including FX swaps) averaged 3 percent of official foreign reserves over 2000
to 2007 (the extraordinary monetary measures adopted during the crisis introduce significant volatility in this
measure for 2008-2010).
13
Box 3. Currency Composition of Official Foreign Exchange Reserves (COFER)
COFER is an IMF database containing data on the currency composition of official foreign
exchange reserves. The currencies identified in the quarterly survey include: the U.S. dollar,
the euro, pound sterling, the Japanese yen, the Swiss franc, and all other currencies combined
as ―Claims in other currencies.‖ The definition of foreign exchange reserves utilized in COFER
is that outlined in the sixth edition of the IMF‘s Balance of Payments and International
Investment Position Manual (BPM6), and the same as that used for official foreign exchange
reserves data published in the IMF‘s International Financial Statistics (IFS): official reserves
consist of the monetary authorities‘ claims on nonresidents in the form of foreign banknotes,
bank deposits, treasury bills, short- and long-term government securities, and other claims that
are readily available and controlled by monetary authorities for meeting balance of payments
financing needs.
COFER data are reported to the IMF on a voluntary basis, with 138 member countries
reporting the currency composition of their reserves for the 2011 Q1 survey. COFER country
data are classified as strictly confidential, but aggregates for three country groupings are
published. These aggregations follow the classification of countries currently used in the IFS
world tables: world, advanced economies, and emerging and developing economies. Foreign
exchange reserves for countries not participating in COFER are taken from the IFS and
reflected in the aggregate ―Unallocated Reserves.‖
In the context of the valuation of the SDR basket, the current degree of COFER participation
and reporting present two difficulties and efforts have been initiated to address them. First,
there is an increasingly significant proportion of Unallocated Reserves, which by the end of the
first quarter of 2011 represented about 45 percent of total reserves. This is attributable to rapid
reserves accumulation over the past few years by countries that do not participate in COFER.
Second, the 5-currency breakdown currently sought by COFER surveys is viewed as somewhat
limited. The IMF Executive Board recently indicated broad support for renewed efforts to
expand country participation and increase the currency breakdown balanced against reporting
costs. In addition to these difficulties, monetary authorities are instructed by the survey to
report foreign currency reserves holdings consistent with the BPM6 statistical definition‘s
liquidity requirement, among others (see paragraph 6.72),1 excluding foreign currency holdings
that do not meet the liquidity requirements of reserves.
The IMF is working to address these shortcomings (i.e., the large and increasing importance of
Unallocated Reserves, and the limited currency break down) via a two-pronged Action Plan.
First, the IMF plans to re-engage key countries that do not furnish COFER data and seek their
participation in this voluntary exercise. Second, conscious of increasing the reporting burden
on participants, the IMF will consult with current COFER reporters on the possible expansion
of the currencies reported and seek their views on the increased reporting burden and possible
time frames. Based on the outcome of these consultations, a decision would be made with
respect to expanding the currency breakdown.
______________________
1 ―Furthermore to be liquid, reserve assets must be denominated and settled in convertible foreign
currencies…‖
14
Figure 1. Composition of Foreign Exchange Reserves: 2001 and 2011 /1
Source: IMF. Currency Composition of Official Foreign Exchange Reserves (COFER) 1/ Percent of total. Data for 2011 are for end-Q1.
23. Currency denomination of international banking liabilities and international
debt securities provides an indicator of currency use in financial transactions. These two
indicators (which were not available in 1977) provide a broader view of currency choice
compared to official reserves and cover both the private and the public sector. The data on
international banking liabilities include resident claims denominated in any currency on non-
residents and resident claims in foreign currency on other residents reported by BIS member
banks in 42 jurisdictions.14 The BIS international debt instruments statistics cover amounts
outstanding of bonds, notes, and money market instruments that are issued by non-residents
in local currency, issued by residents in a foreign currency, or issued by a resident in local
currency if the issuance is targeted at non-resident holders.
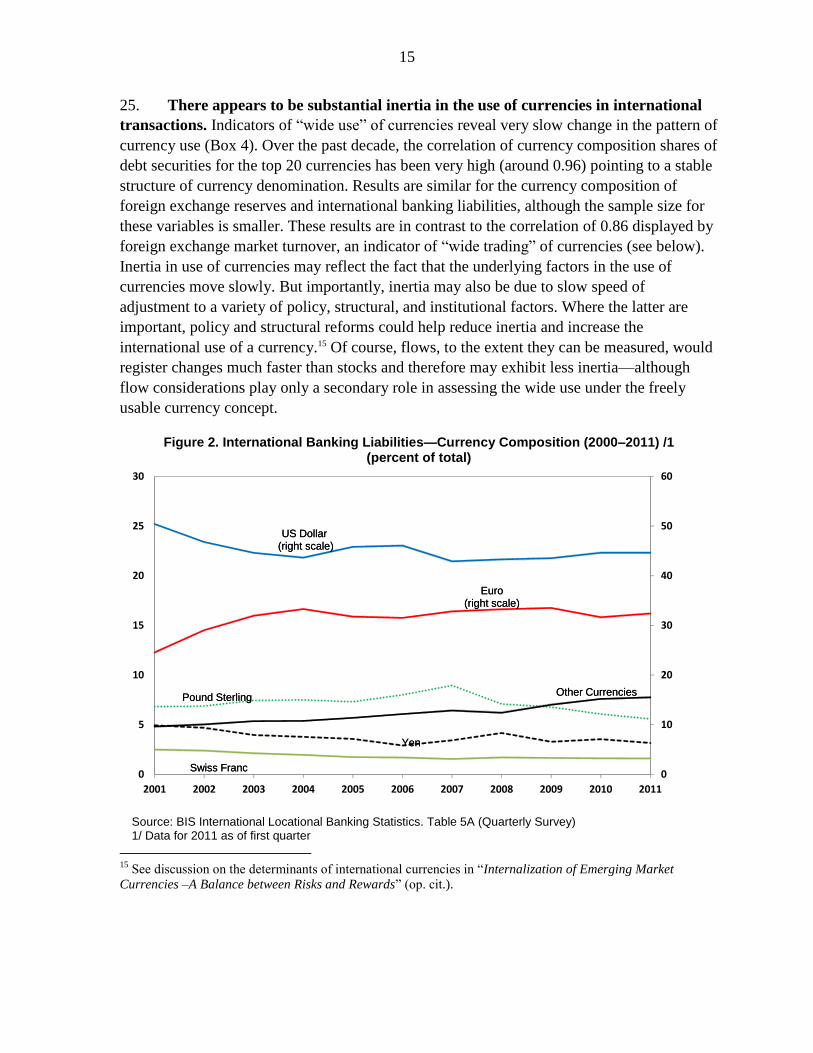
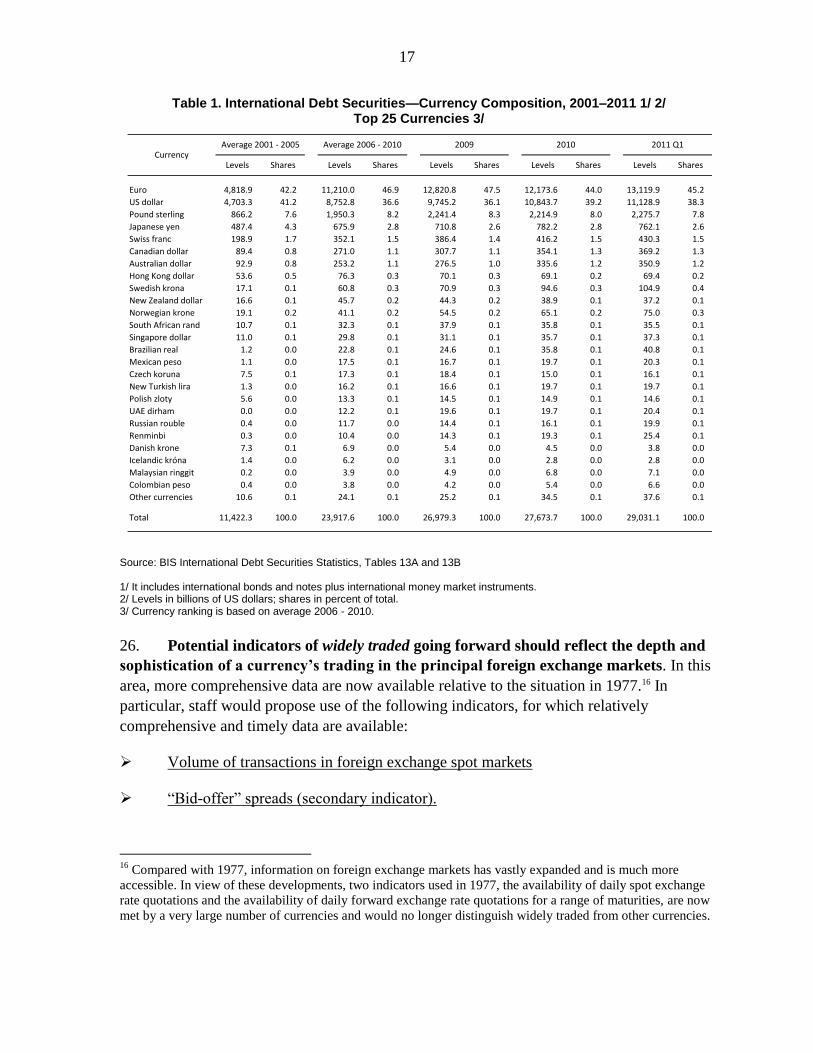
24. The data on amounts outstanding of international liabilities illustrate the
continued dominant role of the US dollar and the euro. The share of each of these two
currencies has remained broadly stable since 2001 with a combined share in the 75 to
80 percent range (Figure 2 and Table 1). As is the case with the currency composition of
foreign exchange reserves, the pound sterling and Japanese yen occupy the third and fourth
places in the ranking respectively. The most recent data suggest that the share of other
currencies in the denomination of international banking liabilities is on the rise, reaching
nearly 8 percent of total liabilities (Figure 2). There are, however, also limitations on the
scope of available data for this indicator, which currently identifies only the four SDR
currencies and the Swiss franc, with the rest presented in the category ―other currencies.‖
Preliminary discussions with the BIS suggest that it may be possible to obtain greater
disaggregation by currency over the medium-term (see Appendix II).
14
See Guide to the International Financial Statistics, July 2009, Bank of International Settlements.
Unallocated 21.6%
US dollars 71.1%
Euro18.3%
Pound sterling 2.8%
Japanese yen 6.1%
Swiss francs 0.3%
Other 1.5%
Allocated 78.4%
End 2001; total FX reserves: USD 1,936 billion
Unallocated 45.3%
US dollars 60.7%
Euro 26.6%
Pound sterling
4.1%Japanese yen 3.8%
Swiss francs 0.1%
Other 4.7%
Allocated 54.7%
End Q1 2011; total FX reserves: USD 9,694 billion
15
25. There appears to be substantial inertia in the use of currencies in international
transactions. Indicators of ―wide use‖ of currencies reveal very slow change in the pattern of
currency use (Box 4). Over the past decade, the correlation of currency composition shares of
debt securities for the top 20 currencies has been very high (around 0.96) pointing to a stable
structure of currency denomination. Results are similar for the currency composition of
foreign exchange reserves and international banking liabilities, although the sample size for
these variables is smaller. These results are in contrast to the correlation of 0.86 displayed by
foreign exchange market turnover, an indicator of ―wide trading‖ of currencies (see below).
Inertia in use of currencies may reflect the fact that the underlying factors in the use of
currencies move slowly. But importantly, inertia may also be due to slow speed of
adjustment to a variety of policy, structural, and institutional factors. Where the latter are
important, policy and structural reforms could help reduce inertia and increase the
international use of a currency.15 Of course, flows, to the extent they can be measured, would
register changes much faster than stocks and therefore may exhibit less inertia—although
flow considerations play only a secondary role in assessing the wide use under the freely
usable currency concept.
Figure 2. International Banking Liabilities—Currency Composition (2000–2011) /1 (percent of total)
Source: BIS International Locational Banking Statistics. Table 5A (Quarterly Survey) 1/ Data for 2011 as of first quarter
15
See discussion on the determinants of international currencies in ―Internalization of Emerging Market
Currencies –A Balance between Risks and Rewards‖ (op. cit.).
0
10
20
30
40
50
60
0
5
10
15
20
25
30
2001 2002 2003 2004 2005 2006 2007 2008 2009 2010 2011
US Dollar(right scale)
Euro (right scale)
Other CurrenciesPound Sterling
Swiss Franc
Yen
US Dollar(right scale)
Euro (right scale)
Other CurrenciesPound Sterling
Swiss Franc
Yen

16
Box 4. Inertia in the International Use of Currencies
Inertia in the use of currencies reflects demand, supply and institutional factors, as well as network externalities:
Demand for reserve currencies is driven by a variety of factors, including transactional, store of value,
and precautionary motives. Empirically, the volume of international transactions is closely associated
with the importance of the issuer country in the world economy, and the store of value depends on
policy credibility. While transactions could increase relatively quickly, policy credibility takes longer
to establish, leading to inertia. The precautionary demand for reserves tends to place a high premium
on the liquidity of a reserve asset in adverse economic circumstances, a consideration that can
contribute to network externalities and inertia (see below).
The supply of financial instruments denominated in reserve currencies, including liquidity and depth in
financial markets, tends to be relatively stable over time since it is broadly determined by saving
patterns as well as borrowing needs of reserve currency issuer countries.
A further source of inertia comes from network externalities reflecting market structure and
institutional organization, including regulatory aspects, which evolve slowly.1
Inertia in the wide use of currencies can be illustrated by examining changes over time in the share of currency
composition of the amount outstanding of international debt securities. As the Table below indicates, the
estimated correlation for the currency composition of debt securities is very high: between 2001 and 2004, it
was almost 0.98, and between 2001 and 2010 it was 0.96, suggesting a very stable structure of currency
denomination for debt securities over time. Results are similar for other possible indicators of wide use of
currencies (such as the currency composition of foreign exchange reserves and international banking liabilities),
although the sample size for these variables is smaller. (There is likely to be lower inertia on data on flows
although from a market depth perspective, stocks provide the best indication). On the other hand, more rapid
changes were observed for some indicators of ―wide trading.‖ In particular, the correlation displayed by foreign
exchange turnover declined to 0.86 for the period 2001-10, suggesting a smaller degree of inertia than for wide
currency use.
Correlation of Currency Composition Over Time
1/ Rank correlation: top 20 currencies in 2010. 2/ End-March each year; 3/April
________________________
1 See for instance, B. Eichengreen and D. Mathieson (2000) ―The Currency Composition of Foreign Exchange
Reserves: Retrospect and Prospect‖ IMF Working Paper. For a discussion on the effects of network externalities
see The Theory of Industrial Organization by J. Tirole (1988), Section 10.6. Network externalities are also
discussed in Information Rules, A Strategic Guide to the Network Economy by C. Shapiro and H. Varian
(1999), Chapter 7.
2004 0.981 0.962
2007 0.957 0.931
2010 0.957 0.862
International Debt
Securities 2/
Foreign Exchange
Turnover 3/
2001 vs
17
Table 1. International Debt Securities—Currency Composition, 2001–2011 1/ 2/ Top 25 Currencies 3/
Source: BIS International Debt Securities Statistics, Tables 13A and 13B 1/ It includes international bonds and notes plus international money market instruments. 2/ Levels in billions of US dollars; shares in percent of total. 3/ Currency ranking is based on average 2006 - 2010.
26. Potential indicators of widely traded going forward should reflect the depth and
sophistication of a currency’s trading in the principal foreign exchange markets. In this
area, more comprehensive data are now available relative to the situation in 1977.16 In
particular, staff would propose use of the following indicators, for which relatively
comprehensive and timely data are available:
Volume of transactions in foreign exchange spot markets
―Bid-offer‖ spreads (secondary indicator).
16
Compared with 1977, information on foreign exchange markets has vastly expanded and is much more
accessible. In view of these developments, two indicators used in 1977, the availability of daily spot exchange
rate quotations and the availability of daily forward exchange rate quotations for a range of maturities, are now
met by a very large number of currencies and would no longer distinguish widely traded from other currencies.
Euro 4,818.9 42.2 11,210.0 46.9 12,820.8 47.5 12,173.6 44.0 13,119.9 45.2
US dollar 4,703.3 41.2 8,752.8 36.6 9,745.2 36.1 10,843.7 39.2 11,128.9 38.3
Pound sterling 866.2 7.6 1,950.3 8.2 2,241.4 8.3 2,214.9 8.0 2,275.7 7.8
Japanese yen 487.4 4.3 675.9 2.8 710.8 2.6 782.2 2.8 762.1 2.6
Swiss franc 198.9 1.7 352.1 1.5 386.4 1.4 416.2 1.5 430.3 1.5
Canadian dollar 89.4 0.8 271.0 1.1 307.7 1.1 354.1 1.3 369.2 1.3
Australian dollar 92.9 0.8 253.2 1.1 276.5 1.0 335.6 1.2 350.9 1.2
Hong Kong dollar 53.6 0.5 76.3 0.3 70.1 0.3 69.1 0.2 69.4 0.2
Swedish krona 17.1 0.1 60.8 0.3 70.9 0.3 94.6 0.3 104.9 0.4
New Zealand dollar 16.6 0.1 45.7 0.2 44.3 0.2 38.9 0.1 37.2 0.1
Norwegian krone 19.1 0.2 41.1 0.2 54.5 0.2 65.1 0.2 75.0 0.3
South African rand 10.7 0.1 32.3 0.1 37.9 0.1 35.8 0.1 35.5 0.1
Singapore dollar 11.0 0.1 29.8 0.1 31.1 0.1 35.7 0.1 37.3 0.1
Brazilian real 1.2 0.0 22.8 0.1 24.6 0.1 35.8 0.1 40.8 0.1
Mexican peso 1.1 0.0 17.5 0.1 16.7 0.1 19.7 0.1 20.3 0.1
Czech koruna 7.5 0.1 17.3 0.1 18.4 0.1 15.0 0.1 16.1 0.1
New Turkish lira 1.3 0.0 16.2 0.1 16.6 0.1 19.7 0.1 19.7 0.1
Polish zloty 5.6 0.0 13.3 0.1 14.5 0.1 14.9 0.1 14.6 0.1
UAE dirham 0.0 0.0 12.2 0.1 19.6 0.1 19.7 0.1 20.4 0.1
Russian rouble 0.4 0.0 11.7 0.0 14.4 0.1 16.1 0.1 19.9 0.1
Renminbi 0.3 0.0 10.4 0.0 14.3 0.1 19.3 0.1 25.4 0.1
Danish krone 7.3 0.1 6.9 0.0 5.4 0.0 4.5 0.0 3.8 0.0
Icelandic króna 1.4 0.0 6.2 0.0 3.1 0.0 2.8 0.0 2.8 0.0
Malaysian ringgit 0.2 0.0 3.9 0.0 4.9 0.0 6.8 0.0 7.1 0.0
Colombian peso 0.4 0.0 3.8 0.0 4.2 0.0 5.4 0.0 6.6 0.0
Other currencies 10.6 0.1 24.1 0.1 25.2 0.1 34.5 0.1 37.6 0.1
Total 11,422.3 100.0 23,917.6 100.0 26,979.3 100.0 27,673.7 100.0 29,031.1 100.0
CurrencyLevels Shares Levels Shares Levels Shares
Average 2001 - 2005 Average 2006 - 2010 2011 Q12009
Levels Shares
2010
Levels Shares

18
27. The volume of spot foreign exchange transactions provides a comprehensive
measure of trading in this market. This measure was not available at the time of the FU
currency discussions in 1977, when partial data for selected US banks was used. Based on
the latest data, the US dollar and euro together account for around 60 percent of total foreign
exchange (FX) turnover, a broadly unchanged share since 2001 (Table 2). The combined
share of the Japanese yen and pound sterling also has been relatively stable, at around 15
percent. These data also illustrate the relative importance of the Swiss franc and of the
Australian and Canadian dollars. The turnover of key emerging market currencies remains
relatively small, although there has been a sharp increase in some cases, such as the Chinese
renminbi where the daily turnover has increased by around 65 percent a year since 2004.
Table 2. Global Foreign Exchange Market Turnover—Currency Composition 1/2/
Source: Bank of International Settlements, 2010 Triennial Central Bank Survey; Staff calculations.
1/ Levels in billions of US dollars; shares in percentage of average daily turnover in April of each year.
2/ Currency ranking based on average turnover for 2010.
US dollar 556.7 44.9 851.0 44.0 1,493.5 44.9 1,689.0 42.4
Euro 234.9 19.0 361.8 18.7 630.1 19.0 777.6 19.5
Japanese yen 145.8 11.8 201.4 10.4 391.1 11.8 377.7 9.5
Pound sterling 80.8 6.5 159.5 8.2 216.8 6.5 256.3 6.4
Australian dollar 26.8 2.2 58.2 3.0 71.9 2.2 150.9 3.8
Swiss franc 37.0 3.0 58.3 3.0 99.4 3.0 126.7 3.2
Canadian dollar 27.8 2.2 40.6 2.1 74.6 2.2 105.1 2.6
Hong Kong dollar 13.9 1.1 17.0 0.9 37.2 1.1 47.0 1.2
Swedish krona 15.5 1.2 21.2 1.1 41.5 1.2 43.6 1.1
New Zealand dollar 3.4 0.3 10.3 0.5 9.2 0.3 31.7 0.8
Korean won 5.0 0.4 11.0 0.6 13.4 0.4 30.1 0.8
Singapore dollar 6.5 0.5 8.8 0.5 17.5 0.5 28.2 0.7
Norwegian krone 9.0 0.7 13.3 0.7 24.2 0.7 26.3 0.7
Mexican peso 5.1 0.4 10.7 0.6 13.8 0.4 25.0 0.6
Indian rupee 1.4 0.1 3.1 0.2 3.8 0.1 18.9 0.5
Russian rouble 2.1 0.2 6.1 0.3 5.7 0.2 17.9 0.5
Chinese renminbi 0.0 0.0 0.9 0.0 0.1 0.0 17.1 0.4
Polish zloty 2.8 0.2 3.6 0.2 7.5 0.2 16.0 0.4
Turkish new lira 0.2 0.0 1.0 0.1 0.6 0.0 14.6 0.4
South African rand 5.8 0.5 7.0 0.4 15.7 0.5 14.4 0.4
Brazilian real 2.9 0.2 2.6 0.1 7.9 0.2 13.6 0.3
Danish krone 7.4 0.6 8.4 0.4 19.8 0.6 11.3 0.3
Hungarian forint 0.1 0.0 1.9 0.1 0.3 0.0 8.6 0.2
Malaysian ringgit 0.5 0.0 0.5 0.0 1.2 0.0 5.5 0.1
Thai baht 0.9 0.1 1.9 0.1 2.5 0.1 3.8 0.1
Other Currencies 46.4 3.7 73.7 3.8 136.9 3.7 124.0 3.1
All currencies 1,239 100 1,934 100 3,324 100 3,981 100
Currency2010
Levels Shares
2007
Levels Shares
2001
Levels Shares
2004
Levels Shares

19
28. The size of the bid-offer spreads reflects the transaction costs of a currency
purchase or sale, though these data need to be interpreted carefully. Data on bid-offer
spreads provide a direct measure of the cost of currency exchanges and are therefore relevant
to one of the goals underlying a freely usable currency concept, namely that currency
conversions can be conducted at minimal cost. This information can, therefore, usefully
complement that available on FX trading volumes. In general, spreads have narrowed over
time for most currencies and are relatively narrow for the current freely usable currencies
(see Appendix Table 2). However, the spread measure needs to be interpreted with
considerable caution to assess whether it accurately reflects the cost of large transactions,
taking into account any limits on access (including by non-residents), and the available
liquidity in the respective FX market.
29. Overall, judgment will continue to be needed in evaluating the status of
currencies in terms of the “freely usable” concept. The heterogeneity of the indicators and
data limitations preclude a mechanistic approach. Moreover, different indicators could imply
different rankings of currencies requiring the Board to form a view on the relative weight to
place on each indicator in the assessment. In addition, if a currency meets the freely usable
criterion as discussed above, it would be expected that an appropriate market-based interest
rate instrument exists that is broadly representative of the range of financial instruments that
are actually available to investors in a particular currency. This aspect, although not part of
the freely usable concept, has been emphasized in all the reviews of SDR valuation since
2000.17
IV. A POSSIBLE NEW TAILORED CRITERION
30. A possible new alternative criterion for the SDR basket selection would be
tailored explicitly to the reserve asset characteristics of the SDR. The new criterion,
which would replace the FU criterion, would seek to ensure the attractiveness of the SDR as
a reserve asset and its potential for a broader role in the international monetary system. To
this end, the ―reserve asset criterion‖ (RAC) discussed below reflects the critical elements of
a reserve asset, defined as a foreign currency-denominated external claim that is readily
available and liquid.18 It should be possible to buy and sell it at any time at minimal cost and
without unduly affecting its value, and adequate risk management options should be
available. Specific characteristics underpinning the RAC could include:
17
See Review of the Method of Valuation of the SDR (10/26/2010)
http://www.imf.org/external/np/pp/eng/2010/102610.pdf.
18 This definition is consistent with BPM6, item 6.64.
20
Liquidity in foreign exchange markets: this characteristic ensures that reserve
managers can buy or sell a large amount of the currency in which the asset is denominated at
any time at minimal transaction cost without causing exchange rates to move significantly.
Hedgeability: this is to ensure that exchange rate and interest rate risks associated
with the SDR and underlying currencies can be effectively and efficiently hedged, including
through availability of derivative instruments. In the absence of deliverable forwards or
options, it could be explored whether a sufficient degree of hedgeability could be provided
through other facilities, including possibly those offered by the central bank issuing the
currency.
Availability of appropriate high quality interest rate instrument: this is to ensure that
a domestic asset exists with a well-defined interest rate which reserve managers can access.
This attribute has been considered important by the staff and the Board since the inception of
the SDR basket to buttress the attractiveness of the SDR as a reserve asset. It informed the
1980 decision to reduce the size of the basket to five currencies, and has also received
attention in subsequent reviews.
31. Reflecting these considerations and discussions with market participants and
official SDR holders, the following four indicators could be considered:
Volume of transactions in foreign exchange spot markets;
Volume of transactions in foreign exchange derivatives markets and over the counter
derivatives trade;
Existence of an appropriate market-based interest rate instrument; and
Currency composition of official reserve holdings (and, as secondary indicator, the
number of countries holding a currency in reserves and where relevant broader measures of
foreign currency holdings).
32. The volume of transactions in foreign exchange spot markets provides a
measure of the liquidity and depth of those markets. This indicator is also used in the
evaluation of the ―widely traded‖ characteristic noted above, and the rationale is similar: to
be the currency of denomination of a reserve asset or to be widely traded, it should be readily
available for sale or purchase, at minimal transaction cost and without the transaction causing
prices to move significantly.
33. The volume of transactions in foreign exchange derivatives provides a possible
indicator of the ability to hedge in a particular currency. The main derivatives comprise
exchange traded and over-the-counter forwards, swaps and options, with over the counter
(OTC) accounting for the bulk of the transactions. This indicator would use BIS data on
turnover of foreign exchange market derivatives and amounts outstanding of OTC
21
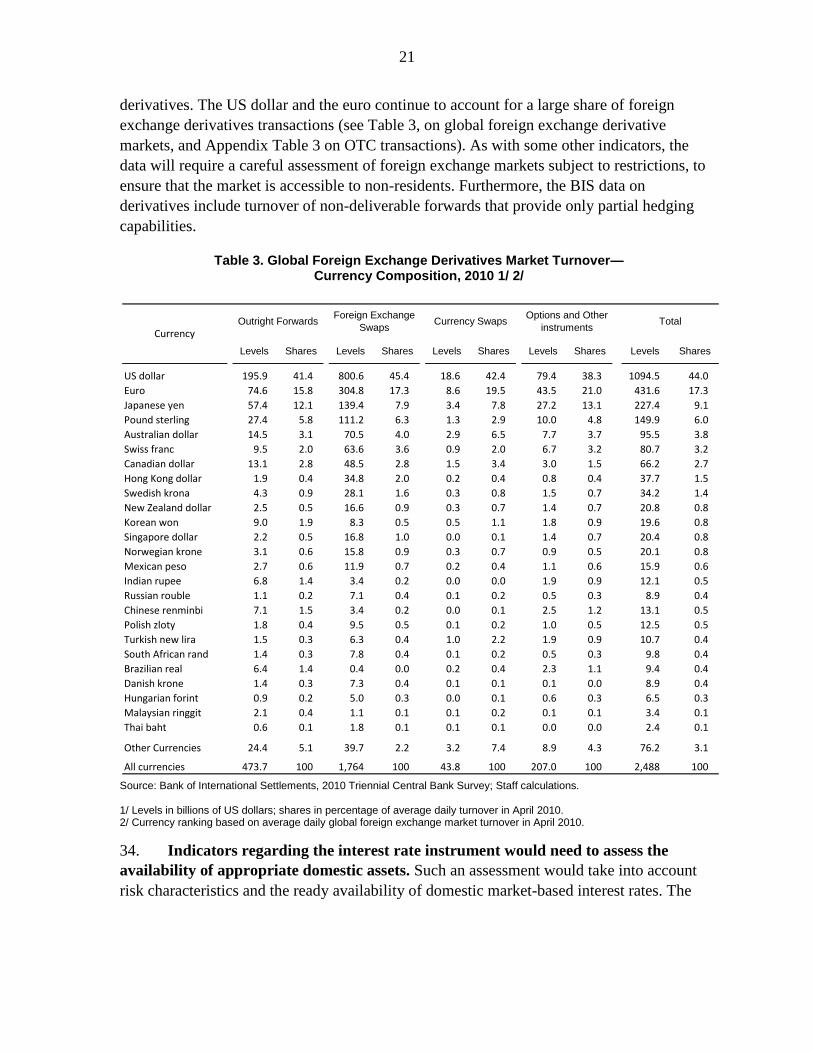
derivatives. The US dollar and the euro continue to account for a large share of foreign
exchange derivatives transactions (see Table 3, on global foreign exchange derivative
markets, and Appendix Table 3 on OTC transactions). As with some other indicators, the
data will require a careful assessment of foreign exchange markets subject to restrictions, to
ensure that the market is accessible to non-residents. Furthermore, the BIS data on
derivatives include turnover of non-deliverable forwards that provide only partial hedging
capabilities.
Table 3. Global Foreign Exchange Derivatives Market Turnover— Currency Composition, 2010 1/ 2/
Source: Bank of International Settlements, 2010 Triennial Central Bank Survey; Staff calculations. 1/ Levels in billions of US dollars; shares in percentage of average daily turnover in April 2010. 2/ Currency ranking based on average daily global foreign exchange market turnover in April 2010.
34. Indicators regarding the interest rate instrument would need to assess the
availability of appropriate domestic assets. Such an assessment would take into account
risk characteristics and the ready availability of domestic market-based interest rates. The
US dollar 195.9 41.4 800.6 45.4 18.6 42.4 79.4 38.3 1094.5 44.0
Euro 74.6 15.8 304.8 17.3 8.6 19.5 43.5 21.0 431.6 17.3
Japanese yen 57.4 12.1 139.4 7.9 3.4 7.8 27.2 13.1 227.4 9.1
Pound sterling 27.4 5.8 111.2 6.3 1.3 2.9 10.0 4.8 149.9 6.0
Australian dollar 14.5 3.1 70.5 4.0 2.9 6.5 7.7 3.7 95.5 3.8
Swiss franc 9.5 2.0 63.6 3.6 0.9 2.0 6.7 3.2 80.7 3.2
Canadian dollar 13.1 2.8 48.5 2.8 1.5 3.4 3.0 1.5 66.2 2.7
Hong Kong dollar 1.9 0.4 34.8 2.0 0.2 0.4 0.8 0.4 37.7 1.5
Swedish krona 4.3 0.9 28.1 1.6 0.3 0.8 1.5 0.7 34.2 1.4
New Zealand dollar 2.5 0.5 16.6 0.9 0.3 0.7 1.4 0.7 20.8 0.8
Korean won 9.0 1.9 8.3 0.5 0.5 1.1 1.8 0.9 19.6 0.8
Singapore dollar 2.2 0.5 16.8 1.0 0.0 0.1 1.4 0.7 20.4 0.8
Norwegian krone 3.1 0.6 15.8 0.9 0.3 0.7 0.9 0.5 20.1 0.8
Mexican peso 2.7 0.6 11.9 0.7 0.2 0.4 1.1 0.6 15.9 0.6
Indian rupee 6.8 1.4 3.4 0.2 0.0 0.0 1.9 0.9 12.1 0.5
Russian rouble 1.1 0.2 7.1 0.4 0.1 0.2 0.5 0.3 8.9 0.4
Chinese renminbi 7.1 1.5 3.4 0.2 0.0 0.1 2.5 1.2 13.1 0.5
Polish zloty 1.8 0.4 9.5 0.5 0.1 0.2 1.0 0.5 12.5 0.5
Turkish new lira 1.5 0.3 6.3 0.4 1.0 2.2 1.9 0.9 10.7 0.4
South African rand 1.4 0.3 7.8 0.4 0.1 0.2 0.5 0.3 9.8 0.4
Brazilian real 6.4 1.4 0.4 0.0 0.2 0.4 2.3 1.1 9.4 0.4
Danish krone 1.4 0.3 7.3 0.4 0.1 0.1 0.1 0.0 8.9 0.4
Hungarian forint 0.9 0.2 5.0 0.3 0.0 0.1 0.6 0.3 6.5 0.3
Malaysian ringgit 2.1 0.4 1.1 0.1 0.1 0.2 0.1 0.1 3.4 0.1
Thai baht 0.6 0.1 1.8 0.1 0.1 0.1 0.0 0.0 2.4 0.1
Other Currencies 24.4 5.1 39.7 2.2 3.2 7.4 8.9 4.3 76.2 3.1
All currencies 473.7 100 1,764 100 43.8 100 207.0 100 2,488 100
Total
Levels SharesLevels Shares Levels Shares Levels Shares Levels Shares
CurrencyOutright Forwards
Foreign Exchange
SwapsCurrency Swaps
Options and Other
instruments
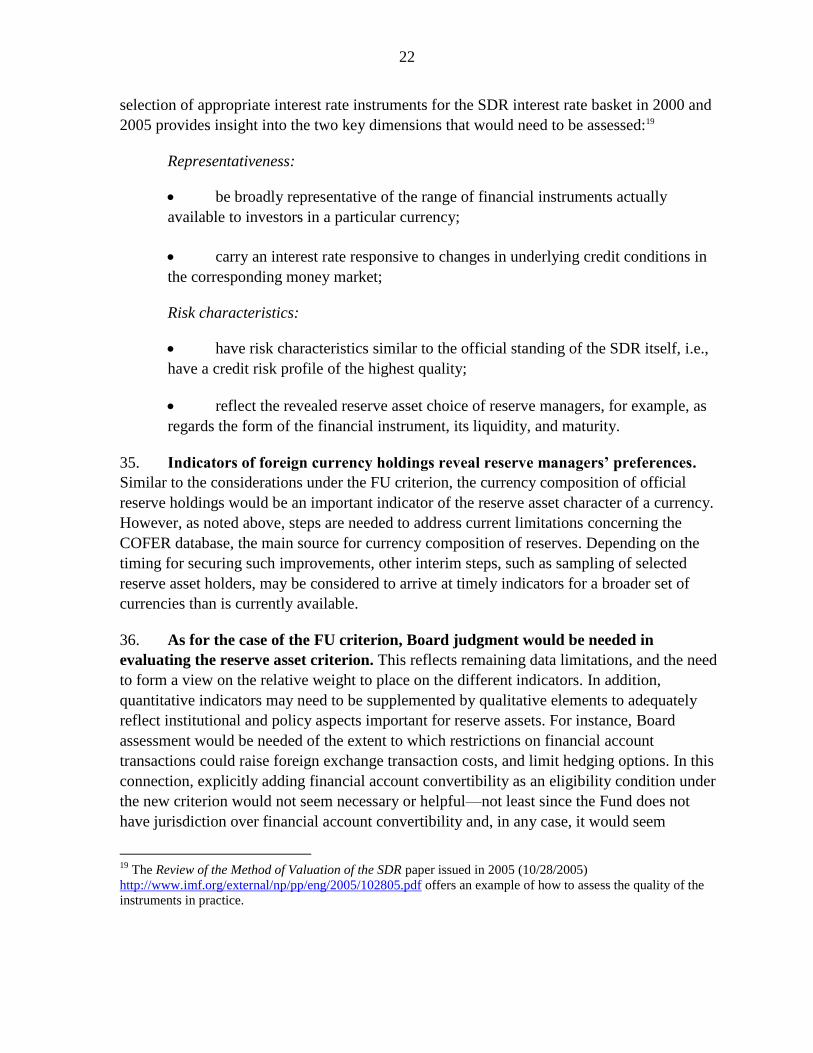
22
selection of appropriate interest rate instruments for the SDR interest rate basket in 2000 and
2005 provides insight into the two key dimensions that would need to be assessed:19
Representativeness:
be broadly representative of the range of financial instruments actually
available to investors in a particular currency;
carry an interest rate responsive to changes in underlying credit conditions in
the corresponding money market;
Risk characteristics:
have risk characteristics similar to the official standing of the SDR itself, i.e.,
have a credit risk profile of the highest quality;
reflect the revealed reserve asset choice of reserve managers, for example, as
regards the form of the financial instrument, its liquidity, and maturity.
35. Indicators of foreign currency holdings reveal reserve managers’ preferences.
Similar to the considerations under the FU criterion, the currency composition of official
reserve holdings would be an important indicator of the reserve asset character of a currency.
However, as noted above, steps are needed to address current limitations concerning the
COFER database, the main source for currency composition of reserves. Depending on the
timing for securing such improvements, other interim steps, such as sampling of selected
reserve asset holders, may be considered to arrive at timely indicators for a broader set of
currencies than is currently available.
36. As for the case of the FU criterion, Board judgment would be needed in
evaluating the reserve asset criterion. This reflects remaining data limitations, and the need
to form a view on the relative weight to place on the different indicators. In addition,
quantitative indicators may need to be supplemented by qualitative elements to adequately
reflect institutional and policy aspects important for reserve assets. For instance, Board
assessment would be needed of the extent to which restrictions on financial account
transactions could raise foreign exchange transaction costs, and limit hedging options. In this
connection, explicitly adding financial account convertibility as an eligibility condition under
the new criterion would not seem necessary or helpful—not least since the Fund does not
have jurisdiction over financial account convertibility and, in any case, it would seem
19
The Review of the Method of Valuation of the SDR paper issued in 2005 (10/28/2005)
http://www.imf.org/external/np/pp/eng/2005/102805.pdf offers an example of how to assess the quality of the
instruments in practice.

23
preferable to assess a currency‘s role through direct measures of market-based activity rather
than indirectly through indicators of formal or informal restrictions. Board judgment may
also be needed to assess whether the level of financial development is adequate, backed by
sound and credible macroeconomic policies, and a robust institutional framework, as well as
more recent developments regarding flows.20 A third issue that may require Board judgment
relates to the question whether the exchange rate regime could reduce the SDRs
diversification benefits, because of a peg or high correlation with existing currencies. At the
same time, however, it is worth noting that pegged currencies have been included in the SDR
basket in the past.
V. COMPARISON OF INDICATORS AND SCENARIO ANALYSIS
37. There are considerable overlaps, but also some differences between the
indicators proposed for the FU criterion and those for the possible new criterion (Table
4). The former focus on indicators for the criteria set out in the Articles, namely that a
currency is in fact widely used to make payments for international transactions and widely
traded in the principal foreign exchange markets. The latter focus on indicators most relevant
to the reserve asset characteristics of the SDR, including the availability of sufficiently liquid
and deep markets in the currency, the ability to hedge currency exposures, and the
availability of an appropriate domestic investment vehicle.
Table 4. Comparison of Possible Indicators for the Freely Usable Currency Criterion and the Reserve Asset Criterion
20
The need for sound and transparent policies and robust institutions was also underlined by market
participants.
FU Indicators
RAC Indicators
Widely Used 1. Currency composition of reserves (Possible supplementary indicator: number of countries holding a currency in reserves)
1. Currency composition of reserves (Possible supplementary indicators: (i) number of countries holding a currency in reserves; and (ii) other foreign currency holdings by monetary authorities)
2. Currency denomination of international banking liabilities
2. Volume of transactions in foreign exchange derivatives markets and over the counter derivatives trade
3. Currency denomination of international debt securities
3. Appropriate market based interest rate instrument
Widely Traded 4. Volume of transactions in foreign exchange spot markets (Supplementary Indicator: Bid - Offer spreads)
4. Volume of transactions in foreign exchange spot markets (Supplementary Indicator: Bid - Offer spreads)
24
38. Scenario analysis suggests that the possible new criterion may provide scope to
broaden the SDR basket within a shorter time frame. Past experience suggests that very
few currencies can be expected to attain the status of a freely usable currency in the
foreseeable future. Importantly, this reflects specific requirements needed for the Fund‘s
operational purposes, as set out under its Articles. In particular, the ―wide use‖ requirement
has been very difficult to attain for additional currencies, as discussed earlier. To illustrate
this distinction, scenario analysis was undertaken for selected currencies for three indicators:
global FX turnover in spot markets (FU indicator of widely traded, and one of the possible
RAC indicators), activity in derivatives market (possible RAC indicator) and currency
composition of international debt securities (FU indicator of widely used). The results
suggest that due in part to inertia, meeting the possible RAC criterion, while challenging,
may be achievable for some currencies within a shorter time period (see Box 5 and
Appendix I). Of course, it is recognized that the question of whether or not to replace the FU
criterion with a new reserve asset criterion rests principally on broader considerations than
the possible time period needed to expand the SDR basket.
VI. EXPORTS CRITERION
39. Export shares have played a central role in SDR basket selection since the
adoption of the basket formula for SDR valuation. The concept of export shares as a
criterion dates back to the 1973–74 Board discussions on the introduction of the first SDR
basket, and to the 1974 Board decision that the SDR basket should be composed of the
currencies of all Fund members with a share greater than 1 percent of total exports of goods
and services.21 The criterion was meant to capture a currency‘s role in global transactions,
using as a proxy shares in world exports of goods and services, and to avoid computational
complexities by excluding currencies which would have an insignificant impact on the
SDR‘s value.
40. The current role of the export criterion was formalized in 1980, and maintained
in 2000 when the FU criterion for SDR basket selection was added. The Board in 1980
decided that the SDR from 1981 onwards would include the currencies of the five member
countries with the largest exports of goods and services. This decision was part of a broader
SDR valuation basket revision, which included a major simplification of the basket‘s size
(from sixteen to five currencies) and a harmonization of the SDR valuation basket with the
SDR interest rate basket. The Board in 2000 retained the export criterion, but added the
requirement that a currency be deemed ―freely usable‖ as criterion for basket inclusion.22 The
21
Decision No. 4233-(74/67) S June 13, 1974, as amended by Decision No. 4261-(74/78) S July 1, 1974.
22 Decision No. 12281-(00/98) G/S October 11, 2000. This Decision also reduced the number of basket
currencies from five to four, reflecting the introduction of the euro.
25
continued key role of the export shares criterion demonstrated also a strong desire by the
Board (and official SDR users) to preserve continuity and stability in SDR basket selection.
41. Maintaining a size-related criterion for SDR basket selection appears
appropriate. The criterion would ensure that the issuers of basket currencies are those that
play a central role in the global economy, a prerequisite for the SDR to be attractive as global
reserve asset. Such criterion could also help ensure an adequate supply of the reserve asset,
and limit the number of currencies in the basket.
42. The question arises whether to maintain exports as the size-related criterion or
to replace it with a new criterion. There are a number of options for the ―gateway‖
criterion, including: continuing to use exports of goods and services; combining exports with
international financial inflows; and replacing exports by market GDP. As discussed below,
each of these options has a number of drawbacks, with the availability of high-quality data an
important consideration.
43. Continued use of export shares for the purposes of this selection criterion offers
several advantages, but has also limitations. Exports can be seen as a broad measure of
size and importance in the global economy. Maintaining the long-standing role of export
shares as a criterion would also offer continuity in the valuation framework, and provide
broad stability in the ranking of currencies.23, 24 However, exports are not a comprehensive
measure of a country‘s (or currency‘s) size in the global economy. By their nature, export
data cannot capture autonomous cross-border financial flows, i.e., flows that are not the
financial counterpart of cross-border trade transactions, and that are generally reckoned to
have increased significantly faster than exports over time.
23
There is a significant gap between the export shares of the five largest exporters and that of the sixth largest
exporter (Canada). Moreover, the differences between the export shares of the lower ranked exporters are
generally smaller than the 1 percent threshold to replace a currency in the basket stipulated in Decision No.
12281-(00/98) G/S October 11, 2000.
24 Import data are the mirror image of cross-border trade transactions reported on the export side. Unless import
data are a more reliable indicator of currency use in cross-border trade, which does not appear to be the case,
there is little to be gained from considering import shares as an alternative to or in combination with export
shares.
26
Box 5. Trends in the Use of Currencies: Scenario Analysis
The scenario analysis illustrates the possible evolution of the relative position of different
currencies over the medium term, based on assumptions regarding the continuation of
historical trends (see Appendix 1). Scenarios are undertaken for three indicators for which data
are available for a broad range of currencies: (i) global foreign exchange turnover (indicator
common to both FU and reserve asset criteria); (ii) activity in the derivatives markets (indicator
for the reserve asset criterion); and, (iii) outstanding amounts of international debt securities
(indicator for the FU criterion). Given the mechanistic nature of the exercise, the results should
be regarded as purely illustrative.
Two different methodologies are employed: the first projects the 2015 value of the indicator
using average growth rates over the 2004 –10 period; the second, applied to currencies of the
top ten exporters, illustrates the growth in each of these indicators required to reach a particular
share in terms of the projected global value of the indicator. For illustrative purposes, the
required level is determined by reference to the currency which is currently ranked fifth or
fourth (i.e., just outside the basket or just in the basket) in terms of the currency‘s share in the
respective indicator.
The results of the first methodology suggest potential for considerable change in the relative
ranking of currencies according to FX turnover and derivatives transactions. In particular,
several emerging market currencies would enter into the top range of the distribution if historic
growth rates in these indicators are maintained. On the other hand, changes in relative rankings
are considerably smaller when using the international debt securities indicator.
The results of the second methodology are illustrative of the potential growth rates required:
for foreign exchange turnover, if the target is provided by the fifth ranking currency,
simulations suggest that several of the currencies of the top-ten exporters currently not in the
basket would require rapid growth to meet this target in each of the three scenarios. For the
second scenario, for instance, annual growth would have to exceed 50 percent for the two
emerging market currencies considered. Although these are high growth rates, judging by
recent developments, and the capacity for ―catch-up growth‖, they are not outside the realm of
possibility. This expectation is supported by the ratio of foreign exchange turnover to a
country‘s own GDP, which are currently at low levels for emerging market currencies,
compared to the existing SDR currencies‘ ratios. With regard to derivative transactions, the
scenarios yield similar results in terms of the growth that is required in this indicator. In the
case of the international debt securities, however, the required growth is markedly higherand
with more variation across currencies: for the two emerging market currencies it would be
significantly greater (around 100 percent) compared to the other two indicators, while for
developed market currencies, it is appreciably smaller (less than 10 percent).
44. A second option would seek to take into account the increasingly important role
of global financial flows. Adding financial inflows to exports could enhance the
measurement of an economy‘s global financial importance. In addition to economic size with
respect to tradable goods, it could capture an economy‘s capacity to generate internationally

27
traded assets. These inflows could include foreign direct investment, portfolio inflows, and
other inflows, as measured in the balance of payments.25, 26
45. There are, however, a number of data shortcomings that severely limit cross-
country comparability of global financial inflows. First and foremost, reporting is
notoriously incomplete, with marked cross-country variations, and difficulties accounting for
valuation effects. In addition, there are difficult conceptual issues: (i) data do not allow
identification of the autonomous component of cross-border financial transactions, which
best captures capacity to generate internationally traded assets, and they are likely to double
count what is already measured by exports; (ii) data for financial centers reflect in significant
part transactions that, from an economic perspective, originate elsewhere; and (iii) financial
flows are very volatile, with considerable year-to-year variance also in the ranking of some
of the largest economies. Furthermore, unlike exports, financial inflows are recorded on a net
basis, and while the netting maybe appropriate for some balance of payments considerations,
it results in measured inflows that are significantly smaller than trade flows.
46. Overall, while the inclusion of financial inflows would be desirable in principle,
there is merit in revisiting the issue later after key data issues have been addressed.
While some of the conceptual issues may be dealt with relatively easily—for instance,
averaging of data could reduce volatility—others require deeper analysis, for example,
whether netting practices vary markedly across counties. More broadly, to address the data
quality, it would be desirable to explore initiatives that could help obtain the requisite
information. This would allow staff to take into account such inflows in an appropriate
manner. For the time being, however, it would seem prudent not to add available data on
financial inflows to those for exports as the size criterion.
47. GDP is an alternative widely-used size-related measure. GDP provides a simple
indicator of economic size, is readily available, and is not affected by some of the limitations
regarding financial inflows. However, it is not a particularly close proxy of an issuer‘s role in
the global trade and financial system, which is key for an international reserve asset. The use
of such a measure would thus move away from the international aspects that the SDR-related
size measure is meant to capture. On balance, it appears that little is to be gained from
replacing export shares by GDP.
48. Export shares and the combined shares of exports and financial inflows would
point to the same set of top five currencies for inclusion in the SDR basket (Table 5 lists
25
The inflows are measured here as the sum of the absolute values of the transactions in direct investment in the
reporting economy, portfolio liabilities flows and other investment liabilities flows.
26 Financial derivatives, which account for a sizable proportion of international financial transactions, would not
be included. It is not clear to what extent these derivatives signal capacity to generate a store of value, and the
BoP data on them are incomplete.
28
the top twenty currencies ranked by 2006-2010 average of exports of goods and services).
However, the relative position within the top five is affected: compared with the ranking
using export shares, adding financial inflow shares would move the United Kingdom from
fourth to third position, reflecting the country‘s role as an important international financial
centre. (Comparisons based on market GDP result also in a different ranking compared with
the export criterion, including among the top five issuers, where Japan moves to the third
place, followed by China and the United Kingdom). Compared with the 2001–05 period,
China‘s share among the top twenty currencies has increased using all measures, by an
average 3 percentage points under the export shares measure and when financial inflows are
combined with exports. Australia, Korea, India, Russia, and Singapore also are gaining share
in the most recent five-year period.
VII. NUMBER OF CURRENCIES
49. Under the 2000 decision, the SDR basket comprises the four currencies issued by
the largest exporters (or currency unions) and which are deemed freely usable. Thus, it
presumes that if a new currency were to enter the SDR basket, it would replace an existing
one rather than be added to the existing currency basket. In particular, the decision specifies
that a new currency meeting the requirements for inclusion would be added to the basket in
replacement of another currency only if at the time of determination its relevant exports
exceeded those of the currency to be replaced by more than 1 percent.
50. The move to a criteria-based path to broadening the basket suggests a need to
revisit the four currency rule. It is not clear a priori that there is an optimal number for the
size of the basket, though past decisions (reduction in the number of currencies from 16 to 5
in 1980 and from 5 to 4 in 1999) point to the desirability of keeping the SDR basket
relatively small to avoid adding undue costs and complexity for SDR users. The stability
principle is also relevant as a basket with a large number of currencies would tend to be less
stable over time (as the ranking of currencies will be more likely to change), and adding new
currencies with small weights may offer little benefit in terms of the overall stability of the
SDR.
51. Going forward, one possible approach would be to decide in advance that the
size of the basket should not be larger than, say, 5 or 6 currencies. A basket of this size
would remain relatively simple to replicate, limiting the complexity of hedging operations
and the costs for SDR users, and would likely capture the major global currencies. It would
also provide a clear ex-ante signal to SDR users on the number of currencies in the SDR
basket—although at the expense of a case-by-case assessment, which could take into account
changing circumstances.
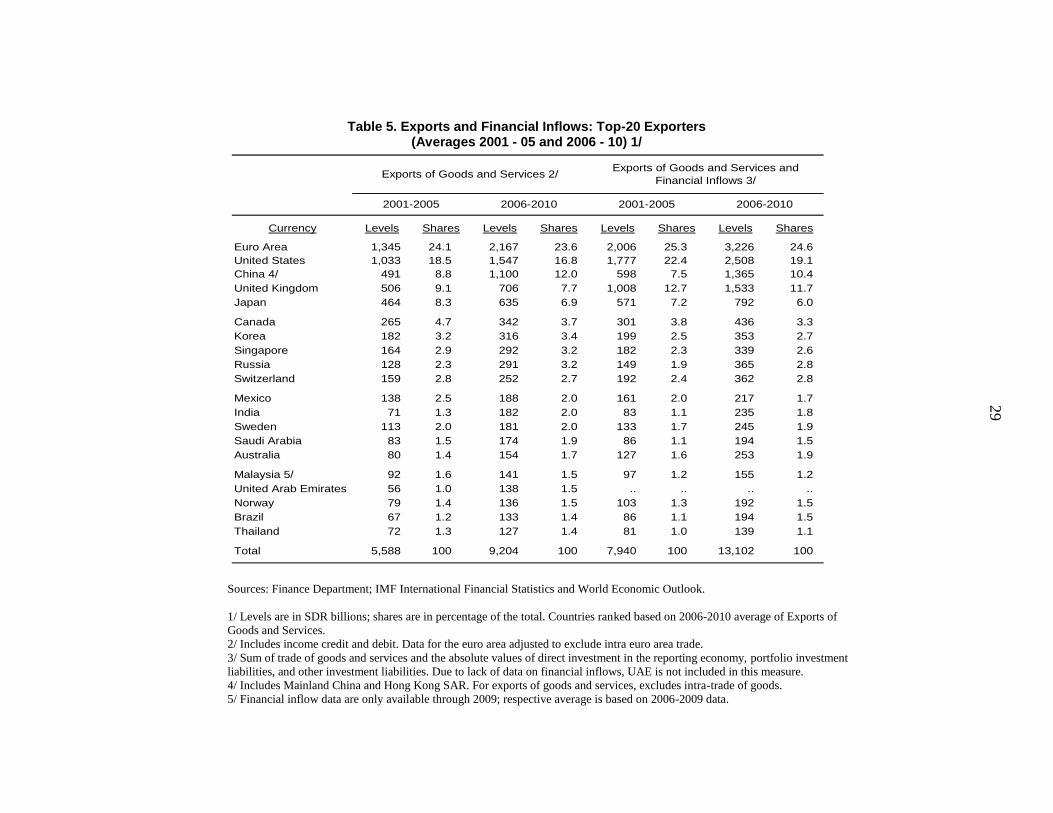
2
9
Table 5. Exports and Financial Inflows: Top-20 Exporters (Averages 2001 - 05 and 2006 - 10) 1/
Sources: Finance Department; IMF International Financial Statistics and World Economic Outlook.
1/ Levels are in SDR billions; shares are in percentage of the total. Countries ranked based on 2006-2010 average of Exports of
Goods and Services.
2/ Includes income credit and debit. Data for the euro area adjusted to exclude intra euro area trade.
3/ Sum of trade of goods and services and the absolute values of direct investment in the reporting economy, portfolio investment
liabilities, and other investment liabilities. Due to lack of data on financial inflows, UAE is not included in this measure.
4/ Includes Mainland China and Hong Kong SAR. For exports of goods and services, excludes intra-trade of goods.
5/ Financial inflow data are only available through 2009; respective average is based on 2006-2009 data.
Currency Levels Shares Levels Shares Levels Shares Levels Shares
Euro Area 1,345 24.1 2,167 23.6 2,006 25.3 3,226 24.6
United States 1,033 18.5 1,547 16.8 1,777 22.4 2,508 19.1
China 4/ 491 8.8 1,100 12.0 598 7.5 1,365 10.4
United Kingdom 506 9.1 706 7.7 1,008 12.7 1,533 11.7
Japan 464 8.3 635 6.9 571 7.2 792 6.0
Canada 265 4.7 342 3.7 301 3.8 436 3.3
Korea 182 3.2 316 3.4 199 2.5 353 2.7
Singapore 164 2.9 292 3.2 182 2.3 339 2.6
Russia 128 2.3 291 3.2 149 1.9 365 2.8
Switzerland 159 2.8 252 2.7 192 2.4 362 2.8
Mexico 138 2.5 188 2.0 161 2.0 217 1.7
India 71 1.3 182 2.0 83 1.1 235 1.8
Sweden 113 2.0 181 2.0 133 1.7 245 1.9
Saudi Arabia 83 1.5 174 1.9 86 1.1 194 1.5
Australia 80 1.4 154 1.7 127 1.6 253 1.9
Malaysia 5/ 92 1.6 141 1.5 97 1.2 155 1.2
United Arab Emirates 56 1.0 138 1.5 .. .. .. ..
Norway 79 1.4 136 1.5 103 1.3 192 1.5
Brazil 67 1.2 133 1.4 86 1.1 194 1.5
Thailand 72 1.3 127 1.4 81 1.0 139 1.1
Total 5,588 100 9,204 100 7,940 100 13,102 100
Exports of Goods and Services and
Financial Inflows 3/
2001-2005 2001-2005
Exports of Goods and Services 2/
2006-2010 2006-2010
30
52. An alternative approach would be not to prejudge the future size of the basket.
Rather, the issue of whether a new currency should be added to the basket or replace an
existing currency could be considered on a case-by-case basis in light of the circumstances at
the time. Among others, consideration could be given to a minimum weight threshold before
a currency is considered for inclusion in the basket.
53. On balance, staff sees merit in the second approach of not prejudging the future
size of the basket at this time. This would leave open the possibility of adjusting the
number of SDR basket currencies over time, depending on changing circumstances in the
IMS. At the same time, the broad principles of SDR valuation—namely stability of the
basket and representativeness of currencies used in international transactions—would
continue to guide ultimate Board views on the number of currencies in the SDR basket. As
noted above, these considerations would point to keeping the SDR basket relatively small,
not least to avoid adding undue costs and complexity for SDR users.
VIII. CONCLUDING REMARKS AND ISSUES FOR DISCUSSION
54. This paper responds to the request by the Executive Board to review several
aspects of SDR valuation and the call by the IMFC and G-20 for further work on a
criteria-based path to broaden the composition of the SDR basket. The paper explores
the issue of whether to maintain for SDR basket entry the current requirement that a currency
be freely usable or to replace it with a new criterion tailored to the desirable reserve asset
characteristics of the SDR; and the potential indicators that could be considered under both
approaches. The paper also discusses the other SDR basket criterion, i.e., the export criterion,
and the limit on the number of currencies in the SDR basket.
55. The paper reviews the FU criterion and clarifies the indicators that could be
used to assess it. The concept of a freely usable currency, set out in the Articles of
Agreement and central for the Fund‘s operations, was added as a formal SDR basket criterion
only in 2000. The paper discusses indicators that could be used to assess a freely usable
currency, taking into account developments in market structures and data availability since
the late 1970s, when the Board last discussed these issues in depth.
56. The paper also develops a possible alternative new tailored criterion for SDR
basket selection. The criterion would be tailored explicitly to the reserve asset characteristics
of the SDR, and the paper discusses the advantages and limitations of replacing the FU
criterion by such a reserve asset criterion. It also compares possible indicators for the reserve
asset criterion with those for a freely usable currency.
57. Scenario analysis suggests that the scope to broaden the SDR basket may vary
somewhat across the two options. Both options are expected to safeguard the reserve asset
characteristics of the SDR. However, given the important role of inertia in the international
use of currencies, meeting the possible RAC criterion, while challenging, may be achievable
for some currencies within a shorter time-period. Identifying indicators, such as those

31
informing the scenario analysis, is an important step toward a criteria-based path to broaden
the composition of the SDR basket. These clarifications could also contribute to a smooth
evolution of the IMS.
58. The paper also reviews issues related to the exports criterion and the number of
currencies. It suggests that, on balance, there are advantages to maintaining the exports
criterion to ensure representativeness of currencies and continuity in the selection criterion.
Concerning the number of currencies to be included in the SDR basket, there are merits of
not pre-judging the number of at this time.
59. Directors may want to focus their discussion on the following issues:
Do Directors agree that the broad principles that have guided SDR valuation in the
past still remain valid?
What are Directors‘ views regarding the two options of maintaining the existing
freely usable currency criterion or adopting a new alternative criterion along the lines
of the reserve asset criterion?
How do Directors view the indicators proposed for assessing the freely usable
currency criterion? Do they consider that these indicators capture the twin elements of
―wide use‖ and ―wide trading‖ adequately?
What are Directors‘ views on the merits of a possible new alternative criterion for the
SDR basket selection? Do they agree with the specific characteristics underpinning
such a reserve asset criterion? What are the Directors‘ views regarding the proposed
indicators for such a new criterion?
Do Directors agree that there continues to be a role for a size related criterion? In
light of ongoing weaknesses in financial accounts data, do Directors agree that the
existing exports criterion should be maintained for the time being? Do they agree that
the exports criterion should be augmented with data on financial inflows, once
ongoing weaknesses in financial accounts data have been satisfactorily addressed? Do
they agree that effort should be made towards addressing these data issues as
expeditiously as practical?
What are Directors views regarding the number of currencies in the basket? Do they
agree that it may be desirable not to pre-judge the future number at this time?

32
Appendix Table 1. Countries Holding More than 5 percent of their Foreign Exchange Reserves in Each Currency
Source: IMF. Currency Composition of Official Foreign Exchange Reserves (COFER)
Currency
U.S. dollars 114 97 120 95 120 94 118 94 120 96
Euro 86 73 90 71 90 71 87 70 85 68
Pound sterling 41 35 42 34 37 29 37 30 35 28
Japanese yen 19 16 17 14 16 13 20 16 21 17
Swiss francs 3 3 2 2 2 2 1 1 1 1
Other currencies 22 19 38 30 45 35 55 44 56 45
Memorandum
118 100 126 100 127 100 125 100 125 100
Average 2001 - 2005 Average 2006 - 2010 2009 2010 2011 Q1
Member
Countries
% of
Reporting
Countries
Member
Countries
% of
Reporting
Countries
Number of Countries Reporting Reserves
Member
Countries
% of
Reporting
Countries
Member
Countries
% of
Reporting
Countries
Member
Countries
% of
Reporting
Countries
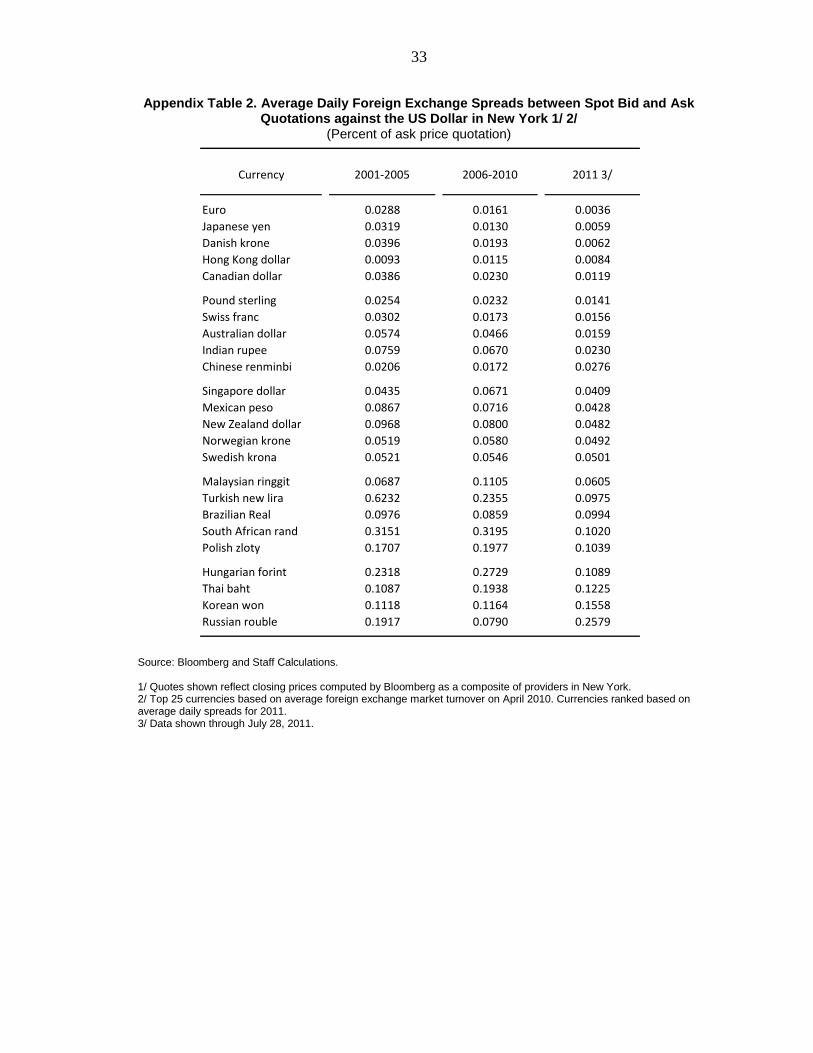
33
Appendix Table 2. Average Daily Foreign Exchange Spreads between Spot Bid and Ask Quotations against the US Dollar in New York 1/ 2/
(Percent of ask price quotation)
Source: Bloomberg and Staff Calculations. 1/ Quotes shown reflect closing prices computed by Bloomberg as a composite of providers in New York. 2/ Top 25 currencies based on average foreign exchange market turnover on April 2010. Currencies ranked based on average daily spreads for 2011. 3/ Data shown through July 28, 2011.
Euro 0.0288 0.0161 0.0036
Japanese yen 0.0319 0.0130 0.0059
Danish krone 0.0396 0.0193 0.0062
Hong Kong dollar 0.0093 0.0115 0.0084
Canadian dollar 0.0386 0.0230 0.0119
Pound sterling 0.0254 0.0232 0.0141
Swiss franc 0.0302 0.0173 0.0156
Australian dollar 0.0574 0.0466 0.0159
Indian rupee 0.0759 0.0670 0.0230
Chinese renminbi 0.0206 0.0172 0.0276
Singapore dollar 0.0435 0.0671 0.0409
Mexican peso 0.0867 0.0716 0.0428
New Zealand dollar 0.0968 0.0800 0.0482
Norwegian krone 0.0519 0.0580 0.0492
Swedish krona 0.0521 0.0546 0.0501
Malaysian ringgit 0.0687 0.1105 0.0605
Turkish new lira 0.6232 0.2355 0.0975
Brazilian Real 0.0976 0.0859 0.0994
South African rand 0.3151 0.3195 0.1020
Polish zloty 0.1707 0.1977 0.1039
Hungarian forint 0.2318 0.2729 0.1089
Thai baht 0.1087 0.1938 0.1225
Korean won 0.1118 0.1164 0.1558
Russian rouble 0.1917 0.0790 0.2579
Currency 2001-2005 2006-2010 2011 3/
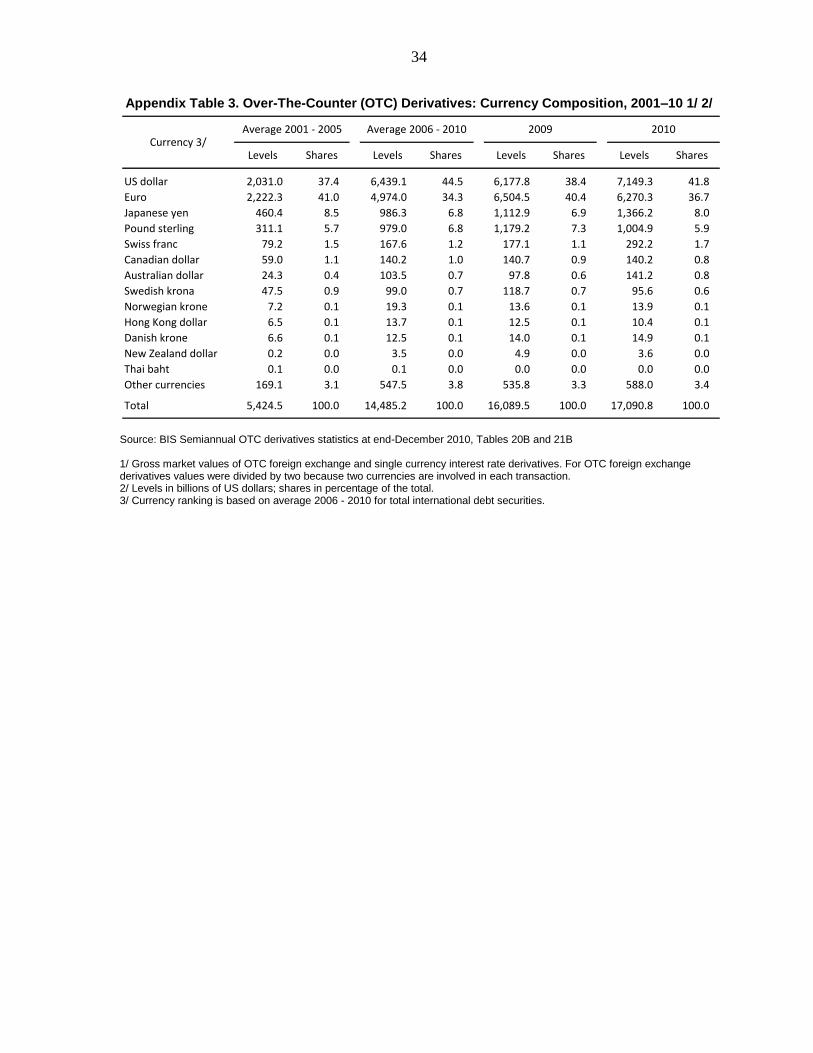
34
Appendix Table 3. Over-The-Counter (OTC) Derivatives: Currency Composition, 2001–10 1/ 2/
Source: BIS Semiannual OTC derivatives statistics at end-December 2010, Tables 20B and 21B 1/ Gross market values of OTC foreign exchange and single currency interest rate derivatives. For OTC foreign exchange derivatives values were divided by two because two currencies are involved in each transaction. 2/ Levels in billions of US dollars; shares in percentage of the total. 3/ Currency ranking is based on average 2006 - 2010 for total international debt securities.
US dollar 2,031.0 37.4 6,439.1 44.5 6,177.8 38.4 7,149.3 41.8
Euro 2,222.3 41.0 4,974.0 34.3 6,504.5 40.4 6,270.3 36.7
Japanese yen 460.4 8.5 986.3 6.8 1,112.9 6.9 1,366.2 8.0
Pound sterling 311.1 5.7 979.0 6.8 1,179.2 7.3 1,004.9 5.9
Swiss franc 79.2 1.5 167.6 1.2 177.1 1.1 292.2 1.7
Canadian dollar 59.0 1.1 140.2 1.0 140.7 0.9 140.2 0.8
Australian dollar 24.3 0.4 103.5 0.7 97.8 0.6 141.2 0.8
Swedish krona 47.5 0.9 99.0 0.7 118.7 0.7 95.6 0.6
Norwegian krone 7.2 0.1 19.3 0.1 13.6 0.1 13.9 0.1
Hong Kong dollar 6.5 0.1 13.7 0.1 12.5 0.1 10.4 0.1
Danish krone 6.6 0.1 12.5 0.1 14.0 0.1 14.9 0.1
New Zealand dollar 0.2 0.0 3.5 0.0 4.9 0.0 3.6 0.0
Thai baht 0.1 0.0 0.1 0.0 0.0 0.0 0.0 0.0
Other currencies 169.1 3.1 547.5 3.8 535.8 3.3 588.0 3.4
Total 5,424.5 100.0 14,485.2 100.0 16,089.5 100.0 17,090.8 100.0
Shares Levels SharesCurrency 3/
Average 2001 - 2005 Average 2006 - 2010 2009 2010
Levels Shares Levels Shares Levels

35
Appendix I: Scenario Analysis
1. This Appendix discusses illustrative scenarios for the medium-term evolution of
selected indicators in the freely usable currency and RAC criteria. The objective of the
scenarios is to illustrate the possible evolution of the relative positions of different currencies
over the medium-term, based on some simple assumptions using historical trends. Scenarios
are undertaken for the three indicators for which data are available for a broader range of
currencies than the existing SDR components: first, an indicator that is common to both FU
and RAC criteria: that is, global foreign exchange turnover; second, an indicator for the RAC
criterion: that is, activity in the derivatives markets; and third, an indicator for the freely
usable criterion: that is, cross-border issuance of debt securities. Given the mechanistic
nature of the exercise, the results should be regarded as purely illustrative.
2. In constructing the scenarios for each of the indicators, two different
methodologies are employed. According to the first methodology, the 2015 value of the
indicator is projected using average growth rates over the 2004–10 period. This measure
essentially shows the outcome if trends were to continue over the medium-term. The second
methodology, applied to the currencies of the top ten exporters, illustrates the growth in each
of these indicators required to reach a target value in terms of the projected global value of
the indicator.1 The required level can be determined by reference to the currency which is
currently just outside the basket (i.e., ranked fifth) or just in the basket (i.e., ranked fourth) in
the currency‘s share in the respective indicator.2 The methodology entails three steps:
i. The ratio of the global value of the indicator to global GDP is projected for
2015 (the ratio is assumed to be (i) the same as in 2010, (ii) higher than in
2010 or (iii) lower than in 2010—see Appendix Tables I4-I6);
ii. Given step (i) using WEO projections for GDP for 2015, the nominal value of
the indicator in 2015 is computed;
iii. For a given currency, the growth in the indicator required to reach a target
value by 2015 is computed.3
3. The results for the first methodology suggest potential for considerable change
in the relative ranking of currencies (Appendix Tables I1-I3). Consider, for instance,
foreign exchange turnover: predicating on historic growth rates in turnover, there is an
appreciable increase in the shares of currencies currently not in the basket. In particular, there
1 Using the currency of the top ten exporters does not prejudge the ―gateway‖ criteria for selecting currencies.
2 The choice between the fourth and fifth ranking can be instructive in terms of the required growth rate in the
respective indicator: a target based on the fourth ranking currency would of course require higher growth rates
than a fifth ranking currency.
3 All individual currency shares are held constant at 2010 levels, except for (i) the ―tested‖ currency, which
increases to the target value (equal to the fifth or fourth ranking currency), and (ii) the ‗tested‘ currency‘s share
gain displaces the SDR currencies‘ shares, proportionally to their current weight in the basket.

36
are likely to be several emerging market currencies in the top of the distribution for these
indicators. Similar results are obtained in the case of derivatives transactions and
international debt securities.
4. The results based on the second methodology vary according to the indicator
and the target that are selected (Appendix Tables I4–I6). In the case of the first indicator,
foreign exchange turnover, if the target is provided by the fifth ranking currency, the
simulations suggest that several of the currencies in the top-ten exporters currently not in the
basket would require very rapid growth to meet this target in each of the three scenarios. For
the 2nd
scenario, for instance, for the two emerging market currencies in the top-ten, annual
growth would have to exceed 50 percent (Appendix Table I4). If the target were provided by
the fourth currency, growth rates would be of course be even higher (around 70 percent
annually). Although these are high growth rates, judging by recent developments, and the
capacity for ―catch-up growth,‖ they are not outside the realm of possibility. This expectation
is also supported by the ratio of foreign exchange turnover to a country‘s own GDP, which
are currently at low levels for emerging market currencies, compared to the existing SDR
currencies‘ ratios.
5. Other indicators yield diverging results. With regard to the second indicator, the
scenarios yield similar results in terms of the growth in the derivatives transactions that is
required. In the case of the third indicator relating to debt securities, the required growth
varies markedly more across indicators and currencies: for the two emerging market
currencies it would be significantly greater (around 100 percent) compared to the other two
indicators, while for developed market currencies, it is appreciably smaller (less than
10 percent). To some extent, these results appear to support the notions of inertia and
network externalities in the use of currencies discussed in the note.
6. There are several other caveats associated with these results. As noted above, the
exercises are mechanistic and reflect the specific assumptions. These assumptions may in
turn not materialize to the extent that they are based on projecting backward looking growth
rates in the case of the first methodology, and the ratios of indicators relative to global GDP
in the second methodology. Also the second methodology does not take into account that the
―required level‖ to enter the basket may change over time. In addition, the scenarios cannot
account for second round effects such as changes in currency values, interest rates, and real
transactions that would likely follow a rapid shift in the use of international currencies.
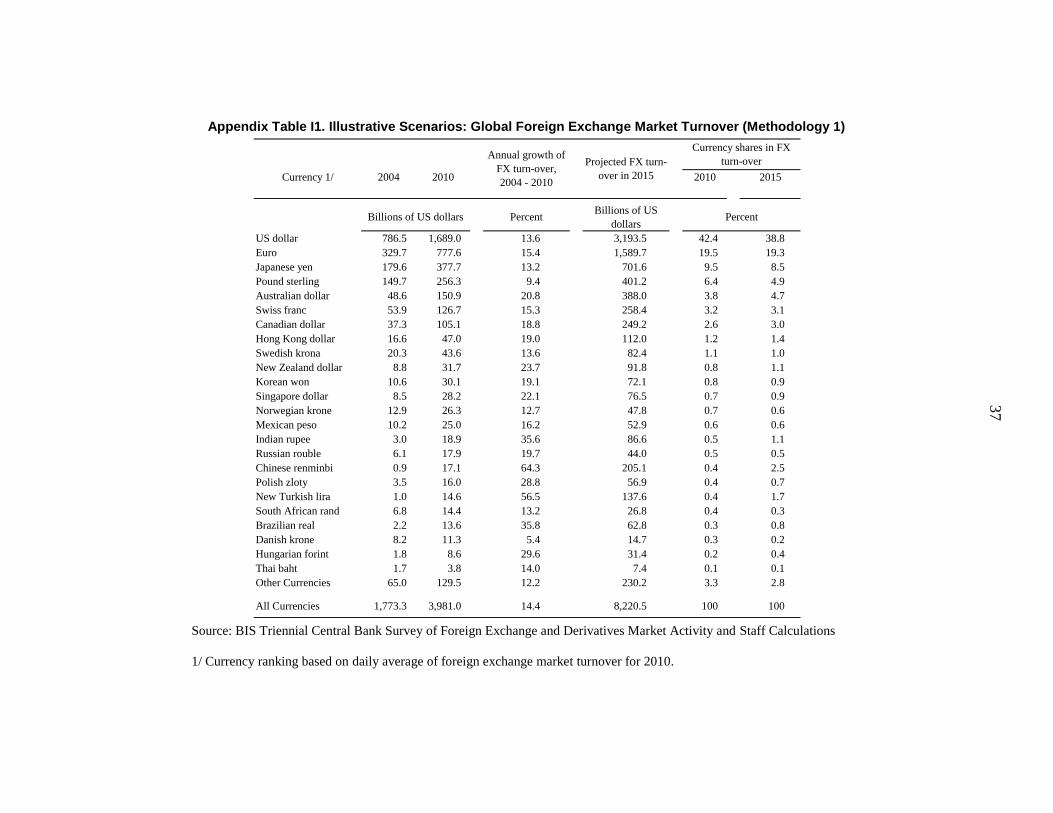
3
7
Appendix Table I1. Illustrative Scenarios: Global Foreign Exchange Market Turnover (Methodology 1)
Source: BIS Triennial Central Bank Survey of Foreign Exchange and Derivatives Market Activity and Staff Calculations
1/ Currency ranking based on daily average of foreign exchange market turnover for 2010.
Currency 1/ 2004 2010 2010 2015
US dollar 786.5 1,689.0 13.6 3,193.5 42.4 38.8
Euro 329.7 777.6 15.4 1,589.7 19.5 19.3
Japanese yen 179.6 377.7 13.2 701.6 9.5 8.5
Pound sterling 149.7 256.3 9.4 401.2 6.4 4.9
Australian dollar 48.6 150.9 20.8 388.0 3.8 4.7
Swiss franc 53.9 126.7 15.3 258.4 3.2 3.1
Canadian dollar 37.3 105.1 18.8 249.2 2.6 3.0
Hong Kong dollar 16.6 47.0 19.0 112.0 1.2 1.4
Swedish krona 20.3 43.6 13.6 82.4 1.1 1.0
New Zealand dollar 8.8 31.7 23.7 91.8 0.8 1.1
Korean won 10.6 30.1 19.1 72.1 0.8 0.9
Singapore dollar 8.5 28.2 22.1 76.5 0.7 0.9
Norwegian krone 12.9 26.3 12.7 47.8 0.7 0.6
Mexican peso 10.2 25.0 16.2 52.9 0.6 0.6
Indian rupee 3.0 18.9 35.6 86.6 0.5 1.1
Russian rouble 6.1 17.9 19.7 44.0 0.5 0.5
Chinese renminbi 0.9 17.1 64.3 205.1 0.4 2.5
Polish zloty 3.5 16.0 28.8 56.9 0.4 0.7
New Turkish lira 1.0 14.6 56.5 137.6 0.4 1.7
South African rand 6.8 14.4 13.2 26.8 0.4 0.3
Brazilian real 2.2 13.6 35.8 62.8 0.3 0.8
Danish krone 8.2 11.3 5.4 14.7 0.3 0.2
Hungarian forint 1.8 8.6 29.6 31.4 0.2 0.4
Thai baht 1.7 3.8 14.0 7.4 0.1 0.1
Other Currencies 65.0 129.5 12.2 230.2 3.3 2.8
All Currencies 1,773.3 3,981.0 14.4 8,220.5 100 100
Currency shares in FX
turn-over Annual growth of
FX turn-over,
2004 - 2010
Projected FX turn-
over in 2015
Billions of US
dollarsBillions of US dollars Percent Percent
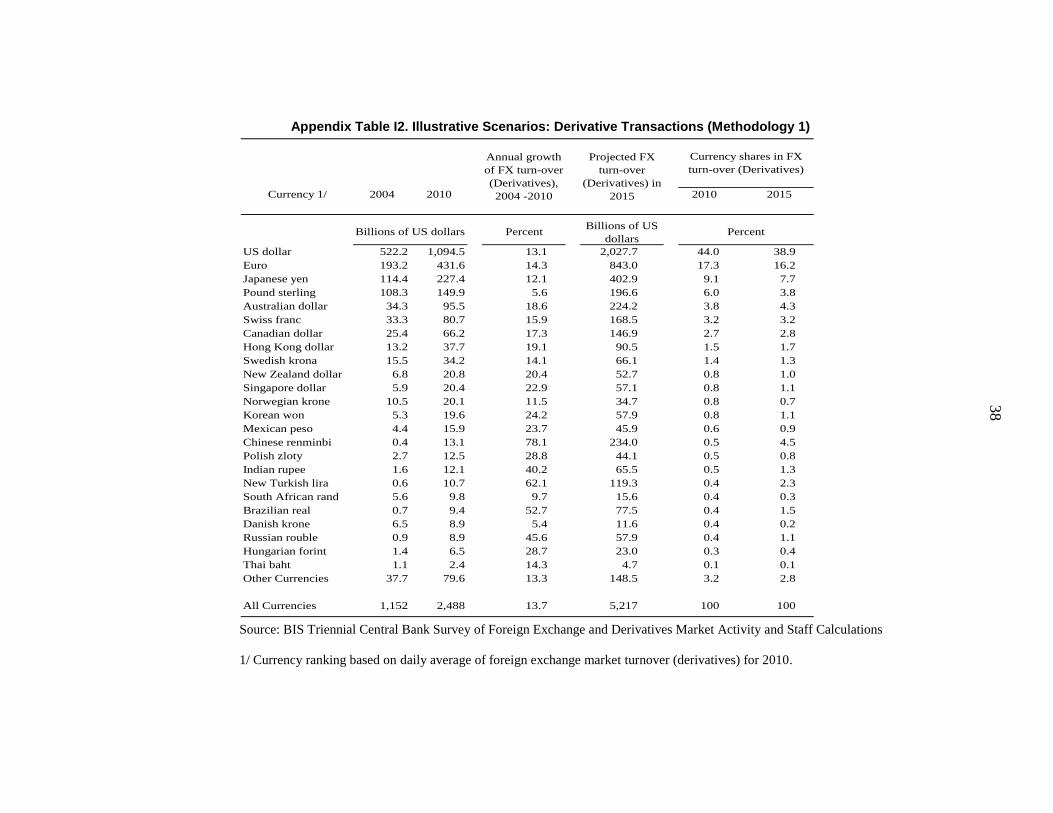
3
8
Appendix Table I2. Illustrative Scenarios: Derivative Transactions (Methodology 1)
Source: BIS Triennial Central Bank Survey of Foreign Exchange and Derivatives Market Activity and Staff Calculations
1/ Currency ranking based on daily average of foreign exchange market turnover (derivatives) for 2010.
Currency 1/ 2004 2010 2010 2015
US dollar 522.2 1,094.5 13.1 2,027.7 44.0 38.9
Euro 193.2 431.6 14.3 843.0 17.3 16.2
Japanese yen 114.4 227.4 12.1 402.9 9.1 7.7
Pound sterling 108.3 149.9 5.6 196.6 6.0 3.8
Australian dollar 34.3 95.5 18.6 224.2 3.8 4.3
Swiss franc 33.3 80.7 15.9 168.5 3.2 3.2
Canadian dollar 25.4 66.2 17.3 146.9 2.7 2.8
Hong Kong dollar 13.2 37.7 19.1 90.5 1.5 1.7
Swedish krona 15.5 34.2 14.1 66.1 1.4 1.3
New Zealand dollar 6.8 20.8 20.4 52.7 0.8 1.0
Singapore dollar 5.9 20.4 22.9 57.1 0.8 1.1
Norwegian krone 10.5 20.1 11.5 34.7 0.8 0.7
Korean won 5.3 19.6 24.2 57.9 0.8 1.1
Mexican peso 4.4 15.9 23.7 45.9 0.6 0.9
Chinese renminbi 0.4 13.1 78.1 234.0 0.5 4.5
Polish zloty 2.7 12.5 28.8 44.1 0.5 0.8
Indian rupee 1.6 12.1 40.2 65.5 0.5 1.3
New Turkish lira 0.6 10.7 62.1 119.3 0.4 2.3
South African rand 5.6 9.8 9.7 15.6 0.4 0.3
Brazilian real 0.7 9.4 52.7 77.5 0.4 1.5
Danish krone 6.5 8.9 5.4 11.6 0.4 0.2
Russian rouble 0.9 8.9 45.6 57.9 0.4 1.1
Hungarian forint 1.4 6.5 28.7 23.0 0.3 0.4
Thai baht 1.1 2.4 14.3 4.7 0.1 0.1
Other Currencies 37.7 79.6 13.3 148.5 3.2 2.8
All Currencies 1,152 2,488 13.7 5,217 100 100
Currency shares in FX
turn-over (Derivatives)
Annual growth
of FX turn-over
(Derivatives),
2004 -2010
Projected FX
turn-over
(Derivatives) in
2015
Billions of US
dollarsBillions of US dollars Percent Percent

3
9
Appendix Table I3. Illustrative Scenarios: International Debt Securities (Methodology 1)
Source: BIS and Staff Calculations
1/ Currency ranking based on international debt securities for 2010.
2/ For the Brazilian real, the Chinese renminbi, and the New Turkish lira data for 2004 represent data from 2005.
Currency 1/ 2/ 2004 2010 2010 2015
Euro 6,528.3 12,173.6 10.9 20,461.4 44.0 40.7
US dollar 5,095.3 10,843.7 13.4 20,347.9 39.2 40.5
Pound sterling 1,080.3 2,214.9 12.7 4,028.8 8.0 8.0
Japanese yen 541.8 782.2 6.3 1,062.2 2.8 2.1
Swiss franc 242.5 416.2 9.4 652.8 1.5 1.3
Canadian dollar 115.2 354.1 20.6 902.4 1.3 1.8
Australian dollar 129.5 335.6 17.2 741.9 1.2 1.5
Swedish krona 23.3 94.6 26.3 304.6 0.3 0.6
Hong Kong dollar 63.5 69.1 1.4 74.1 0.2 0.1
Norwegian krone 24.9 65.1 17.4 145.2 0.2 0.3
New Zealand dollar 19.0 38.9 12.7 70.7 0.1 0.1
Brazilian real 5.8 35.8 35.6 164.1 0.1 0.3
South African rand 14.2 35.8 16.6 77.2 0.1 0.2
Singapore dollar 14.5 35.7 16.2 75.7 0.1 0.2
New Turkish lira 6.3 19.7 21.0 51.2 0.1 0.1
Mexican peso 0.7 19.7 74.3 316.2 0.1 0.6
Chinese renminbi 1.5 19.3 53.0 161.6 0.1 0.3
Russian rouble 0.3 16.1 94.2 443.9 0.1 0.9
Polish zloty 7.0 14.9 13.6 28.2 0.1 0.1
Danish krone 7.0 4.5 -7.2 3.1 0.0 0.0
Thai baht 1.7 4.0 15.7 8.2 0.0 0.0
Hungarian forint 5.3 2.2 -13.8 1.0 0.0 0.0
Korean won 0.6 1.9 19.6 4.6 0.0 0.0
Indian rupee 0.1 1.5 52.6 12.0 0.0 0.0
Other Currencies 18.1 48.6 17.9 110.5 0.2 0.2
All Currencies 13,934 27,674 12.1 50,250 100 100
Currency shares in
International Debt
Securities
Annual growth
of International
Debt
Securities,
2004 - 2010
Projected
International
Debt Securities
in 2015
Billions of US
dollarsBillions of US dollars Percent Percent

4
0
Appendix Table I4. Illustrative Scenarios: Global Foreign Exchange Market Turnover (Methodology 2)
Source: Staff Calculations
1/ It is assumed that the benchmark is reached by displacing SDR basket currencies only; all other currencies maintain the share of FX turnover observed in 2010. The
benchmark was defined as the fourth or fifth ranked currency's share in 2010. Scenario 1 assumes the 2004 - 2010 average annual change in the share of global FX
turnover to global GDP; scenario 2 assumes the share of global foreign exchange turnover to global GDP observed in 2010; Scenario 3 assumes twice the annual change
used in Scenario 1. Ratio of global foreign exchange turnover to global GDP in 2015 is 7.8 percent under Scenario 1; 6.3 percent under Scenario 2; and, 9.2 percent
under Scenario 3. Data on World GDP are from WEO.
2/ The results reported here are based on the fifth ranking currency. When the benchmark is the fourth currency, growth rates are correspondingly higher: for instance,
for Scenario 2, growth rates would be 82.6 percent and 81 percent for renminbi and rouble, respectively (compared to 64.3 and 62.8 percent as shown in the table).
3/ Fifth ranked currency.
Scenario 1 2/ Scenario 2 2/ Scenario 3 2/
Canadian dollar 19.1 14.3 23.2
Chinese renminbi 71.2 64.3 77.1
Korean won 52.9 46.7 58.2
Russian rouble 69.6 62.8 75.5
Singapore dollar 54.9 48.7 60.3
Swiss franc 14.7 10.1 18.7
2010
Canadian dollar 6.7 12.6 10.2 14.9
Chinese renminbi 0.3 2.5 2.0 3.0
Korean won 3.0 17.1 13.9 20.2
Russian rouble 1.2 8.6 7.0 10.2
Singapore dollar 12.7 82.5 67.2 97.8
Swiss franc 24.2 40.2 32.7 47.6
Memorandum
US dollar 11.5 15.2 12.3 18.0
Euro 6.4 8.7 7.1 10.3
Japanese yen 6.9 9.6 7.8 11.3
Pound sterling 11.4 13.6 11.1 16.1
Australian dollar 3/ 12.2 15.1 12.3 18.0
2015
Annual growth in FX Turnover required to reach
benchmark in 2015 1/
Currency
Percent
Projected volume of FX turn-over (percent of GDP of issuing country)
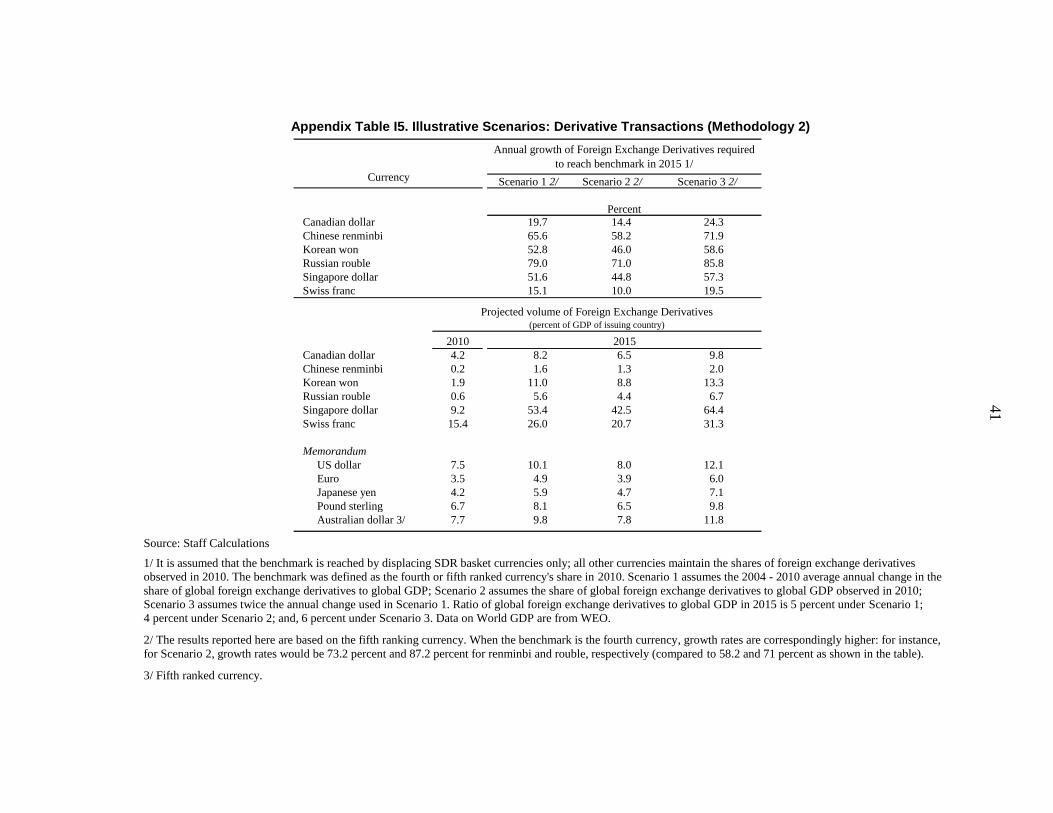
4
1
Appendix Table I5. Illustrative Scenarios: Derivative Transactions (Methodology 2)
Source: Staff Calculations
1/ It is assumed that the benchmark is reached by displacing SDR basket currencies only; all other currencies maintain the shares of foreign exchange derivatives
observed in 2010. The benchmark was defined as the fourth or fifth ranked currency's share in 2010. Scenario 1 assumes the 2004 - 2010 average annual change in the
share of global foreign exchange derivatives to global GDP; Scenario 2 assumes the share of global foreign exchange derivatives to global GDP observed in 2010;
Scenario 3 assumes twice the annual change used in Scenario 1. Ratio of global foreign exchange derivatives to global GDP in 2015 is 5 percent under Scenario 1;
4 percent under Scenario 2; and, 6 percent under Scenario 3. Data on World GDP are from WEO.
2/ The results reported here are based on the fifth ranking currency. When the benchmark is the fourth currency, growth rates are correspondingly higher: for instance,
for Scenario 2, growth rates would be 73.2 percent and 87.2 percent for renminbi and rouble, respectively (compared to 58.2 and 71 percent as shown in the table).
3/ Fifth ranked currency.
Scenario 1 2/ Scenario 2 2/ Scenario 3 2/
Canadian dollar 19.7 14.4 24.3
Chinese renminbi 65.6 58.2 71.9
Korean won 52.8 46.0 58.6
Russian rouble 79.0 71.0 85.8
Singapore dollar 51.6 44.8 57.3
Swiss franc 15.1 10.0 19.5
2010
Canadian dollar 4.2 8.2 6.5 9.8
Chinese renminbi 0.2 1.6 1.3 2.0
Korean won 1.9 11.0 8.8 13.3
Russian rouble 0.6 5.6 4.4 6.7
Singapore dollar 9.2 53.4 42.5 64.4
Swiss franc 15.4 26.0 20.7 31.3
Memorandum
US dollar 7.5 10.1 8.0 12.1
Euro 3.5 4.9 3.9 6.0
Japanese yen 4.2 5.9 4.7 7.1
Pound sterling 6.7 8.1 6.5 9.8
Australian dollar 3/ 7.7 9.8 7.8 11.8
2015
Annual growth of Foreign Exchange Derivatives required
to reach benchmark in 2015 1/
Currency
Percent
Projected volume of Foreign Exchange Derivatives(percent of GDP of issuing country)
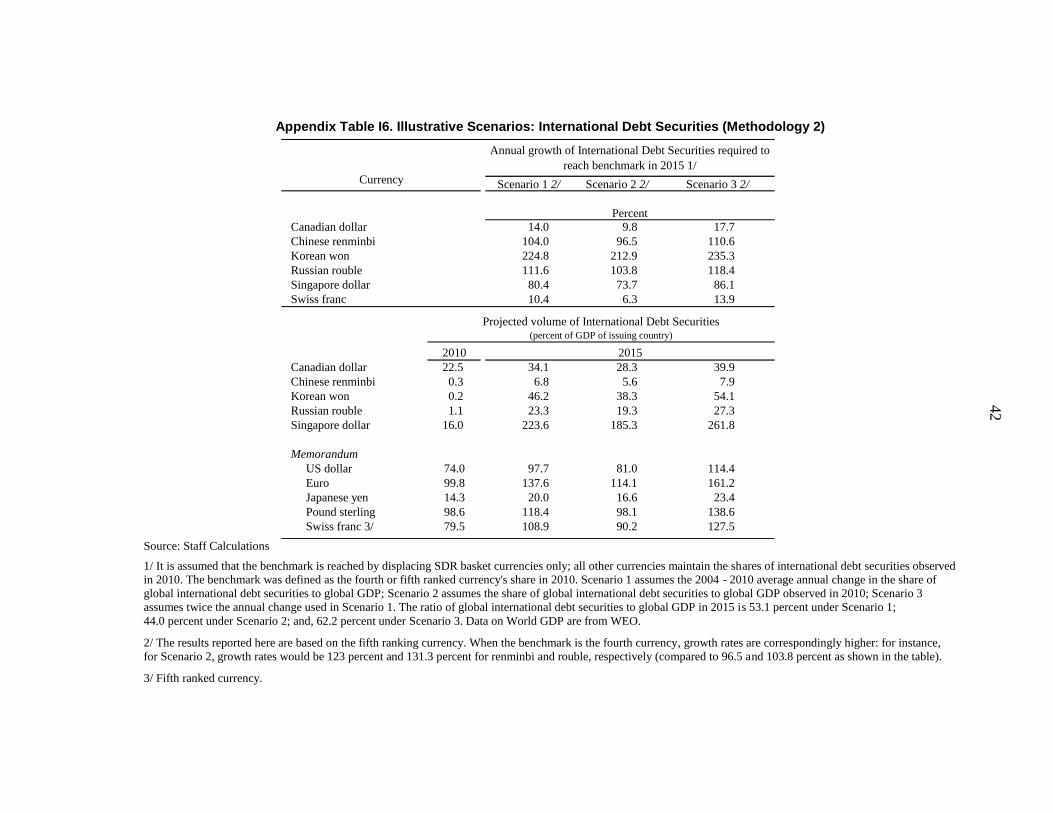
4
2
Appendix Table I6. Illustrative Scenarios: International Debt Securities (Methodology 2)
Source: Staff Calculations
1/ It is assumed that the benchmark is reached by displacing SDR basket currencies only; all other currencies maintain the shares of international debt securities observed
in 2010. The benchmark was defined as the fourth or fifth ranked currency's share in 2010. Scenario 1 assumes the 2004 - 2010 average annual change in the share of
global international debt securities to global GDP; Scenario 2 assumes the share of global international debt securities to global GDP observed in 2010; Scenario 3
assumes twice the annual change used in Scenario 1. The ratio of global international debt securities to global GDP in 2015 is 53.1 percent under Scenario 1;
44.0 percent under Scenario 2; and, 62.2 percent under Scenario 3. Data on World GDP are from WEO.
2/ The results reported here are based on the fifth ranking currency. When the benchmark is the fourth currency, growth rates are correspondingly higher: for instance,
for Scenario 2, growth rates would be 123 percent and 131.3 percent for renminbi and rouble, respectively (compared to 96.5 and 103.8 percent as shown in the table).
3/ Fifth ranked currency.
Scenario 1 2/ Scenario 2 2/ Scenario 3 2/
Canadian dollar 14.0 9.8 17.7
Chinese renminbi 104.0 96.5 110.6
Korean won 224.8 212.9 235.3
Russian rouble 111.6 103.8 118.4
Singapore dollar 80.4 73.7 86.1
Swiss franc 10.4 6.3 13.9
2010
Canadian dollar 22.5 34.1 28.3 39.9
Chinese renminbi 0.3 6.8 5.6 7.9
Korean won 0.2 46.2 38.3 54.1
Russian rouble 1.1 23.3 19.3 27.3
Singapore dollar 16.0 223.6 185.3 261.8
Memorandum
US dollar 74.0 97.7 81.0 114.4
Euro 99.8 137.6 114.1 161.2
Japanese yen 14.3 20.0 16.6 23.4
Pound sterling 98.6 118.4 98.1 138.6
Swiss franc 3/ 79.5 108.9 90.2 127.5
2015
Annual growth of International Debt Securities required to
reach benchmark in 2015 1/
Currency
Percent
Projected volume of International Debt Securities(percent of GDP of issuing country)

43
Appendix II: Data Issues
Data availability continues to be key in determining the indicators used to assess the
freely usable and the proposed reserve asset criteria. While data for many of the
indicators suggested are available, in some cases there are issues related to their frequency
and timeliness. The main gaps relate to the limited currency coverage of data on the currency
composition of foreign exchange reserves (COFER) and Bank for International Settlements
(BIS) data on international banking liabilities and over-the-counter (OTC) derivative
amounts outstanding. The Board has already broadly supported efforts to expand the
currency and country coverage of COFER taking reporting burdens into consideration.1 The
Board as part of the ―interconnectedness‖ discussions has welcomed, and the G-20 in the
context of the Data Gap Initiative has requested, enhancements in BIS financial data. It is
unclear whether this includes greater currency data coverage.2 In addition, the BIS‘ foreign
exchange market turnover data are relatively low frequency, with publication every three
years in the Triennial Reviews. Until these data limitations are rectified, reasonable,
comparable proxies that reflect the underlying concept under assessment could be
considered.
Assessment by indicator
Global foreign exchange market turnover: spot and derivative transactions
Foreign exchange market turnover, defined as the gross value of all deals concluded (during
the month of April), is measured in terms of the nominal or notional amount of the contracts.
The data, which are comprehensive, are provided by the BIS, which coordinates a global
triennial central bank survey of foreign exchange and derivatives market activity. The BIS
reports statistics on spot and derivative transactions—including turnover by currency pair,
outright forwards, foreign exchange swaps, currency options and currency swaps.
The BIS conducted the last triennial survey in April and June 2010. The participating central
banks collected and compiled data from about 4,000 reporting financial institutions. For the
April 2010 Survey, 53 central banks and monetary authorities participated, collecting data
from about 1,300 dealers on turnover in foreign exchange instruments and OTC interest rate
derivatives. At end-June, data were collected in 42 countries on outstanding notional amounts
and gross market values of foreign exchange, interest rate, equity, commodity, credit
(including credit default swaps contracts) and other OTC derivatives instruments.3
1 The Acting Chair’s Summing Up, Review of the Method of Valuation of the SDR November 17, 2010
http://www.imf.org/external/np/sec/pn/2010/pn10149.htm.
2 http://www.imf.org/external/np/sec/pn/2010/pn10150.htm; Data Gap Initiative recommendation #10:
http://www.imf.org/external/np/g20/pdf/053110.pdf
3 For more information visit http://www.bis.org/publ/rpfxf10t.htm.

44
Assessment
Very comprehensive and reliable data. Main limitation relates to the availability of data at
low frequency (every three years only).
Foreign exchange OTC derivatives
The BIS publishes semiannual statistics on OTC derivatives markets in the G-10 countries
and Switzerland, including notional amounts outstanding and gross market values of foreign
exchange OTC derivatives (forwards, swaps, and options).4 Data are from the Semiannual
OTC derivatives statistics, Tables 20B and 21B.
Assessment
Comprehensive data. But limited currency breakdown used to report the composition of
foreign exchange OTC derivatives. Currently currency composition is identified for thirteen
currencies, mostly currencies issued by developed economies.
International banking liabilities
The BIS publishes quarterly data on international banking liabilities, defined as liability
positions denominated in any currency to non-residents plus liabilities in foreign currency to
domestic residents. Data compiled by BIS is based on information reported by central banks
and monetary authorities from 43 countries and international banking centers.5 Data on
international banking liabilities come from the BIS locational banking statistics, Table 5A.
Assessment
High quality data, with high frequency. From SDR valuation perspective, there are two
limitations: (i) For the euro area, the data do not adjust for intra-euro transactions between
member countries, i.e., it do not exclude banking liabilities denominated in euro that are
issued in one member country of the euro area, and purchased by a resident of another
member country of the euro area; (ii) Limited currency breakdown used to report the
composition of reporting banks liabilities to official monetary authorities and other holders of
foreign exchange reserves; currently currency composition is identified for only five
currencies: the US dollar, the euro, the pound sterling, the Japanese yen, and the Swiss franc.
International debt securities
The BIS publishes quarterly data on international debt securities. They are defined as
(i) bonds and notes and money market instruments issued internationally, which include all
foreign currency issues in a given country, by both residents and non-residents; and (ii) all
4 For more details see Committee on the Global Financial System (CGFS) at Committee on the Global Financial
System and Semiannual OTC derivatives statistics at end-December 2010.
5 For more details see Guidelines to the international locational banking statistics, BIS. December, 2008.
http://www.bis.org/statistics/bankstats.htm.

45
domestic currency issues launched in the domestic market by non-residents. Additionally,
domestic currency issues in the domestic market by residents are considered as international
issues if they are specifically targeted at non-resident investors. Data on about 165,000
international bond issues and 870,000 international notes and money market instruments are
compiled by the BIS from various national, market, and institutional data sources, such as
Dealogic, Thomson Financial Securities Data, the market service division of the International
Capital Market Association, the Bank of England, and Euroclear. Data on international debt
securities can be found in the BIS‘ Securities Statistics, Tables 13A and 13B, reporting
international money market instruments and bonds and notes, respectively.
Assessment
High quality data, with high frequency. However, for the euro area, the data do not exclude
debt securities denominated in euro that are issued in one member country of the euro area,
and purchased by a resident of another member country of the euro area.
Official Reserve Holdings
The IMF publishes aggregated country group COFER data on a quarterly basis. The
currencies identified in COFER surveys include: the U.S. dollar, the euro, pound sterling, the
Japanese yen, the Swiss franc, and all other currencies combined as ―claims in other
currencies.‖ The definition of official foreign exchange reserves utilized in COFER is that
outlined in the sixth edition of the IMF‘s Balance of Payments and International Investment
Position Manual, and the same as that used for official foreign exchange reserves data
published in the IMF‘s International Financial Statistics (IFS). COFER country grouping
aggregates are published for each of the three country groups of countries currently used in
IFS world tables—world, advanced economies, and emerging and developing economies.
Assessment
The COFER database provides the best data on currency composition of reserves that are
available. However, from the perspective of SDR Reviews, it suffers from two limitations.
First, the large and increasing importance of Unallocated Reserves (the difference between
allocated reserves in COFER and total reserves reported to IFS), which by the end of the first
quarter of 2011 represented about 45 percent of total reserves. Second, the limited currency
breakdown used to report the composition of official foreign exchange reserves. Initiatives
are underway that will attempt to ameliorate these two limitations. In addition to these,
monetary authorities are instructed by the survey to report foreign currency reserves holdings
consistent with the BPM6 statistical definition (see paragraph 6.72 6), not total foreign
exchange holdings. This means that the total foreign currency holdings of monetary
authorities are not considered. In the context of the currency composition of reserves
indicator in the Reserve Asset Criterion (RAC) option, other foreign currency holdings of the
monetary authorities could therefore be considered as a supplementary indicator for RAC
purposes.
6 ―Furthermore to be liquid, reserve assets must be denominated and settled in convertible foreign currencies…‖