crital path refresher
DESCRIPTION
showing up of pathTRANSCRIPT

7/17/2019 Crital Path Refresher
http://slidepdf.com/reader/full/crital-path-refresher 1/11
7/17/2019 Crital Path Refresher
http://slidepdf.com/reader/full/crital-path-refresher 2/11
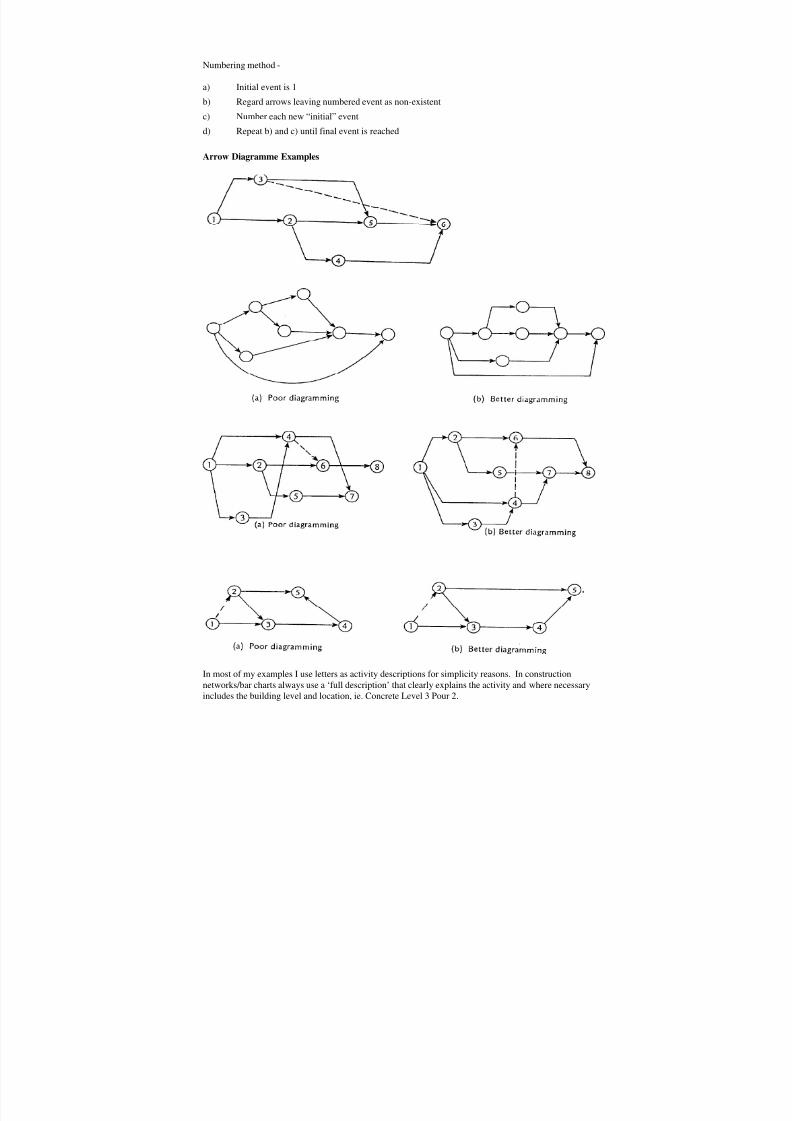
Numbering method -
a) Initial event is 1
b) Regard arrows leaving numbered event as non-existent
c) Number each new “initial” event
d) Repeat b) and c) until final event is reached
Arrow Diagramme Examples
In most of my examples I use letters as activity descriptions for simplicity reasons. In construction
networks/bar charts always use a ‘full description’ that clearly explains the activity and where necessary
includes the building level and location, ie. Concrete Level 3 Pour 2.

7/17/2019 Crital Path Refresher
http://slidepdf.com/reader/full/crital-path-refresher 3/11
Activity Duration Preceding
Description Activity
A 3 Starting eventB 5 Starting event
C 2 Starting event
D 4 A
E 4 A & B
F 7 A, B & C
G 8 D
H 2 E
I 3 F
J 4 G & E
K 2 H
L 8 I & H
A
C
B
D G
E H
F I
K
J
L
3
5
2
4
4
7
8
2
3
4
2
8
0
3
5
5
7
9
12
15
11
15
230
5
5
5
11
13
12
19
15
15
23
Activities with same early and late dates are Critical Path
Non-Critical activities have Float
- Free Float doesn't delay following activity
- Total Float doesn't delay the project
ES EF
I J
Duration
Activity A
7/17/2019 Crital Path Refresher
http://slidepdf.com/reader/full/crital-path-refresher 4/11
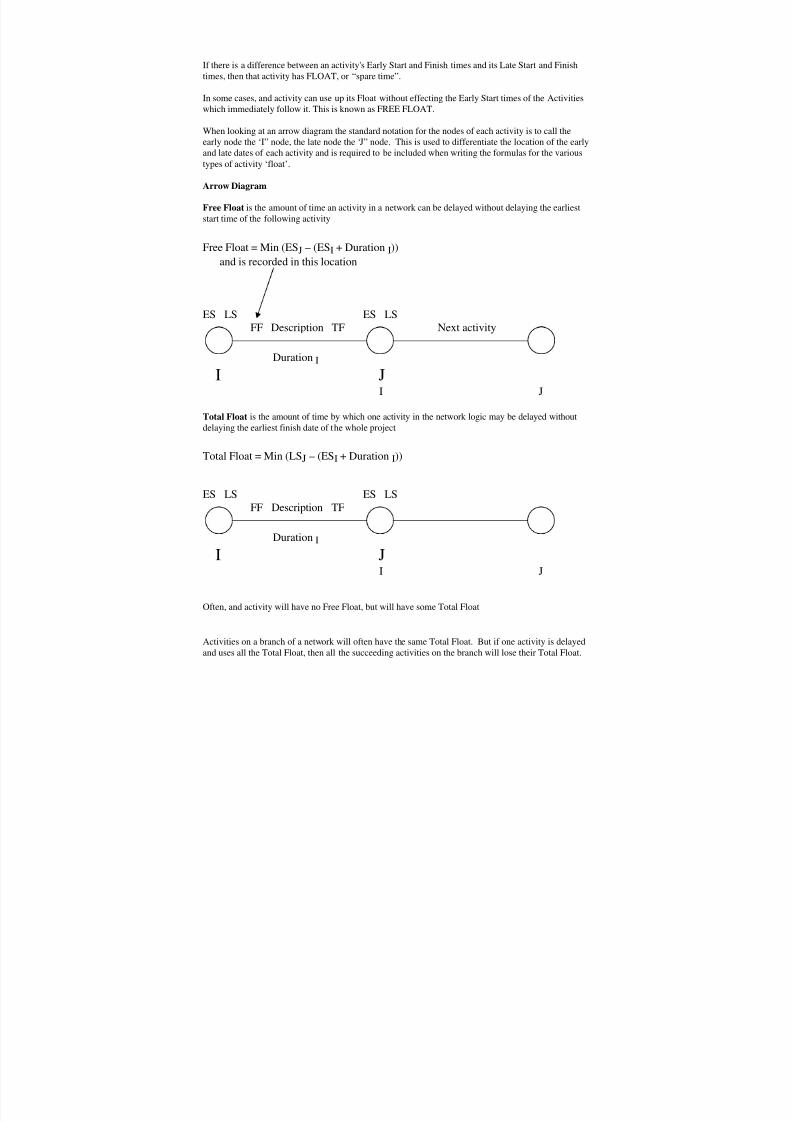
If there is a difference between an activity's Early Start and Finish times and its Late Start and Finish
times, then that activity has FLOAT, or “spare time”.
In some cases, and activity can use up its Float without effecting the Early Start times of the Activities
which immediately follow it. This is known as FREE FLOAT.
When looking at an arrow diagram the standard notation for the nodes of each activity is to call the
early node the ‘I” node, the late node the ‘J” node. This is used to differentiate the location of the early
and late dates of each activity and is required to be included when writing the formulas for the varioustypes of activity ‘float’.
Arrow Diagram
Free Float is the amount of time an activity in a network can be delayed without delaying the earliest
start time of the following activity
Free Float = Min (ESJ – (ESI + Duration I))
and is recorded in this location
ES LS ES LS
FF Description TF Next activity
Duration I
I JI J
Total Float is the amount of time by which one activity in the network logic may be delayed without
delaying the earliest finish date of the whole project
Total Float = Min (LSJ – (ESI + Duration I))
ES LS ES LS
FF Description TF
Duration I
I JI J
Often, and activity will have no Free Float, but will have some Total Float
Activities on a branch of a network will often have the same Total Float. But if one activity is delayed
and uses all the Total Float, then all the succeeding activities on the branch will lose their Total Float.
7/17/2019 Crital Path Refresher
http://slidepdf.com/reader/full/crital-path-refresher 5/11
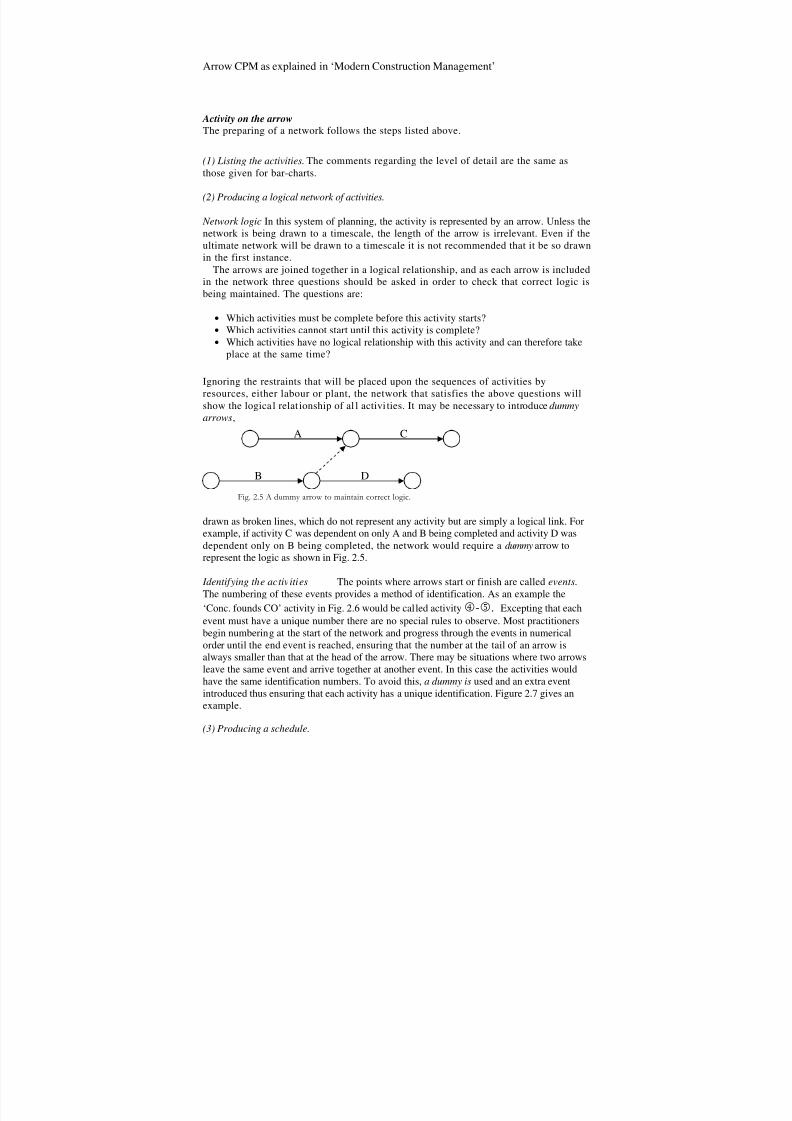
Arrow CPM as explained in ‘Modern Construction Management’
Activity on the arrow
The preparing of a network follows the steps listed above.
(1) Listing the activities. The comments regarding the level of detail are the same as
those given for bar-charts.
(2) Producing a logical network of activities.
Network logic In this system of planning, the activity is represented by an arrow. Unless the
network is being drawn to a timescale, the length of the arrow is irrelevant. Even if the
ultimate network will be drawn to a timescale it is not recommended that it be so drawn
in the first instance.
The arrows are joined together in a logical relationship, and as each arrow is included
in the network three questions should be asked in order to check that correct logic is
being maintained. The questions are:
• Which activities must be complete before this activity starts?
• Which activities cannot start until this activity is complete?
• Which activities have no logical relationship with this activity and can therefore take
place at the same time?
Ignoring the restraints that will be placed upon the sequences of activities by
resources, either labour or plant, the network that satisfies the above questions will
show the logical relat ionship of al l activi ties. It may be necessary to introduce dummy
arrows,
drawn as broken lines, which do not represent any activity but are simply a logical link. For
example, if activity C was dependent on only A and B being completed and activity D was
dependent only on B being completed, the network would require a dummy arrow to
represent the logic as shown in Fig. 2.5.
Identifying the activities The points where arrows start or finish are called events.
The numbering of these events provides a method of identification. As an example the
‘Conc. founds CO’ activity in Fig. 2.6 would be called activity 4-5. Excepting that eachevent must have a unique number there are no special rules to observe. Most practitioners
begin numbering at the start of the network and progress through the events in numerical
order until the end event is reached, ensuring that the number at the tail of an arrow is
always smaller than that at the head of the arrow. There may be situations where two arrows
leave the same event and arrive together at another event. In this case the activities would
have the same identification numbers. To avoid this, a dummy is used and an extra event
introduced thus ensuring that each activity has a unique identification. Figure 2.7 gives an
example.
(3) Producing a schedule.
Fig. 2.5 A dummy arrow to maintain correct logic.
A C
B D

7/17/2019 Crital Path Refresher
http://slidepdf.com/reader/full/crital-path-refresher 6/11
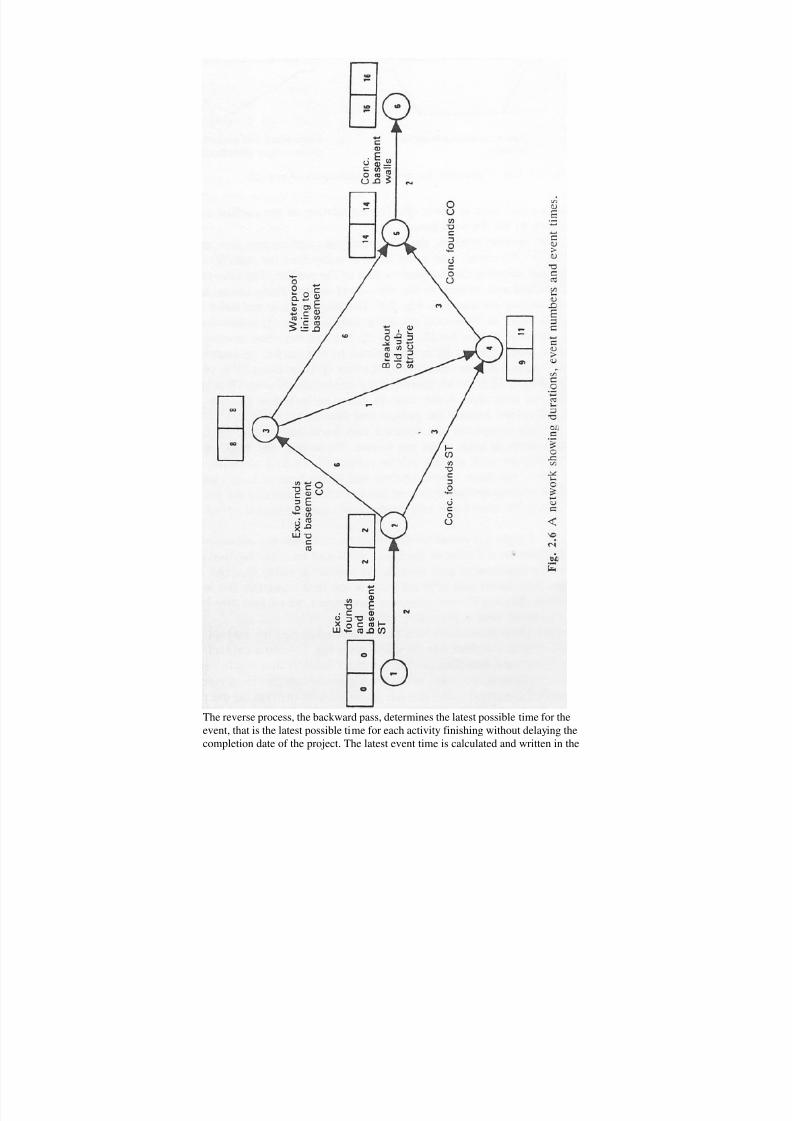
Durations and t ime analysis The time required for each activity needs to be estimated; the
estimate of duration will be based on knowledge of the work, experience, records and work
study. Once estimated. the duration of each activity is marked against the arrow in the logic
network. The earliest possible time of each event is then calculated and written in the left-
hand square alongside each event. This has determined the earliest possible start time of
each activity.
The calculations are shown in Fig. 2.6. For example, the earliest time of event 1 is 0, theearliest time of event2 is 0 + 2 = 2, the earliest time of event 3 is 2 + 6 = band so on.
The point to watch is that where two paths or chains of activities merge, as for example at
event 4, the longest path determines the earliest possible time of the event. At event 4
the path via event3 produces an earliest time of 8 + 1 = 9 which is greater than the path
direct from 2 which produces an earliest time of 2 + 3 = 5. Therefore 9 is the earliest
time of event. The calculation of the earliest event times is known as the forward pass.
7/17/2019 Crital Path Refresher
http://slidepdf.com/reader/full/crital-path-refresher 7/11
The reverse process, the backward pass, determines the latest possible time for the
event, that is the latest possible time for each activity finishing without delaying the
completion date of the project. The latest event time is calculated and written in the

7/17/2019 Crital Path Refresher
http://slidepdf.com/reader/full/crital-path-refresher 8/11
right-hand square alongside each event. The calculations are shown in Fig. 2.6. The
latest time of the finish event, event6, is taken as 16 weeks; the latest time of
event 5 is 16 - 2 = 14; and of event 4 it is 14 - 3 = 11. Event3 has two activities
leaving it, and the latest time of event3 is determined by the earlier or smaller
calculated latest time, i.e.one calculation for event3 from event4 is 14 - 6 = 8
and the other is 11 - 1 = 10, therefore the latest time of event 3 is 8. If event 3
was any later than 8 the time to complete activities3
-5
and5
-6
would extendbeyond the project end date of 16.Having completed the forward and backward passes, the earliest and latest times of each
event are known. From this, the ‘'float’ or spare time available for each activity can he
calculated. Critical activities, which have no float, are those whose earliest and latest time of
start event coincide, whose earliest and latest time of finish event coincide and the time
difference between the start event and finish event equals duration of the activity.
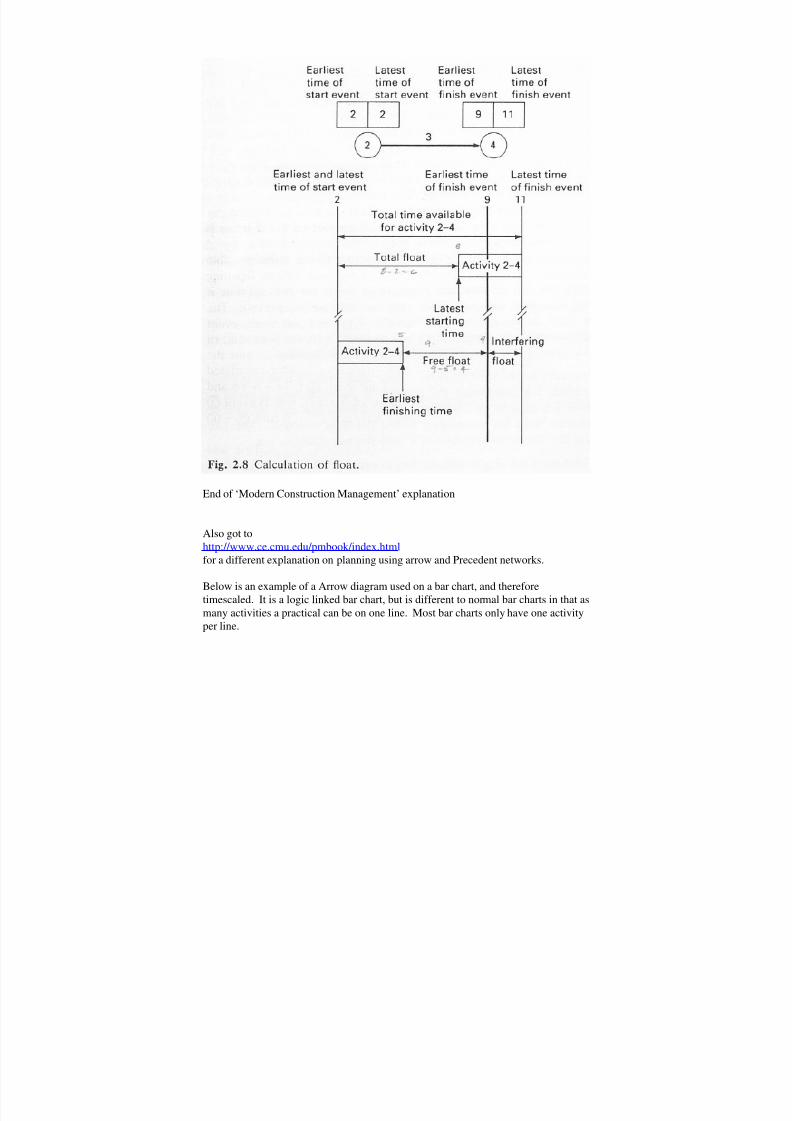
Float Figure 2.8 shows an activity extracted from the network in Fig. 2.6. The times shown
refer to the event times and have the following meanings. The Earliest time of start event is the
earliest possible time the activity can start. The Latest time of finish event is the latest time
the activity can finish without delaying the completion of the project. The Latest time of
start event is the latest time a preceding activity may finish, and the Earliest time of finish
event is the earliest time that a succeeding activity may start. Knowing these times, the floatcan be calculated; Fig. 2.8 shows the calculation of total float and free float.
Total float is the total amount of time by which the activity could be extended or delayed
and still not interfere with the project end date. Total float is the total time available
for the activity less the duration, i.e. the latest time of the finish event less the earliest time
of the start event less the duration.
If the total float for one activity is completely used up by the activity then some of the total
float of the succeeding activity is also used. Free float, however, is the amount of time by
which an activity could be extended or delayed without interfering with the succeeding
activity. Free float is calculated by the earliest time of the finish event less the earliest time of
the start event less the duration. Free float assumes both the preceding and succeeding
activities start as early as possible.Using the example in Fig. 2.8 the total float of activity 2 -4 is 11-2-3 = 6, and
the free float is 9-2-3 = 4.
The difference between total float and free float is sometimes referred to as interfering
float, as shown in Fig. 2.8. It is the amount of total float shared by the succeeding activity.
Interfering float is rarely used in any subsequent calculations
7/17/2019 Crital Path Refresher
http://slidepdf.com/reader/full/crital-path-refresher 9/11
End of ‘Modern Construction Management’ explanation
Also got to
http://www.ce.cmu.edu/pmbook/index.html
for a different explanation on planning using arrow and Precedent networks.
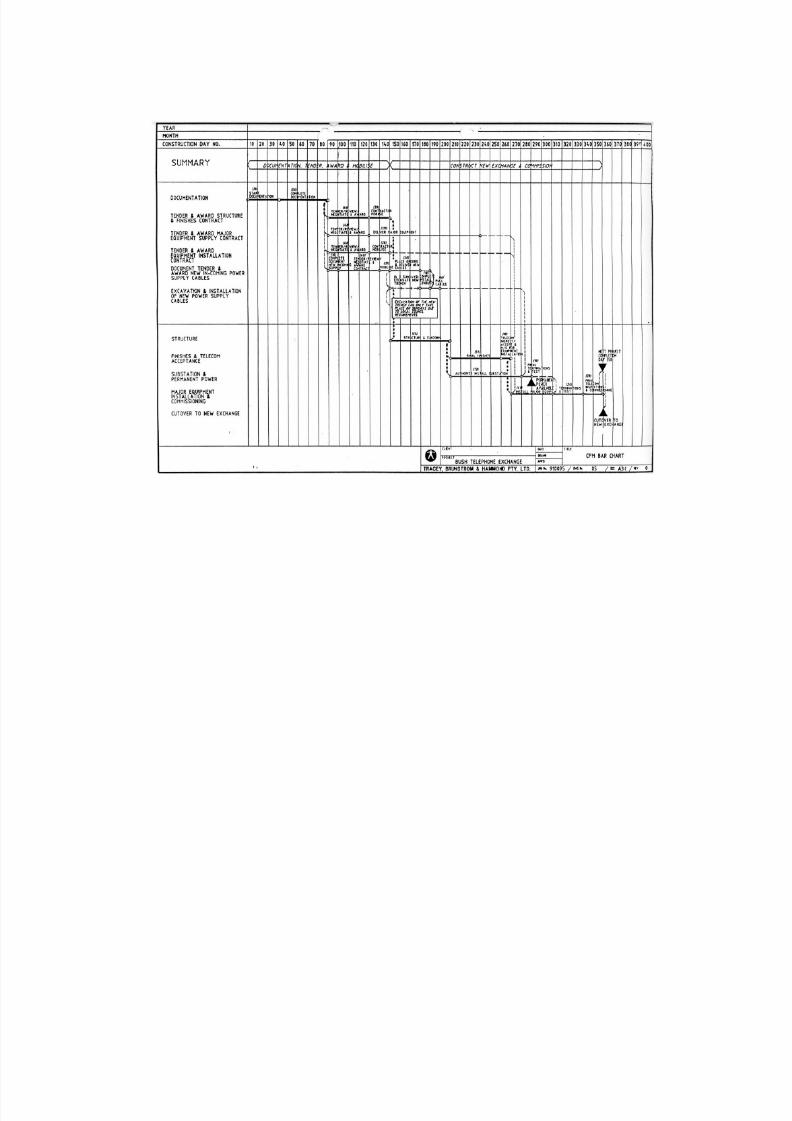
Below is an example of a Arrow diagram used on a bar chart, and therefore
timescaled. It is a logic linked bar chart, but is different to normal bar charts in that as
many activities a practical can be on one line. Most bar charts only have one activity
per line.
7/17/2019 Crital Path Refresher
http://slidepdf.com/reader/full/crital-path-refresher 10/11

7/17/2019 Crital Path Refresher
http://slidepdf.com/reader/full/crital-path-refresher 11/11