crisis of 2007-2008. trends in us banking decline of glass-steagal act in 1927, interstate banking...
Post on 20-Dec-2015
214 views
TRANSCRIPT
Crisis of 2007-2008

Trends in US Banking

Decline of Glass-Steagal Act
• In 1927, interstate banking eliminated.
• In 1933, Glass-Steagal act created FDIC and separated banking business from securities business.
During 1990’s, these regulations were eliminated and US banks had a wave of consolidation and concentration.
Bank Holding Companies
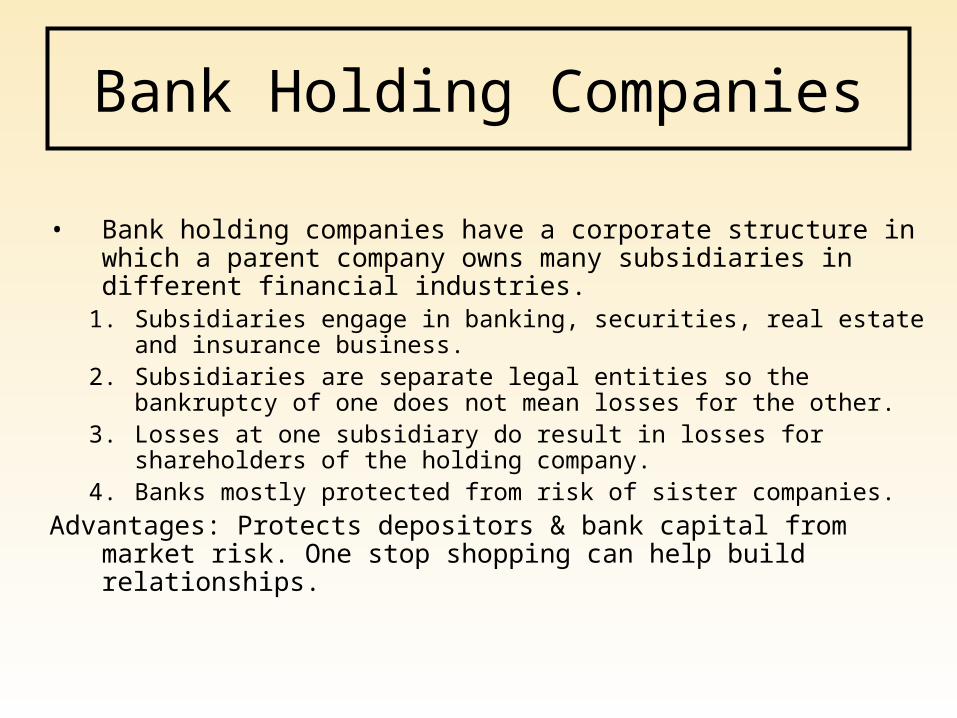
• Bank holding companies have a corporate structure in which a parent company owns many subsidiaries in different financial industries.
1. Subsidiaries engage in banking, securities, real estate and insurance business.
2. Subsidiaries are separate legal entities so the bankruptcy of one does not mean losses for the other.
3. Losses at one subsidiary do result in losses for shareholders of the holding company.
4. Banks mostly protected from risk of sister companies.
Advantages: Protects depositors & bank capital from market risk. One stop shopping can help build relationships.

Shadow Banking System
• Over the last 30 years, competitors to banks in providing traditional banking services.
• The competitors include– Investment Banks– Mutual Funds– Hedge Funds

Decline in Advantage in Providing Liquidity
• One of banks biggest source of comparative advantage is their ability to provide liquid assets for depositors.– New Competition: Money Market Mutual
Funds – Mutual funds that are redeemable at a fixed price by writing checks. Mutual funds invest in money markets. These are essentially checking accounts issued by non-financial institutions that pay interest.

Decline in Advantage in Providing Credit
• Another of banks comparative advantage is their ability to provide loans quickly and provide credit to small or new firms.
• New Competition– Commercial Paper: Short-term corporate bonds.
Many firms that relied on banks for short-term loans now issue commercial paper.
– Junk Bonds: Bonds issued by firms with non-investment grade credit ratings. Many firms that relied on banks for credit now issue junk bonds.

Financial Commercial Paper
• Commercial paper has not only offered competition for banks loan business, …but also offers a source of financing for banks competitors.
• MMMF’s and others buy commercial paper with funds deposited by customers.
• Banks following Citibank also set up SIV’s financed with money market borrowing (asset backed commercial paper) to purchase long-term assets.

Financing of Investment Banks
October 2004 – SEC lifts capitalization rules for large broker-dealers
M. Brunnermeier, Princeton U. Slides.

I-Banks switched to more S-T lending.
Financing of Broker Dealers
-5.00%
0.00%
5.00%
10.00%
15.00%
20.00%
25.00%
30.00%
35.00%
40.00%
45.00%
2002
Q2
2002
Q4
2003
Q2
2003
Q4
2004
Q2
2004
Q4
2005
Q2
2005
Q4
2006
Q2
2006
Q4
2007
Q2
2007
Q4
2008
Q2
% o
f A
ss
ets
Finl. Assets-Finl. Liabilities Repo Finance
Ex. In 2000, Equity to Assets at Morgan Stanley was 4.6%, in May 2008 was 1.1%
If you can’t beat‘em, join’em
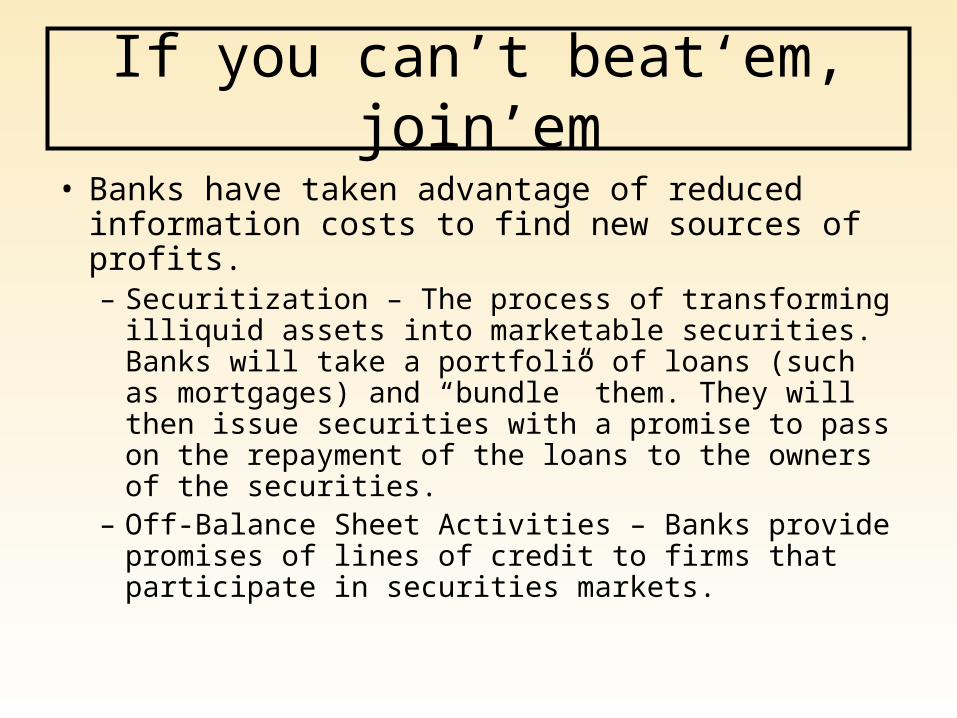
• Banks have taken advantage of reduced information costs to find new sources of profits. – Securitization – The process of transforming illiquid
assets into marketable securities. Banks will take a portfolio of loans (such as mortgages) and “bundle” them. They will then issue securities with a promise to pass on the repayment of the loans to the owners of the securities.
– Off-Balance Sheet Activities – Banks provide promises of lines of credit to firms that participate in securities markets.

Rapid Growth of Mortgage Lending
all sectors home mortgages asset
5000000
6000000
7000000
8000000
9000000
10000000
11000000
12000000
2002
Q2
2002
Q4
2003
Q2
2003
Q4
2004
Q2
2004
Q4
2005
Q2
2005
Q4
2006
Q2
2006
Q4
2007
Q2
2007
Q4
2008
Q2
Causes?
• Low Interest Rates– Real Interest Rates – Saving Glut– ST Rates Fed
• Limits on Growth in Desirable Locations
• Securitization
• Decline in Lending Standards
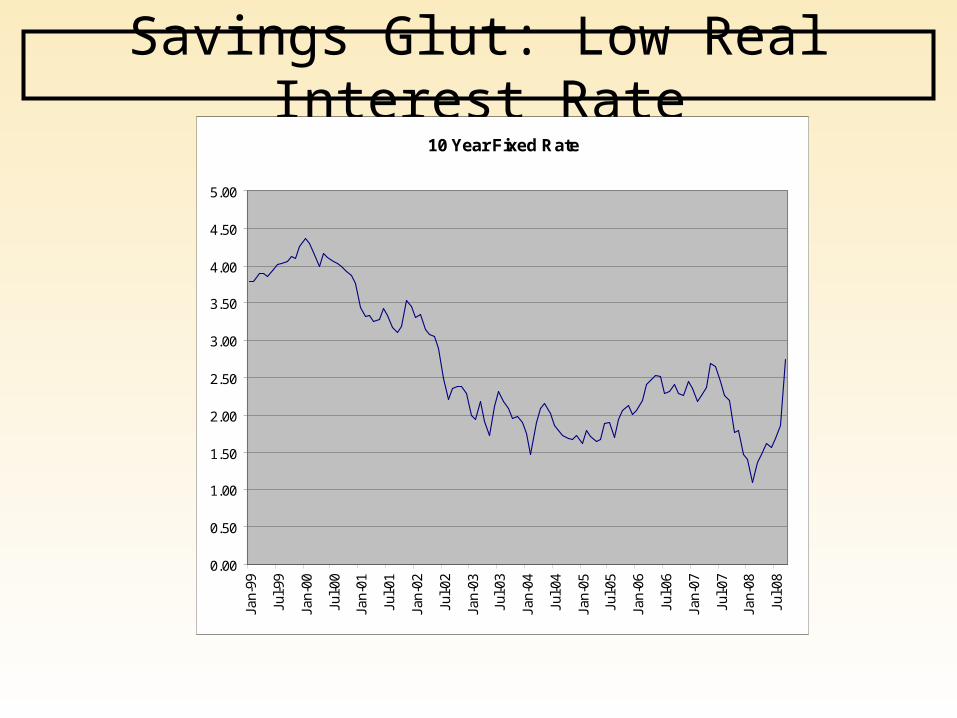
Savings Glut: Low Real Interest Rate10 Year Fixed Rate
0.00
0.50
1.00
1.50
2.00
2.50
3.00
3.50
4.00
4.50
5.00
Jan-
99
Jul-9
9
Jan-
00
Jul-0
0
Jan-
01
Jul-0
1
Jan-
02
Jul-0
2
Jan-
03
Jul-0
3
Jan-
04
Jul-0
4
Jan-
05
Jul-0
5
Jan-
06
Jul-0
6
Jan-
07
Jul-0
7
Jan-
08
Jul-0
8
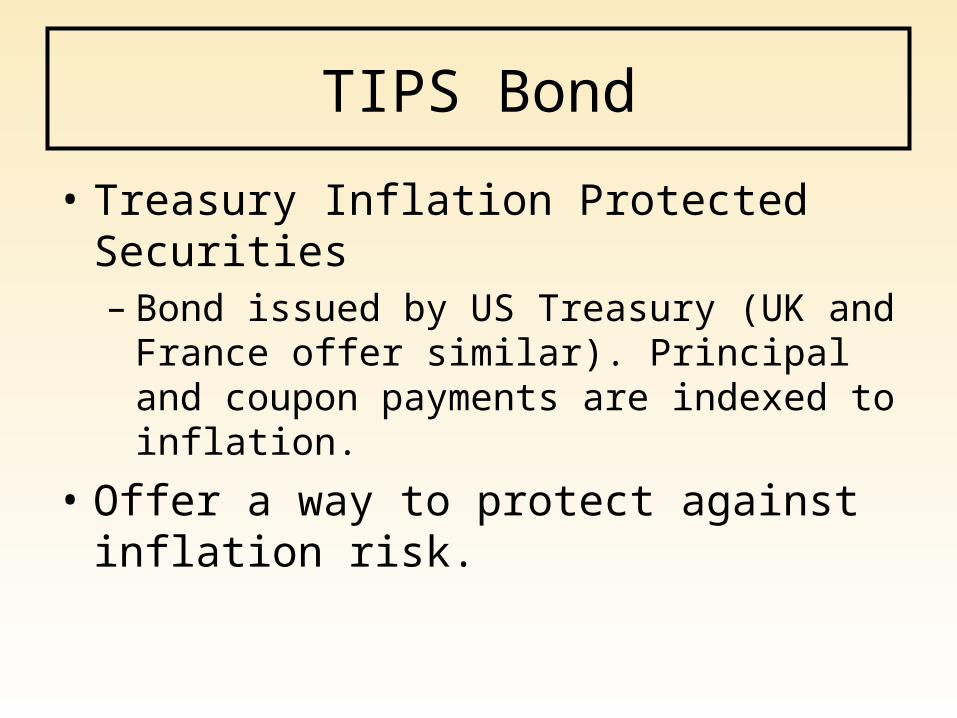
TIPS Bond
• Treasury Inflation Protected Securities– Bond issued by US Treasury (UK and France
offer similar). Principal and coupon payments are indexed to inflation.
• Offer a way to protect against inflation risk.
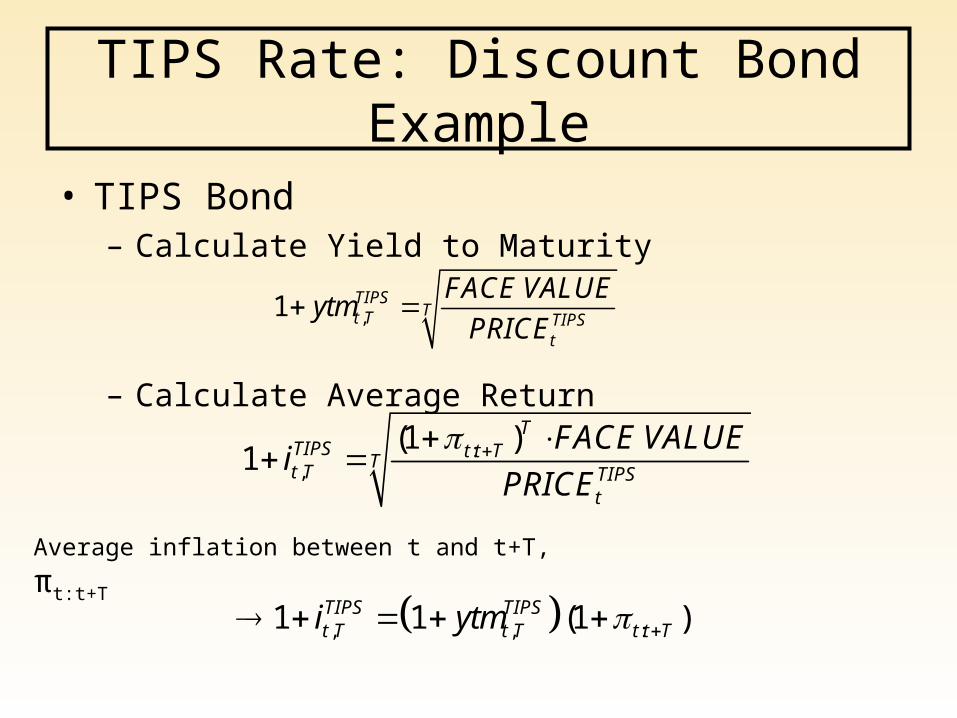
TIPS Rate: Discount Bond Example
• TIPS Bond – Calculate Yield to Maturity
– Calculate Average Return
,1 TIPSTt T TIPS
t
FACE VALUEytm
PRICE
:,
(1 )1
TTIPS t t TTt T TIPS
t
FACE VALUEi
PRICE
Average inflation between t and t+T, πt:t+T
, , :1 1 (1 )TIPS TIPSt T t T t t Ti ytm
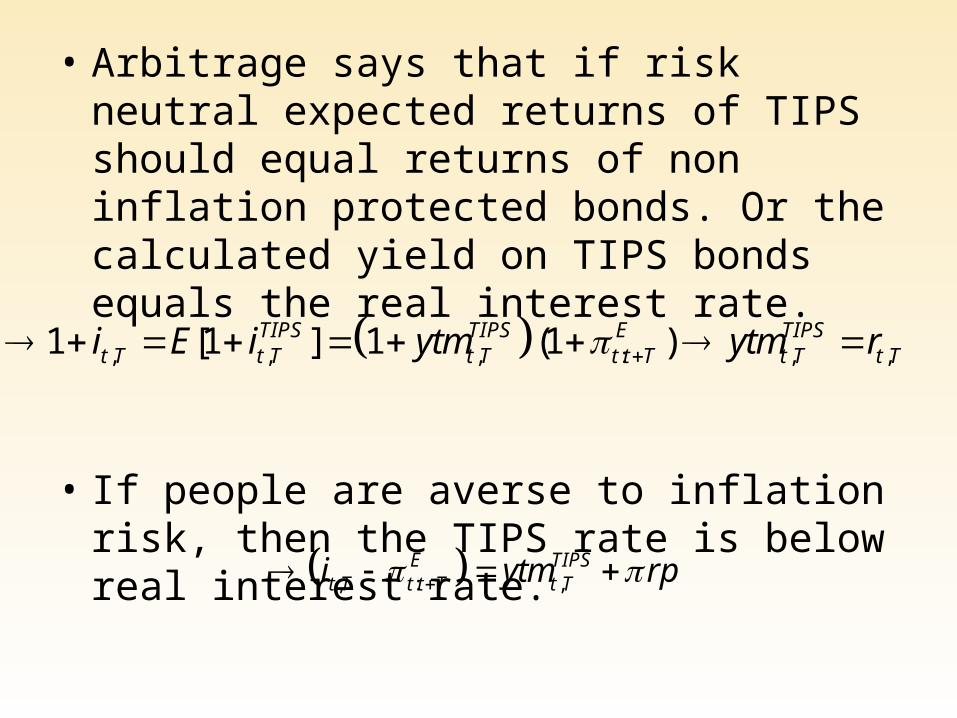
• Arbitrage says that if risk neutral expected returns of TIPS should equal returns of non inflation protected bonds. Or the calculated yield on TIPS bonds equals the real interest rate.
• If people are averse to inflation risk, then the TIPS rate is below real interest rate.
, , , : , ,1 [1 ] 1 (1 )TIPS TIPS E TIPSt T t T t T t t T t T t Ti E i ytm ytm r
, : ,E TIPS
t T t t T t Ti ytm rp
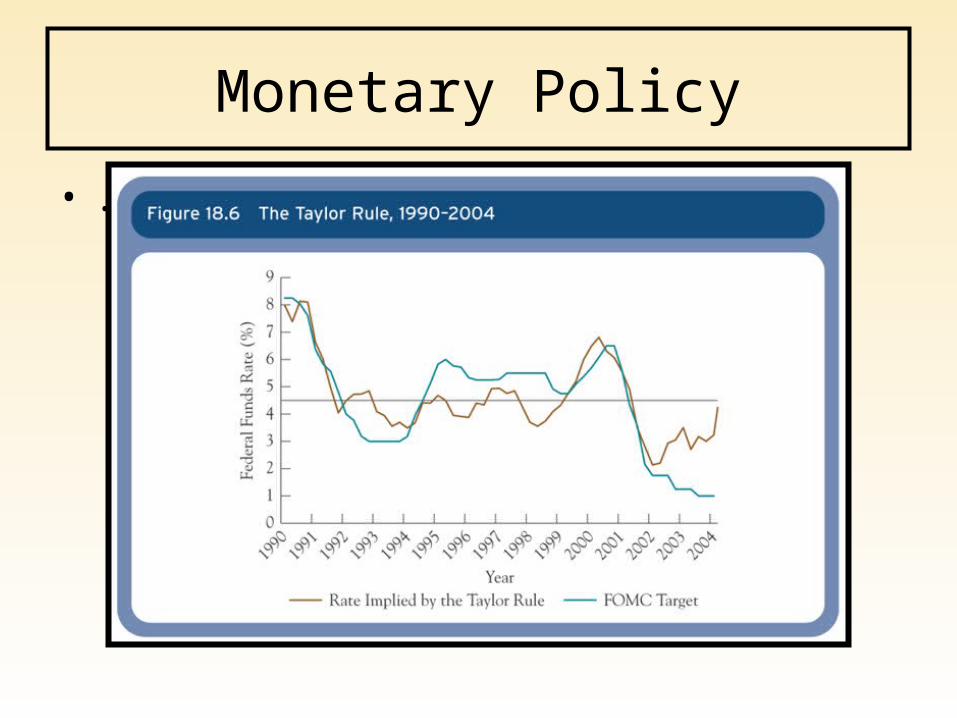
Monetary Policy
• .

Loans Serviced for Others
2000000000
2500000000
3000000000
3500000000
4000000000
4500000000
5000000000
5500000000
6000000000
6500000000
2001 2002 2003 2004 2005 2006 2007 2008
US$
Securitization: FDIC Statistics on Banking: All FDIC Institutions
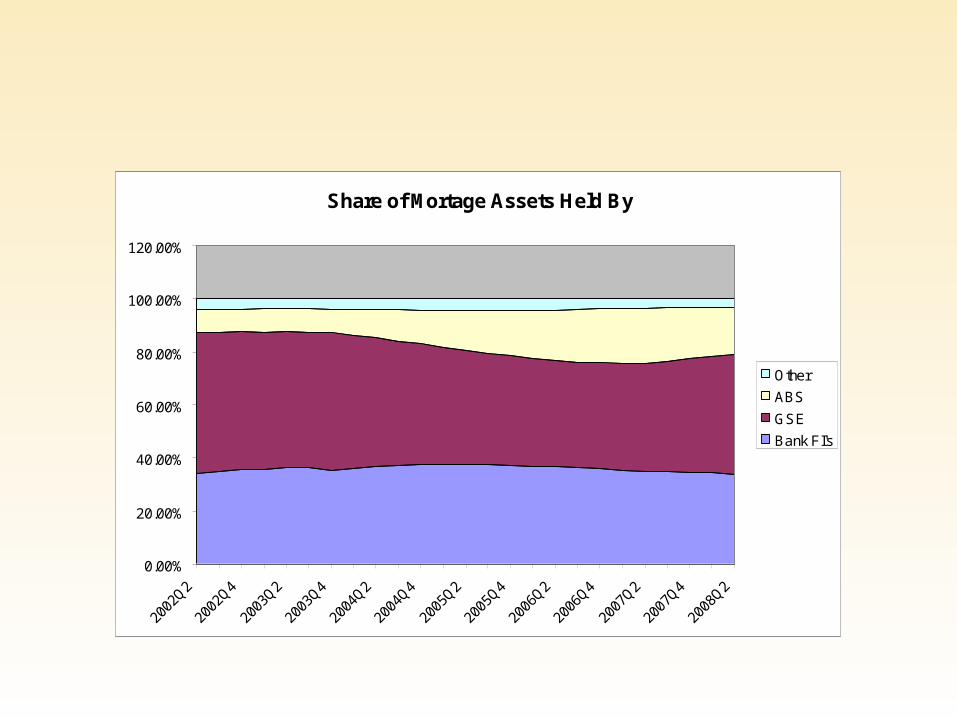
Share of Mortage Assets Held By
0.00%
20.00%
40.00%
60.00%
80.00%
100.00%
120.00%
2002
Q2
2002
Q4
2003
Q2
2003
Q4
2004
Q2
2004
Q4
2005
Q2
2005
Q4
2006
Q2
2006
Q4
2007
Q2
2007
Q4
2008
Q2
Other
ABS
GSE
Bank FI's

Banks Increase Holdings of Real Estate Holdings
Bank RE Based Securities
0
200,000,000
400,000,000
600,000,000
800,000,000
1,000,000,000
1,200,000,000
2001 2002 2003 2004 2005 2006 2007 2008
MBS CMO

CMO: Collateralized Mortgage Obligations
• An SPV is set up to purchase mortgages and issue bonds which pay out in tranches. Tranches are orderings of payments in terms of seniority. Each tranche is has its own credit rating.
Sample
Commercial and Investment Banks often set up SPV
Special purpose vehicle: Quasi-independent company set up to manage asset.
M. Brunnermeier, Princeton U. Slides.

Collateralized Debt Obligations• A special purpose vehicle that buys
quantities of debt securities (often MBS or CMO tranches) that might be low rated and turn it into tranches some of which might be better rated.
BBB Securities
BBB Securities
BBB Securities
SPV
Senior Tranche AAA
Junior Tranche
AAA tranches may have paid higher returns than typical AAA securities. Attractive to institutions restricted to AAA
Reasons for CMO’s & CDO’s
• GSE’s are limited in terms of the size of mortgages they could buy. Part of the mandate of GSE’s is enhancing lending to poorer households, but at various times there were limits on sub-prime mortgages that could be purchased by GSE’s.
• Certain institutions by charter need to invest in AAA securities.
• Banks held many of the “super” senior tranches in their own accounts.
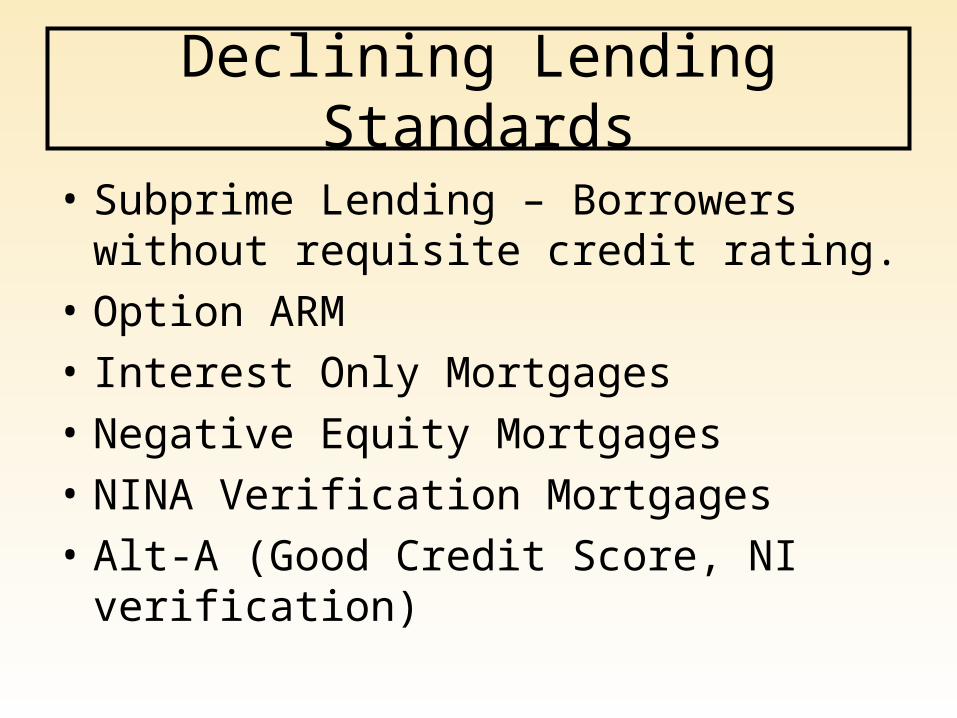
Declining Lending Standards
• Subprime Lending – Borrowers without requisite credit rating.
• Option ARM
• Interest Only Mortgages
• Negative Equity Mortgages
• NINA Verification Mortgages
• Alt-A (Good Credit Score, NI verification)
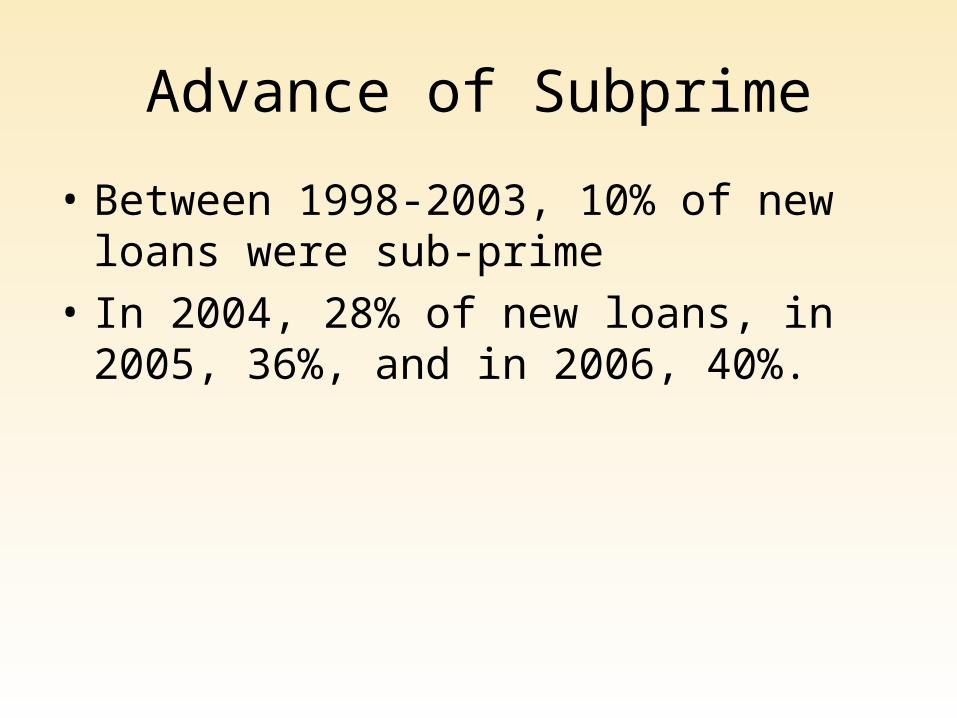
Advance of Subprime
• Between 1998-2003, 10% of new loans were sub-prime
• In 2004, 28% of new loans, in 2005, 36%, and in 2006, 40%.

Sample Definition (Wikipedia)
FNMA prime loans go to borrowers with• a credit score above 620 (credit scores are
between 350 and 850 with a median in the U.S. of 678 and a mean of 723),
• a debt-to-income ratio no greater than 45% (meaning that no more than 45% of gross income pays for housing and other debt), and
• a combined loan-to-value ratio of 90% (meaning that the borrower is paying a 10% down payment).
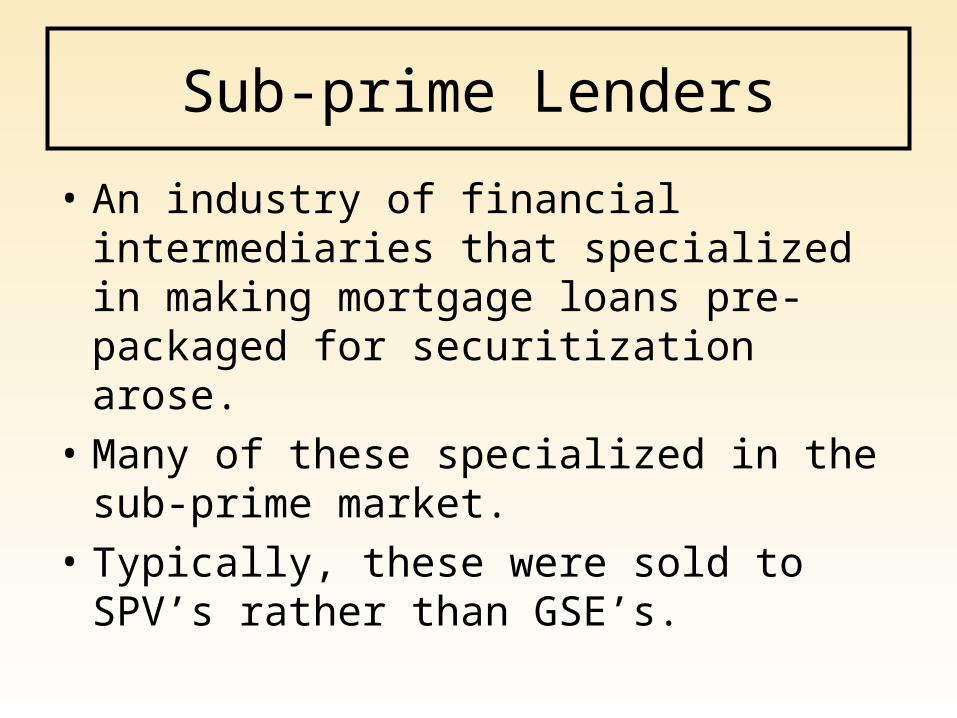
Sub-prime Lenders
• An industry of financial intermediaries that specialized in making mortgage loans pre-packaged for securitization arose.
• Many of these specialized in the sub-prime market.
• Typically, these were sold to SPV’s rather than GSE’s.
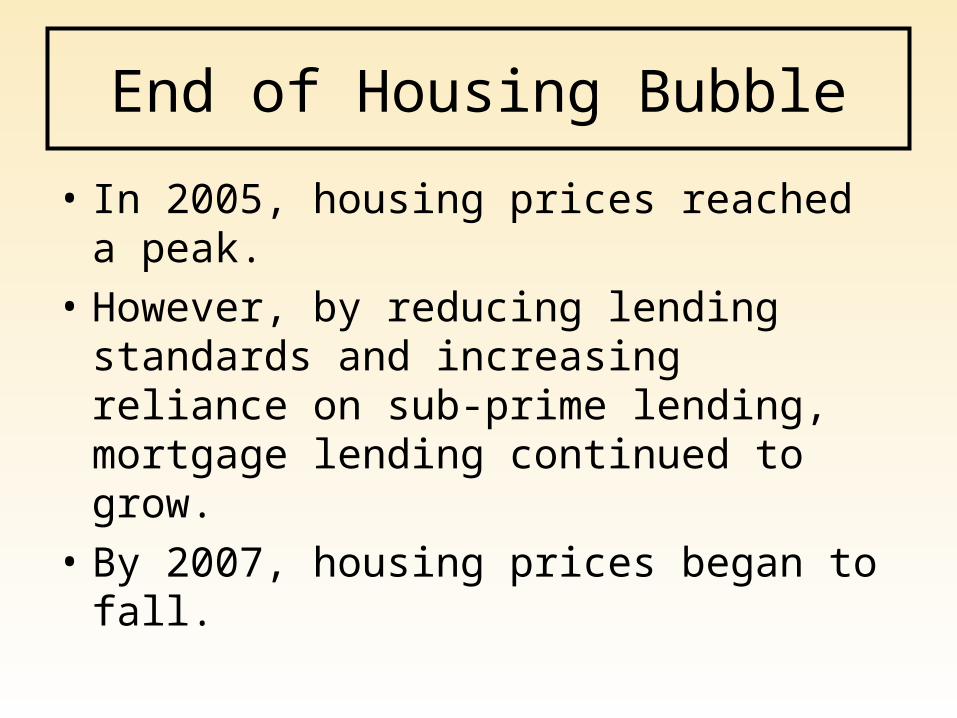
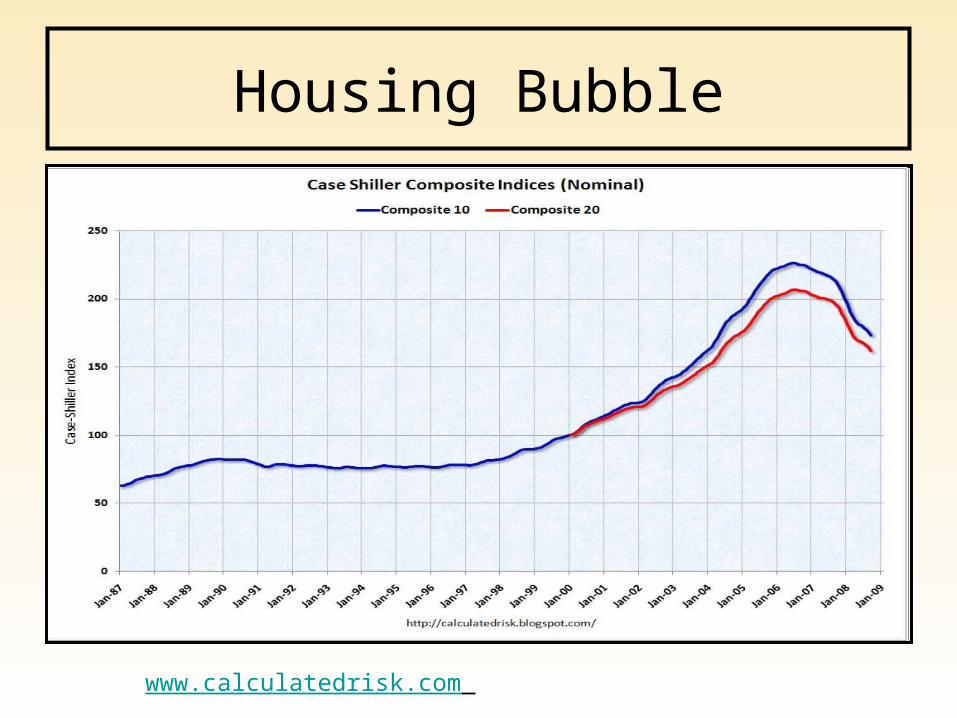
End of Housing Bubble
• In 2005, housing prices reached a peak.
• However, by reducing lending standards and increasing reliance on sub-prime lending, mortgage lending continued to grow.
• By 2007, housing prices began to fall.

Increasing Loan LossesDeliquency Rates All Commercial Banks
0
1
2
3
4
5
6
7
1991
.25
1992
.50
1993
.75
1995
.00
1996
.25
1997
.50
1998
.75
2000
.00
2001
.25
2002
.50
2003
.75
2005
.00
2006
.25
2007
.50
2008
.75
%
Residential
All
Credit performance worse at sub-prime lenders.
Mortgage losses estimated at $1.4 trilion by IMF
Valuation
• Although many MBS, CMO, and CDO’s have shown increased defaults but for many these may not yet be large, rising risk of have impacted their value.
• Discount factor for future cash flows
• Rising risk premium has reduced price of the assets.
DF RISKFREEt t ti i Risk Premium

Mark to Market Accounting
• For easily traded securities, current accounting practice suggests valuing assets on books at the current market price.
• Problem: A change in valuation of assets will affect capital (assets – liabilities). Restrictive covenants which require minimum capital may be violated if value of assets drop.
• Lenders may have option to recall loans if covenants violated.
Liquidity of CMO’s and CDO’s
• There is much uncertainty and asymmetric info in CMO’s. Difficult for a potential investor to evaluate quality of the mortgage loan bundle while bundler/seller may have better idea.
• Increased risk has generated lemon’s problem.
• Wide bid/ask spreads makes it difficult to reasonably implement M2M accounting.
Issues
• Capitalization: Banks and other holders of mortgage backed securities are likely to take large losses on defaults.
• Liquidity: MMMF are supposed to be safe investments; once risk becomes known MMMF‘s pull out of commercial paper market go into treasuries.
• Complexity: CDO’s and CMO’s are complicated instruments; difficult to tell good from bad. In hard times, adverse selection may make selling them w/o huge discount problematic.
• Business cycle issue. Large contraction in consumption and investment likely to make default rates rise.

Rates Rise
Fed Board of Governors

Commercial Paper Market Dries Up
• March 2008– Bear Stearns acquired by J.P. Morgan with
Fed help. .
• September 2008, – FNMA & FHLMC placed in conservatorship.– Merrill Lynch acquired by Bank of America – Lehman Brothers declared bankruptcy– AIG received emergency loan from Federal
Reserve.[176] which acquired a 79.9% equity – Washington Mutual (WaMu), seized
November 2008, US government guarantees ads of Citigroup

Interbank Rates
-0.5
0.0
0.5
1.0
1.5
2.0
2.5
3.0
3.5
4.0
Jul-01 Jul-02 Jul-03 Jul-04 Jul-05 Jul-06 Jul-07 Jul-08Spre
ad o
ver
1-M
onth
Tre
asur
y Bi
ll Ra
te, P
erce
ntag
e Po
ints
LIBOR--large banks
Federal funds--small
Hall (Stanford) and Woodward

Policy Responses

Standard Monetary Policy Response

Non-standard Response
• Discount rate reduced to 50 basis point above target in September 2007 and now 25 basis points above.– Also in HK
• Fed now pays interest on reserve deposits.
• Quantitative easing has pushed effect rate below target.
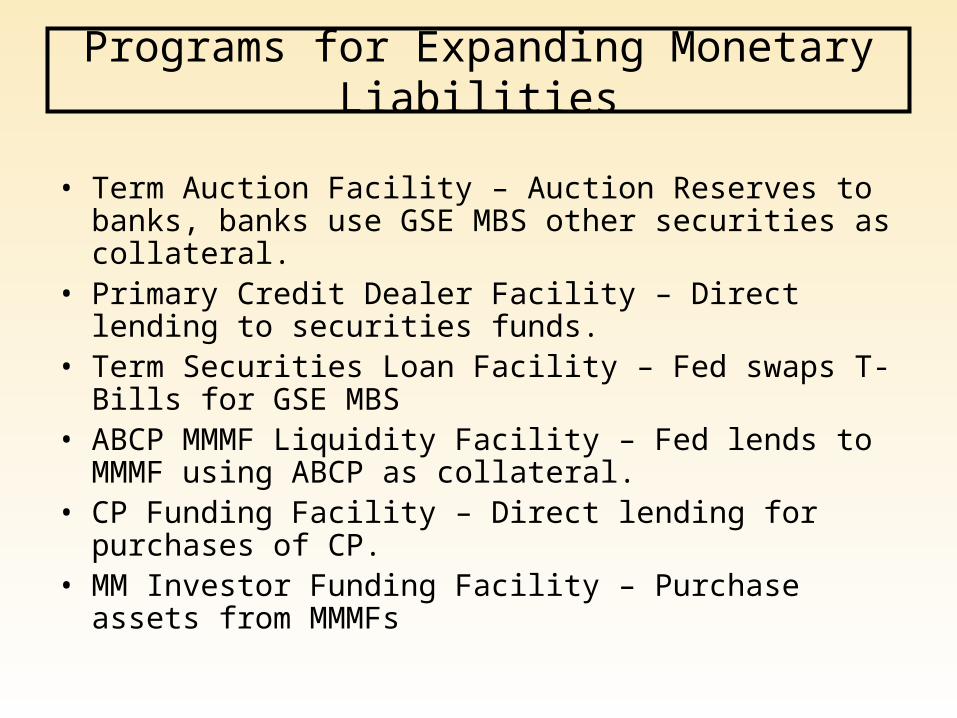
Programs for Expanding Monetary Liabilities
• Term Auction Facility – Auction Reserves to banks, banks use GSE MBS other securities as collateral.
• Primary Credit Dealer Facility – Direct lending to securities funds.
• Term Securities Loan Facility – Fed swaps T-Bills for GSE MBS
• ABCP MMMF Liquidity Facility – Fed lends to MMMF using ABCP as collateral.
• CP Funding Facility – Direct lending for purchases of CP.• MM Investor Funding Facility – Purchase assets from
MMMFs
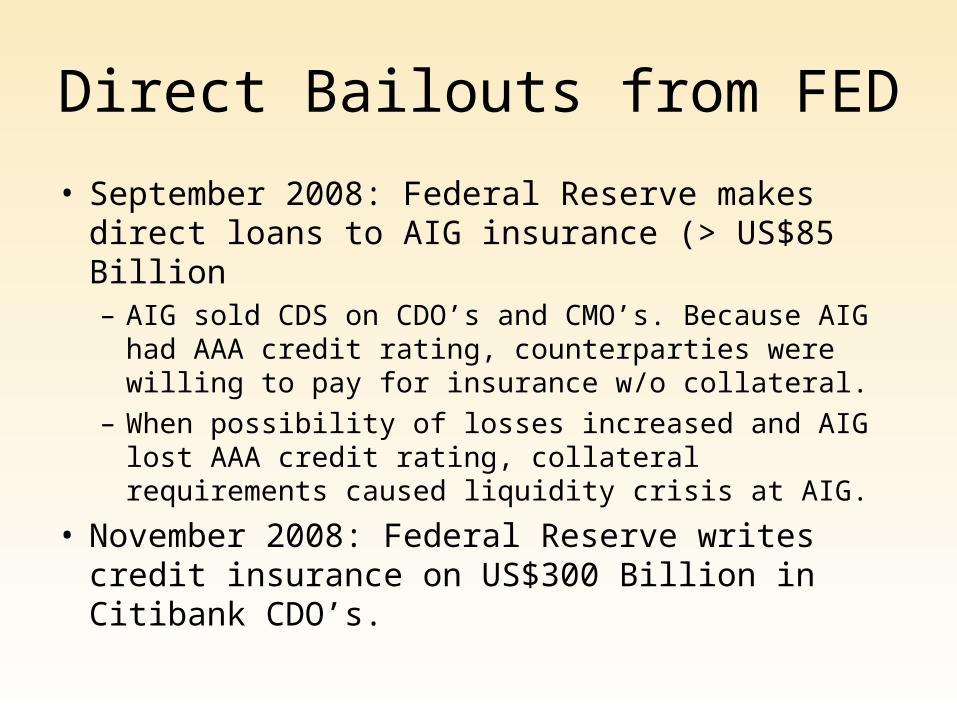
Direct Bailouts from FED
• September 2008: Federal Reserve makes direct loans to AIG insurance (> US$85 Billion– AIG sold CDS on CDO’s and CMO’s. Because AIG
had AAA credit rating, counterparties were willing to pay for insurance w/o collateral.
– When possibility of losses increased and AIG lost AAA credit rating, collateral requirements caused liquidity crisis at AIG.
• November 2008: Federal Reserve writes credit insurance on US$300 Billion in Citibank CDO’s.

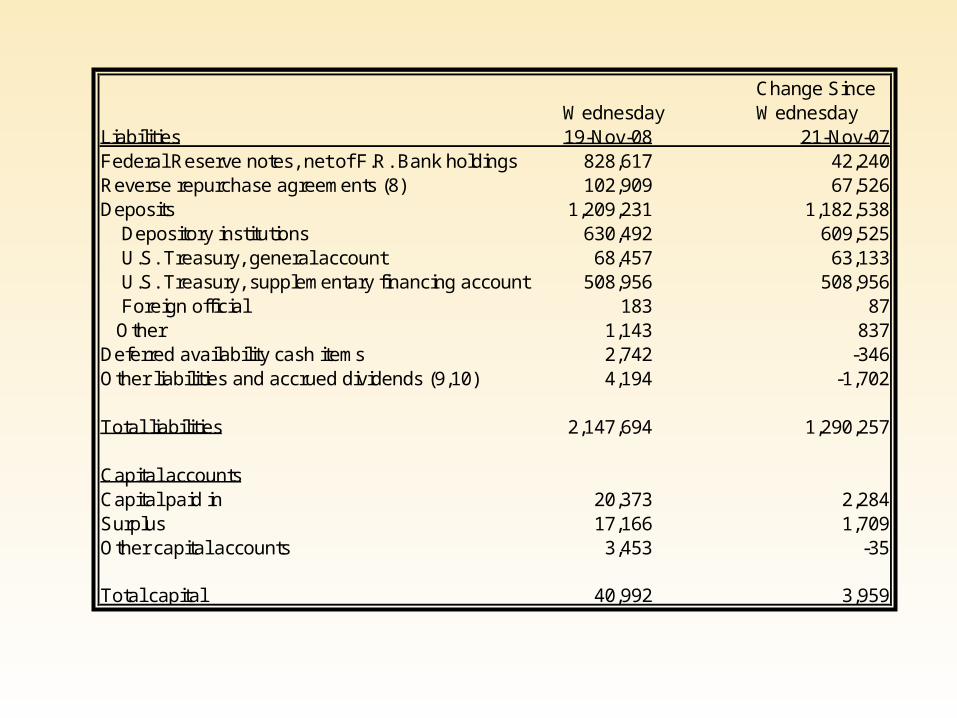
Balance Sheets of U.S. Federal Reserve
LiabilitiesMonetary BaseFederal Reserve Notes 719.4Deposits of Depository Institution 24Nonbase LiabilitiesDeposts of U.S. Treasury 5.9Other 37.8
AssetsForeign Currency Assets 21.4US Government Securities 725.6Discount Loan 0.4Other Assets 63.8
Billion US$, 12-2004, Federal Reserve Annual Report

Change SinceWednesday Wednesday
Assets 19-Nov-08 21-Nov-07Gold certificate account 11,037 0Special drawing rights certificate account 2,200 0Coin 1,648 470Securities, repurchase agreements, term auctioncredit, and other loans 1,272,929 438,201 Securities held outright 488,926 -290,744 U.S. Treasury (1) 476,425 -303,245 Bills (2) 18,423 -248,596 Notes and bonds, nominal (2) 410,491 -60,493 Notes and bonds, inflation-indexed (2) 41,071 4,160 Inflation compensation (3) 6,440 1,684 Federal agency (2) 12,501 12,501 Repurchase agreements (4) 80,000 25,000 Term auction credit 415,302 415,302 Other loans 288,702 288,644Net portfolio holdings of Commercial PaperFunding Facility LLC (5) 270,879 270,879Net portfolio holdings of Maiden Lane LLC (6) 26,919 26,919Items in process of collection 1,115 -3,250Bank premises 2,178 64Other assets (7) 599,780 560,932
Change SinceWednesday Wednesday
Liabilities 19-Nov-08 21-Nov-07Federal Reserve notes, net of F.R. Bank holdings 828,617 42,240Reverse repurchase agreements (8) 102,909 67,526Deposits 1,209,231 1,182,538 Depository institutions 630,492 609,525 U.S. Treasury, general account 68,457 63,133 U.S. Treasury, supplementary financing account 508,956 508,956 Foreign official 183 87 Other 1,143 837Deferred availability cash items 2,742 -346Other liabilities and accrued dividends (9,10) 4,194 -1,702
Total liabilities 2,147,694 1,290,257
Capital accountsCapital paid in 20,373 2,284Surplus 17,166 1,709Other capital accounts 3,453 -35
Total capital 40,992 3,959

Monetary Base, SA, BA
500000
600000
700000
800000
900000
1000000
1100000
12000002
00
1-0
1
20
01
-06
20
01
-11
20
02
-04
20
02
-09
20
03
-02
20
03
-07
20
03
-12
20
04
-05
20
04
-10
20
05
-03
20
05
-08
20
06
-01
20
06
-06
20
06
-11
20
07
-04
20
07
-09
20
08
-02
20
08
-07
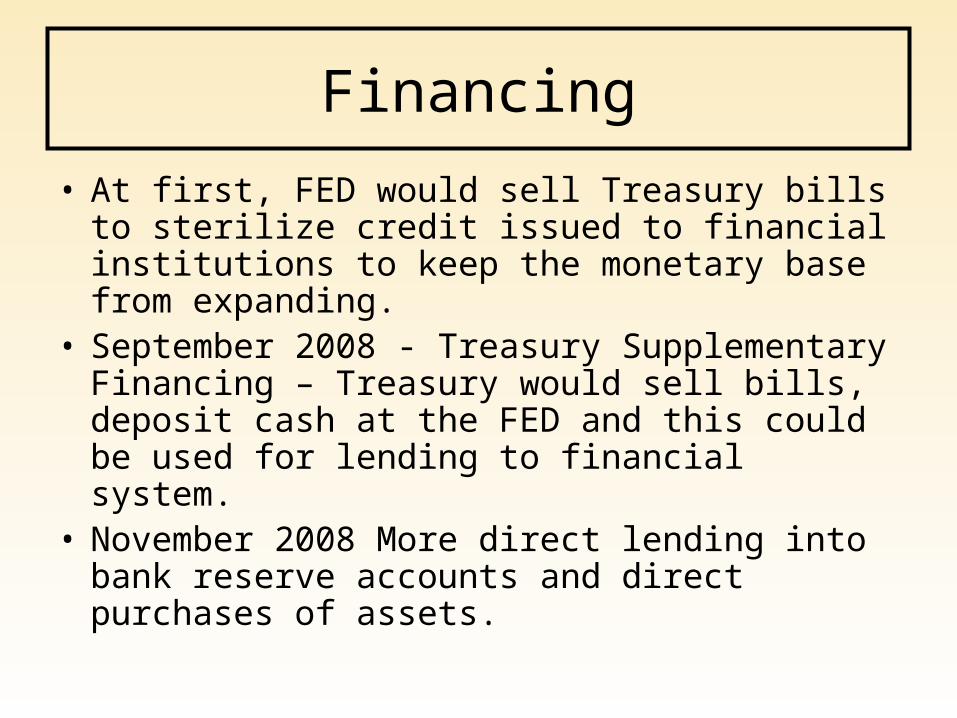
Financing
• At first, FED would sell Treasury bills to sterilize credit issued to financial institutions to keep the monetary base from expanding.
• September 2008 - Treasury Supplementary Financing – Treasury would sell bills, deposit cash at the FED and this could be used for lending to financial system.
• November 2008 More direct lending into bank reserve accounts and direct purchases of assets.

0.00
0.50
1.00
1.50
2.00
2.50
3.00
3.50
7/1
/20
08
7/8
/20
08
7/1
5/2
00
8
7/2
2/2
00
8
7/2
9/2
00
8
8/5
/20
08
8/1
2/2
00
8
8/1
9/2
00
8
8/2
6/2
00
8
9/2
/20
08
9/9
/20
08
9/1
6/2
00
8
9/2
3/2
00
8
9/3
0/2
00
8
10
/7/2
00
8
10
/14
/20
08
10
/21
/20
08
10
/28
/20
08
11
/4/2
00
8
11
/11
/20
08
11
/18
/20
08
Effective Target Discount Deposit
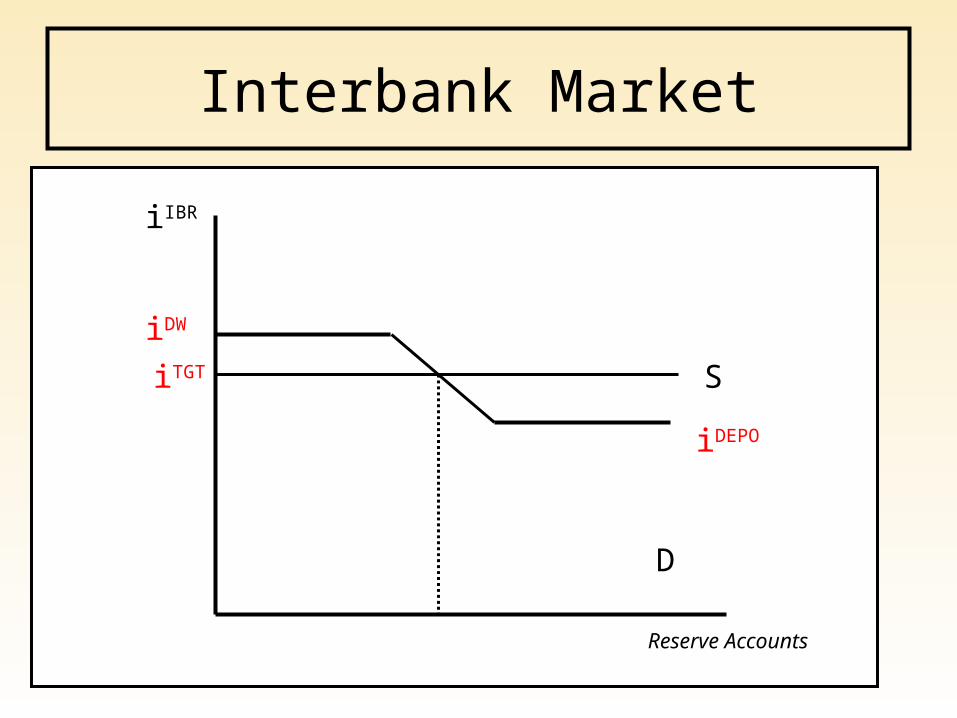
Interbank Market
S
D
iIBR
Reserve Accounts
iTGT
iDW
iDEPO

Quantitative Easing
S
D
iIBR
Reserve Accounts
iTGT
iDW
iDEPO
Purposes of Quantitative Easing
• Fed supports lending in Money Market eases liquidity crunch.
• Fed accepts CDO’s and CMO’s as collateral to increase liquidity in this market and reduce lemon’s problem.
• Fed absorbs risk of bank assets increasing capital cushion for other bank creditors to increase interbank lending.

Possible Side Effects
• Direct transfer of resources to banking sector.
• In the future, if there are losses, the central bank may need to increase the money supply.

TARP
• Troubled Asset Relief Program– Original plan, U.S. treasury by CDOs and
CMO’s and add liquidity to the market, narrow spreads and improve balance sheets.
– Current plan, US treasury buys preferred stock on generous terms from banks and I-banks and increase their capitalization.

Stock Market
0
5
10
15
20
25
30
35
40
45
50
1860 1880 1900 1920 1940 1960 1980 2000 2020
Year
Pri
ce-E
arni
ngs
Rat
io
0
2
4
6
8
10
12
14
16
18
20
Lon
g-T
erm
Int
eres
t R
ates
1901
1929
1966
2000
Price-Earnings Ratio
Long-Term Interest Rates
1981
1921

Global Spillovers
• Many banks in Europe took large positions in CDO’s and many European countries have offered deposit guarantees.
• American investment banks were large buyers in equity markets especially in Japan and there bankruptcy may have hurt demand for stocks and reduced liquidity.
• Banks earnings decline bringing down value of bank stocks directly.
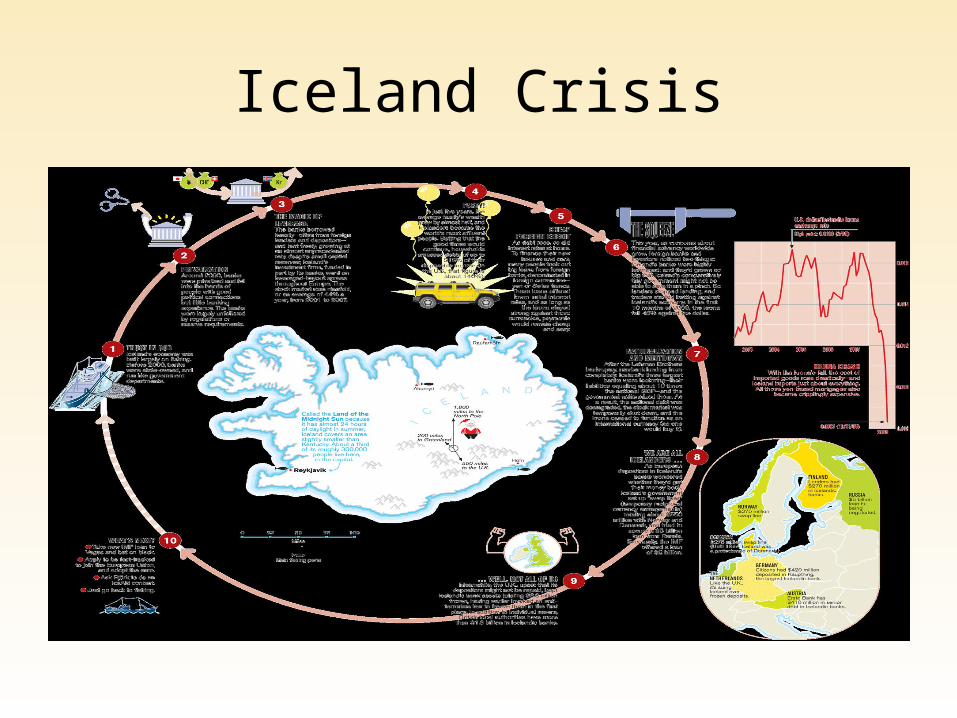
Iceland Crisis


Chinese Banking System
• Dominated by Four State Owned Deposit Money Taking Banks (Industrial and Commercial, Construction Bank, Agricultural Bank, Bank of China) (Deposit Money Bank)
• Other types of banks:1. Joint-Stock Commercial Bank (CITIC Industrial Bank,
Bank of Communications, Everbright)2. City Commercial Bank (Bank of Shanghai, Bank of
Beijing, Bank of Tianjian)3. Credit Cooperatives (Collective Banks – Urban and
Rural)4. Policy Banks (Export Import Bank, China Development
Bank)

Distribution of Assets: PRC
Share of Assets: China
0
10
20
30
40
50
60
70
SOE CommericalBank
State Policy Bank Joint StockCommercial Bank
Credit Cooperative City CommercialBank
Source: Mckinsey Global Institute
Characteristics of China’s financial market.
• Bank lending (especially by big 4) has traditionally been channeled to State Owned Enterprises (SOE’s) for policy reasons rather than traditional profit.
• SOE sector is declining.
• As a result, many of the loans made by Chinese banks go bad.
Importance as a Store of Wealth
• Chinese savers have limited options for storing their wealth. – Bond markets are limited and mutual funds
rare.– Stock markets not transparent and volatile. – Capital account closed. No legal foreign assets.
• As a result, huge share of savings channeled to the banking sector.
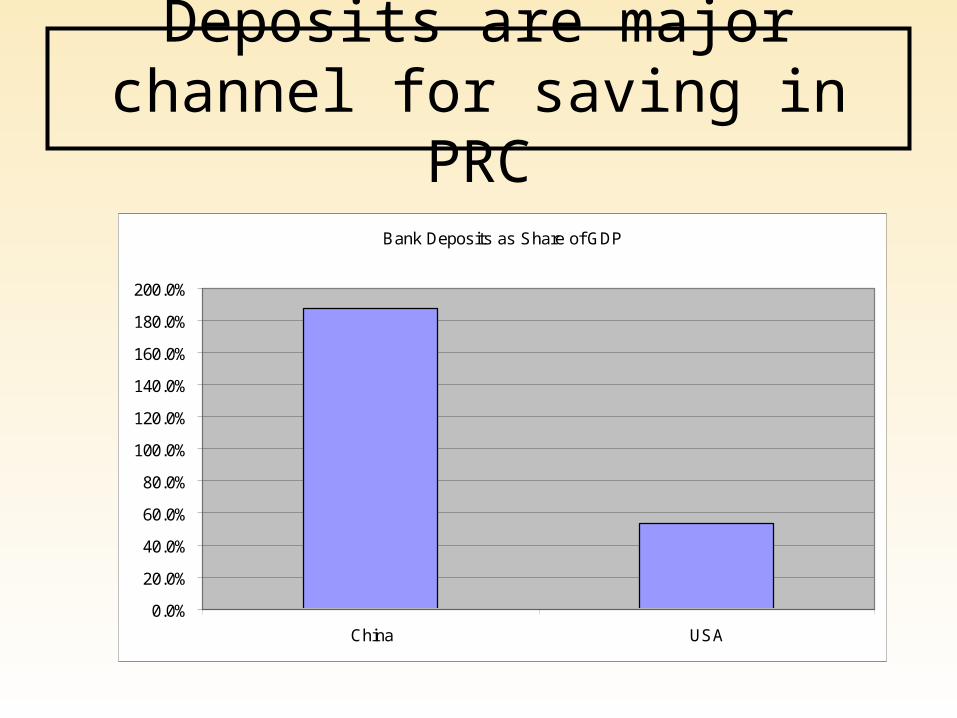
Deposits are major channel for saving in PRC
Bank Deposits as Share of GDP
0.0%
20.0%
40.0%
60.0%
80.0%
100.0%
120.0%
140.0%
160.0%
180.0%
200.0%
China USA

Banks on the Eve of Reform• Problem
– Many loans are made on a non-commercial basis. A large share of loans are non-performing.
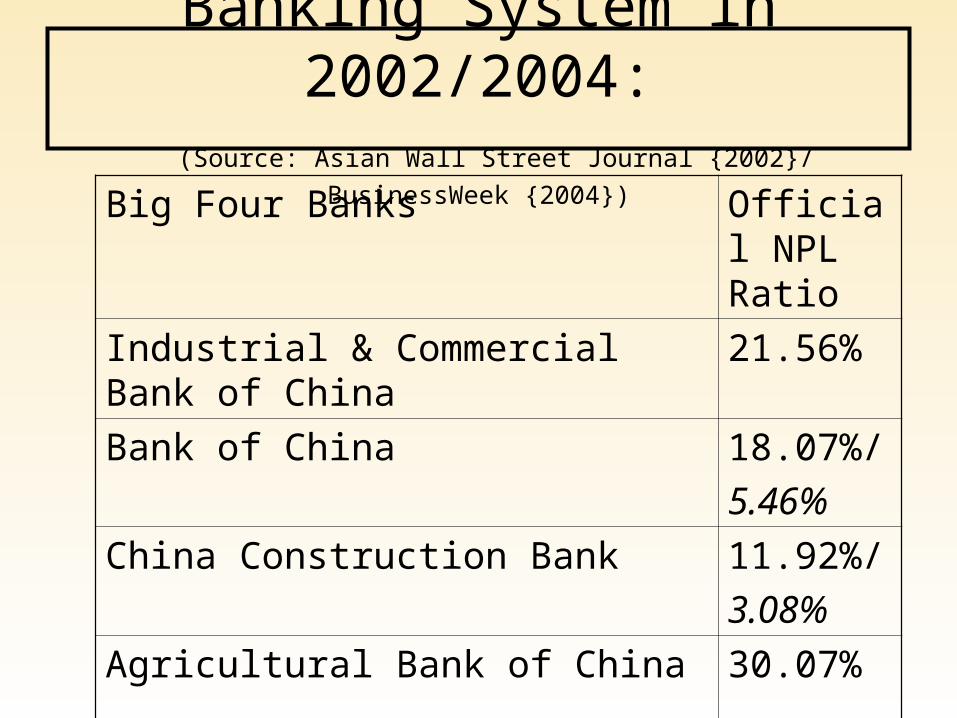
Banking System in 2002/2004: (Source: Asian Wall Street Journal {2002}/ BusinessWeek {2004})
Big Four Banks Official NPL Ratio
Industrial & Commercial Bank of China
21.56%
Bank of China 18.07%/
5.46%
China Construction Bank 11.92%/
3.08%
Agricultural Bank of China 30.07%

Reasons that NPL’s fell so fast
– [AMC’s] Asset Management Companies have purchased Yuan 1.4 Trillion worth of bad loans from banks.
– Credit Management : Banks have improved their lending practices.
– More Loans- Banks have gone on a lending binge and fresh loans may not have gone bad yet.
Share Sales
• Central government has a policy to make many of the banks publicly listed companies.
• Banks will sell shares to investors and the shares will trade in HK and must meet HK corporate governance standards.
• State will retain majority control.• Foreign banks will take strategic stakes to
help transfer their expertise.
Regulation
• Chinese Banking Regulatory Commission formed to regulate banking system in 2006.
• People’ Bank of China still regulates interest rates especially deposit rates and prime rates though banks set lending rates by creditworthiness.
• Foreign banks can set up operations in 8 large cities and can since 2006 accept deposits in Renminbi.

Final Exam
• Date: Thursday December 18
• Time: 8:30-11:30
• Venue: LG1
• Bring calculator, writing instrument
• Format: Same as practice exam, mid-term
• Coverage: Cumulative – Guidance (2/3 after the mid-term).