crisil research report employment eco insight aug 2011
DESCRIPTION
CRISIL Research Report Employment Eco Insight Aug 2011TRANSCRIPT

Economy Insights Economy Insights
August 2011Vidya Mahambare
Ramola Nadkarni
Employment in India
Uneven and Weak

Employment in India: Uneven and WeakA study by CRISIL Centre for Economic Research
Analytical contacts
Vidya Mahambare [email protected]
1
Employment in India: Uneven and weak Key points
• India needs at least 55 million additional jobs by 2015–twice the job addition between 2005 and 2010–to maintain the current ratio of employed people to total population of 39 per cent. The estimate assumes that the number of self-employed persons will decline by nearly 25.5 million, as it had happened during 2005-2010.
• With millions of people employed today either retiring or losing their jobs, new job hiring will have to
exceed 55 million by 2015. • For growth to be inclusive, employment intensity of production will have to increase. Employment
intensity– the number of employed persons per lakh of real GDP – declined to 1.05 in 2010 from 1.71 in 2005.
• Appropriate policies are needed to complement high growth for facilitating the required job creation. Easing
demand constraints in manufacturing through labour reforms and supply constraints in services through fast-track reforms in higher education will be the key for future job growth.
• Between 2005 and 2010 the addition in jobs was 27.7 million but the number of self-employed people
decreased by 25.5 million. This restricted the increase in number of employed people to 2.2 million. • The pattern of employment generation was lopsided during 2005-2010. In manufacturing - a crucial source of
jobs for relatively low-skilled labour - employment declined by nearly 7 per cent, despite a faster growth in manufacturing output. In services, employment growth slowed in financial intermediation and business services – a key source of salaried jobs. In contrast, employment grew by almost 70 per cent in the construction sector, but it was mainly in casual jobs.

2
Employment in India: Uneven and weak Creating job opportunities for those who choose to work is central to inclusive economic growth. An increase in job opportunities, in turn, encourages more working-age people to seek employment. This expands the pool of potential workers, a key input to faster economic growth. The NSSO (National Sample Survey Organisation) report on employment in India published in June 2011 provides the base data to assess the extent of job creation between 2005 and 2010. CRISIL Research has used data from the NSSO report and data on population projection for India to assess employment growth in the decade of 2000s, its characteristics and to estimate the addition to jobs required by 2015.1 Employment data available for India specifies only the net addition to employment – the difference between employment (self-employed + jobs) added and lost over a specified period. It does not provide data on new job hiring and jobs losses separately and same is true for self-employed The estimates for job additions presented here, thus, reflect the net impact of new job hiring minus jobs lost. Figure 1: Labour market dynamics
Population
Labour force
Employed Unemployed
Self employed Jobs
Regular Causal
Participation rate
Source: CRISIL Research
1 The estimates presented here are based on data from principal activity status (ps) and subsidiary activity status (ss) of employment. As per the NSSO definition, the usual principal status (ps) includes persons who have worked for a relatively long part of the 365 days preceding the date of survey. The subsidiary status (ss) includes those persons from among the remaining population who had worked at least for 30 days during the reference period of 365 days preceding the date of survey.
3
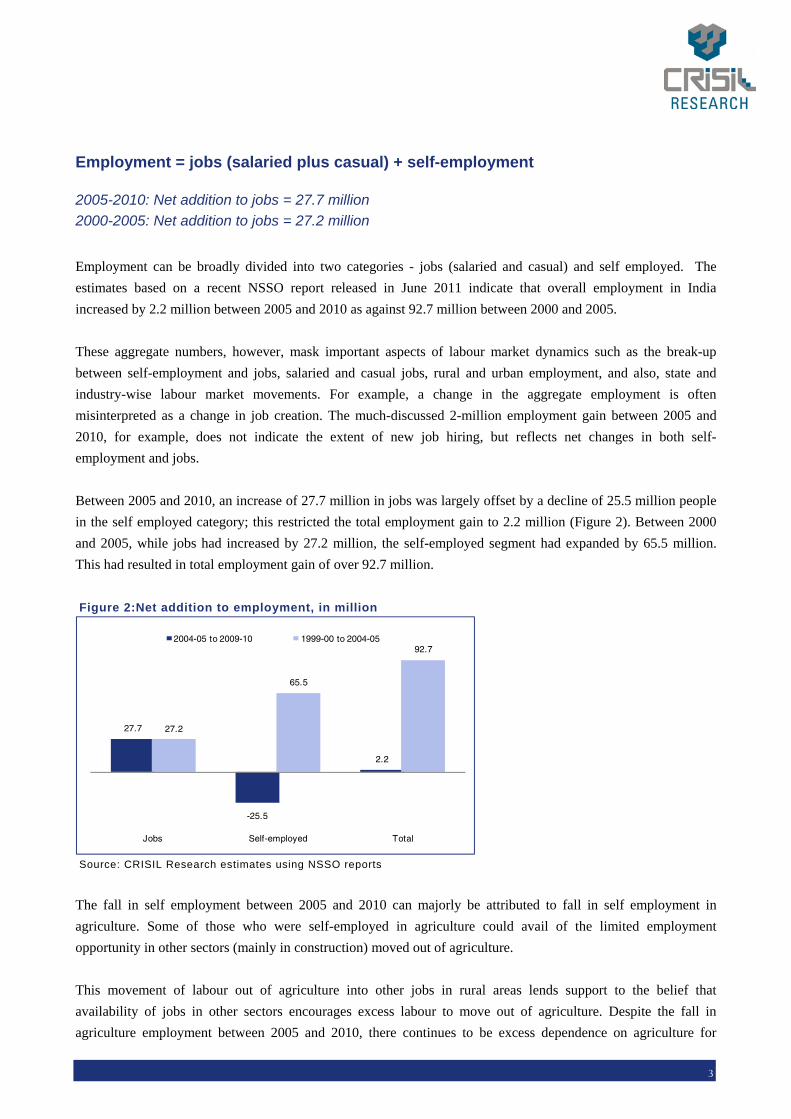
Employment = jobs (salaried plus casual) + self-employment
2005-2010: Net addition to jobs = 27.7 million 2000-2005: Net addition to jobs = 27.2 million
Employment can be broadly divided into two categories - jobs (salaried and casual) and self employed. The estimates based on a recent NSSO report released in June 2011 indicate that overall employment in India increased by 2.2 million between 2005 and 2010 as against 92.7 million between 2000 and 2005. These aggregate numbers, however, mask important aspects of labour market dynamics such as the break-up between self-employment and jobs, salaried and casual jobs, rural and urban employment, and also, state and industry-wise labour market movements. For example, a change in the aggregate employment is often misinterpreted as a change in job creation. The much-discussed 2-million employment gain between 2005 and 2010, for example, does not indicate the extent of new job hiring, but reflects net changes in both self-employment and jobs.
Between 2005 and 2010, an increase of 27.7 million in jobs was largely offset by a decline of 25.5 million people in the self employed category; this restricted the total employment gain to 2.2 million (Figure 2). Between 2000 and 2005, while jobs had increased by 27.2 million, the self-employed segment had expanded by 65.5 million. This had resulted in total employment gain of over 92.7 million.
Figure 2:Net addition to employment, in million
27.7
-25.5
2.2
27.2
65.5
92.7
Jobs Self-employed Total
2004-05 to 2009-10 1999-00 to 2004-05
Source: CRISIL Research estimates using NSSO reports
The fall in self employment between 2005 and 2010 can majorly be attributed to fall in self employment in agriculture. Some of those who were self-employed in agriculture could avail of the limited employment opportunity in other sectors (mainly in construction) moved out of agriculture.
This movement of labour out of agriculture into other jobs in rural areas lends support to the belief that availability of jobs in other sectors encourages excess labour to move out of agriculture. Despite the fall in agriculture employment between 2005 and 2010, there continues to be excess dependence on agriculture for

4
employment given its diminishing share in India’s GDP. The trend of a shift of labour out of agriculture into non-agriculture needs to accelerate. Table 1: Changes in employment, in million 2004-05 to 2009-10 1999-00 to 2004-05
Self employed
Jobs Self employed
Jobs
Regular Casual Total Regular Casual Total
Rural -23.8 0.2 17.6 17.8 46.7 4.9 5.4 10.3
Urban -1.6 5.5 4.3 9.8 18.8 13.7 3.2 16.9
Total -25.5 5.7 21.9 27.7 65.5 18.6 8.6 27.2
Source: CRISIL Research estimates using NSSO reports
Net addition to jobs between 2005 and 2010 was marginally higher as compared to the previous 5 years (Table 1). The job additions should have been significantly higher, given that the Indian economy had expanded at the average rate of 8.6 per cent between 2005 and 2010 compared to an average growth of 6.0 per cent between 2000 and 2005. The lower-than-hoped for addition to jobs during 2005 to 2010 could partially reflect the impact of the economic slowdown on private sector jobs during the last 2 years of the NSSO survey, following the global economic crisis. But it also reflects the exiting constraints to accelerating employment generation in India. With regard to pattern of job creation, the trend clearly shifted in favour of casual jobs during the second of the 2000s as compared to the first half, with nearly 22 million out of 27.7 million addition to jobs coming from casual jobs (Table 1). Rural-Urban job mix Rural India accounted for lion’s share of job additions from 2005 to 2010 In contrast to the first half of the decade, majority of the job additions from 2005 to 2010 took place in rural India. Of the 27.7 million job additions, rural areas accounted for nearly 17.8 million, which were largely in the form of casual jobs (Table 1). Further, nearly 80 per cent of increment in rural jobs came from six states – Uttar Pradesh, West Bengal, Andhra Pradesh, Rajasthan, Madhya Pradesh and Bihar. Barring Bihar and Andhra Pradesh, the economic growth of the remaining four states had been considerably lower than the India-average. But in all these states, the construction sector grew by an average of nearly 9 per cent during this period and most job additions in the rural areas of these states have been driven by the construction sector. Some of the people who have moved from agriculture to construction could have secured employment through social schemes like MNREGA, and have been counted under the ss status.

5
Sectoral-pattern of employment Decline in employment intensity, especially in manufacturing, is a concern
Figure 3: % share in employment
61.756.7
51.8
15.918.8
21.922.5 24.5 26.3
1999-00 2004-05 2009-10
Agriculture Industry Services
Source: CRISIL Research estimates using NSSO reports
Table 2 Level of employment Employment in million
1999-00 2004-05 2009-10
Agriculture 225 259 238
Industry 58 86 101
Manufacturing 39 56 52
Construction 16 26 44
Services 82 112 121
Total 365 458 460
Source: CRISIL Research estimates using NSSO reports
In services, addition to employment stood at a mere 8.6 million in the second half of the 2000s as compared to over 30 million in the first half though all service sectors grew faster in the second half of the decade(Table 2 & 3). In industry, too, addition to employment dropped to 14.7 million in the second half of the decade from 28.1 million in the first half. Within industry, manufacturing employment increased sharply from 39 million to 56 million in the first half of 2000s, but it dropped by nearly 4 million thereafter. As a result, the share of manufacturing in total employment declined to 11.4 per cent in 2010 from 12.2 per cent in 2005 (Figure 4) Construction was the only sector in which net addition to employment was higher in the second of the decade (18.2 million) as compared to the first half (10.2 million). The construction sector, which accounted for 8 per cent of India’s GDP in 2009-10, therefore raised its share in employment to 9.6 per cent in 2010 from 5.5 per cent in 2005 (Figure 4). It appears that in rural areas social sector schemes such as MNREGA and rural road programmes have substantially increased construction jobs.

6
Figure 4: % Share in total employment
10.7
12.211.4
4.3
5.7
9.6
1999-00 2004-05 2009-10
Manufacturing Construction
Source: CRISIL Research estimates using NSSO and CSO reports
Table 3 Sector-wise real GDP and net employment growth
2004-05 to 2009-10 1999-00 to 2004-05
Sectoral GDP
growth % Employment
growth,%
Sectoral GDP
growth %
Employment growth %
Agriculture 3.1 -8.2 1.8 15.2
Mining 4.1 4.7 4.8 27.7
Manufacturing 9.5 -6.3 6.5 43.4
Electricity & gas 7.2 -5.3 4.2 32.5
Construction 9.3 70.0 9.3 65.0
Trade & hotel 9.1 4.5 9.7 37.3
Transport & storage 12.8 10.8 43.3
Financial Intermediation & business services
12.0 31.4 6.7 90.6
Public admin, social services 8.2 5.4 5.0 25.5
Total 8.6 0.4 6.0 25.3
Total ex agriculture 9.8 11.8 7.3 41.5 Source: CRISIL Research estimates using NSSO and CSO reports
As a result of weak employment growth, employment intensity - measured as the number of employed persons per lakh of real GDP – declined to 1.05 during 2005-10 from 1.7 in the preceding five years (Figure 5). This remains a serious concern for a country that has the second largest working age population in the world, most of which continues to be low-skilled. For the much-desired inclusive economic growth, it needs to translate into a significant increase in jobs, especially in the manufacturing sector.

7
Figure 5: Employment Intensity = Number of persons employed per 1,00,000 Rs real output
5.11
5.43
4.30
0.970.80
1.18
0.73
1.081.24
0.750.47
1.71
1.05
1999
-200
0
2004
-05
2009
-10
1999
-200
0
2004
-05
2009
-10
1999
-200
0
2004
-05
2009
-10
1999
-200
0
2004
-05
2009
-10
1999
-200
0
2004
-05
2009
-10
1999
-200
0
2004
-05
2009
-10
Agriculture Industry Manufacturing Construction Services GDP
Source: CRISIL Research estimates using NSSO reports
Self-employment in manufacturing and services declines In addition to lower-than-hoped-for job creation, another area of concern emerging from our analysis is the apparent decline in entrepreneurship in the second half of 2000s. An analysis of data from the NSSO surveys reveals that, in the first half of 2000s, self-employment had surged by 65.5 million, while agriculture employment had increased by only 34.2 million (Table 4). This suggests that self-employment, or entrepreneurship, in other sectors had also increased substantially over this period. A study of industry-wise data indicates that the increase could have been driven by trade and hotels, and manufacturing sector. These two sectors had witnessed significant net additions to employment during this period. In the second half of 2000s, however, self-employment in sectors other than agriculture also appears to have declined. Table 4: Changes in employment in million 2004-05 to 2009-10 1999-00 to 2004-05
Self employed -25.5 65.5
Agriculture -21.3 34.2
Soruce: CRISIL Research estimates using NSSO reports
Projected addition to jobs required by economy Job additions of at least 55 million required by 2015 Despite higher economic growth in the second half of 2000s, India has not been able to generate sufficient number of jobs in manufacturing and services. The GDP growth increased to 8.6 per cent during 2005-10 from 6 per cent during 2000-05, but the net addition to jobs remained almost flat at around 27 million during the two time period. While net additions to jobs during the second half of the 2000s decade have been higher than the much-discussed 2 million number, this is clearly not enough to ensure inclusive growth. For example, even to maintain the current employed-to-population ratio, net additions to employment of nearly 30 million would be required between 2010 and 2015 vis-à-vis the 2.2 million increase between 2005 and 2010. And if we wish to move another 25 million move out of self-employment, which is largely restricted to agriculture in India, the country would require net job additions of nearly 55 million. This is two twice the number of job addition of 27.6 million between 2004-05 and 2009-10. Further, if the economy is to go back to the high employed-population ratio of 2005, net addition to jobs

8
would have to be to the tune of 88 million. Achieving this will pose an overwhelming challenge without appropriate policy support. Our analysis boils down to two questions - What policies would persuade existing firms to hire more? And what policies would create more number of firms across India and across sectors? The answers to these questions are well documented from the experiences of other countries including China. Large scale labour-intensive manufacturing units are a rarity in India, since the real cost of employing labour is high in manufacturing. For example, it is virtually impossible for a manufacturing company with more than 100 employees to fire any employee even if it is facing bankruptcy. Hence, demand for labour has not increased fast enough in manufacturing. In contrast, in the service sector, especially high-skilled services such as financial intermediation and business services, it is shortage of skilled labour that is constraining job creation. This is evident from the fact that wage growth in recent years in skill-intensive sectors has been strong. Understanding and alleviating constraints in labour demand in manufacturing and skilled labour supply in services would be the key for job growth. India’s economic policy urgently needs to address these issues to make the growth inclusive.
CRISIL Centre for Economic Research (C-CER)
l Macroeconomics:
y
l Financial Economics:
l Public Finance:
l Environmental Economics:
The Centre for Economic Research is a division of CRISIL. Set up in April 2002, C-CER reflects CRISIL’s
commitment to provide an integrated research offering to help corporates and policy makers take
more informed business decisions.
C-CER applies sound economic principles to real world applications, creating conceptual and
contextual linkages that are unique to CRISIL. C-CER also supports Standard & Poor’s Asia Pacific by
analysing and forecasting macroeconomic variables for 14 countries in the region.
C-CER’s core strengths emerge from a strong understanding of and capabilities in the following
areas:
Regular monitoring and forecasting of macroeconomic indicators,
assessment of domestic and global events, and analysis of long-term structural changes in the
econom
Analysis and forecasting of interest rates and exchange rates.
Analysis and forecasting of central and state government revenues,
expenditures and borrowing requirements.
Analysis of Indian firms’ impact on environmental, social and
governance parameters.
C-CER reviews developments in the Indian economy on a monthly basis and provides its outlook on
the economy through a dedicated publication “CRISIL EcoView”. CRISIL EcoView is used by CEOs,
CFOs, economists, corporate strategy teams, marketing teams, treasuries and knowledge
management teams of various corporates and management consultancy firms to make appropriate
strategy level decisions.
The C-CER team comprises senior economists with over a decade’s experience of working with
premier research institutes.
www.crisil.comCRISIL Ltd is a Standard & Poor's company
Head office
Regional offices in India
CRISIL House Central Avenue, Hiranandani Business Park Powai, Mumbai - 400 076Phone : 91-22-3342 3000 Fax : 91-22-3342 3001
AhmedabadUnit No.706, 7th Floor,Venus Atlantis, Near Reliance Petrol Pump,Prahladnagar, Ahmedabad 380 015. Phone: 91-79-4024 4500Fax: 91-79-2755 9863
BengaluruW-101, Sunrise Chambers, 22, Ulsoor Road, Bengaluru - 560 042Phone: 91 (80) 4244 5309Fax: 91 (80) 2559 4801
ChennaiThapar House, 43/44, Montieth Road, Egmore, Chennai - 600 008Phone: 91-44-2854 6205 - 06, 2854 6093Fax: 91-44-2854 7531
New DelhiThe Mira, G-1, 1st Floor, Plot No. 1 & 2Ishwar Nagar, Mathura Road,New Delhi - 110 065, India Phone: +91 (11) 4250 5100, 2693 0117-121Fax: +91 (11) 2684 2212/ 13
Hyderabad3rd Floor, Uma ChambersPlot No. 9&10, Nagarjuna Hills,(Near Punjagutta Cross Road) Hyderabad - 500 482Phone: 91-40-2335 8103 - 05Fax: 91-40-2335 7507
KolkataHorizon, Block 'B', 4th Floor57 Chowringhee RoadKolkata - 700 071Phone: 91-33-2289 1949-50, 5529 4501Fax: 91-33-2283 0597 Pune1187/17, Ghole Road,Shivaji Nagar, Pune - 411 005Phone: 91-20-2553 9064 - 67 Fax: 91-20-4018 1930
DisclaimerCRISIL Research, a division of CRISIL Limited (CRISIL) has taken due care and caution in preparing this Report based on the information obtained by CRISIL from sources which it considers reliable (Data). However, CRISIL does not guarantee the accuracy, adequacy or completeness of the Data / Report and is not responsible for any errors or omissions or for the results obtained from the use of Data / Report. This Report is not a recommendation to invest / disinvest in any company covered in the Report. CRISIL especially states that it has no financial liability whatsoever to the subscribers/ users/ transmitters/ distributors of this Report. CRISIL Research operates independently of, and does not have access to information obtained by CRISIL’s Ratings Division / CRISIL Risk and Infrastructure Solutions Limited (CRIS), which may, in their regular operations, obtain information of a confidential nature. The views expressed in this Report are that of CRISIL Research and not of CRISIL’s Ratings Division / CRIS. No part of this Report may be published / reproduced in any form without CRISIL’s prior written approval.
About CRISIL Limited
About CRISIL Research
CRISIL is a global analytical company providing ratings, research, and risk and policy advisory services. We are India's leading ratings agency. We are also the foremost provider of high-end research to the world's largest banks and leading corporations.
CRISIL Research is the country’s largest independent and integrated research house with strong domain expertise on Indian economy, industries and capital markets. We leverage our unique research platform and capabilities to deliver superior perspectives and insights to over 1200 domestic and global clients, through a range of research reports, analytical tools, subscription products and customised solutions.
CRISIL Privacy Notice CRISIL respects your privacy. We use your contact information, such as your name, address, and email id, to fulfill your request and service your account and to provide you with additional information from CRISIL and other parts of The McGraw-Hill Companies, Inc. you may find of interest.
For further information, or to let us know your preferences with respect to receiving marketing materials, please visit You can view McGraw-Hill's Customer Privacy Policy atwww.crisil.com/privacy. http://www.mcgraw-hill.com/site/tools/privacy/privacy_english.
Last updated: March 31, 2011