criminal justice research report - new york state … · office of justice research and performance...
TRANSCRIPT
Office of Justice Research and Performance Theresa Salo, Deputy Commissioner
September 2012
September 2012
New York State COMPAS-Probation Risk and Need
Assessment Study:
Examining the Recidivism Scale’s
Effectiveness and Predictive Accuracy
Prepared by Sharon Lansing, Ph.D.
Division of Criminal Justice Services
Office of Justice Research and Performance
Criminal Justice Research Report
Andrew M. Cuomo Michael C. Green Governor Executive Deputy Commissioner
This report presents findings from a study which examined the effectiveness and predictive accuracy of the New York
State COMPAS-Probation Recidivism Scale. This scale predicts the likelihood of rearrest for any felony or
misdemeanor offense over a two-year follow-up period for offenders under probation supervision. The study also
examined the prevalence of 19 risk/need factors among study cases and the extent to which these factors were
correlated with the likelihood of rearrest. Findings indicated that the Recidivism Scale was both effective and
predictively accurate (AUC = 0.71) with respect to the overall probation population. Furthermore, the likelihood of
rearrest generally increased with the severity of a given criminogenic risk/need.

i
Executive Summary
New York State COMPAS-Probation Risk and Needs Assessment Study:
Examining the Recidivism Scale’s Effectiveness and Predictive Accuracy The New York State COMPAS-Probation risk and
needs assessment system is used by all 57 probation
departments outside New York City. The assessment
system helps to better inform probation department
supervision planning for adult probationers, as well
as court decisions regarding pretrial release and
sanctions.
This study had two primary purposes. First, it
examined the effectiveness and predictive accuracy
of the New York State COMPAS-Probation
Recidivism Scale with respect to ANY (felony or
misdemeanor) rearrest. Second, it examined the
prevalence of COMPAS-Probation risk/need factors
among probationers and the extent to which these
factors were correlated with the likelihood of rearrest.
Study cases were drawn from 2009 probation
supervision admission cases representing 56
probation departments outside New York City. Of the
26,315 admission cases from these 56 counties,
16,303 (62%) were included in the study. Study cases
were representative of the 2009 admission cases from
which they were extracted.
The study found that the Recidivism Scale worked
effectively and achieved satisfactory predictive
accuracy.
■ Case distribution across the scale’s 10 decile
scores was as expected – each score generally
accounted for about 10% of study cases.
■ The rates for ANY rearrest increased with each
successive decile score (DS) in a linear manner,
climbing gradually from 9.1% for DS1 cases to
64.1% for DS10 cases – a span of 55 percentage
points.
■ Rearrest rates increased substantially with each
successive risk level:
– 16.9% for low risk cases;
– 32.7% for medium risk cases; and
– 53.8% for high risk cases.
■ Actual and expected rates for ANY rearrest were
closely aligned across decile scores.
■ The Recidivism Scale achieved an acceptable
level of predictive accuracy (0.71 AUC value).
Moreover, COMPAS-Probation effectively
partitioned cases by supervision levels. Rates for
ANY rearrest increased substantially with the
intensity of COMPAS-Probation “recommended”
supervision levels:
■ 17.5% for minimum supervision cases;
■ 32.3% for medium supervision cases;
■ 47.0% for medium supervision cases with a
possible override to high; and
■ 57.3% for high supervision cases.
As expected, rearrest rates for COMPAS-Probation’s
19 base risk/need scales were generally highest for
high-risk/need individuals. The five scales most
strongly correlated with the likelihood of ANY
rearrest included (beginning with the most strongly
correlated scale): History of Non-Compliance (with
conditions of pretrial release or sentence),
Educational/Vocational Problems, Criminal
Associates/Peers, Anger and Impulsivity.
Additional Analyses
There was interest in knowing how effectively the
scale estimated the likelihood of rearrest with respect
to offender age (historically, a strong predictor of
rearrest) and two subgroups with substantially
different rearrest rates – Penal Law cases (40.9%)
and Vehicle and Traffic Law (VTL) cases (15.9%).
The Recidivism Scale equation does not control for
possible differences in risk for these subgroups.
There was also interest in knowing what types of
offenses were associated with rearrest events.
With respect to offender age at assessment, the study
found that the Recidivism Scale somewhat UNDER-
estimated the likelihood of rearrest for offenders 16
to 18-years-old and substantially OVER-estimated
the likelihood of rearrest for offenders in their mid-
forties and onward. Importantly, though, the scale
captured the overall downward trend in the likelihood
of rearrest as age increased. Consequently, this
estimation problem should not reduce confidence in
the Recidivism Scale’s already proven effectiveness
and predictive accuracy. Any adjustments made to
the scale’s equation to correct this over/under-
estimation will increase its predictive accuracy.
ii
With respect to the Penal Law and VTL subgroups,
the Recidivism Scale achieved acceptable levels of
predictive accuracy (though slightly lower than that
for the full model) – the AUC value for each was
0.68. However, the study also found that the
likelihood of rearrest was somewhat UNDER-
estimated for certain Penal Law cases and
substantially OVER-estimated for certain VTL cases.
Action will be taken to correct this over/under
estimation. In the interim, it is important to remember
that the Recidivism Scale did a good job identifying
those cases of most concern – high-risk cases.
The substantial OVER-estimation of ANY rearrest
for VTL cases highlights an important fact – the
Recidivism Sale estimates the “general” risk of
rearrest – not the risk of rearrest for specific types of
offenses. The only risk-specific rearrest scale that is
currently available through COMPAS-Probation is
the Violence Scale which estimates the likelihood of
rearrest for a violent offense. Thus, it is important
that COMPAS-Probation users understand that VTL
cases represent a special offender population. This
means that a specialized assessment tool for
predicting the likelihood of rearrest for VTL alcohol-
related offenses should be included among the other
risk-specific assessment tools (e.g., those targeting
mental health problems, substance abuse, young
offenders and sex offenders) most probation
departments already use in conjunction with
COMPAS-Probation.
With respect to rearrest offenses, the study found that
rearrests for Penal Law drug offenses and VTL
alcohol-related offenses accounted for:
■ 10% and 8%, respectively, of the first rearrest
events associated with Penal Law non-drug
conviction cases;
■ 35% and 10%, respectively of the first rearrest
events associated with Penal Law drug
conviction cases; and
■ 12% and 25%, respectively of the first rearrest
events associated with VTL conviction cases.
The substantial percentage of drug offenses and VTL
alcohol-related offenses associated with each of three
probation supervision case types clearly illustrates
that conviction-offense type is not the sole indicator
for determining whether a risk-specific assessment is
warranted. Whether any type of risk-specific
assessment needs to be conducted is determined in
large part by an offender’s overall criminal and, when
available, clinical histories.

iii
Acknowledgements
The Division of Criminal Justice Services and the author of this report would like to thank everyone who
contributed to its preparation. Special thanks go to Terry Salo, the Division’s Deputy Commissioner for the Office
of Justice Research and Performance (OJRP), for dedicating the staff and resources required to produce this report.
Thanks also go to Robert Maccarone, the Division’s Deputy Directory for the Office of Probation and Correctional
Alternatives (OPCA), as well as OPCA’s Thomas Slater and Gary Govel, for the guidance and invaluable insights
each provided regarding the development and implementation of COMPAS-Probation. Northpointe researchers Bill
Dieterich and Bill Oliver also deserve special thanks for their support and helpful comments.
iv
Contents
Introduction ................................................................................................................................................................... 1
Study Purposes .............................................................................................................................................................. 1
Methods ......................................................................................................................................................................... 1
Data Sources.............................................................................................................................................................. 1
Study Cases ............................................................................................................................................................... 3
Measures ................................................................................................................................................................... 3
Analyses .................................................................................................................................................................... 3
Key Definitions ......................................................................................................................................................... 4
Case Representativeness ................................................................................................................................................ 5
Recidivism Scale ........................................................................................................................................................... 6
Supervision Classification Matrix ................................................................................................................................. 8
Base Risk/Need Scales ................................................................................................................................................ 10
Additional Analyses .................................................................................................................................................... 14
Age at Assessment .................................................................................................................................................. 14
Conviction Charge Laws ......................................................................................................................................... 15
Rearrest Offenses .................................................................................................................................................... 17
Summary of Key Findings ........................................................................................................................................... 18
Appendices
Appendix A: COMPAS-Probation Documents ........................................................................................................... 20
Appendix B: Additional Tables ................................................................................................................................... 35
Appendix C: Additional Figures .................................................................................................................................. 48
Appendix D: Penal Law Articles and Categories ........................................................................................................ 49
Tables
Table 1 Admission Cases (Source File) and Study Cases: Comparison of Case Characteristics ............................ 5
Table 2 Frequency and Percent Distributions by Recidivism Scale Decile Scores ................................................. 6
Table 3 Frequency and Percent Distributions by Recidivism Scale Risk Levels .................................................... 6
Table 4 Supervision Classification Matrix: Number of Cases ................................................................................ 8
Table 5 Supervision Classification Matrix: Rates for ANY Rearrest at Two Years ............................................... 9
Table 6 Study Cases with “Full COMPAS” Assessments (n=11,289): Risk/Need Scale Decile Score (DS) Cut-
Points and Percent and Frequency Distributions by Risk/Need Levels .................................................. 11
Table B1 Percent of 2009 Admission Cases Included in Study and Recidivism Scale Percent Distributions by
Probation Departments ............................................................................................................................. 36
Table B2 COMPAS-Probation Study Cases: Rearrest Rates for ANY Offense by Probation Department, Law and
Recidivism Scale Risk Level ................................................................................................................... 38
Table B3 Study Cases With "Full COMPAS" Assessments (n=11,289):* Rearrest Rates at Two Years for ANY
Offense by Scale Levels and Highest Risk/Need Decile Scores (DS) ..................................................... 40
Table B4 Study Cases With "Full COMPAS" Assessments (n=11,289): Percent of Cases Classified as High
Risk/Need by Probation Department and Risk/Need Scale Type and Scale ............................................ 41
Table B5 Study Cases With "Full COMPAS" Assessments (n=11,289): Pearson Correlations for ANY Rearrest at
Two Years, Recidivism Scale and Base Risk/Need Scales ...................................................................... 44
v
Table B6 COMPAS-Probation Study Cases: Actual and Expected Rearrest Rates for ANY Offense by Age at
Assessment .............................................................................................................................................. 46
Table B7 COMPAS-Probation Study Cases: Actual and Expected Rearrest Rates for ANY Offense by Recidivism
Scale Decile Scores and Law Type ......................................................................................................... 47
Figures
Figure 1 Rearrest Rates for ANY Offense During Two-Year Follow-up Period ..................................................... 7
Figure 2 Rearrest Rates for ANY Offense During Two-Year Follow-up Period: ACTUAL and EXPECTED
Rates .......................................................................................................................................................... 7
Figure 3 COMPAS-Probation Classification Matrix for Supervision-Level Recommendations ............................. 8
Figure 4 ANY Rearrest Rates at Two Years by Recommended Supervision Levels ............................................... 9
Figure 5 Rates for ANY Rearrest at Two Years for Criminal History Scales by Risk Levels ............................... 12
Figure 6 Rates for ANY Rearrest at Two Years for Personality Profile Scales by Risk Levels ............................ 12
Figure 7 Rates for ANY Rearrest at Two Years for Personal Development Scales by Risk Levels ...................... 12
Figure 8 Rates for ANY Rearrest at Two Years for Personal Support Network Scales by Risk Levels ................ 13
Figure 9 Rates for ANY Rearrest at Two Years for Social Environment by Risk Levels ...................................... 13
Figure 10 Rates for ANY Rearrest at Two Years for Cooperative Stance and Depression Scales by Risk Levels . 13
Figure 11 ACTUAL and EXPECTED Rates for ANY Rearrest at Two Years by Age at Assessment .................. 14
Figure 12 ACTUAL and EXPECTED Rates for ANY Rearrest at Two Years by Conviction Charge Law Type and
Recidivism Scale Decile Scores ............................................................................................................... 15
Figure 13 ACTUAL and EXPECTED Rates for ANY at Two Years Rearrest and Expected Risk-Level Ranges .. 16
Figure 14 All COMPAS-Probation Study Cases: Rates for ANY Rearrest at Two Years by Original Conviction
Charge Type ............................................................................................................................................. 17
Figure 15 Study Cases Involving Rearrests: Percent Distributions for First Rearrest Offense Type by Original
Conviction Charge Type .......................................................................................................................... 17
Figure C1 All COMPAS-Probation Study Cases: Recidivism Scale Frequency Distributions by Law Type and
Seriousness............................................................................................................................................... 48

1
New York State COMPAS-Probation Risk and Needs Assessment Study:
Examining the Recidivism Scale’s Effectiveness and Predictive Accuracy INTRODUCTION
New York State (NYS) COMPAS-Probation is a risk
and needs assessment software package for use with
adult offenders that was customized to address the
characteristics of the state’s probation population. It
helps to inform probation department decisions
regarding supervision intensity and service/treatment
interventions, as well as court decisions regarding
pretrial release and sanctions.
COMPAS-Probation adheres to the three core
principles of the risk-needs-responsivity model.1 The
risk principle focuses on who should be targeted for
intervention and matching the level of offender risk
to the intensity of treatment and services. The needs
principle focuses on accurately identifying and
targeting for intervention the personal, family and
social deficits (i.e., criminogenic needs) of an
offender which research has shown to increase the
likelihood of recidivism. The responsivity principle
focuses on maximizing an offender’s ability to
benefit from interventions by providing cognitive
behavioral treatment that is tailored to the offender’s
unique profile (e.g., gender, learning style,
motivation, strengths and abilities).
COMPAS-Probation was developed by Northpointe
Institute for Public Management Inc. in conjunction
with the Division of Criminal Justice Services’
(DCJS) Office of Probation and Correctional
Alternatives (OPCA) (formerly the NYS Division of
Probation and Correctional Alternatives). It was fully
implemented in December 2007 and is currently used
by all 57 county probation departments outside New
York City.
Using standardized assessment instruments,
COMPAS-Probation gathers information on
risk/need factors that past research has found to be
associated with three types of overall risk – failure to
1 Andrews, D.A., James Bonta, and R.D. Hoge. (1990).
Classification for effective rehabilitation: Rediscovering
psychology. Criminal Justice and Behavior, 17(1), 19-52.
Also see Andrews, D.A. and Dowden, C. (2007). The risk-
need-responsivity model of assessment and human service
in prevention and corrections: Crime-prevention
jurisprudence. Canadian Journal of Criminology and
Criminal Justice, 49(4) 439-464.
appear for a pretrial hearing, recidivism (i.e., rearrest
for a felony or misdemeanor offense), and violence
(rearrest for a violent offense).
This study assessed the predictive accuracy of only
one of the overall risk scales – Recidivism. There are
19 base risk/need scales associated with the
Recidivism Scale. These base scales and a
description of the Recidivism Scale are highlighted
on the next page.
STUDY PURPOSES
This study had two primary purposes.
■ First, it examined the effectiveness and
predictive accuracy of the New York State
COMPAS-Probation Recidivism Scale.
■ Second, it examined the prevalence of
COMPAS-Probation risk/need factors among
probationers and the extent to which these
factors were correlated with the likelihood of
rearrest.
It did not evaluate the COMPAS-Probation Violence
Scale because modifications made to the scale in July
2010 to improve its predictive accuracy did not allow
sufficient follow-up time for tracking rearrests.
METHODS
Data Sources
Data for this study were obtained from three
databases maintained by DCJS.
■ Probation supervision data came from the
Integrated Probation Registrant System (IPRS).
■ Criminal history data came from the
Computerized Criminal History (CCH) System.
■ Risk/need assessment data came from the
COMPAS-Probation database.
COMPAS-Probation cases were limited to those with
assessments conducted using one of the three
assessment instruments which gather data needed to
calculate the Recidivism Scale. All three instruments
also capture data for the Violence Scale, but only one
2
New York State COMPAS-Probation
Risk/Need Scales*
__________________________________________________________________________
OVERALL Risk Scales
■ Recidivism
BASE Risk/Need Scales
Criminal History
■ Criminal Involvement
■ History of Non-Compliance
■ History of Violence
Attitudes
■ Criminal Attitude
■ Resentful/Mistrust
■ Responsivity Problems
Associates
■ Few Pro-Social Peers
■ Criminal Associates/Peers
Personality
■ Impulsivity
■ Anger
Family
■ Few Family Supports
■ Family Criminality
Substance Abuse
■ Substance Abuse
Social Engagement
■ Life Goals/Idleness
■ Financial Problems
■ Educational/Vocational Problems
■ Social Environment
■ Social Isolation
Mental Health
■ Depression
________________________________________
*As categorized in the offender-based “COMPAS-
Probation Risk Assessment Report.” An example of this
report can be found in Appendix A.
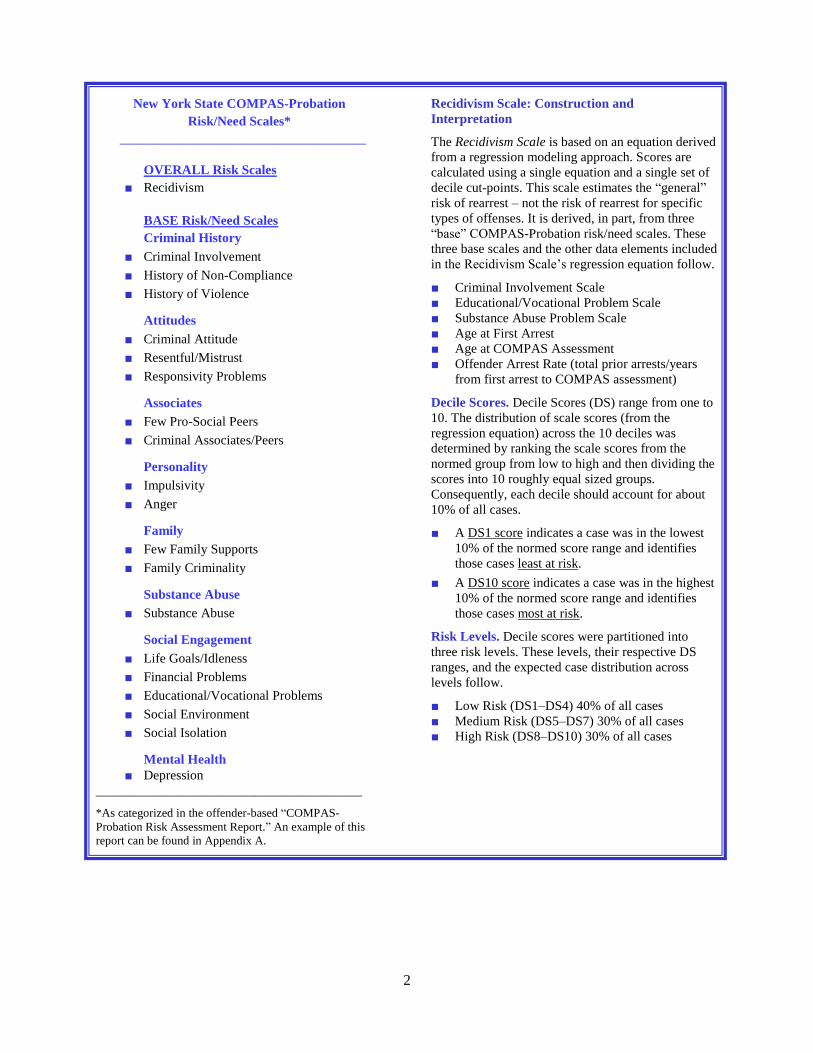
Recidivism Scale: Construction and
Interpretation
The Recidivism Scale is based on an equation derived
from a regression modeling approach. Scores are
calculated using a single equation and a single set of
decile cut-points. This scale estimates the “general”
risk of rearrest – not the risk of rearrest for specific
types of offenses. It is derived, in part, from three
“base” COMPAS-Probation risk/need scales. These
three base scales and the other data elements included
in the Recidivism Scale’s regression equation follow.
■ Criminal Involvement Scale
■ Educational/Vocational Problem Scale
■ Substance Abuse Problem Scale
■ Age at First Arrest
■ Age at COMPAS Assessment
■ Offender Arrest Rate (total prior arrests/years
from first arrest to COMPAS assessment)
Decile Scores. Decile Scores (DS) range from one to
10. The distribution of scale scores (from the
regression equation) across the 10 deciles was
determined by ranking the scale scores from the
normed group from low to high and then dividing the
scores into 10 roughly equal sized groups.
Consequently, each decile should account for about
10% of all cases.
■ A DS1 score indicates a case was in the lowest
10% of the normed score range and identifies
those cases least at risk.
■ A DS10 score indicates a case was in the highest
10% of the normed score range and identifies
those cases most at risk.
Risk Levels. Decile scores were partitioned into
three risk levels. These levels, their respective DS
ranges, and the expected case distribution across
levels follow.
■ Low Risk (DS1–DS4) 40% of all cases
■ Medium Risk (DS5–DS7) 30% of all cases
■ High Risk (DS8–DS10) 30% of all cases
3
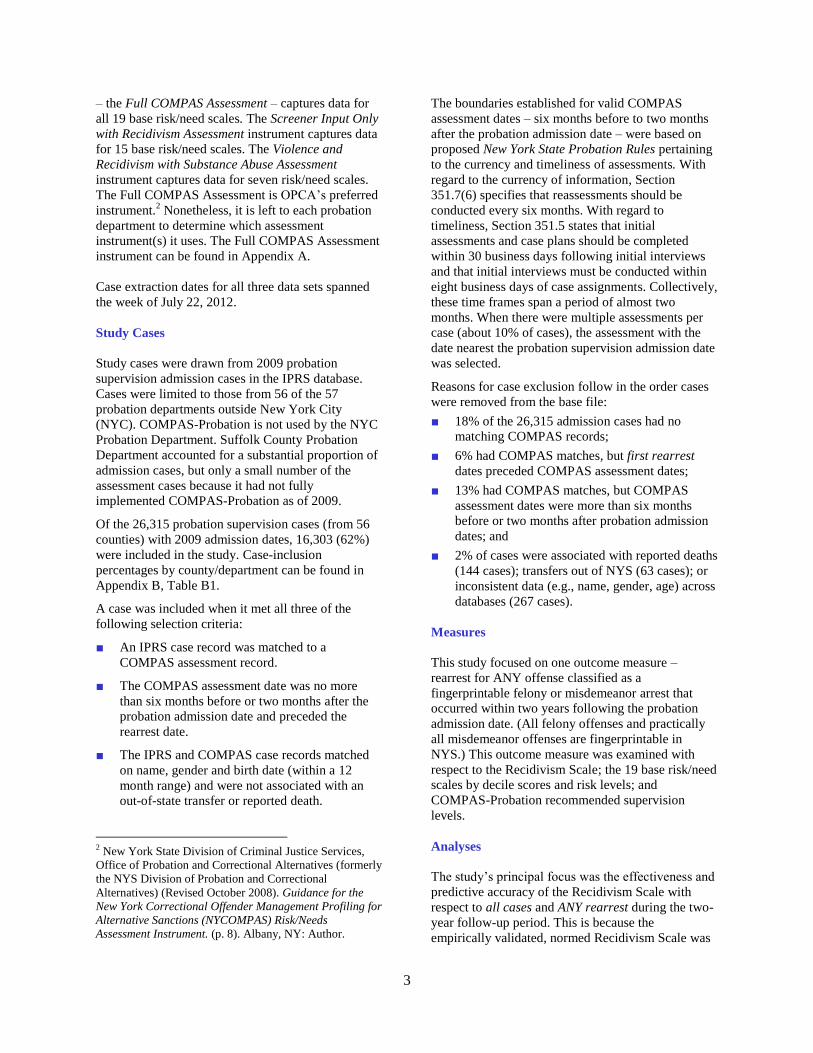
– the Full COMPAS Assessment – captures data for
all 19 base risk/need scales. The Screener Input Only
with Recidivism Assessment instrument captures data
for 15 base risk/need scales. The Violence and
Recidivism with Substance Abuse Assessment
instrument captures data for seven risk/need scales.
The Full COMPAS Assessment is OPCA’s preferred
instrument.2 Nonetheless, it is left to each probation
department to determine which assessment
instrument(s) it uses. The Full COMPAS Assessment
instrument can be found in Appendix A.
Case extraction dates for all three data sets spanned
the week of July 22, 2012.
Study Cases
Study cases were drawn from 2009 probation
supervision admission cases in the IPRS database.
Cases were limited to those from 56 of the 57
probation departments outside New York City
(NYC). COMPAS-Probation is not used by the NYC
Probation Department. Suffolk County Probation
Department accounted for a substantial proportion of
admission cases, but only a small number of the
assessment cases because it had not fully
implemented COMPAS-Probation as of 2009.
Of the 26,315 probation supervision cases (from 56
counties) with 2009 admission dates, 16,303 (62%)
were included in the study. Case-inclusion
percentages by county/department can be found in
Appendix B, Table B1.
A case was included when it met all three of the
following selection criteria:
■ An IPRS case record was matched to a
COMPAS assessment record.
■ The COMPAS assessment date was no more
than six months before or two months after the
probation admission date and preceded the
rearrest date.
■ The IPRS and COMPAS case records matched
on name, gender and birth date (within a 12
month range) and were not associated with an
out-of-state transfer or reported death.
2 New York State Division of Criminal Justice Services,
Office of Probation and Correctional Alternatives (formerly
the NYS Division of Probation and Correctional
Alternatives) (Revised October 2008). Guidance for the
New York Correctional Offender Management Profiling for
Alternative Sanctions (NYCOMPAS) Risk/Needs
Assessment Instrument. (p. 8). Albany, NY: Author.
The boundaries established for valid COMPAS
assessment dates – six months before to two months
after the probation admission date – were based on
proposed New York State Probation Rules pertaining
to the currency and timeliness of assessments. With
regard to the currency of information, Section
351.7(6) specifies that reassessments should be
conducted every six months. With regard to
timeliness, Section 351.5 states that initial
assessments and case plans should be completed
within 30 business days following initial interviews
and that initial interviews must be conducted within
eight business days of case assignments. Collectively,
these time frames span a period of almost two
months. When there were multiple assessments per
case (about 10% of cases), the assessment with the
date nearest the probation supervision admission date
was selected.
Reasons for case exclusion follow in the order cases
were removed from the base file:
■ 18% of the 26,315 admission cases had no
matching COMPAS records;
■ 6% had COMPAS matches, but first rearrest
dates preceded COMPAS assessment dates;
■ 13% had COMPAS matches, but COMPAS
assessment dates were more than six months
before or two months after probation admission
dates; and
■ 2% of cases were associated with reported deaths
(144 cases); transfers out of NYS (63 cases); or
inconsistent data (e.g., name, gender, age) across
databases (267 cases).
Measures
This study focused on one outcome measure –
rearrest for ANY offense classified as a
fingerprintable felony or misdemeanor arrest that
occurred within two years following the probation
admission date. (All felony offenses and practically
all misdemeanor offenses are fingerprintable in
NYS.) This outcome measure was examined with
respect to the Recidivism Scale; the 19 base risk/need
scales by decile scores and risk levels; and
COMPAS-Probation recommended supervision
levels.
Analyses
The study’s principal focus was the effectiveness and
predictive accuracy of the Recidivism Scale with
respect to all cases and ANY rearrest during the two-
year follow-up period. This is because the
empirically validated, normed Recidivism Scale was
4
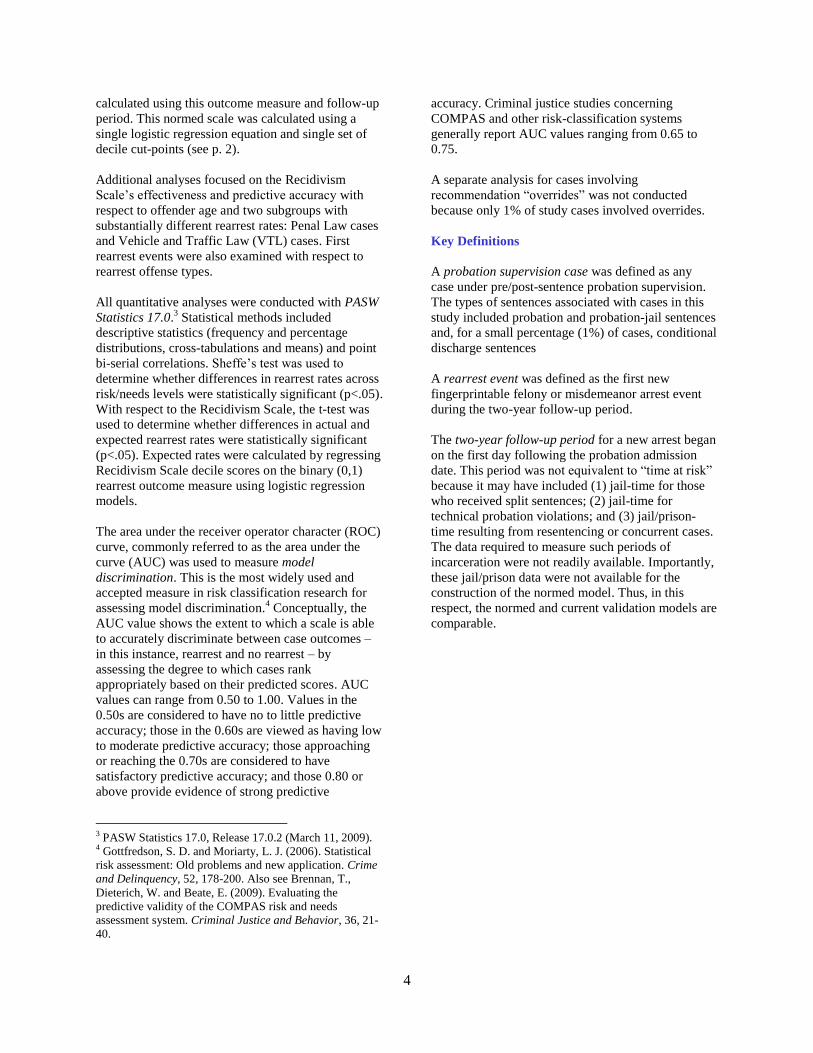
calculated using this outcome measure and follow-up
period. This normed scale was calculated using a
single logistic regression equation and single set of
decile cut-points (see p. 2).
Additional analyses focused on the Recidivism
Scale’s effectiveness and predictive accuracy with
respect to offender age and two subgroups with
substantially different rearrest rates: Penal Law cases
and Vehicle and Traffic Law (VTL) cases. First
rearrest events were also examined with respect to
rearrest offense types.
All quantitative analyses were conducted with PASW
Statistics 17.0.3 Statistical methods included
descriptive statistics (frequency and percentage
distributions, cross-tabulations and means) and point
bi-serial correlations. Sheffe’s test was used to
determine whether differences in rearrest rates across
risk/needs levels were statistically significant (p<.05).
With respect to the Recidivism Scale, the t-test was
used to determine whether differences in actual and
expected rearrest rates were statistically significant
(p<.05). Expected rates were calculated by regressing
Recidivism Scale decile scores on the binary (0,1)
rearrest outcome measure using logistic regression
models.
The area under the receiver operator character (ROC)
curve, commonly referred to as the area under the
curve (AUC) was used to measure model
discrimination. This is the most widely used and
accepted measure in risk classification research for
assessing model discrimination.4 Conceptually, the
AUC value shows the extent to which a scale is able
to accurately discriminate between case outcomes –
in this instance, rearrest and no rearrest – by
assessing the degree to which cases rank
appropriately based on their predicted scores. AUC
values can range from 0.50 to 1.00. Values in the
0.50s are considered to have no to little predictive
accuracy; those in the 0.60s are viewed as having low
to moderate predictive accuracy; those approaching
or reaching the 0.70s are considered to have
satisfactory predictive accuracy; and those 0.80 or
above provide evidence of strong predictive
3 PASW Statistics 17.0, Release 17.0.2 (March 11, 2009). 4 Gottfredson, S. D. and Moriarty, L. J. (2006). Statistical
risk assessment: Old problems and new application. Crime
and Delinquency, 52, 178-200. Also see Brennan, T.,
Dieterich, W. and Beate, E. (2009). Evaluating the
predictive validity of the COMPAS risk and needs
assessment system. Criminal Justice and Behavior, 36, 21-
40.
accuracy. Criminal justice studies concerning
COMPAS and other risk-classification systems
generally report AUC values ranging from 0.65 to
0.75.
A separate analysis for cases involving
recommendation “overrides” was not conducted
because only 1% of study cases involved overrides.
Key Definitions
A probation supervision case was defined as any
case under pre/post-sentence probation supervision.
The types of sentences associated with cases in this
study included probation and probation-jail sentences
and, for a small percentage (1%) of cases, conditional
discharge sentences
A rearrest event was defined as the first new
fingerprintable felony or misdemeanor arrest event
during the two-year follow-up period.
The two-year follow-up period for a new arrest began
on the first day following the probation admission
date. This period was not equivalent to “time at risk”
because it may have included (1) jail-time for those
who received split sentences; (2) jail-time for
technical probation violations; and (3) jail/prison-
time resulting from resentencing or concurrent cases.
The data required to measure such periods of
incarceration were not readily available. Importantly,
these jail/prison data were not available for the
construction of the normed model. Thus, in this
respect, the normed and current validation models are
comparable.
5
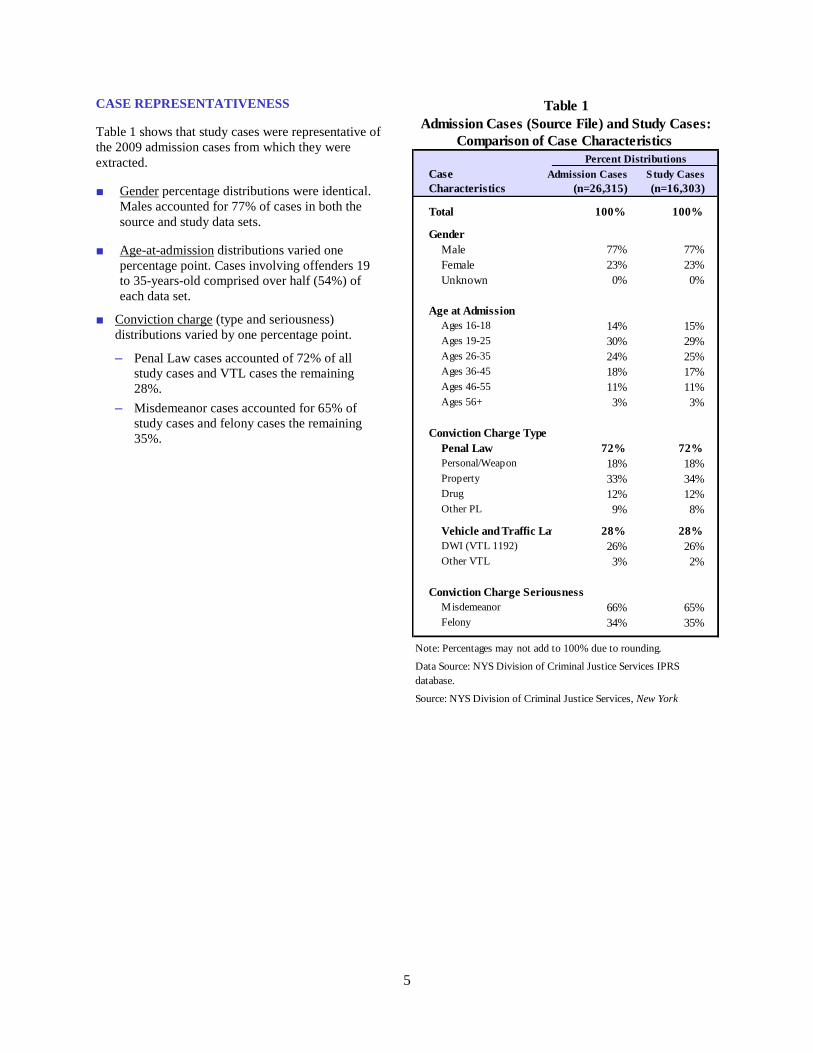
CASE REPRESENTATIVENESS
Table 1 shows that study cases were representative of
the 2009 admission cases from which they were
extracted.
■ Gender percentage distributions were identical.
Males accounted for 77% of cases in both the
source and study data sets.
■ Age-at-admission distributions varied one
percentage point. Cases involving offenders 19
to 35-years-old comprised over half (54%) of
each data set.
■ Conviction charge (type and seriousness)
distributions varied by one percentage point.
– Penal Law cases accounted of 72% of all
study cases and VTL cases the remaining
28%.
– Misdemeanor cases accounted for 65% of
study cases and felony cases the remaining
35%.
Case Admission Cases Study Cases
Characteristics (n=26,315) (n=16,303)
Total 100% 100%
Gender
Male 77% 77%
Female 23% 23%
Unknown 0% 0%
Age at Admission
Ages 16-18 14% 15%
Ages 19-25 30% 29%
Ages 26-35 24% 25%
Ages 36-45 18% 17%
Ages 46-55 11% 11%
Ages 56+ 3% 3%
Conviction Charge Type
Penal Law 72% 72%
Personal/Weapon 18% 18%
Property 33% 34%
Drug 12% 12%
Other PL 9% 8%
Vehicle and Traffic Law 28% 28%
DWI (VTL 1192) 26% 26%
Other VTL 3% 2%
Conviction Charge Seriousness
Misdemeanor 66% 65%
Felony 34% 35%
Note: Percentages may not add to 100% due to rounding.
Data Source: NYS Division of Criminal Justice Services IPRS
database.
Source: NYS Division of Criminal Justice Services, New York
State COMPAS-Probation Risk and Needs Assessment Study (2012).
Table 1
Admission Cases (Source File) and Study Cases:
Comparison of Case Characteristics
Percent Distributions
6
RECIDIVISM SCALE
The Recidivism Scale is an indicator of the overall
risk of ANY rearrest for cases under probation
supervision in New York State. The construction and
interpretation of this scale were discussed on page 2.
This study assessed the Recidivism Scale’s
effectiveness (i.e., calibration) and predictive
accuracy (i.e., discrimination). This Scale had to meet
four statistical criteria to be considered “effective”
and a fifth criterion to be considered “predictively
accurate.” To be considered effective:
1. Cases must near or achieve even distribution
across the 10 decile scores.
2. Rearrest rates must increase with each successive
decile score in a linear manner.
3. Rearrest rates must increase substantially (p<.05)
with each successive risk level.
4. Actual and expected (i.e., predicted) rearrest rates
must be closely aligned across decile scores.
To be considered predictively accurate:
5. The scale must produce an AUC value that nears
or achieves a value of 0.70 or higher (see
Methods).
The study found that the Recidivism Scale was both
effective and predictively accurate – it met all five
statistical criteria. Findings are presented below.
Effectiveness
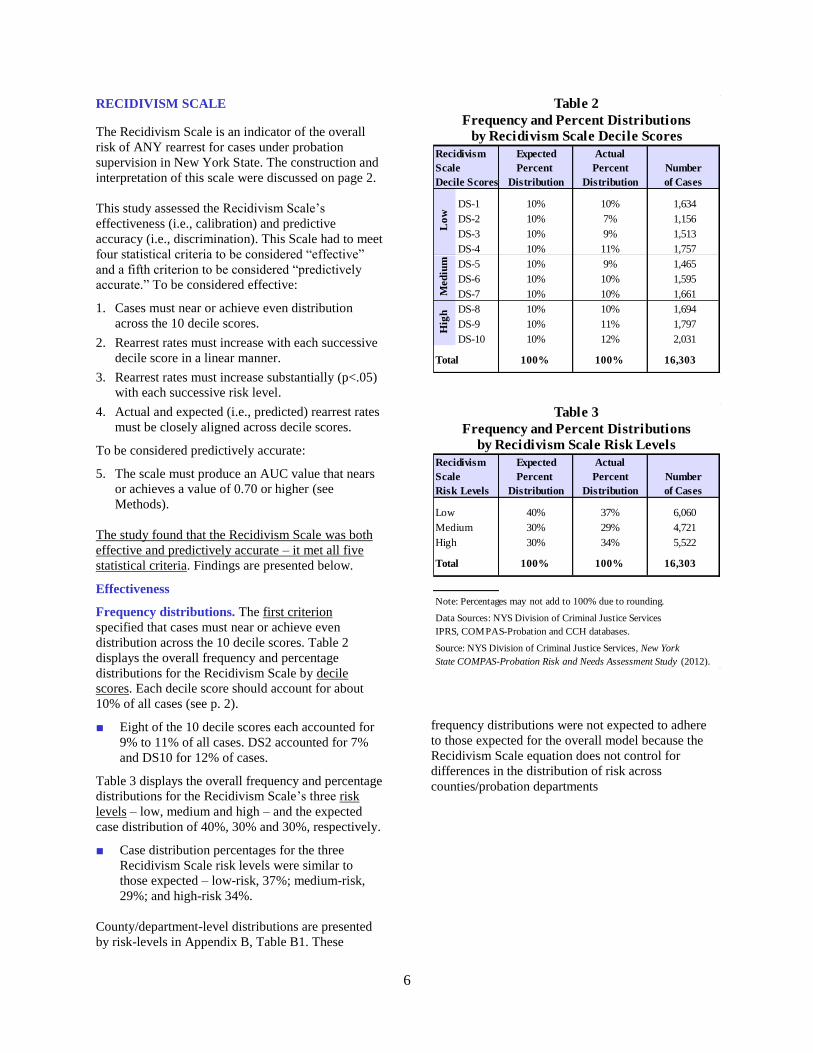
Frequency distributions. The first criterion
specified that cases must near or achieve even
distribution across the 10 decile scores. Table 2
displays the overall frequency and percentage
distributions for the Recidivism Scale by decile
scores. Each decile score should account for about
10% of all cases (see p. 2).
■ Eight of the 10 decile scores each accounted for
9% to 11% of all cases. DS2 accounted for 7%
and DS10 for 12% of cases.
Table 3 displays the overall frequency and percentage
distributions for the Recidivism Scale’s three risk
levels – low, medium and high – and the expected
case distribution of 40%, 30% and 30%, respectively.
■ Case distribution percentages for the three
Recidivism Scale risk levels were similar to
those expected – low-risk, 37%; medium-risk,
29%; and high-risk 34%.
County/department-level distributions are presented
by risk-levels in Appendix B, Table B1. These
frequency distributions were not expected to adhere
to those expected for the overall model because the
Recidivism Scale equation does not control for
differences in the distribution of risk across
counties/probation departments
Expected Actual
Percent Percent
Decile Scores Distribution Distribution
DS-1 10% 10% 1,634
DS-2 10% 7% 1,156
DS-3 10% 9% 1,513
DS-4 10% 11% 1,757
DS-5 10% 9% 1,465
DS-6 10% 10% 1,595
DS-7 10% 10% 1,661
DS-8 10% 10% 1,694
DS-9 10% 11% 1,797
DS-10 10% 12% 2,031
Total 100% 100% 16,303
Lo
wM
ed
ium
Hig
h
Frequency and Percent Distributions
Table 2
Scale Number
of Cases
by Recidivism Scale Decile Scores
Recidivism
Expected Actual
Percent Percent
Risk Levels Distribution Distribution
Low 40% 37% 6,060
Medium 30% 29% 4,721
High 30% 34% 5,522
Total 100% 100% 16,303
Note: Percentages may not add to 100% due to rounding.
Data Sources: NYS Division of Criminal Justice Services
IPRS, COMPAS-Probation and CCH databases.
Source: NYS Division of Criminal Justice Services, New York
State COMPAS-Probation Risk and Needs Assessment Study (2012).
of Cases
Recidivism
Scale Number
Table 3
Frequency and Percent Distributions
by Recidivism Scale Risk Levels

7
Rearrest rates. Criteria two and three specified that
(1) the likelihood of rearrest must increase with each
successive decile score in a linear manner and (2)
actual and expected (predicted) rearrest rates must
closely align across decile scores.
Figure 1 displays rearrest rates for ANY rearrest that
occurred during the two-year follow-up period.
■ The likelihood of ANY rearrest increased in a
linear manner with each successive decile score.
Rates gradually climbed from 9.1% for DS1 cases
to 64.1% for DS10 cases – a span of 55 percentage
points.
■ Rates for ANY rearrest also increased significantly
(p<.05) and substantially with each successive
Recidivism Scale risk level:
– 16.9% for low-risk cases;
– 32.7% for medium-risk cases; and
– 53.8% for high-risk cases.
As expected, there was substantial variation in rearrest
rates across county probation departments. These
county/department-level statistics can be found in
Appendix B, Table B2.
The fourth criterion specified that ACTUAL and
EXPECTED (i.e., predicted) rearrest rates must closely
align across decile scores. Figure 2 shows that these
rates achieved this objective.
Predictive Accuracy
The fifth criterion stipulated that the Recidivism Scale
must produce an AUC value that nears or achieves a
value of 0.70 or higher.
The Scale’s AUC value of 0.71 allowed it to be
classified as having “satisfactory” predictive accuracy
(see Methods).
16.9% 32.7% 53.8%
9.1%16.1% 19.1% 22.8%
28.1%33.1% 36.4%
42.6%
52.6%64.1%
0%
20%
40%
60%
80%
1 2 3 4 5 6 7 8 9 10
Rea
rres
t R
ate
s
Risk Level Rearrest Rate
Decile Score Rearrest Rate
Low Medium High
Recidivism Scale Decile Scores and Risk Levels
Figure 1
Rearrest Rates for ANY Offense During Two-Year Follow-up Period
Overall Rearrest Rate = 34.0%
Source: NYS Division of Criminal Justice Services, NYS COMPAS-Probation Risk and Needs Assessment Study (2012).
0%
20%
40%
60%
80%
1 2 3 4 5 6 7 8 9 10
Rea
rres
t R
ate
s ANY Rearrest Rate (ACTUAL)
EXPECTED Rearrest Rate
Low Medium High
Recidivism Scale Decile Scores and Risk Levels
Figure 2 Rearrest Rates for ANY Offense During Two-Year Follow-up Period:
ACTUAL and EXPECTED Rates
AUC = .71
Source: NYS Division of Criminal Justice Services, NYS COMPAS-Probation Risk and Needs Assessment Study (2012).

8
SUPERVISION CLASSIFICATION
MATRIX
The COMPAS-Probation
Classification Matrix for Supervision-
Level Recommendations in Figure 3
brings together the Recidivism Scale
with the Violence Scale. This matrix is
used to guide decisions regarding
supervision levels.
This two-dimensional classification
matrix provides a more discriminating
measure of the risk of rearrest for
supervision purposes in that it also
considers whether a rearrest event is
likely to involve the commission of a
violent crime such as robbery or
assault.
Matrix cells were statistically
partitioned to divide cases among four
“recommended” supervision levels
(Figure 3).
■ Minimum supervision
■ Medium supervision
■ Medium supervision – with
override considerations to High
■ High supervision
The decile scores for the Recidivism
Risk Scale (scores 1-10) define matrix
rows,5 while the decile scores for the
Violence Risk Scale (scores 1, 5 and 7-
10) define matrix columns. Violence
Scale decile scores reflect the fact that
violence is a less likely outcome for
most offenders. The scale jumps from
decile score 1 to 5 because the 9,687
offenders with no history of violence
were all assigned to DS1 (see Table 4).
Case Distributions
Table 4 shows the number of cases
assigned to each matrix cell based on
both their Recidivism Scale and
5 Unlike the Recidivism Scale’s low-risk
category which includes decile scores 1-4,
the “minimum supervision
recommendation” category includes
Recidivism Scale deciles scores 1-5.
1 5 7 8 9 10
1
2
3
4
5
6
7
8
9
10
* The Violence Scale was modified in July 2010.
Source: NYS Division of Criminal Justice Services, NYS COMPAS-Probation Risk and Needs
Assessment Study (2012).
Figure 3
Recid
ivis
m S
ca
le D
ecil
e S
co
res
Medium Supervision
Recommendation (With Override
Considerations to High)
COMPAS-Probation Classification Matrix for
Supervision-Level Recommendations
Violence Scale Decile Scores (Previous Scale)*
Medium Supervision
Recommendation (With Override
Considerations to High)
Minimum Supervision
Recommendation
Medium Supervision
Recommendation
High Supervision
Recommendation
1 5 7 8 9 10 Overall
1 1,307 138 76 53 25 35 1,634
2 873 114 60 45 28 36 1,156
3 1,061 185 96 70 51 50 1,513
4 1,168 213 128 90 64 94 1,757
5 947 174 129 103 53 59 1,465
6 955 203 152 121 66 98 1,595
7 933 250 169 115 74 120 1,661
8 900 288 144 130 87 145 1,694
9 827 307 203 140 101 219 1,797
10 716 339 269 191 159 357 2,031
9,687 2,211 1,426 1,058 708 1,213 16,303
* The Violence Scale was modified in July 2010.
Data Sources: NYS Division of Criminal Justice Services: IPRS, COMPAS-Probation and CCH databases.
Source: NYS Division of Criminal Justice Services, NYS COMPAS-Probation Risk and Needs Assessment
Study (2012).
Table 4
Recid
ivis
m S
ca
le D
ecil
e S
co
res
Supervision Classification Matrix: Number of Cases
Violence Scale Decile Scores (Previous Version)*
Overall

9
Violence Scale decile scores. Case
percentage distributions across the four
“recommended” supervision levels
(not shown) were:
■ 38%, minimum supervision;
■ 19%, medium supervision;
■ 33%, medium supervision – with
override consideration to high; and
■ 9%, high supervision.
Rates for ANY Rearrest
Rates for ANY rearrest increased with
each recommended supervision level
(Figure 4) and spanned 40 percentage
points:
■ 17.5%, minimum supervision;
■ 32.3%, medium supervision;
■ 47.0%, medium supervision – with
possible override to high; and
■ 57.3%, high supervision.
Rates differed significantly (p<.05) and
substantially (10 to 15 percentage
points) across each recommended
supervision level.
Matrix cells. Rearrest rates are
presented by matrix cells in Table 5.
The most straight-forward way to
evaluate the discriminatory ability of
the supervision classification matrix
with respect to the likelihood of ANY
rearrest is to compare rearrest rates
along the diagonal cells beginning with
the Recidivism DS1 and Violence DS1
cell (cell 1/1). These diagonal cells are
circled in Table 5. Moving along this
diagonal path from cell 1/1 to cell
10/10 the rates for ANY rearrest
steadily increase: 7.6%, 27.0% 40.2%,
44.6%, 49.5% and 66.1%.
The relatively smaller increases in
rates from cells 7/7 to 8/8 (40.2% to
44.6%, 4 percentage points) and cells
8/8 to 9/9 (44.6% to 49.5%, 5
percentage points) reflect the
shortcomings in the effectiveness and
predictive accuracy of the previous
Violence Scale.
17.5%
32.3%
47.0%
57.3%
N=
6,1
80
N=
3,1
51
N=
5,4
43
N=
1,5
29
0%
20%
40%
60%
80%
Minimum Medium Medium With
Override to High
High
Percen
t R
ea
rrest
ed
Figure 4
ANY Rearrest Rates at Two Years by
Recommended Supervision Levels
Source: NYS Division of Criminal Justice Services, NYS COMPAS-Probation Risk and Needs Assessment Study (2012)
Recommended Supervision Levels
Overall Rearrest Rate = 34.0%
1 5 7 8 9 10 Overall
1 7.6% 14.5% 17.1% 13.2% 12.0% 17.1% 9.1%
2 14.4% 20.2% 15.0% 28.9% 28.6% 19.4% 16.1%
3 17.8% 18.9% 22.9% 27.1% 15.7% 32.0% 19.1%
4 20.7% 22.5% 22.7% 33.3% 40.6% 26.6% 22.8%
5 26.7% 27.0% 31.8% 32.0% 32.1% 35.6% 28.1%
6 29.6% 38.4% 37.5% 36.4% 40.9% 39.8% 33.1%
7 34.8% 37.6% 40.2% 33.0% 37.8% 42.5% 36.4%
8 40.0% 42.0% 53.5% 44.6% 41.4% 48.3% 42.6%
9 50.9% 53.1% 58.6% 57.1% 49.5% 51.6% 52.6%
10 59.9% 62.8% 71.0% 67.0% 66.0% 66.1% 64.1%
28.2% 38.1% 43.9% 42.5% 43.5% 48.1% 34.0%
* The Violence Scale was modified in July 2010.
Data Sources: NYS Division of Criminal Justice Services: IPRS, COMPAS-Probation and CCH databases.
Source: NYS Division of Criminal Justice Services, NYS COMPAS-Probation Risk and Needs Assessment
Study (2012).
Recid
ivis
m S
ca
le D
ecil
e S
co
res
Violence Scale Decile Scores (Previous Version)*
Supervision Classification Matrix: Rates for Any Rearrest at Two Years
Table 5
Overall
10
BASE RISK/NEED SCALES
This section of the report focuses on the COMPAS-
Probation 19 base risk/need scales. Concise
explanations of scale meanings and treatment
implications can be found in Appendix A.
The base risk/need scales are considered descriptive
scales rather than predictive like the Recidivism
Scale. All but one of these scales (Depression) are
considered criminogenic indicators in that the
likelihood of rearrest is expected to increase with the
seriousness of the risk/need.6
This study examined (1) the prevalence of COMPAS-
Probation risk/need factors among probationers and
(2) the extent to which rates for ANY rearrest
increased with each successive risk/need level during
the two-year follow-up period.
The analysis of risk/need scales was limited to the
11,289 cases with “Full COMPAS” assessments – the
only assessment instrument that collects the data
needed to calculate all 19 base risk/need scales.7
Factor analysis was used to identify base scales that
were moderately to strongly correlated with each
other. Scales were partitioned into seven contextual
categories based on findings from this analysis.
■ Criminal History
■ Personality Profile
■ Personal Development
■ Personal Support Network
■ Social Environment
■ Cooperative Stance
■ Depression
These categories differ from those in the case-
specific assessment report (see page 2) produced by
COMPAS-Probation in that the latter categories were
subjectively, rather that statistically, determined. A
sample assessment report can be found in Appendix
A.
6 See Brennan, T., Dieterich, W. and Oliver, W. (2004).
The COMPAS scales: Normative data for males and
females in community and incarcerated samples.
Northpointe Institute for Public Management, Traverse
City Michigan. 7 Case distributions across risk/need levels for the other two
instruments – the Screener Input Only with Recidivism and
Violence and Recidivism with Substance Abuse – were
similar to those for the Full COMPAS.
Case Distributions
Table 6 presents frequency and percentage
distributions for the Recidivism Scale and the 19 base
scales by risk level (low, medium and high rearrest
likelihood) and need level (unlikely, probable and
highly probable likelihood of rearrest if no
intervention).
The decile cut-points that determined case
assignment to risk/need levels are also presented in
Table 6 for each scale. As Table 6 shows, there are
fewer than 10 decile scores for some scales. This is
because there was less overall variation in raw scores
for some base scales, making it impossible to divide
cases into 10 equal-sized groups.8 For example, 71%
of cases were assigned to DS1 for the History of
Violence Scale because the assessment found no
history of violence associated with these cases. A
statistical algorithm was used to determine how cases
with some history of violence were distributed across
the remaining nine decile scores, In this instance, the
algorithm distributed cases across four additional
decile scores, resulting in a scale with five decile
scores (1, 5, 8, 9 and 10) rather than all 10 scores.
Case percentage distributions were often largest for
low-risk/need cases because the assessment more
often found no or little evidence of a given risk/need.
Conversely, the Substance Abuse scale had the
largest percentage of cases (65%) classified as high
risk/need. This is because five decile scores (5-10)
comprised this high-need level rather than the three
deciles scores (8-10) that comprised the high-need
level for most other scales.
There were five scales where the highest risk level
accounted for more than one-third of all cases (Table
5):
■ Substance Abuse (65%),
■ Educational/Vocational Problems (41%),
■ Financial Problems (38%),
■ Responsivity Problems (38%), and
■ Family Criminality (35%).
8 See note 4 above. According to Northpointe, this was
“due to the granularity or “bunching” together of the
sampling distribution of the raw scores…” for some scales
(p. 13).

11
Risk Categories and Scales Low Medium High Low Medium High Low Medium High
Any Rearrest (Overall Risk) 1-4 5-7 8-10 35% 30% 34% 3,991 3,431 3,867
Criminal History
History of Non-compliance 1 5-7 8-10 46% 31% 23% 5,167 3,523 2,599
History of Violence 1 5 8-10 71% 11% 17% 8,066 1,284 1,939
Criminal Involvement 1-4 5-7 8-10 52% 26% 22% 5,920 2,903 2,466
Highly Highly Highly
Criminogenic Need Categories and Scales Unlikely Probable Probable Unlikely Probable Probable Unlikely Probable Probable
Personality Profile
Anger 1,4,5 7 8-10 66% 11% 23% 7,490 1,208 2,591
Impulsivity 1,2,3,5 6-7 8-10 62% 12% 27% 6,949 1,348 2,992
Resentment/Mistrust 1-5 6-7 8-10 62% 13% 25% 6,944 1,479 2,866
Social Isolation 1,5 6-7 8-10 60% 23% 17% 6,778 2,646 1,865
Personal Development
Educational/Vocational Problems* 1-5 6-7 8-10 40% 19% 41% 4,519 2,175 4,595
Idleness/Absence of Life Goals 1-5 6-7 8-10 56% 21% 23% 6,316 2,391 2,582
Financial Problems 1,3,4,5 6-7 8-10 44% 18% 38% 5,016 2,020 4,253
Personal Support Network
Criminal Associates/Peers 1 5,6 8 43% 35% 22% 4,812 3,975 2,502
Family Criminality 1,5 6-7 8-10 51% 14% 35% 5,793 1,592 3,904
Substance Abuse 1-2 3-4 5-10 16% 18% 65% 1,860 2,079 7,350
Social Environment
Neighborhood Crime/Disorganiztion 1-5 6-7 8-10 60% 17% 24% 6,717 1,911 2,661
Few Family Supports 1,5 6-7 8-10 58% 18% 24% 6,507 2,018 2,764
Few Pro-Social Peers 1,4 6-7 – 55% 45% NA 6,195 5,094 NA
Cooperative Stance
Responsivity Problems 1,2,3,5 6-7 8-10 35% 27% 38% 3,918 3,070 4,301
Criminal Attitude 1 6 8-10 49% 19% 32% 5,491 2,192 3,606
Highly Highly Highly
Non-Criminogenic Need Scale Unlikely Probable Probable Unlikely Probable Probable Unlikely Probable Probable
Depression 1,5 6-7 8-10 65% 12% 23% 7,355 1,312 2,622
* Cases with Screener Input Only or Violence and Recidivism assessments were excluded from the analysis presented in this table because they do not assess all risks/needs.
Data Sources: NYS Division of Criminal Justice Services, IPRS, COMPAS-Probation and CCH databases.
Source: NYS Division of Criminal Justice Services, NYS COMPAS-Probation Risk and Needs Assessment Study (2012).
Risk/Need Level
Study Cases With "Full COMPAS" Assessments (n=11,289):*
Percent and Frequency Distributions by Risk/Need Levels
Frequency DistributionsPercent DistributionsDecile Cut-Points for Risk Levels
Risk/Need Scale Decile Score (DS) Cut-Points and
Table 6
Risk/Need Level Risk/Need Level
12
Rates for ANY Rearrest
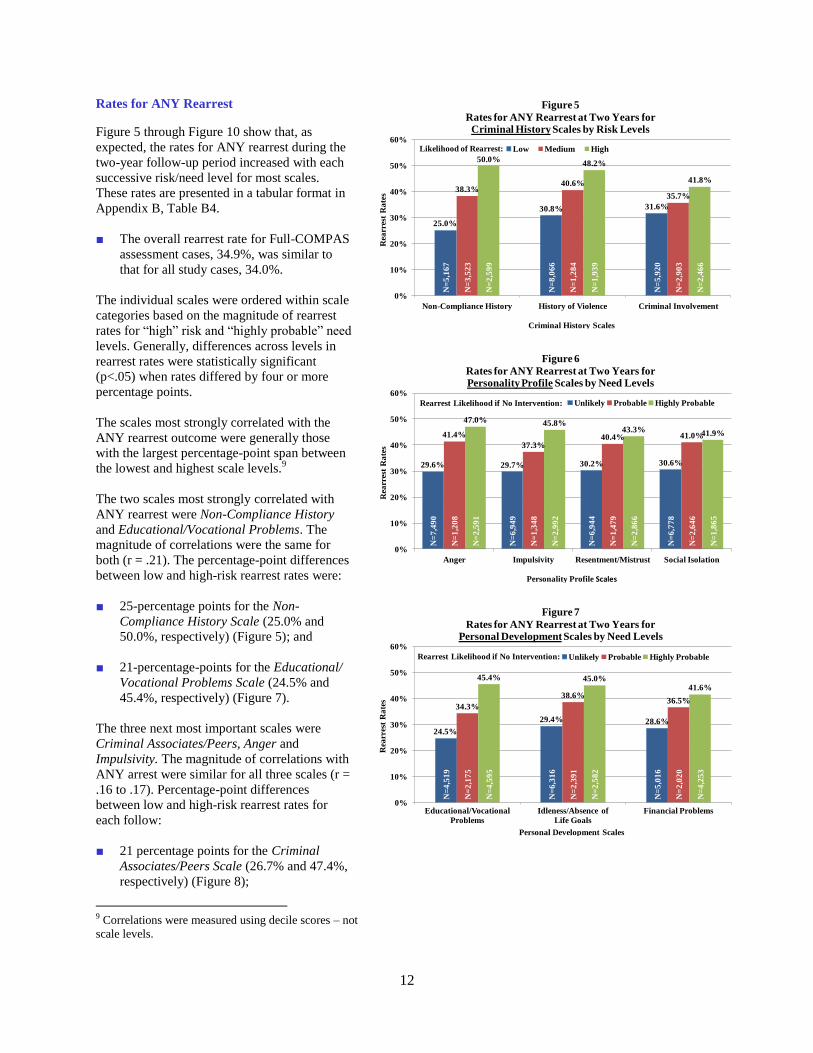
Figure 5 through Figure 10 show that, as
expected, the rates for ANY rearrest during the
two-year follow-up period increased with each
successive risk/need level for most scales.
These rates are presented in a tabular format in
Appendix B, Table B4.
■ The overall rearrest rate for Full-COMPAS
assessment cases, 34.9%, was similar to
that for all study cases, 34.0%.
The individual scales were ordered within scale
categories based on the magnitude of rearrest
rates for “high” risk and “highly probable” need
levels. Generally, differences across levels in
rearrest rates were statistically significant
(p<.05) when rates differed by four or more
percentage points.
The scales most strongly correlated with the
ANY rearrest outcome were generally those
with the largest percentage-point span between
the lowest and highest scale levels.9
The two scales most strongly correlated with
ANY rearrest were Non-Compliance History
and Educational/Vocational Problems. The
magnitude of correlations were the same for
both (r = .21). The percentage-point differences
between low and high-risk rearrest rates were:
■ 25-percentage points for the Non-
Compliance History Scale (25.0% and
50.0%, respectively) (Figure 5); and
■ 21-percentage-points for the Educational/
Vocational Problems Scale (24.5% and
45.4%, respectively) (Figure 7).
The three next most important scales were
Criminal Associates/Peers, Anger and
Impulsivity. The magnitude of correlations with
ANY arrest were similar for all three scales (r =
.16 to .17). Percentage-point differences
between low and high-risk rearrest rates for
each follow:
■ 21 percentage points for the Criminal
Associates/Peers Scale (26.7% and 47.4%,
respectively) (Figure 8);
9 Correlations were measured using decile scores – not
scale levels.
25.0%
30.8% 31.6%
38.3%40.6%
35.7%
50.0%48.2%
41.8%
N=
5,1
67
N=
8,0
66
N=
5,9
20
N=
3,5
23
N=
1,2
84
N=
2,9
03
N=
2,5
99
N=
1,9
39
N=
2,4
66
0%
10%
20%
30%
40%
50%
60%
Non-Compliance History History of Violence Criminal Involvement
Rea
rres
t R
ate
s
Low Medium High
Criminal History Scales
Figure 5
Rates for ANY Rearrest at Two Years for Criminal History Scales by Risk Levels
Likelihood of Rearrest:
29.6% 29.7% 30.2% 30.6%
41.4%
37.3%40.4% 41.0%
47.0% 45.8%43.3% 41.9%
N=
7,4
90
N=
6,9
49
N=
6,9
44
N=
6,7
78
N=
1,2
08
N=
1,3
48
N=
1,4
79
N=
2,6
46
N=
2,5
91
N=
2,9
92
N=
2,8
66
N=
1,8
65
0%
10%
20%
30%
40%
50%
60%
Anger Impulsivity Resentment/Mistrust Social Isolation
Rea
rres
t R
ate
s
Unlikely Probable Highly Probable
Personality Profile Scales
Figure 6
Rates for ANY Rearrest at Two Years for Personality Profile Scales by Need Levels
Rearrest Likelihood if No Intervention:
24.5%
29.4% 28.6%
34.3%
38.6%36.5%
45.4% 45.0%41.6%
N=
4,5
19
N=
6,3
16
N=
5,0
16
N=
2,1
75
N=
2,3
91
N=
2,0
20
N=
4,5
95
N=
2,5
82
N=
4,2
53
0%
10%
20%
30%
40%
50%
60%
Educational/Vocational
Problems
Idleness/Absence of
Life Goals
Financial Problems
Rea
rres
t R
ate
s
Unlikely Probable Highly Probable
Personal Development Scales
Figure 7
Rates for ANY Rearrest at Two Years for Personal Development Scales by Need Levels
Rearrest Likelihood if No Intervention:
13
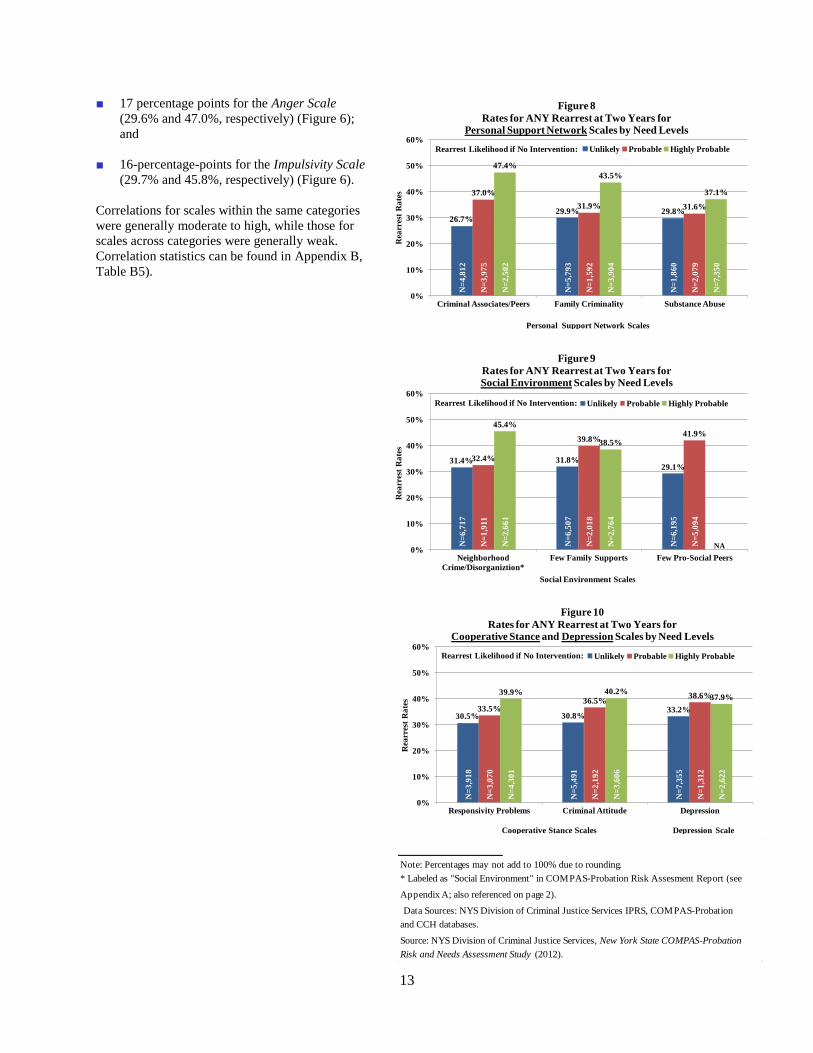
■ 17 percentage points for the Anger Scale
(29.6% and 47.0%, respectively) (Figure 6);
and
■ 16-percentage-points for the Impulsivity Scale
(29.7% and 45.8%, respectively) (Figure 6).
Correlations for scales within the same categories
were generally moderate to high, while those for
scales across categories were generally weak.
Correlation statistics can be found in Appendix B,
Table B5).
26.7%29.9% 29.8%
37.0%
31.9% 31.6%
47.4%
43.5%
37.1%
N=
4,8
12
N=
5,7
93
N=
1,8
60
N=
3,9
75
N=
1,5
92
N=
2,0
79
N=
2,5
02
N=
3,9
04
N=
7,3
50
0%
10%
20%
30%
40%
50%
60%
Criminal Associates/Peers Family Criminality Substance Abuse
Rea
rres
t R
ate
s
Unlikely Probable Highly Probable
Personal Support Network Scales
Figure 8
Rates for ANY Rearrest at Two Years for Personal Support Network Scales by Need Levels
Rearrest Likelihood if No Intervention:
31.4% 31.8%29.1%
32.4%
39.8%41.9%
45.4%
38.5%
N=
6,7
17
N=
6,5
07
N=
6,1
95
N=
1,9
11
N=
2,0
18
N=
5,0
94
N=
2,6
61
N=
2,7
64
0%
10%
20%
30%
40%
50%
60%
Neighborhood
Crime/Disorganiztion*
Few Family Supports Few Pro-Social Peers
Rea
rres
t R
ate
sUnlikely Probable Highly Probable
Social Environment Scales
Figure 9
Rates for ANY Rearrest at Two Years for Social Environment Scales by Need Levels
NA
Rearrest Likelihood if No Intervention:
30.5% 30.8%33.2%33.5%
36.5%38.6%39.9% 40.2%
37.9%
N=
3,9
18
N=
5,4
91
N=
7,3
55
N=
3,0
70
N=
2,1
92
N=
1,3
12
N=
4,3
01
N=
3,6
06
N=
2,6
22
0%
10%
20%
30%
40%
50%
60%
Responsivity Problems Criminal Attitude Depression
Rea
rres
t R
ate
s
Unlikely Probable Highly Probable
Cooperative Stance Scales Depression Scale
Figure 10
Rates for ANY Rearrest at Two Years for Cooperative Stance and Depression Scales by Need Levels
Rearrest Likelihood if No Intervention:
Note: Percentages may not add to 100% due to rounding.
Source: NYS Division of Criminal Justice Services, New York State COMPAS-Probation
Risk and Needs Assessment Study (2012).
and CCH databases.
Data Sources: NYS Division of Criminal Justice Services IPRS, COMPAS-Probation
* Labeled as "Social Environment" in COMPAS-Probation Risk Assesment Report (see
Appendix A; also referenced on page 2).
14
ADDITIONAL ANALYSES
The Recidivism Scale was found to
be a good predictor for the
likelihood of ANY rearrest for the
overall-case model – the Recidivism
Scale logistic regression model that
included all study cases. There was
interest, though, in knowing how
effectively the scale would be able
to estimate rearrest with respect to
offender age and subgroups with
substantially different rearrest rates.
There was also interest in looking at
the types of offenses for which
offenders were rearrested.
Age at Assessment
The purpose of the age-based
analysis was to determine how
effectively the Recidivism Scale was
able to estimate the likelihood of
ANY rearrest by age at assessment.
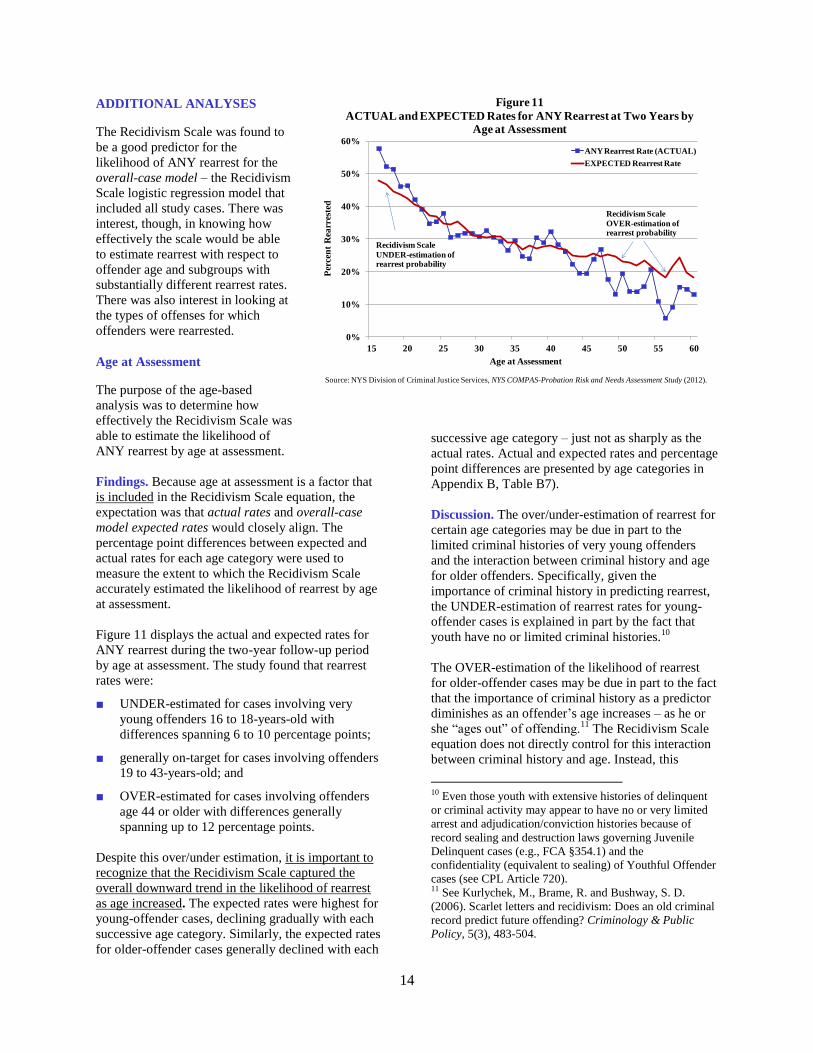
Findings. Because age at assessment is a factor that
is included in the Recidivism Scale equation, the
expectation was that actual rates and overall-case
model expected rates would closely align. The
percentage point differences between expected and
actual rates for each age category were used to
measure the extent to which the Recidivism Scale
accurately estimated the likelihood of rearrest by age
at assessment.
Figure 11 displays the actual and expected rates for
ANY rearrest during the two-year follow-up period
by age at assessment. The study found that rearrest
rates were:
■ UNDER-estimated for cases involving very
young offenders 16 to 18-years-old with
differences spanning 6 to 10 percentage points;
■ generally on-target for cases involving offenders
19 to 43-years-old; and
■ OVER-estimated for cases involving offenders
age 44 or older with differences generally
spanning up to 12 percentage points.
Despite this over/under estimation, it is important to
recognize that the Recidivism Scale captured the
overall downward trend in the likelihood of rearrest
as age increased. The expected rates were highest for
young-offender cases, declining gradually with each
successive age category. Similarly, the expected rates
for older-offender cases generally declined with each
successive age category – just not as sharply as the
actual rates. Actual and expected rates and percentage
point differences are presented by age categories in
Appendix B, Table B7).
Discussion. The over/under-estimation of rearrest for
certain age categories may be due in part to the
limited criminal histories of very young offenders
and the interaction between criminal history and age
for older offenders. Specifically, given the
importance of criminal history in predicting rearrest,
the UNDER-estimation of rearrest rates for young-
offender cases is explained in part by the fact that
youth have no or limited criminal histories.10
The OVER-estimation of the likelihood of rearrest
for older-offender cases may be due in part to the fact
that the importance of criminal history as a predictor
diminishes as an offender’s age increases – as he or
she “ages out” of offending.11
The Recidivism Scale
equation does not directly control for this interaction
between criminal history and age. Instead, this
10 Even those youth with extensive histories of delinquent
or criminal activity may appear to have no or very limited
arrest and adjudication/conviction histories because of
record sealing and destruction laws governing Juvenile
Delinquent cases (e.g., FCA §354.1) and the
confidentiality (equivalent to sealing) of Youthful Offender
cases (see CPL Article 720). 11 See Kurlychek, M., Brame, R. and Bushway, S. D.
(2006). Scarlet letters and recidivism: Does an old criminal
record predict future offending? Criminology & Public
Policy, 5(3), 483-504.
0%
10%
20%
30%
40%
50%
60%
15 20 25 30 35 40 45 50 55 60
Per
cen
t R
earr
este
d
Age at Assessment
ANY Rearrest Rate (ACTUAL)
EXPECTED Rearrest Rate
Figure 11
ACTUAL and EXPECTED Rates for ANY Rearrest at Two Years by Age at Assessment
Source: NYS Division of Criminal Justice Services, NYS COMPAS-Probation Risk and Needs Assessment Study (2012).
Recidivism Scale
UNDER-estimation of rearrest probability
Recidivism Scale
OVER-estimation of rearrest probability
15
phenomenon was addressed indirectly
with a variable – “offender arrest rate”
(total prior arrests/years from first
arrest to COMPAS assessment) –
which measured movement toward
desistance.
This estimation problem may also be
due in part to the fact that very young
offenders and older offenders were
under-represented in the probation
admissions data set used to construct
the Recidivism Scale equation.
This over/under-estimation will be
addressed through adjustments to the
Recidivism Scale equation. Again, it is
important to remember that the current
equation does a good job of capturing
the inverse relationship between age
and rearrest. Consequently, this
estimation problem should not reduce
confidence in the Recidivism Scale’s
effectiveness.
Furthermore, it is important to remember that young
adult offenders – because of their youth – comprise a
special population with needs not fully addressed by
COMPAS-Probation. In fact, the state recommends
that COMPAS-probation not be administered to
persons under the age of 17 because it is oriented
toward more independent adults. The NYS Youth
Assessment Screening Instrument (YASI) is the
preferred assessment instrument for offenders under
17 years of age. The YASI is valid, reliable and used
for offenders up to age 18 in most other states. Thus,
the use of YASI in conjunction with COMPAS-
Probation is recommended for young adult offenders.
Conviction Charge Laws
The purpose of the law-based analysis was twofold.
One purpose was to determine to what extent, if any,
the overall-case model was over/under estimating the
likelihood of rearrest for two subgroups – Penal Law
cases and VTL cases – with substantially different
rates for ANY rearrest (40.9% and 15.9%,
respectively). The other purpose was to examine the
predictive accuracy of the Recidivism Scale with
respect to Penal Law and VTL cases using subgroup-
level regression models.
Findings. For this analysis, there was no expectation
of a close alignment between actual subgroup rates
and overall-case model expected rates, because
conviction charge law was not among the factors
included in the Recidivism Scale equation.12
Similarly, there was no expectation that cases would
be evenly distributed across decile scores. Frequency
distributions, which can be found in Appendix C,
Figure C1, show that the number of Penal Law cases
associated with each decile score increased with each
successive score, while the number of VTL cases
generally declined with each successive decile score.
The percentage point differences between the overall
expected rates and each subgroup's actual rates, as
well as the AUC values, were used to measure the
extent to which the Recidivism Scale accurately
estimated the likelihood of rearrest for cases in each
subgroup.
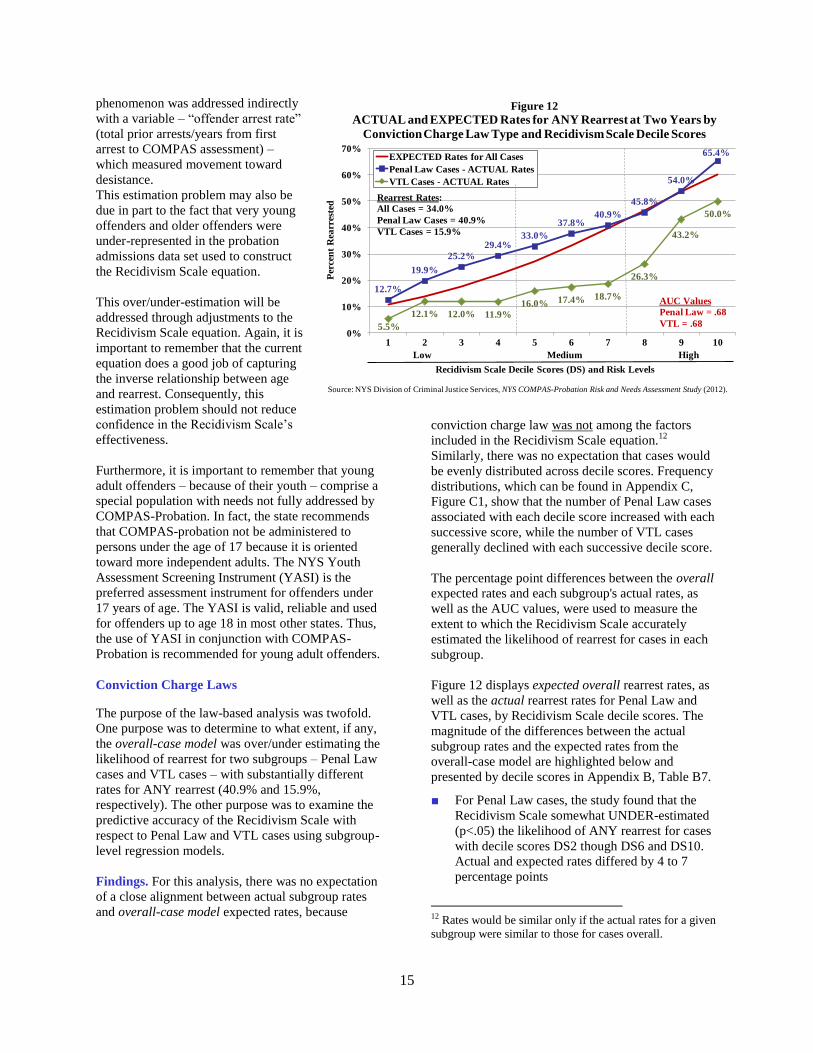
Figure 12 displays expected overall rearrest rates, as
well as the actual rearrest rates for Penal Law and
VTL cases, by Recidivism Scale decile scores. The
magnitude of the differences between the actual
subgroup rates and the expected rates from the
overall-case model are highlighted below and
presented by decile scores in Appendix B, Table B7.
■ For Penal Law cases, the study found that the
Recidivism Scale somewhat UNDER-estimated
(p<.05) the likelihood of ANY rearrest for cases
with decile scores DS2 though DS6 and DS10.
Actual and expected rates differed by 4 to 7
percentage points
12 Rates would be similar only if the actual rates for a given
subgroup were similar to those for cases overall.
12.7%
19.9%
25.2%
29.4%33.0%
37.8%40.9%
45.8%
54.0%
65.4%
5.5%
12.1% 12.0% 11.9%
16.0% 17.4% 18.7%
26.3%
43.2%
50.0%
0%
10%
20%
30%
40%
50%
60%
70%
1 2 3 4 5 6 7 8 9 10
Per
cen
t R
earr
este
d
EXPECTED Rates for All Cases
Penal Law Cases - ACTUAL Rates
VTL Cases - ACTUAL Rates
Low Medium High
Recidivism Scale Decile Scores (DS) and Risk Levels
Figure 12
ACTUAL and EXPECTED Rates for ANY Rearrest at Two Years by
Conviction Charge Law Type and Recidivism Scale Decile Scores
Rearrest Rates:
All Cases = 34.0%
Penal Law Cases = 40.9%
VTL Cases = 15.9%
Source: NYS Division of Criminal Justice Services, NYS COMPAS-Probation Risk and Needs Assessment Study (2012).
AUC Values
Penal Law = .68
VTL = .68
16
■ For VTL cases, the study found that
the Recidivism Scale substantially
OVER-estimated the likelihood of
rearrest for all but DS2 cases. Actual
and expected rates differed by 5 to 22
percentage points; DS4 through DS10
differences exceeded 10 percentage
points.
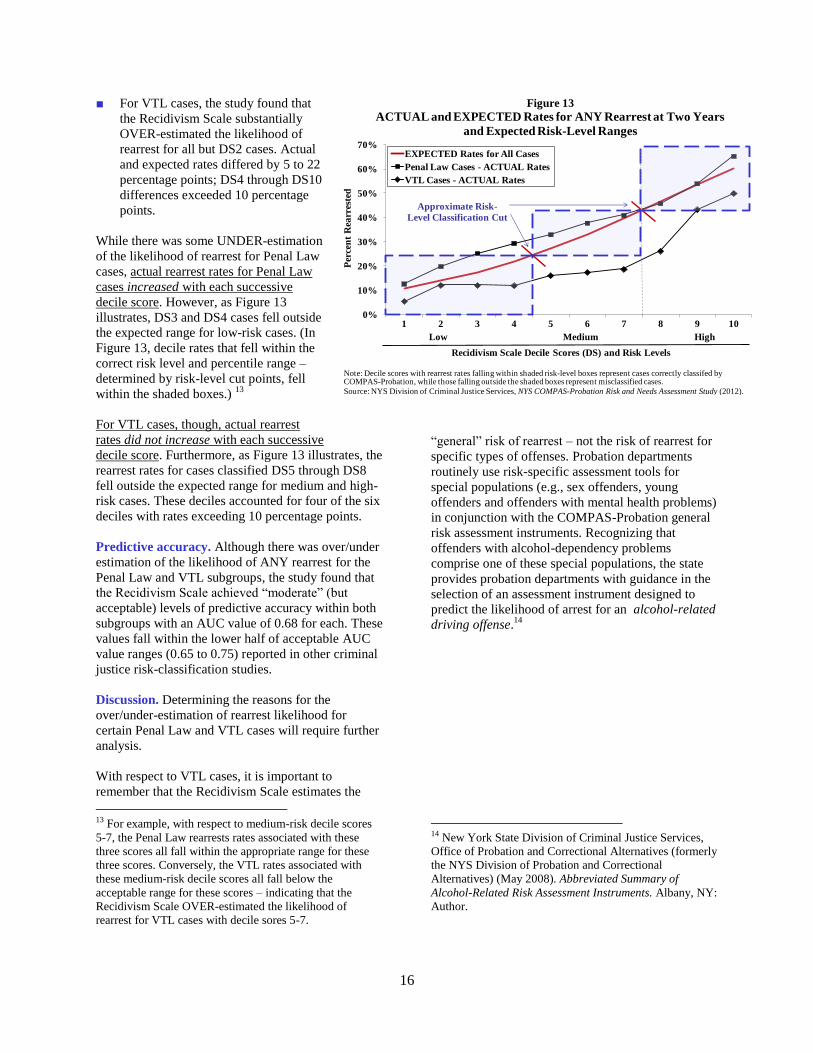
While there was some UNDER-estimation
of the likelihood of rearrest for Penal Law
cases, actual rearrest rates for Penal Law
cases increased with each successive
decile score. However, as Figure 13
illustrates, DS3 and DS4 cases fell outside
the expected range for low-risk cases. (In
Figure 13, decile rates that fell within the
correct risk level and percentile range –
determined by risk-level cut points, fell
within the shaded boxes.) 13
For VTL cases, though, actual rearrest
rates did not increase with each successive
decile score. Furthermore, as Figure 13 illustrates, the
rearrest rates for cases classified DS5 through DS8
fell outside the expected range for medium and high-
risk cases. These deciles accounted for four of the six
deciles with rates exceeding 10 percentage points.
Predictive accuracy. Although there was over/under
estimation of the likelihood of ANY rearrest for the
Penal Law and VTL subgroups, the study found that
the Recidivism Scale achieved “moderate” (but
acceptable) levels of predictive accuracy within both
subgroups with an AUC value of 0.68 for each. These
values fall within the lower half of acceptable AUC
value ranges (0.65 to 0.75) reported in other criminal
justice risk-classification studies.
Discussion. Determining the reasons for the
over/under-estimation of rearrest likelihood for
certain Penal Law and VTL cases will require further
analysis.
With respect to VTL cases, it is important to
remember that the Recidivism Scale estimates the
13 For example, with respect to medium-risk decile scores
5-7, the Penal Law rearrests rates associated with these
three scores all fall within the appropriate range for these
three scores. Conversely, the VTL rates associated with
these medium-risk decile scores all fall below the
acceptable range for these scores – indicating that the
Recidivism Scale OVER-estimated the likelihood of
rearrest for VTL cases with decile sores 5-7.
“general” risk of rearrest – not the risk of rearrest for
specific types of offenses. Probation departments
routinely use risk-specific assessment tools for
special populations (e.g., sex offenders, young
offenders and offenders with mental health problems)
in conjunction with the COMPAS-Probation general
risk assessment instruments. Recognizing that
offenders with alcohol-dependency problems
comprise one of these special populations, the state
provides probation departments with guidance in the
selection of an assessment instrument designed to
predict the likelihood of arrest for an alcohol-related
driving offense.14
14 New York State Division of Criminal Justice Services,
Office of Probation and Correctional Alternatives (formerly
the NYS Division of Probation and Correctional
Alternatives) (May 2008). Abbreviated Summary of
Alcohol-Related Risk Assessment Instruments. Albany, NY:
Author.
0%
10%
20%
30%
40%
50%
60%
70%
1 2 3 4 5 6 7 8 9 10
Per
cen
t R
earr
este
d
EXPECTED Rates for All Cases
Penal Law Cases - ACTUAL Rates
VTL Cases - ACTUAL Rates
Low Medium High
Recidivism Scale Decile Scores (DS) and Risk Levels
Figure 13
ACTUAL and EXPECTED Rates for ANY Rearrest at Two Years
and Expected Risk-Level Ranges
Note: Decile scores with rearrest rates falling within shaded risk-level boxes represent cases correctly classifed by COMPAS-Probation, while those falling outside the shaded boxes represent misclassified cases.
Source: NYS Division of Criminal Justice Services, NYS COMPAS-Probation Risk and Needs Assessment Study (2012).
Approximate Risk-
Level Classification Cut
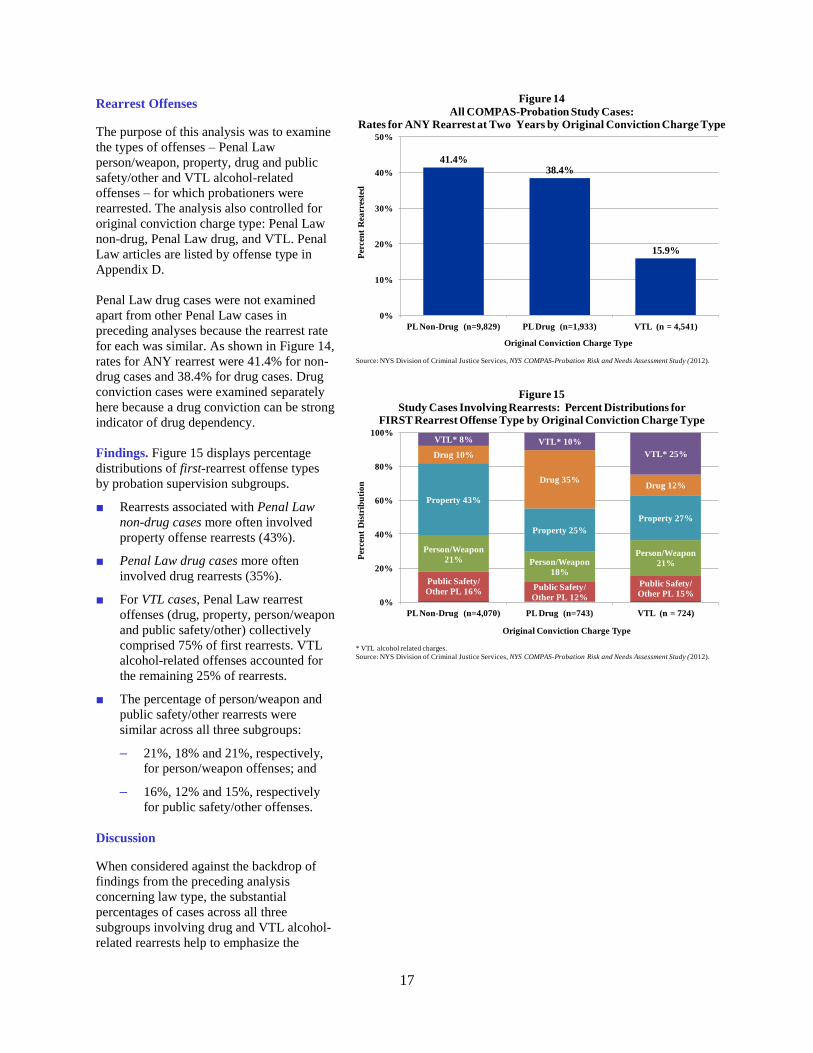
17
Rearrest Offenses
The purpose of this analysis was to examine
the types of offenses – Penal Law
person/weapon, property, drug and public
safety/other and VTL alcohol-related
offenses – for which probationers were
rearrested. The analysis also controlled for
original conviction charge type: Penal Law
non-drug, Penal Law drug, and VTL. Penal
Law articles are listed by offense type in
Appendix D.
Penal Law drug cases were not examined
apart from other Penal Law cases in
preceding analyses because the rearrest rate
for each was similar. As shown in Figure 14,
rates for ANY rearrest were 41.4% for non-
drug cases and 38.4% for drug cases. Drug
conviction cases were examined separately
here because a drug conviction can be strong
indicator of drug dependency.
Findings. Figure 15 displays percentage
distributions of first-rearrest offense types
by probation supervision subgroups.
■ Rearrests associated with Penal Law
non-drug cases more often involved
property offense rearrests (43%).
■ Penal Law drug cases more often
involved drug rearrests (35%).
■ For VTL cases, Penal Law rearrest
offenses (drug, property, person/weapon
and public safety/other) collectively
comprised 75% of first rearrests. VTL
alcohol-related offenses accounted for
the remaining 25% of rearrests.
■ The percentage of person/weapon and
public safety/other rearrests were
similar across all three subgroups:
– 21%, 18% and 21%, respectively,
for person/weapon offenses; and
– 16%, 12% and 15%, respectively
for public safety/other offenses.
Discussion
When considered against the backdrop of
findings from the preceding analysis
concerning law type, the substantial
percentages of cases across all three
subgroups involving drug and VTL alcohol-
related rearrests help to emphasize the
41.4%38.4%
15.9%
0%
10%
20%
30%
40%
50%
PL Non-Drug (n=9,829) PL Drug (n=1,933) VTL (n = 4,541)
Per
cen
t R
earr
este
d
Original Conviction Charge Type
Figure 14
All COMPAS-Probation Study Cases:Rates for ANY Rearrest at Two Years by Original Conviction Charge Type
Source: NYS Division of Criminal Justice Services, NYS COMPAS-Probation Risk and Needs Assessment Study (2012).
Public Safety/
Other PL 16%Public Safety/
Other PL 12%
Public Safety/
Other PL 15%
Person/Weapon
21% Person/Weapon
18%
Person/Weapon
21%
Property 43%
Property 25%
Property 27%
Drug 10%
Drug 35%Drug 12%
VTL* 8% VTL* 10%
VTL* 25%
0%
20%
40%
60%
80%
100%
PL Non-Drug (n=4,070) PL Drug (n=743) VTL (n = 724)
Per
cen
t D
istr
ibu
tio
n
Original Conviction Charge Type
Figure 15
Study Cases Involving Rearrests: Percent Distributions for FIRST Rearrest Offense Type by Original Conviction Charge Type
* VTL alcohol related charges.
Source: NYS Division of Criminal Justice Services, NYS COMPAS-Probation Risk and Needs Assessment Study (2012).
18
importance of using specialized risk assessment tool
whenever warranted by an offender’s history of drug
or alcohol dependency.
SUMMARY OF KEY FINDINGS
The study found that the Recidivism Scale worked
effectively with respect to study cases overall.
■ Case distributions across decile scores and risk
levels were largely as expected.
■ The likelihood of ANY rearrest increased with
each successive decile score in a linear manner.
■ Furthermore, the likelihood of rearrest increased
substantially with each successive risk level.
■ Actual and expected rearrest rates were closely
aligned across decile scores.
■ The scale achieved “satisfactory” predictive
accuracy with an AUC value of 0.71.
The Supervision Classification Matrix effectively
partitioned cases by supervision level. Rates for ANY
rearrest increased substantially with each
“recommended” supervision level: 16.2% for
minimum supervision cases; 31.6% for medium
supervision cases; 45.3% for medium supervision
with a possible override to high cases; and 54.4% for
high supervision cases.
As expected, rearrest rates for the 19 base risk/need
scales were generally highest for high-risk/need
individuals. The five scales most highly correlated
with the likelihood of ANY rearrest included
(beginning with the most strongly correlated scale):
History of Non-Compliance, Vocational/Educational
Problems, Criminal Associates/Peers, Anger and
Impulsivity.
Additional Analyses
There was interest in knowing how effectively the
Recidivism Scale would be able to estimate rearrest
with respect to offender age and two subgroups with
substantially different rearrest rates: Penal Law cases
and VTL cases. The types of offenses for which
probationers were rearrested were also examined.
With respect to the age-based analysis, the study
found that the likelihood of rearrest was UNDER-
estimated for 16 to 18-year-olds and OVER-
estimated for offenders in their mid-forties and
onward. While these findings warrant modification of
the Recidivism Scale equation, this over/under-
estimation should not reduce confidence in the
scale’s overall effectiveness and predictive accuracy
in that it effectively captured the overall downward
trend in the likelihood of rearrest as age increased.
With respect to the conviction charge law analysis,
the study found that there was some UNDER-
estimation of the likelihood of rearrest for certain
Penal Law cases and substantial OVER-estimation of
this likelihood for certain VTL cases. This was
largely due to the fact that NYS COMPAS-Probation
was designed to serve as a general risk assessment
tool. Among possible solutions are modification of
the Recidivism Scale equation and the construction
and implementation of a risk-specific COMPAS-
Probation assessment tool for predicting the
likelihood of alcohol-related driving offenses.
The last special analysis focused on types of rearrest
offenses. The study found that substantial
percentages of cases across all three subgroups
conviction charge categories – Penal Law non-drug,
Penal Law drug, and VTL – involved drug and VTL
alcohol-related rearrests. This finding helps to
emphasize the importance of using specialized risk
assessment tools whenever warranted by an
offender’s history of drug or alcohol dependency.
19
Appendices
Appendix A – COMPAS-Probation Documents
Appendix B – Additional Tables
Appendix C – Additional Figures
Appendix D – Offense Categories

20
Appendix A:
COMPAS-Probation Documents
Full COMPAS Assessment Instrument
Sample Case Report
Risk/Need Scale Meanings and Treatment Implications
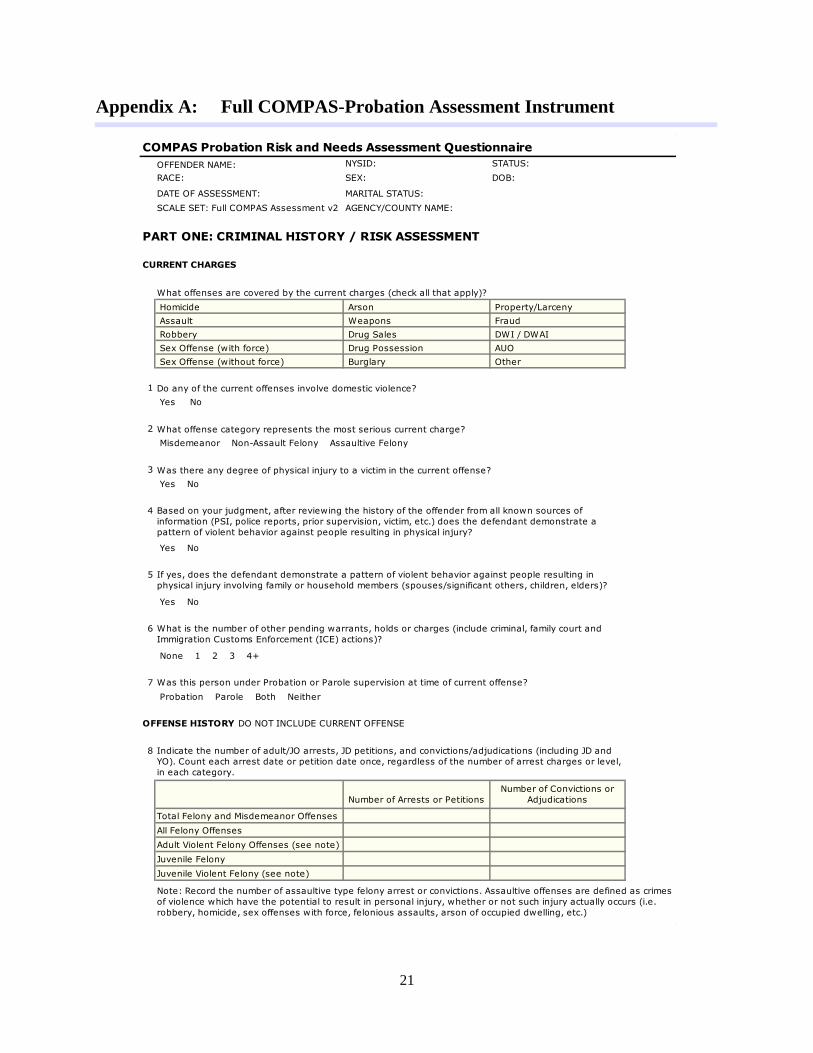
21
Appendix A: Full COMPAS-Probation Assessment Instrument
COMPAS Probation Risk and Needs Assessment Questionnaire
OFFENDER NAME: NYSID: STATUS:
RACE: SEX: DOB:
DATE OF ASSESSMENT:
SCALE SET: Full COMPAS Assessment v2
PART ONE: CRIMINAL HISTORY / RISK ASSESSMENT
CURRENT CHARGES
What offenses are covered by the current charges (check all that apply)?
Homicide Arson Property/Larceny
Assault Weapons Fraud
Robbery Drug Sales DWI / DWAI
Sex Offense (with force) Drug Possession AUO
Sex Offense (without force) Burglary Other
1
2
3
4
5
6
7
OFFENSE HISTORY DO NOT INCLUDE CURRENT OFFENSE
8
Number of Arrests or Petitions
Number of Convictions or
Adjudications
Total Felony and Misdemeanor Offenses
All Felony Offenses
Adult Violent Felony Offenses (see note)
Juvenile Felony
Juvenile Violent Felony (see note)
Was there any degree of physical injury to a victim in the current offense?
Yes No
Based on your judgment, after reviewing the history of the offender from all known sources of
information (PSI, police reports, prior supervision, victim, etc.) does the defendant demonstrate a
pattern of violent behavior against people resulting in physical injury?
What offense category represents the most serious current charge?
Misdemeanor Non-Assault Felony Assaultive Felony
Do any of the current offenses involve domestic violence?
Yes No
MARITAL STATUS:
AGENCY/COUNTY NAME:
Indicate the number of adult/JO arrests, JD petitions, and convictions/adjudications (including JD and
YO). Count each arrest date or petition date once, regardless of the number of arrest charges or level,
in each category.
Was this person under Probation or Parole supervision at time of current offense?
Probation Parole Both Neither
What is the number of other pending warrants, holds or charges (include criminal, family court and
Immigration Customs Enforcement (ICE) actions)?
None 1 2 3 4+
Yes No
If yes, does the defendant demonstrate a pattern of violent behavior against people resulting in
physical injury involving family or household members (spouses/significant others, children, elders)?
Yes No
Note: Record the number of assaultive type felony arrest or convictions. Assaultive offenses are defined as crimes
of violence which have the potential to result in personal injury, whether or not such injury actually occurs (i.e.
robbery, homicide, sex offenses with force, felonious assaults, arson of occupied dwelling, etc.)
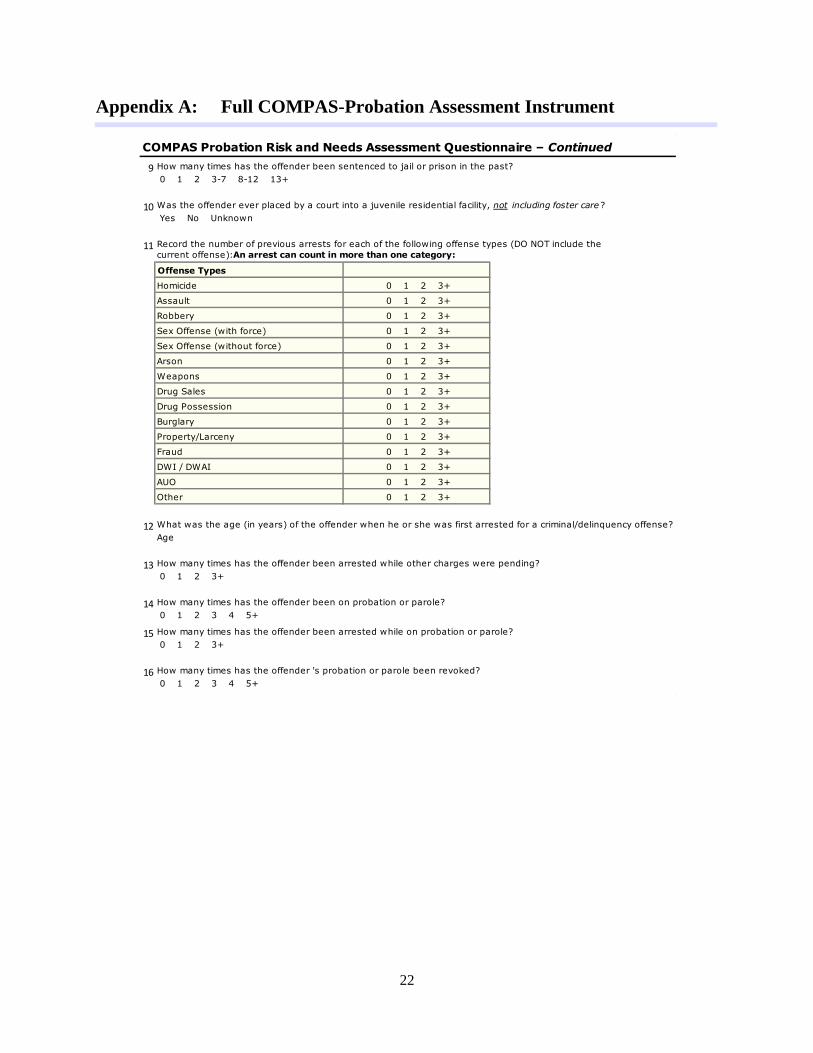
22
Appendix A: Full COMPAS-Probation Assessment Instrument
COMPAS Probation Risk and Needs Assessment Questionnaire – Continued
9
10
11
Offense Types
Homicide 0 1 2 3+
Assault 0 1 2 3+
Robbery 0 1 2 3+
Sex Offense (with force) 0 1 2 3+
Sex Offense (without force) 0 1 2 3+
Arson 0 1 2 3+
Weapons 0 1 2 3+
Drug Sales 0 1 2 3+
Drug Possession 0 1 2 3+
Burglary 0 1 2 3+
Property/Larceny 0 1 2 3+
Fraud 0 1 2 3+
DWI / DWAI 0 1 2 3+
AUO 0 1 2 3+
Other 0 1 2 3+
12 What was the age (in years) of the offender when he or she was first arrested for a criminal/delinquency offense?
13
14
15
16
How many times has the offender been sentenced to jail or prison in the past?
0 1 2 3-7 8-12 13+
How many times has the offender been on probation or parole?
0 1 2 3 4 5+
How many times has the offender been arrested while on probation or parole?
How many times has the offender been arrested while other charges were pending?
0 1 2 3+
Age
Was the offender ever placed by a court into a juvenile residential facility, not including foster care ?
Yes No Unknown
Record the number of previous arrests for each of the following offense types (DO NOT include the
current offense):An arrest can count in more than one category:
0 1 2 3+
How many times has the offender 's probation or parole been revoked?
0 1 2 3 4 5+

23
Appendix A: Full COMPAS-Probation Assessment Instrument
COMPAS Probation Risk and Needs Assessment Questionnaire – Continued
PART TWO: NEEDS ASSESSMENT
A. ASSOCIATES / PEERS
17 Use illegal drugs
Have been arrested
Have been incarcerated
None
18
Current gang membership
Previous gang membership
Not a member but associates with gang members
None
19
20
21
Yes Unsure No
B. FAMILY
22
23
Arrests
Incarceration
Mental Health Issues
Substance Abuse Issues
Violence
24
Spouse
Parent or person who raised the probationer
Children
Other relative
Boy/Girl friend (relationship less than 1 year)
Boy/Girl friend (relationship greater than 1 year)
Friend(s)
Alone
Residential treatment program
Other
Lead law-abiding lifestyles
Are gainfully employed
Are involved in pro-social activities
Yes No Unknown
Are the offender 's family or household members able and willing to support a law abiding lifestyle?
Does the offender have a criminal alias, a gang-related or street name?
Yes No
Does unstructured idle time contribute to the opportunity for the offender to commit criminal offenses?
Yes Unsure No
Does offender report boredom as a contributing factor to his or her criminal behavior?
The offender has peers and associates who (check all that apply) :
What is the gang affiliation status of the offender :
Yes Unsure No
Is the offender's current household characterized by (check all that apply) :
With whom or where does offender currently reside or plan to reside while under supervision?
Yes No Unknown
Yes No Unknown
Yes No Unknown
Yes No Unknown

24
Appendix A: Full COMPAS-Probation Assessment Instrument
COMPAS Probation Risk and Needs Assessment Questionnaire – Continued
25
A. Gets/got along well with them?
Yes No Unsure N/A, no parents/contact
B. Can rely on parents/caretakers/family when in trouble?
Yes No Unsure N/A, no parents/contact
C. In contact with them regularly?
Yes No Unsure N/A, no parents/contact
26
Arrests
Incarceration
Mental Health Issues
Substance Abuse Issues
Violence
C. FINANCIAL STATUS
27
28
D. LEISURE / RECREATION
29
30
Own residence
Rent with lease
Rent without lease (month to month)
Stay with others
Have no home or verifiable address
31
32
F. SOCIAL ENVIRONMENT
33
Drug availability
Gangs
Weapons
Violent crime
Most people are employed in regular jobs
It's safe at night
People look out for each other
People are law abiding
Yes No
Yes No
Yes No
Yes Unsure No
E. RESIDENTIAL STABILITY
Does the offender (check one) :
Was the offender's family of origin characterized by:
Is the offender's income adequate to meet his or her basic needs?
What kind of relationship does the offender have with parents/caretakers or immediate family?
Yes Unsure No
Does the offender appropriately manage their income to adequately handle their financial
responsibilities? Yes Unsure No
Yes No
Yes No
Do any of the following characterize the area immediately surrounding the offender's residence (check
all that apply)?
How many times has the offender moved in the last twelve months?
0 1 2 3 4 5+
How many years has the offender lived in the community or neighborhood?
Less than 1 year 1 2 3 4 5+
Does the offender frequently engage in impulsive high risk or sensation seeking behavior?
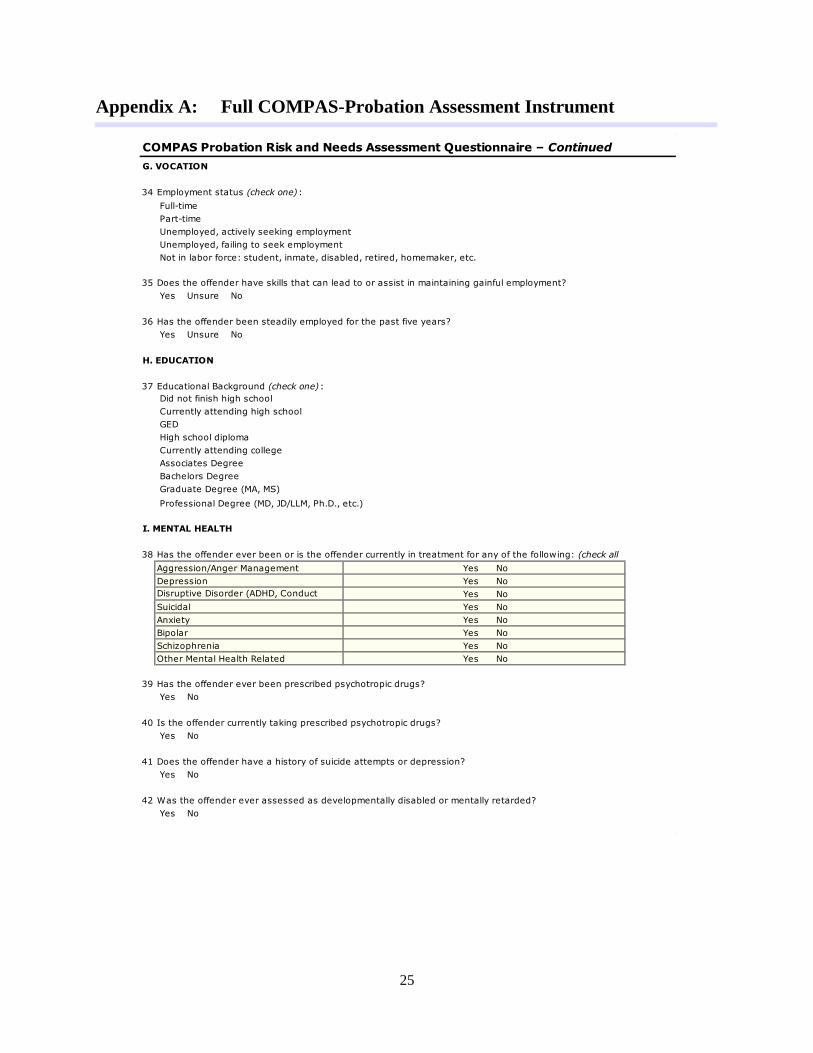
25
Appendix A: Full COMPAS-Probation Assessment Instrument
COMPAS Probation Risk and Needs Assessment Questionnaire – Continued
G. VOCATION
34 Employment status (check one) :
Full-time
Part-time
Unemployed, actively seeking employment
Unemployed, failing to seek employment
Not in labor force: student, inmate, disabled, retired, homemaker, etc.
35
36
H. EDUCATION
37
Did not finish high school
Currently attending high school
GED
High school diploma
Currently attending college
Associates Degree
Bachelors Degree
Graduate Degree (MA, MS)
Professional Degree (MD, JD/LLM, Ph.D., etc.)
I. MENTAL HEALTH
38
Aggression/Anger Management
Depression
Disruptive Disorder (ADHD, Conduct
Disorder)Suicidal
Anxiety
Bipolar
Schizophrenia
Other Mental Health Related
39
40
41
42
Yes No
Yes No
Yes No
Yes No
Yes No
Yes No
Was the offender ever assessed as developmentally disabled or mentally retarded?
Yes No
Yes No
Yes No
Yes No
Has the offender ever been prescribed psychotropic drugs?
Yes No
Is the offender currently taking prescribed psychotropic drugs?
Yes No
Does the offender have a history of suicide attempts or depression?
Educational Background (check one) :
Has the offender ever been or is the offender currently in treatment for any of the following: (check all
that apply)
Does the offender have skills that can lead to or assist in maintaining gainful employment?
Yes Unsure No
Has the offender been steadily employed for the past five years?
Yes Unsure No

26
Appendix A: Full COMPAS-Probation Assessment Instrument
COMPAS Probation Risk and Needs Assessment Questionnaire – Continued
J. SUBSTANCE ABUSE
43
Formerly Currently Less than 90 days
Currently 90 days or more Never
Formerly Currently Less than 90 days
Currently 90 days or more Never
44
Tobacco
Alcohol
Marijuana
Hard/Illegal Drugs (Heroin, Cocaine,
Crack, Meth, etc)Injected Drugs
45
Marijuana
Alcohol
Tobacco
Hard/Illegal Drugs
K. CRIMINAL ATTITUDES THINKING
46
Understands true extent of harm caused by his/her actions
Admits wrongdoing
Expresses remorse
Has empathy for victim
Is willing to make reparation/pay restitution
Is willing to perform community service
Is acceptant of/participates in treatment
Accepts consequences
None of the above
47 The defendant/probationer : (Check all that apply)
Minimizes wrongdoing
Blames victim/others
Blames the criminal justice system
Thinks conviction/sentence is unfair
Excuses own behavior
Reinterprets the facts to own benefit
Justifies behavior as being the only option
None of the above
Outpatient
Inpatient
Formerly Currently Never
Formerly Currently Never
Formerly Currently Never
Formerly Currently Never
Formerly Currently Never
Age at First
Drug/Alcohol Treatment
The defendant/probationer : (Check all that apply)
Substance Abuse Treatment History (check all that apply) :
Abuse History (check all that apply)
If offender has used drugs how old was he/she at first use? (leave blank if age is unknown)
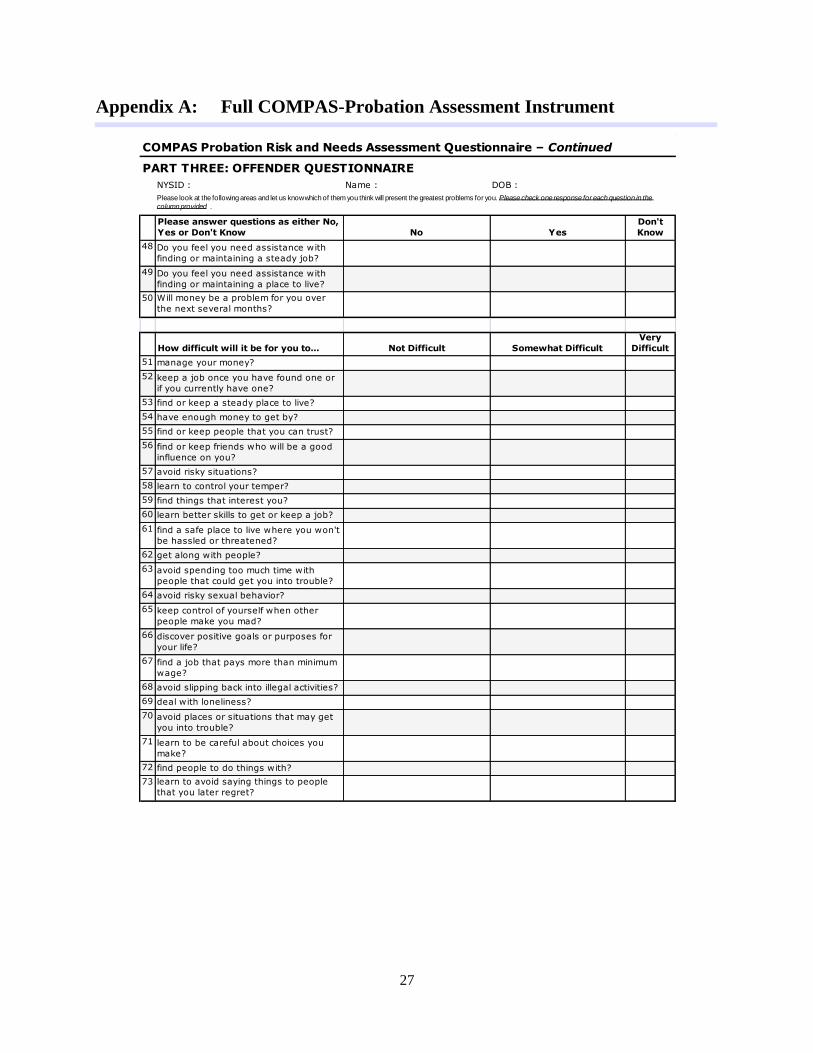
27
Appendix A: Full COMPAS-Probation Assessment Instrument
COMPAS Probation Risk and Needs Assessment Questionnaire – Continued
PART THREE: OFFENDER QUESTIONNAIRE
NYSID : Name : DOB :
Please answer questions as either No,
Yes or Don't Know No Yes
Don't
Know
48 Do you feel you need assistance with
finding or maintaining a steady job?
49 Do you feel you need assistance with
finding or maintaining a place to live?
50 Will money be a problem for you over
the next several months?
How difficult will it be for you to... Not Difficult Somewhat Difficult
Very
Difficult
51 manage your money?
52 keep a job once you have found one or
if you currently have one?
53 find or keep a steady place to live?
54 have enough money to get by?
55 find or keep people that you can trust?
56 find or keep friends who will be a good
influence on you?
57 avoid risky situations?
58 learn to control your temper?
59 find things that interest you?
60 learn better skills to get or keep a job?
61 find a safe place to live where you won't
be hassled or threatened?
62 get along with people?
63 avoid spending too much time with
people that could get you into trouble?
64 avoid risky sexual behavior?
65 keep control of yourself when other
people make you mad?
66 discover positive goals or purposes for
your life?
67 find a job that pays more than minimum
wage?
68 avoid slipping back into illegal activities?
69 deal with loneliness?
70 avoid places or situations that may get
you into trouble?
71 learn to be careful about choices you
make?
72 find people to do things with?
73 learn to avoid saying things to people
that you later regret?
Please look at the following areas and let us know which of them you think will present the greatest problems for you. Please check one response for each question in the
column provided .
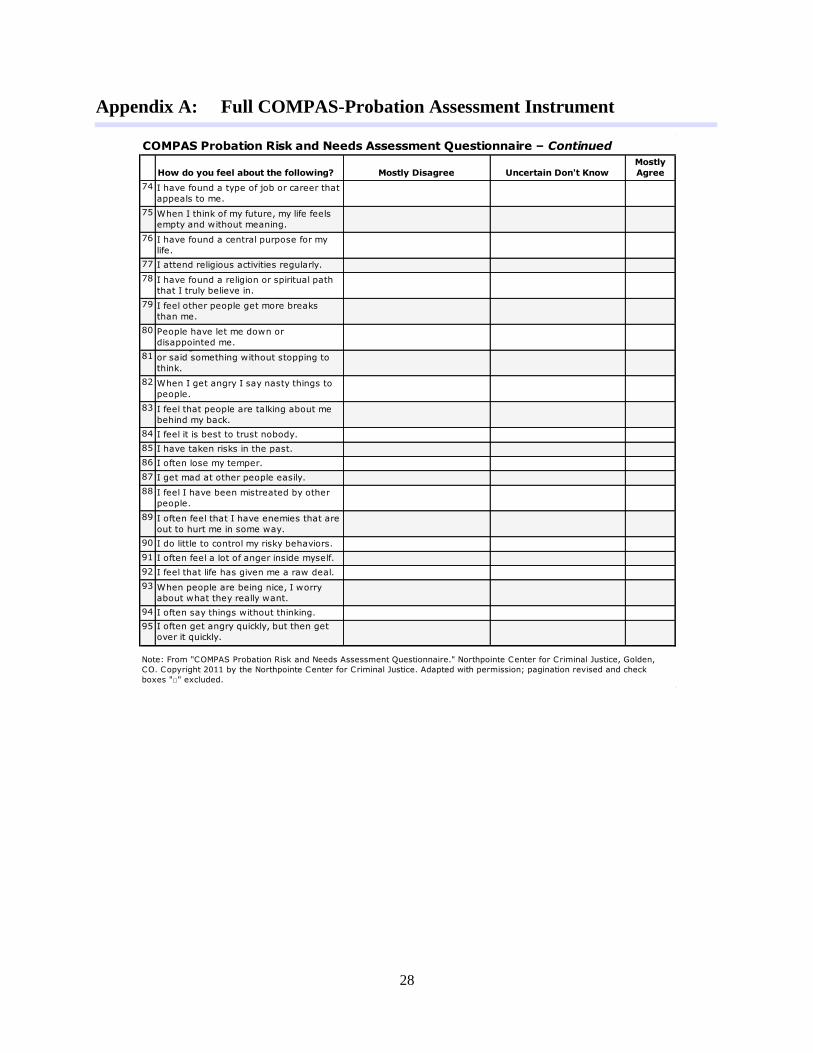
28
Appendix A: Full COMPAS-Probation Assessment Instrument
COMPAS Probation Risk and Needs Assessment Questionnaire – Continued
How do you feel about the following? Mostly Disagree Uncertain Don't Know
Mostly
Agree
74 I have found a type of job or career that
appeals to me.
75 When I think of my future, my life feels
empty and without meaning.
76 I have found a central purpose for my
life.
77 I attend religious activities regularly.
78 I have found a religion or spiritual path
that I truly believe in.
79 I feel other people get more breaks
than me.
80 People have let me down or
disappointed me.
81I have gotten into trouble because I did
or said something without stopping to
think.
82 When I get angry I say nasty things to
people.
83 I feel that people are talking about me
behind my back.
84 I feel it is best to trust nobody.
85 I have taken risks in the past.
86 I often lose my temper.
87 I get mad at other people easily.
88 I feel I have been mistreated by other
people.
89 I often feel that I have enemies that are
out to hurt me in some way.
90 I do little to control my risky behaviors.
91 I often feel a lot of anger inside myself.
92 I feel that life has given me a raw deal.
93 When people are being nice, I worry
about what they really want.
94 I often say things without thinking.
95 I often get angry quickly, but then get
over it quickly.
Note: From "COMPAS Probation Risk and Needs Assessment Questionnaire." Northpointe Center for Criminal Justice, Golden,
CO. Copyright 2011 by the Northpointe Center for Criminal Justice. Adapted with permission; pagination revised and check
boxes "□" excluded.

29
Appendix A: COMPAS-Probation Sample Risk Assessment Case Report
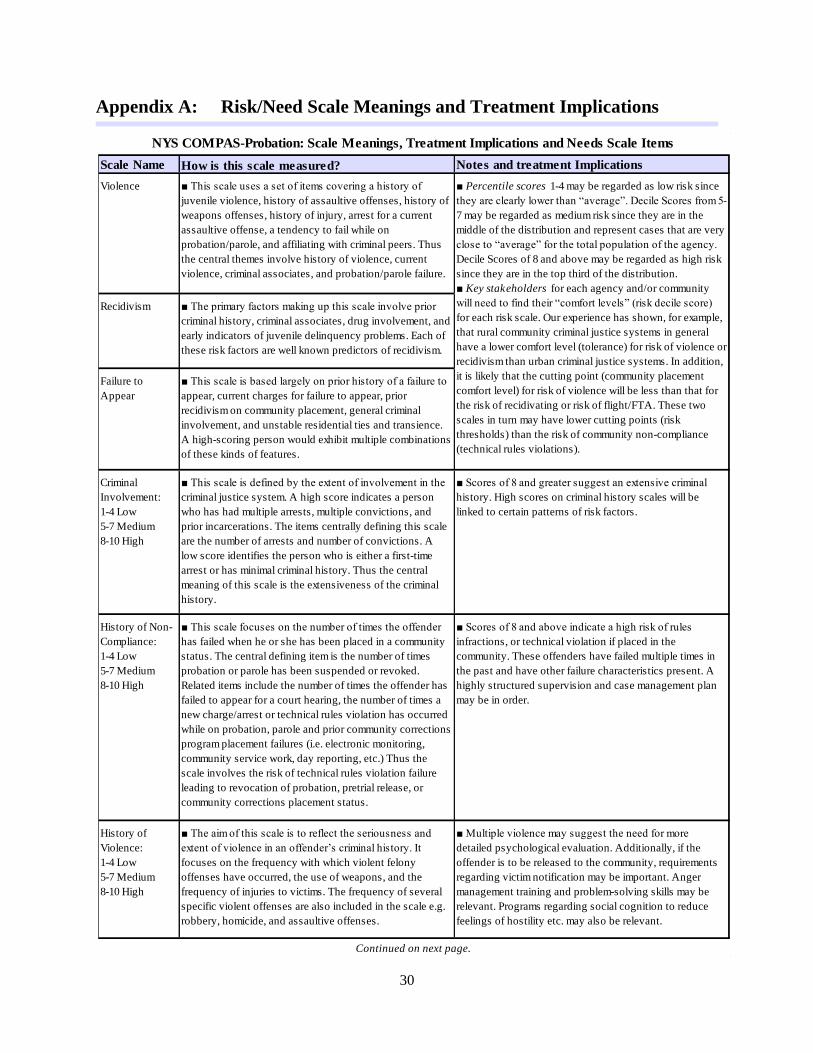
30
Appendix A: Risk/Need Scale Meanings and Treatment Implications
Scale Name How is this scale measured? Notes and treatment Implications
Violence ■ This scale uses a set of items covering a history of
juvenile violence, history of assaultive offenses, history of
weapons offenses, history of injury, arrest for a current
assaultive offense, a tendency to fail while on
probation/parole, and affiliating with criminal peers. Thus
the central themes involve history of violence, current
violence, criminal associates, and probation/parole failure.
Recidivism ■ The primary factors making up this scale involve prior
criminal history, criminal associates, drug involvement, and
early indicators of juvenile delinquency problems. Each of
these risk factors are well known predictors of recidivism.
Failure to
Appear
■ This scale is based largely on prior history of a failure to
appear, current charges for failure to appear, prior
recidivism on community placement, general criminal
involvement, and unstable residential ties and transience.
A high-scoring person would exhibit multiple combinations
of these kinds of features.
Criminal
Involvement:
1-4 Low
5-7 Medium
8-10 High
■ This scale is defined by the extent of involvement in the
criminal justice system. A high score indicates a person
who has had multiple arrests, multiple convictions, and
prior incarcerations. The items centrally defining this scale
are the number of arrests and number of convictions. A
low score identifies the person who is either a first-time
arrest or has minimal criminal history. Thus the central
meaning of this scale is the extensiveness of the criminal
history.
■ Scores of 8 and greater suggest an extensive criminal
history. High scores on criminal history scales will be
linked to certain patterns of risk factors.
History of Non-
Compliance:
1-4 Low
5-7 Medium
8-10 High
■ This scale focuses on the number of times the offender
has failed when he or she has been placed in a community
status. The central defining item is the number of times
probation or parole has been suspended or revoked.
Related items include the number of times the offender has
failed to appear for a court hearing, the number of times a
new charge/arrest or technical rules violation has occurred
while on probation, parole and prior community corrections
program placement failures (i.e. electronic monitoring,
community service work, day reporting, etc.) Thus the
scale involves the risk of technical rules violation failure
leading to revocation of probation, pretrial release, or
community corrections placement status.
■ Scores of 8 and above indicate a high risk of rules
infractions, or technical violation if placed in the
community. These offenders have failed multiple times in
the past and have other failure characteristics present. A
highly structured supervision and case management plan
may be in order.
History of
Violence:
1-4 Low
5-7 Medium
8-10 High
■ The aim of this scale is to reflect the seriousness and
extent of violence in an offender’s criminal history. It
focuses on the frequency with which violent felony
offenses have occurred, the use of weapons, and the
frequency of injuries to victims. The frequency of several
specific violent offenses are also included in the scale e.g.
robbery, homicide, and assaultive offenses.
■ Multiple violence may suggest the need for more
detailed psychological evaluation. Additionally, if the
offender is to be released to the community, requirements
regarding victim notification may be important. Anger
management training and problem-solving skills may be
relevant. Programs regarding social cognition to reduce
feelings of hostility etc. may also be relevant.
Continued on next page.
■ Percentile scores 1-4 may be regarded as low risk since
they are clearly lower than “average”. Decile Scores from 5-
7 may be regarded as medium risk since they are in the
middle of the distribution and represent cases that are very
close to “average” for the total population of the agency.
Decile Scores of 8 and above may be regarded as high risk
since they are in the top third of the distribution.
■ Key stakeholders for each agency and/or community
will need to find their “comfort levels” (risk decile score)
for each risk scale. Our experience has shown, for example,
that rural community criminal justice systems in general
have a lower comfort level (tolerance) for risk of violence or
recidivism than urban criminal justice systems. In addition,
it is likely that the cutting point (community placement
comfort level) for risk of violence will be less than that for
the risk of recidivating or risk of flight/FTA. These two
scales in turn may have lower cutting points (risk
thresholds) than the risk of community non-compliance
(technical rules violations).
NYS COMPAS-Probation: Scale Meanings, Treatment Implications and Needs Scale Items
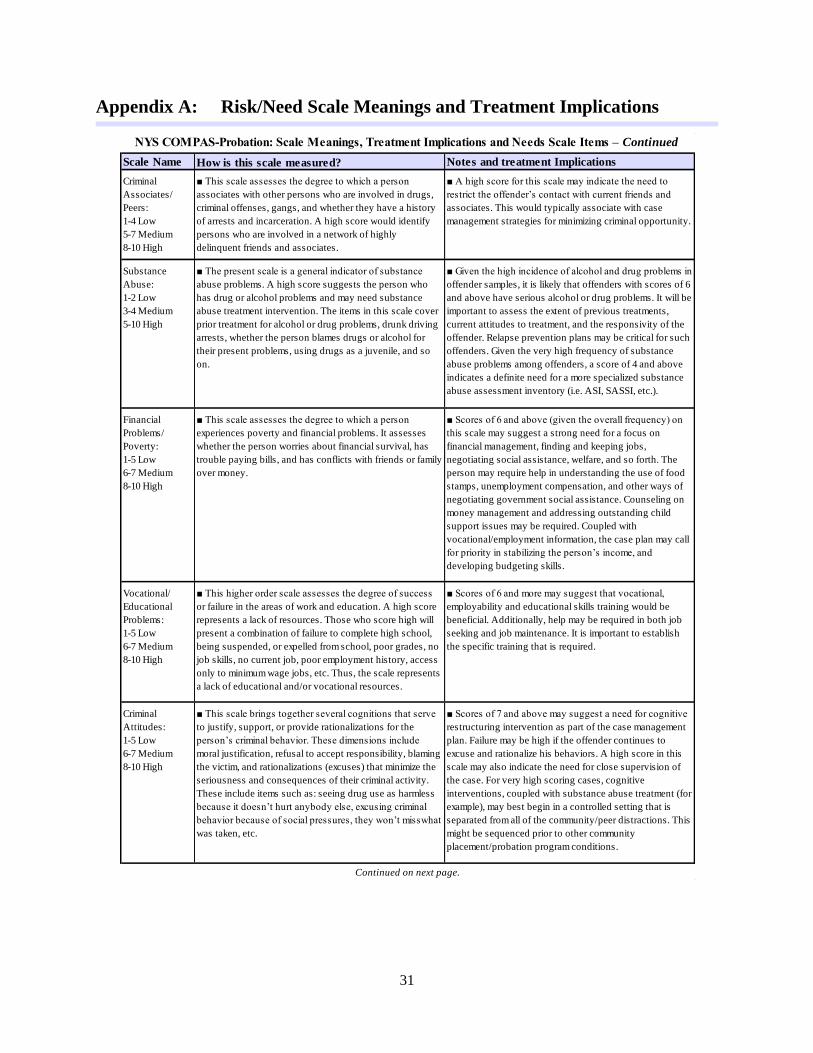
31
Appendix A: Risk/Need Scale Meanings and Treatment Implications
Scale Name How is this scale measured? Notes and treatment Implications
Criminal
Associates/
Peers:
1-4 Low
5-7 Medium
8-10 High
■ This scale assesses the degree to which a person
associates with other persons who are involved in drugs,
criminal offenses, gangs, and whether they have a history
of arrests and incarceration. A high score would identify
persons who are involved in a network of highly
delinquent friends and associates.
■ A high score for this scale may indicate the need to
restrict the offender’s contact with current friends and
associates. This would typically associate with case
management strategies for minimizing criminal opportunity.
Substance
Abuse:
1-2 Low
3-4 Medium
5-10 High
■ The present scale is a general indicator of substance
abuse problems. A high score suggests the person who
has drug or alcohol problems and may need substance
abuse treatment intervention. The items in this scale cover
prior treatment for alcohol or drug problems, drunk driving
arrests, whether the person blames drugs or alcohol for
their present problems, using drugs as a juvenile, and so
on.
■ Given the high incidence of alcohol and drug problems in
offender samples, it is likely that offenders with scores of 6
and above have serious alcohol or drug problems. It will be
important to assess the extent of previous treatments,
current attitudes to treatment, and the responsivity of the
offender. Relapse prevention plans may be critical for such
offenders. Given the very high frequency of substance
abuse problems among offenders, a score of 4 and above
indicates a definite need for a more specialized substance
abuse assessment inventory (i.e. ASI, SASSI, etc.).
Financial
Problems/
Poverty:
1-5 Low
6-7 Medium
8-10 High
■ This scale assesses the degree to which a person
experiences poverty and financial problems. It assesses
whether the person worries about financial survival, has
trouble paying bills, and has conflicts with friends or family
over money.
■ Scores of 6 and above (given the overall frequency) on
this scale may suggest a strong need for a focus on
financial management, finding and keeping jobs,
negotiating social assistance, welfare, and so forth. The
person may require help in understanding the use of food
stamps, unemployment compensation, and other ways of
negotiating government social assistance. Counseling on
money management and addressing outstanding child
support issues may be required. Coupled with
vocational/employment information, the case plan may call
for priority in stabilizing the person’s income, and
developing budgeting skills.
Vocational/
Educational
Problems:
1-5 Low
6-7 Medium
8-10 High
■ This higher order scale assesses the degree of success
or failure in the areas of work and education. A high score
represents a lack of resources. Those who score high will
present a combination of failure to complete high school,
being suspended, or expelled from school, poor grades, no
job skills, no current job, poor employment history, access
only to minimum wage jobs, etc. Thus, the scale represents
a lack of educational and/or vocational resources.
■ Scores of 6 and more may suggest that vocational,
employability and educational skills training would be
beneficial. Additionally, help may be required in both job
seeking and job maintenance. It is important to establish
the specific training that is required.
Criminal
Attitudes:
1-5 Low
6-7 Medium
8-10 High
■ This scale brings together several cognitions that serve
to justify, support, or provide rationalizations for the
person’s criminal behavior. These dimensions include
moral justification, refusal to accept responsibility, blaming
the victim, and rationalizations (excuses) that minimize the
seriousness and consequences of their criminal activity.
These include items such as: seeing drug use as harmless
because it doesn’t hurt anybody else, excusing criminal
behavior because of social pressures, they won’t misswhat
was taken, etc.
■ Scores of 7 and above may suggest a need for cognitive
restructuring intervention as part of the case management
plan. Failure may be high if the offender continues to
excuse and rationalize his behaviors. A high score in this
scale may also indicate the need for close supervision of
the case. For very high scoring cases, cognitive
interventions, coupled with substance abuse treatment (for
example), may best begin in a controlled setting that is
separated from all of the community/peer distractions. This
might be sequenced prior to other community
placement/probation program conditions.
Continued on next page.
NYS COMPAS-Probation: Scale Meanings, Treatment Implications and Needs Scale Items – Continued
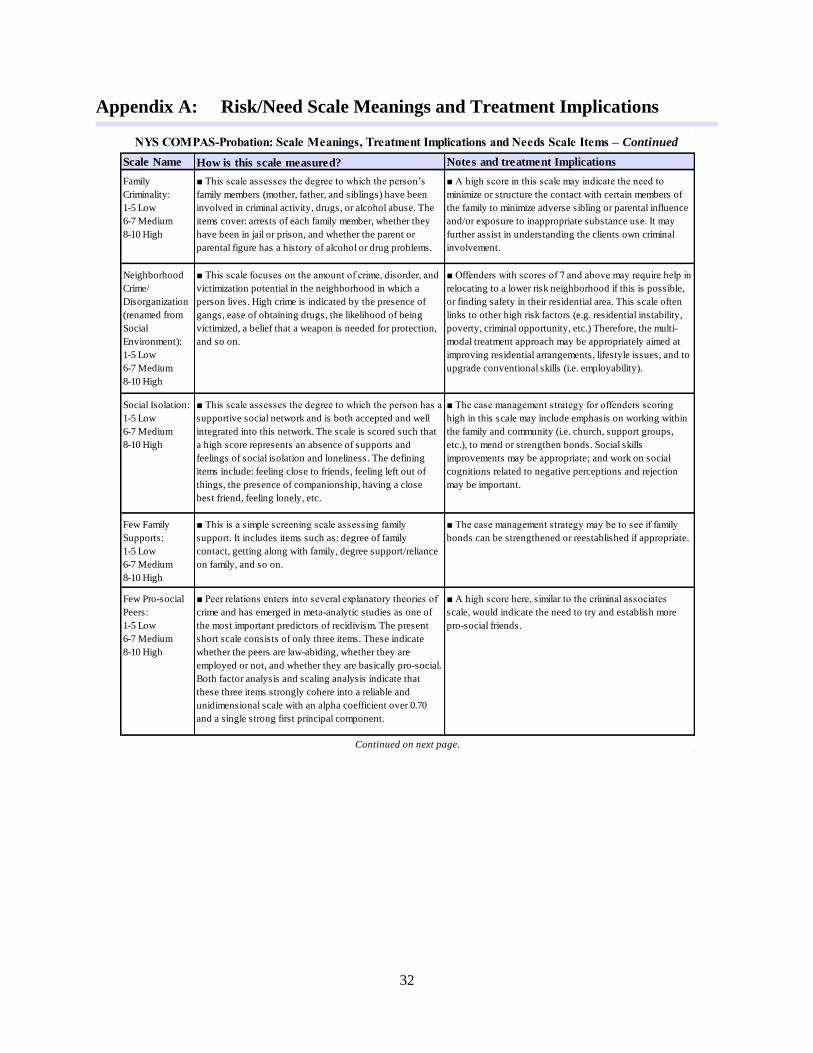
32
Appendix A: Risk/Need Scale Meanings and Treatment Implications
Scale Name How is this scale measured? Notes and treatment Implications
Family
Criminality:
1-5 Low
6-7 Medium
8-10 High
■ This scale assesses the degree to which the person’s
family members (mother, father, and siblings) have been
involved in criminal activity, drugs, or alcohol abuse. The
items cover: arrests of each family member, whether they
have been in jail or prison, and whether the parent or
parental figure has a history of alcohol or drug problems.
■ A high score in this scale may indicate the need to
minimize or structure the contact with certain members of
the family to minimize adverse sibling or parental influence
and/or exposure to inappropriate substance use. It may
further assist in understanding the clients own criminal
involvement.
Neighborhood
Crime/
Disorganization
(renamed from
Social
Environment):
1-5 Low
6-7 Medium
8-10 High
■ This scale focuses on the amount of crime, disorder, and
victimization potential in the neighborhood in which a
person lives. High crime is indicated by the presence of
gangs, ease of obtaining drugs, the likelihood of being
victimized, a belief that a weapon is needed for protection,
and so on.
■ Offenders with scores of 7 and above may require help in
relocating to a lower risk neighborhood if this is possible,
or finding safety in their residential area. This scale often
links to other high risk factors (e.g. residential instability,
poverty, criminal opportunity, etc.) Therefore, the multi-
modal treatment approach may be appropriately aimed at
improving residential arrangements, lifestyle issues, and to
upgrade conventional skills (i.e. employability).
Social Isolation:
1-5 Low
6-7 Medium
8-10 High
■ This scale assesses the degree to which the person has a
supportive social network and is both accepted and well
integrated into this network. The scale is scored such that
a high score represents an absence of supports and
feelings of social isolation and loneliness. The defining
items include: feeling close to friends, feeling left out of
things, the presence of companionship, having a close
best friend, feeling lonely, etc.
■ The case management strategy for offenders scoring
high in this scale may include emphasis on working within
the family and community (i.e. church, support groups,
etc.), to mend or strengthen bonds. Social skills
improvements may be appropriate; and work on social
cognitions related to negative perceptions and rejection
may be important.
Few Family
Supports:
1-5 Low
6-7 Medium
8-10 High
■ This is a simple screening scale assessing family
support. It includes items such as: degree of family
contact, getting along with family, degree support/reliance
on family, and so on.
■ The case management strategy may be to see if family
bonds can be strengthened or reestablished if appropriate.
Few Pro-social
Peers:
1-5 Low
6-7 Medium
8-10 High
■ Peer relations enters into several explanatory theories of
crime and has emerged in meta-analytic studies as one of
the most important predictors of recidivism. The present
short scale consists of only three items. These indicate
whether the peers are law-abiding, whether they are
employed or not, and whether they are basically pro-social.
Both factor analysis and scaling analysis indicate that
these three items strongly cohere into a reliable and
unidimensional scale with an alpha coefficient over 0.70
and a single strong first principal component.
■ A high score here, similar to the criminal associates
scale, would indicate the need to try and establish more
pro-social friends.
Continued on next page.
NYS COMPAS-Probation: Scale Meanings, Treatment Implications and Needs Scale Items – Continued
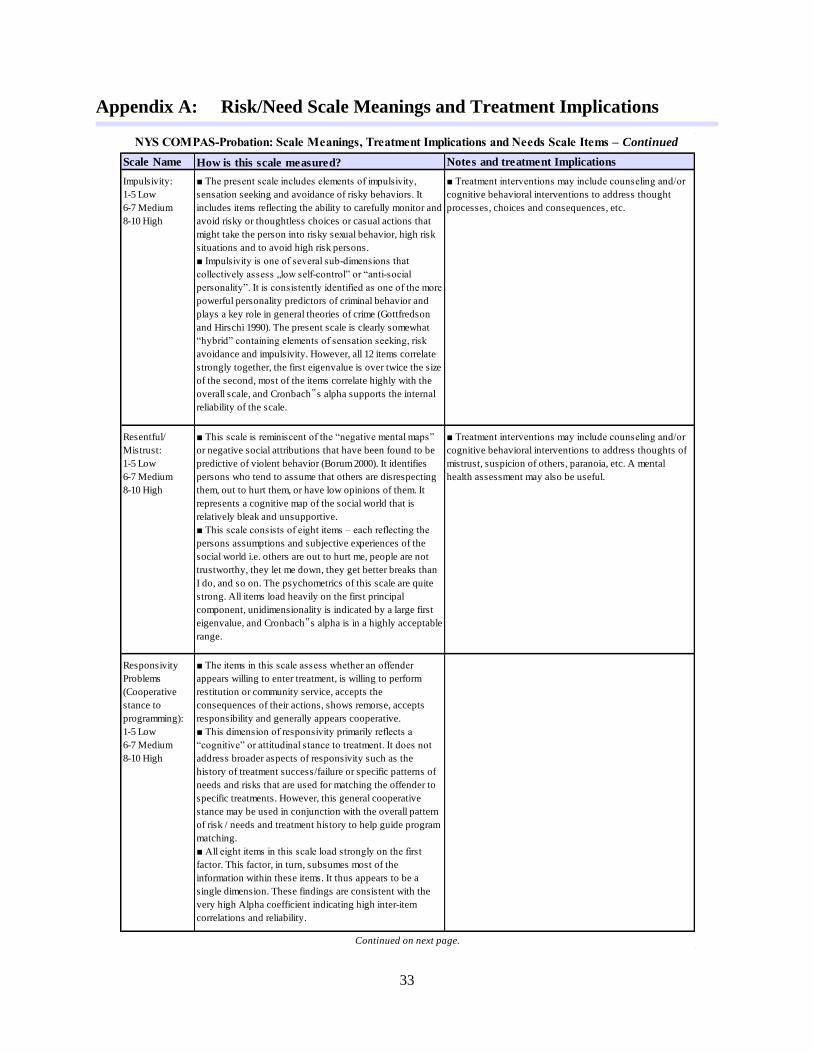
33
Appendix A: Risk/Need Scale Meanings and Treatment Implications
Scale Name How is this scale measured? Notes and treatment Implications
Impulsivity:
1-5 Low
6-7 Medium
8-10 High
■ The present scale includes elements of impulsivity,
sensation seeking and avoidance of risky behaviors. It
includes items reflecting the ability to carefully monitor and
avoid risky or thoughtless choices or casual actions that
might take the person into risky sexual behavior, high risk
situations and to avoid high risk persons.
■ Impulsivity is one of several sub-dimensions that
collectively assess „low self-control” or “anti-social
personality”. It is consistently identified as one of the more
powerful personality predictors of criminal behavior and
plays a key role in general theories of crime (Gottfredson
and Hirschi 1990). The present scale is clearly somewhat
“hybrid” containing elements of sensation seeking, risk
avoidance and impulsivity. However, all 12 items correlate
strongly together, the first eigenvalue is over twice the size
of the second, most of the items correlate highly with the
overall scale, and Cronbach‟s alpha supports the internal
reliability of the scale.
■ Treatment interventions may include counseling and/or
cognitive behavioral interventions to address thought
processes, choices and consequences, etc.
Resentful/
Mistrust:
1-5 Low
6-7 Medium
8-10 High
■ This scale is reminiscent of the “negative mental maps”
or negative social attributions that have been found to be
predictive of violent behavior (Borum 2000). It identifies
persons who tend to assume that others are disrespecting
them, out to hurt them, or have low opinions of them. It
represents a cognitive map of the social world that is
relatively bleak and unsupportive.
■ This scale consists of eight items – each reflecting the
persons assumptions and subjective experiences of the
social world i.e. others are out to hurt me, people are not
trustworthy, they let me down, they get better breaks than
I do, and so on. The psychometrics of this scale are quite
strong. All items load heavily on the first principal
component, unidimensionality is indicated by a large first
eigenvalue, and Cronbach‟s alpha is in a highly acceptable
range.
■ Treatment interventions may include counseling and/or
cognitive behavioral interventions to address thoughts of
mistrust, suspicion of others, paranoia, etc. A mental
health assessment may also be useful.
Responsivity
Problems
(Cooperative
stance to
programming):
1-5 Low
6-7 Medium
8-10 High
■ The items in this scale assess whether an offender
appears willing to enter treatment, is willing to perform
restitution or community service, accepts the
consequences of their actions, shows remorse, accepts
responsibility and generally appears cooperative.
■ This dimension of responsivity primarily reflects a
“cognitive” or attitudinal stance to treatment. It does not
address broader aspects of responsivity such as the
history of treatment success/failure or specific patterns of
needs and risks that are used for matching the offender to
specific treatments. However, this general cooperative
stance may be used in conjunction with the overall pattern
of risk / needs and treatment history to help guide program
matching.
■ All eight items in this scale load strongly on the first
factor. This factor, in turn, subsumes most of the
information within these items. It thus appears to be a
single dimension. These findings are consistent with the
very high Alpha coefficient indicating high inter-item
correlations and reliability.
NYS COMPAS-Probation: Scale Meanings, Treatment Implications and Needs Scale Items – Continued
Continued on next page.
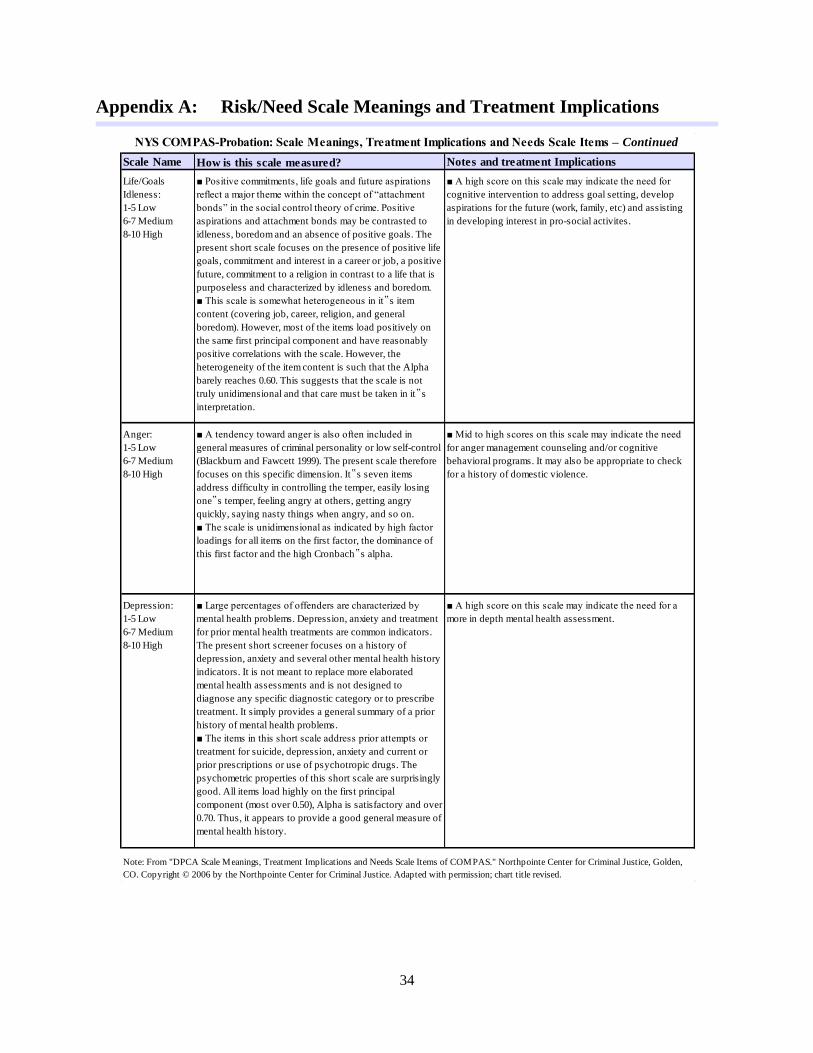
34
Appendix A: Risk/Need Scale Meanings and Treatment Implications
Scale Name How is this scale measured? Notes and treatment Implications
Life/Goals
Idleness:
1-5 Low
6-7 Medium
8-10 High
■ Positive commitments, life goals and future aspirations
reflect a major theme within the concept of “attachment
bonds” in the social control theory of crime. Positive
aspirations and attachment bonds may be contrasted to
idleness, boredom and an absence of positive goals. The
present short scale focuses on the presence of positive life
goals, commitment and interest in a career or job, a positive
future, commitment to a religion in contrast to a life that is
purposeless and characterized by idleness and boredom.
■ This scale is somewhat heterogeneous in it‟s item
content (covering job, career, religion, and general
boredom). However, most of the items load positively on
the same first principal component and have reasonably
positive correlations with the scale. However, the
heterogeneity of the item content is such that the Alpha
barely reaches 0.60. This suggests that the scale is not
truly unidimensional and that care must be taken in it‟s
interpretation.
■ A high score on this scale may indicate the need for
cognitive intervention to address goal setting, develop
aspirations for the future (work, family, etc) and assisting
in developing interest in pro-social activites.
Anger:
1-5 Low
6-7 Medium
8-10 High
■ A tendency toward anger is also often included in
general measures of criminal personality or low self-control
(Blackburn and Fawcett 1999). The present scale therefore
focuses on this specific dimension. It‟s seven items
address difficulty in controlling the temper, easily losing
one‟s temper, feeling angry at others, getting angry
quickly, saying nasty things when angry, and so on.
■ The scale is unidimensional as indicated by high factor
loadings for all items on the first factor, the dominance of
this first factor and the high Cronbach‟s alpha.
■ Mid to high scores on this scale may indicate the need
for anger management counseling and/or cognitive
behavioral programs. It may also be appropriate to check
for a history of domestic violence.
Depression:
1-5 Low
6-7 Medium
8-10 High
■ Large percentages of offenders are characterized by
mental health problems. Depression, anxiety and treatment
for prior mental health treatments are common indicators.
The present short screener focuses on a history of
depression, anxiety and several other mental health history
indicators. It is not meant to replace more elaborated
mental health assessments and is not designed to
diagnose any specific diagnostic category or to prescribe
treatment. It simply provides a general summary of a prior
history of mental health problems.
■ The items in this short scale address prior attempts or
treatment for suicide, depression, anxiety and current or
prior prescriptions or use of psychotropic drugs. The
psychometric properties of this short scale are surprisingly
good. All items load highly on the first principal
component (most over 0.50), Alpha is satisfactory and over
0.70. Thus, it appears to provide a good general measure of
mental health history.
■ A high score on this scale may indicate the need for a
more in depth mental health assessment.
Note: From "DPCA Scale Meanings, Treatment Implications and Needs Scale Items of COMPAS." Northpointe Center for Criminal Justice, Golden,
CO. Copyright © 2006 by the Northpointe Center for Criminal Justice. Adapted with permission; chart title revised.
NYS COMPAS-Probation: Scale Meanings, Treatment Implications and Needs Scale Items – Continued
35
Appendix B:
Additional Tables
Table B1: Percent of 2009 Probation Supervision Admission Cases
Included in Study and Recidivism Scale Percent Distributions
by Probation Departments and Risk Levels
Table B2: COMPAS-Probation Study Cases: Rearrest Rates for ANY
Offense by Probation Department, Law and Recidivism Scale
Risk Levels
Table B3: Study Cases With "Full COMPAS" Assessments (n=11,289):
Rearrest Rates at Two Years for ANY Offense by Scale Levels
and Highest Risk/Need Decile Scores (DS)
Table B4: Study Cases With "Full COMPAS" Assessments (n=11,289):
Percent of Cases Classified as High Risk/Need by Probation
Department, Scale Type and Scale
Table B5: Study Cases With "Full COMPAS" Assessments (n=11,289):
Pearson Correlations for ANY Rearrest at Two Years,
Recidivism Scale and Base Risk/Need Scales
Table B6: COMPAS-Probation Study Cases: Actual and Expected
Rearrest Rates for ANY Offense by Age at Assessment
Table B7: COMPAS-Probation Study Cases: Actual and Expected
Rearrest Rates for ANY Offense by Recidivism Scale Decile
Scores and Law Type
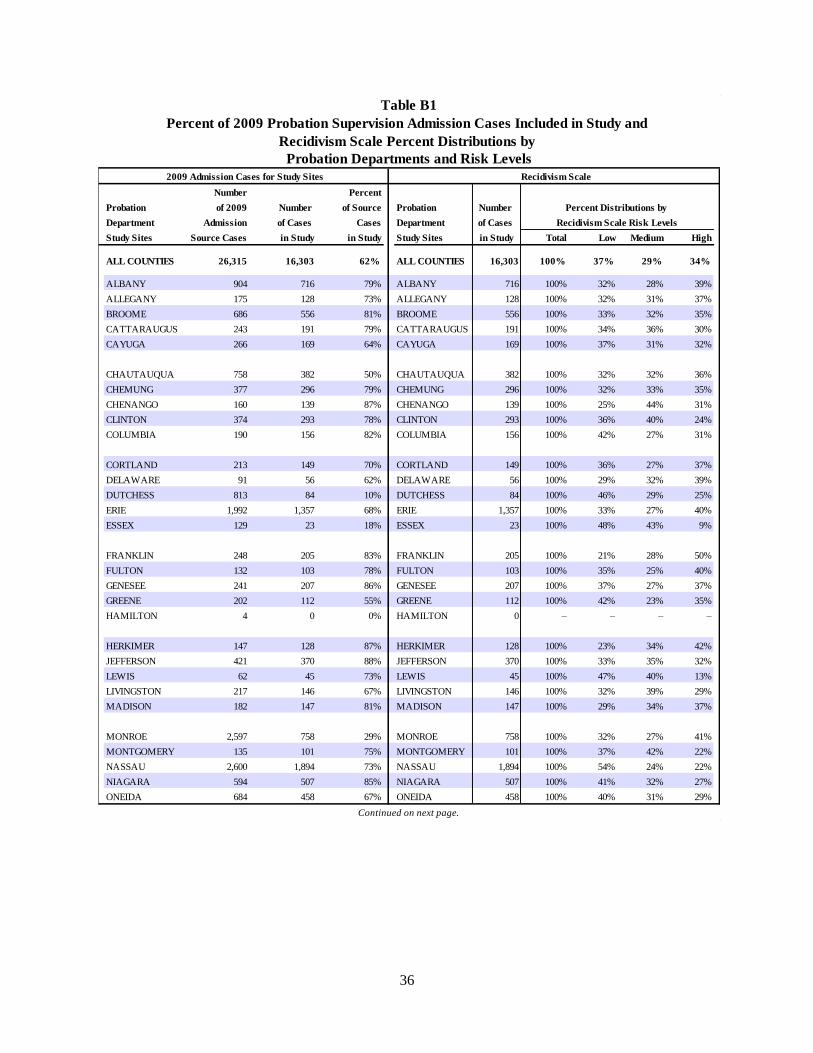
36
Number Percent
Probation of 2009 Number of Source Probation Number
Department Admission of Cases Cases Department of Cases
Study Sites Source Cases in Study in Study Study Sites in Study Total Low Medium High
ALL COUNTIES 26,315 16,303 62% ALL COUNTIES 16,303 100% 37% 29% 34%
ALBANY 904 716 79% ALBANY 716 100% 32% 28% 39%
ALLEGANY 175 128 73% ALLEGANY 128 100% 32% 31% 37%
BROOME 686 556 81% BROOME 556 100% 33% 32% 35%
CATTARAUGUS 243 191 79% CATTARAUGUS 191 100% 34% 36% 30%
CAYUGA 266 169 64% CAYUGA 169 100% 37% 31% 32%
CHAUTAUQUA 758 382 50% CHAUTAUQUA 382 100% 32% 32% 36%
CHEMUNG 377 296 79% CHEMUNG 296 100% 32% 33% 35%
CHENANGO 160 139 87% CHENANGO 139 100% 25% 44% 31%
CLINTON 374 293 78% CLINTON 293 100% 36% 40% 24%
COLUMBIA 190 156 82% COLUMBIA 156 100% 42% 27% 31%
CORTLAND 213 149 70% CORTLAND 149 100% 36% 27% 37%
DELAWARE 91 56 62% DELAWARE 56 100% 29% 32% 39%
DUTCHESS 813 84 10% DUTCHESS 84 100% 46% 29% 25%
ERIE 1,992 1,357 68% ERIE 1,357 100% 33% 27% 40%
ESSEX 129 23 18% ESSEX 23 100% 48% 43% 9%
FRANKLIN 248 205 83% FRANKLIN 205 100% 21% 28% 50%
FULTON 132 103 78% FULTON 103 100% 35% 25% 40%
GENESEE 241 207 86% GENESEE 207 100% 37% 27% 37%
GREENE 202 112 55% GREENE 112 100% 42% 23% 35%
HAMILTON 4 0 0% HAMILTON 0 – – – –
HERKIMER 147 128 87% HERKIMER 128 100% 23% 34% 42%
JEFFERSON 421 370 88% JEFFERSON 370 100% 33% 35% 32%
LEWIS 62 45 73% LEWIS 45 100% 47% 40% 13%
LIVINGSTON 217 146 67% LIVINGSTON 146 100% 32% 39% 29%
MADISON 182 147 81% MADISON 147 100% 29% 34% 37%
MONROE 2,597 758 29% MONROE 758 100% 32% 27% 41%
MONTGOMERY 135 101 75% MONTGOMERY 101 100% 37% 42% 22%
NASSAU 2,600 1,894 73% NASSAU 1,894 100% 54% 24% 22%
NIAGARA 594 507 85% NIAGARA 507 100% 41% 32% 27%
ONEIDA 684 458 67% ONEIDA 458 100% 40% 31% 29%
Table B1
Percent of 2009 Probation Supervision Admission Cases Included in Study and
Recidivism Scale Percent Distributions by
Probation Departments and Risk Levels
2009 Admission Cases for Study Sites Recidivism Scale
Percent Distributions by
Recidivism Scale Risk Levels
Continued on next page.
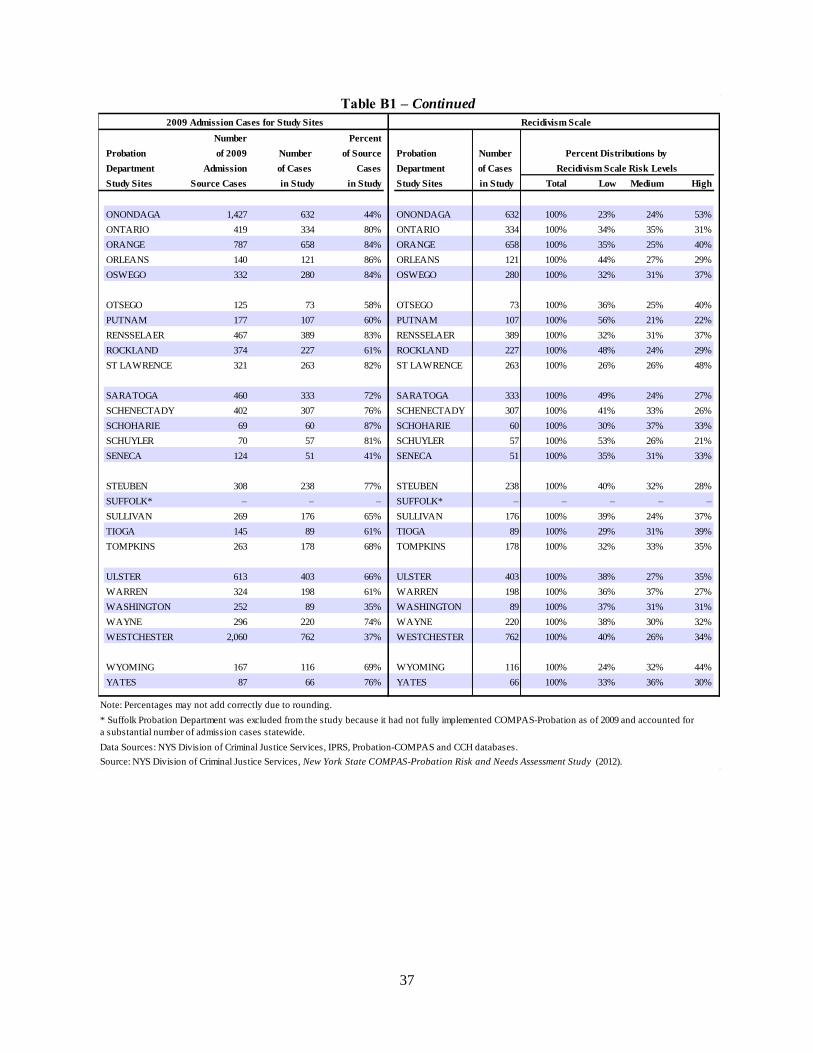
37
Number Percent
Probation of 2009 Number of Source Probation Number
Department Admission of Cases Cases Department of Cases
Study Sites Source Cases in Study in Study Study Sites in Study Total Low Medium High
ONONDAGA 1,427 632 44% ONONDAGA 632 100% 23% 24% 53%
ONTARIO 419 334 80% ONTARIO 334 100% 34% 35% 31%
ORANGE 787 658 84% ORANGE 658 100% 35% 25% 40%
ORLEANS 140 121 86% ORLEANS 121 100% 44% 27% 29%
OSWEGO 332 280 84% OSWEGO 280 100% 32% 31% 37%
OTSEGO 125 73 58% OTSEGO 73 100% 36% 25% 40%
PUTNAM 177 107 60% PUTNAM 107 100% 56% 21% 22%
RENSSELAER 467 389 83% RENSSELAER 389 100% 32% 31% 37%
ROCKLAND 374 227 61% ROCKLAND 227 100% 48% 24% 29%
ST LAWRENCE 321 263 82% ST LAWRENCE 263 100% 26% 26% 48%
SARATOGA 460 333 72% SARATOGA 333 100% 49% 24% 27%
SCHENECTADY 402 307 76% SCHENECTADY 307 100% 41% 33% 26%
SCHOHARIE 69 60 87% SCHOHARIE 60 100% 30% 37% 33%
SCHUYLER 70 57 81% SCHUYLER 57 100% 53% 26% 21%
SENECA 124 51 41% SENECA 51 100% 35% 31% 33%
STEUBEN 308 238 77% STEUBEN 238 100% 40% 32% 28%
SUFFOLK* – – – SUFFOLK* – – – – –
SULLIVAN 269 176 65% SULLIVAN 176 100% 39% 24% 37%
TIOGA 145 89 61% TIOGA 89 100% 29% 31% 39%
TOMPKINS 263 178 68% TOMPKINS 178 100% 32% 33% 35%
ULSTER 613 403 66% ULSTER 403 100% 38% 27% 35%
WARREN 324 198 61% WARREN 198 100% 36% 37% 27%
WASHINGTON 252 89 35% WASHINGTON 89 100% 37% 31% 31%
WAYNE 296 220 74% WAYNE 220 100% 38% 30% 32%
WESTCHESTER 2,060 762 37% WESTCHESTER 762 100% 40% 26% 34%
WYOMING 167 116 69% WYOMING 116 100% 24% 32% 44%
YATES 87 66 76% YATES 66 100% 33% 36% 30%
Note: Percentages may not add correctly due to rounding.
* Suffolk Probation Department was excluded from the study because it had not fully implemented COMPAS-Probation as of 2009 and accounted for
a substantial number of admission cases statewide.
Data Sources: NYS Division of Criminal Justice Services, IPRS, Probation-COMPAS and CCH databases.
Source: NYS Division of Criminal Justice Services, New York State COMPAS-Probation Risk and Needs Assessment Study (2012).
2009 Admission Cases for Study Sites Recidivism Scale
Percent Distributions by
Recidivism Scale Risk Levels
Table B1 – Continued
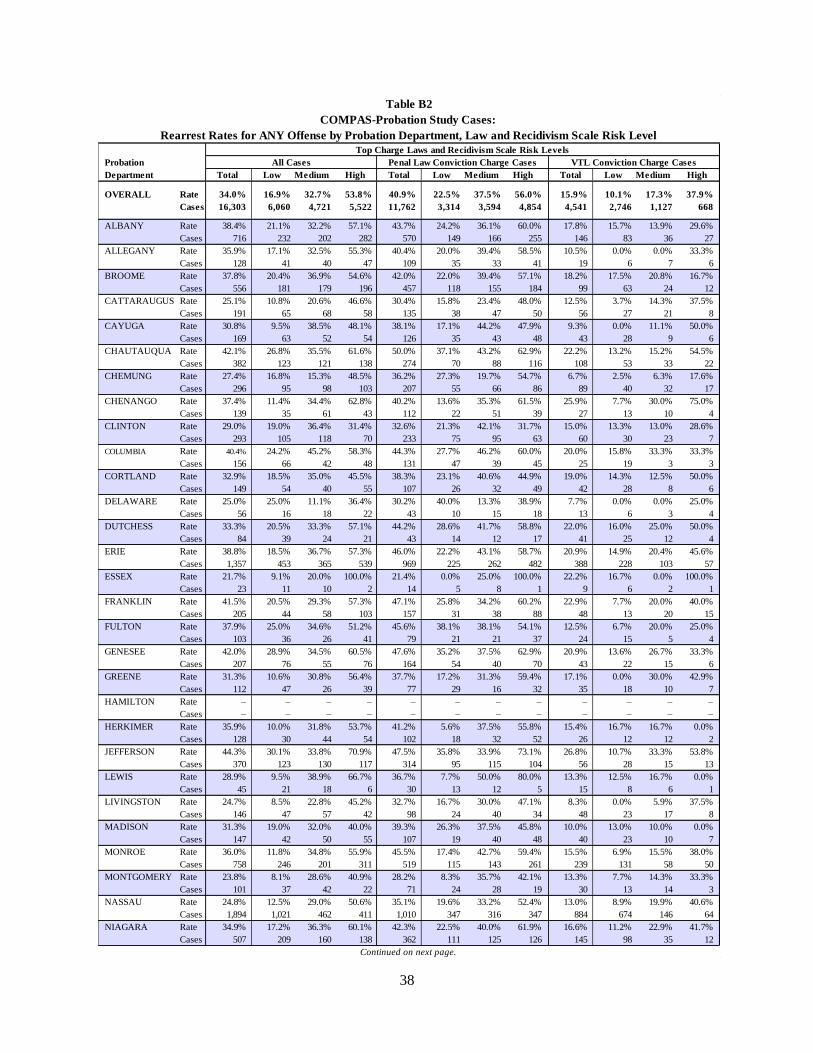
38
Probation
Department Low Medium Low Medium High Low Medium
OVERALL Rate 34.0% 16.9% 32.7% 53.8% 40.9% 22.5% 37.5% 56.0% 15.9% 10.1% 17.3% 37.9%
Cases 16,303 6,060 4,721 5,522 11,762 3,314 3,594 4,854 4,541 2,746 1,127 668
ALBANY Rate 38.4% 21.1% 32.2% 57.1% 43.7% 24.2% 36.1% 60.0% 17.8% 15.7% 13.9% 29.6%
Cases 716 232 202 282 570 149 166 255 146 83 36 27
ALLEGANY Rate 35.9% 17.1% 32.5% 55.3% 40.4% 20.0% 39.4% 58.5% 10.5% 0.0% 0.0% 33.3%
Cases 128 41 40 47 109 35 33 41 19 6 7 6
BROOME Rate 37.8% 20.4% 36.9% 54.6% 42.0% 22.0% 39.4% 57.1% 18.2% 17.5% 20.8% 16.7%
Cases 556 181 179 196 457 118 155 184 99 63 24 12
CATTARAUGUS Rate 25.1% 10.8% 20.6% 46.6% 30.4% 15.8% 23.4% 48.0% 12.5% 3.7% 14.3% 37.5%
Cases 191 65 68 58 135 38 47 50 56 27 21 8
CAYUGA Rate 30.8% 9.5% 38.5% 48.1% 38.1% 17.1% 44.2% 47.9% 9.3% 0.0% 11.1% 50.0%
Cases 169 63 52 54 126 35 43 48 43 28 9 6
CHAUTAUQUA Rate 42.1% 26.8% 35.5% 61.6% 50.0% 37.1% 43.2% 62.9% 22.2% 13.2% 15.2% 54.5%
Cases 382 123 121 138 274 70 88 116 108 53 33 22
CHEMUNG Rate 27.4% 16.8% 15.3% 48.5% 36.2% 27.3% 19.7% 54.7% 6.7% 2.5% 6.3% 17.6%
Cases 296 95 98 103 207 55 66 86 89 40 32 17
CHENANGO Rate 37.4% 11.4% 34.4% 62.8% 40.2% 13.6% 35.3% 61.5% 25.9% 7.7% 30.0% 75.0%
Cases 139 35 61 43 112 22 51 39 27 13 10 4
CLINTON Rate 29.0% 19.0% 36.4% 31.4% 32.6% 21.3% 42.1% 31.7% 15.0% 13.3% 13.0% 28.6%
Cases 293 105 118 70 233 75 95 63 60 30 23 7
COLUMBIA Rate 40.4% 24.2% 45.2% 58.3% 44.3% 27.7% 46.2% 60.0% 20.0% 15.8% 33.3% 33.3%
Cases 156 66 42 48 131 47 39 45 25 19 3 3
CORTLAND Rate 32.9% 18.5% 35.0% 45.5% 38.3% 23.1% 40.6% 44.9% 19.0% 14.3% 12.5% 50.0%
Cases 149 54 40 55 107 26 32 49 42 28 8 6
DELAWARE Rate 25.0% 25.0% 11.1% 36.4% 30.2% 40.0% 13.3% 38.9% 7.7% 0.0% 0.0% 25.0%
Cases 56 16 18 22 43 10 15 18 13 6 3 4
DUTCHESS Rate 33.3% 20.5% 33.3% 57.1% 44.2% 28.6% 41.7% 58.8% 22.0% 16.0% 25.0% 50.0%
Cases 84 39 24 21 43 14 12 17 41 25 12 4
ERIE Rate 38.8% 18.5% 36.7% 57.3% 46.0% 22.2% 43.1% 58.7% 20.9% 14.9% 20.4% 45.6%
Cases 1,357 453 365 539 969 225 262 482 388 228 103 57
ESSEX Rate 21.7% 9.1% 20.0% 100.0% 21.4% 0.0% 25.0% 100.0% 22.2% 16.7% 0.0% 100.0%
Cases 23 11 10 2 14 5 8 1 9 6 2 1
FRANKLIN Rate 41.5% 20.5% 29.3% 57.3% 47.1% 25.8% 34.2% 60.2% 22.9% 7.7% 20.0% 40.0%
Cases 205 44 58 103 157 31 38 88 48 13 20 15
FULTON Rate 37.9% 25.0% 34.6% 51.2% 45.6% 38.1% 38.1% 54.1% 12.5% 6.7% 20.0% 25.0%
Cases 103 36 26 41 79 21 21 37 24 15 5 4
GENESEE Rate 42.0% 28.9% 34.5% 60.5% 47.6% 35.2% 37.5% 62.9% 20.9% 13.6% 26.7% 33.3%
Cases 207 76 55 76 164 54 40 70 43 22 15 6
GREENE Rate 31.3% 10.6% 30.8% 56.4% 37.7% 17.2% 31.3% 59.4% 17.1% 0.0% 30.0% 42.9%
Cases 112 47 26 39 77 29 16 32 35 18 10 7
HAMILTON Rate – – – – – – – – – – – –
Cases – – – – – – – – – – – –
HERKIMER Rate 35.9% 10.0% 31.8% 53.7% 41.2% 5.6% 37.5% 55.8% 15.4% 16.7% 16.7% 0.0%
Cases 128 30 44 54 102 18 32 52 26 12 12 2
JEFFERSON Rate 44.3% 30.1% 33.8% 70.9% 47.5% 35.8% 33.9% 73.1% 26.8% 10.7% 33.3% 53.8%
Cases 370 123 130 117 314 95 115 104 56 28 15 13
LEWIS Rate 28.9% 9.5% 38.9% 66.7% 36.7% 7.7% 50.0% 80.0% 13.3% 12.5% 16.7% 0.0%
Cases 45 21 18 6 30 13 12 5 15 8 6 1
LIVINGSTON Rate 24.7% 8.5% 22.8% 45.2% 32.7% 16.7% 30.0% 47.1% 8.3% 0.0% 5.9% 37.5%
Cases 146 47 57 42 98 24 40 34 48 23 17 8
MADISON Rate 31.3% 19.0% 32.0% 40.0% 39.3% 26.3% 37.5% 45.8% 10.0% 13.0% 10.0% 0.0%
Cases 147 42 50 55 107 19 40 48 40 23 10 7
MONROE Rate 36.0% 11.8% 34.8% 55.9% 45.5% 17.4% 42.7% 59.4% 15.5% 6.9% 15.5% 38.0%
Cases 758 246 201 311 519 115 143 261 239 131 58 50
MONTGOMERY Rate 23.8% 8.1% 28.6% 40.9% 28.2% 8.3% 35.7% 42.1% 13.3% 7.7% 14.3% 33.3%
Cases 101 37 42 22 71 24 28 19 30 13 14 3
NASSAU Rate 24.8% 12.5% 29.0% 50.6% 35.1% 19.6% 33.2% 52.4% 13.0% 8.9% 19.9% 40.6%
Cases 1,894 1,021 462 411 1,010 347 316 347 884 674 146 64
NIAGARA Rate 34.9% 17.2% 36.3% 60.1% 42.3% 22.5% 40.0% 61.9% 16.6% 11.2% 22.9% 41.7%
Cases 507 209 160 138 362 111 125 126 145 98 35 12
Table B2
VTL Conviction Charge CasesPenal Law Conviction Charge CasesAll Cases
Top Charge Laws and Recidivism Scale Risk Levels
Continued on next page.
COMPAS-Probation Study Cases:
Rearrest Rates for ANY Offense by Probation Department, Law and Recidivism Scale Risk Level
Total Total TotalHigh High

39
Probation
Department Low Medium Low Medium High Low Medium
ONEIDA Rate 34.1% 18.8% 36.4% 52.2% 39.4% 21.4% 41.4% 54.2% 17.3% 14.5% 14.8% 35.7%
Cases 458 181 143 134 348 112 116 120 110 69 27 14
ONONDAGA Rate 37.2% 13.6% 25.3% 52.8% 40.9% 18.1% 28.9% 53.7% 15.2% 2.4% 4.5% 42.9%
Cases 632 147 150 335 540 105 128 307 92 42 22 28
ONTARIO Rate 29.9% 18.3% 24.8% 49.0% 32.9% 22.1% 26.6% 47.8% 20.7% 12.8% 17.4% 58.3%
Cases 334 115 117 102 252 68 94 90 82 47 23 12
ORANGE Rate 34.0% 11.7% 35.8% 52.7% 40.1% 14.3% 41.1% 54.0% 18.1% 8.6% 19.5% 44.4%
Cases 658 231 165 262 476 126 124 226 182 105 41 36
ORLEANS Rate 27.3% 13.2% 36.4% 40.0% 31.9% 17.2% 39.3% 38.2% 13.3% 8.3% 20.0% 100.0%
Cases 121 53 33 35 91 29 28 34 30 24 5 1
OSWEGO Rate 35.0% 20.0% 32.6% 50.0% 39.0% 23.5% 35.8% 50.0% 22.9% 15.4% 21.1% 50.0%
Cases 280 90 86 104 210 51 67 92 70 39 19 12
OTSEGO Rate 42.5% 34.6% 50.0% 44.8% 48.1% 38.1% 63.6% 50.0% 26.3% 20.0% 28.6% 28.6%
Cases 73 26 18 29 54 21 11 22 19 5 7 7
PUTNAM Rate 32.7% 16.7% 47.8% 58.3% 44.3% 22.2% 50.0% 72.2% 17.4% 12.1% 42.9% 16.7%
Cases 107 60 23 24 61 27 16 18 46 33 7 6
RENSSELAER Rate 38.0% 22.4% 43.4% 47.2% 42.1% 25.6% 48.1% 48.8% 18.2% 14.3% 12.5% 33.3%
Cases 389 125 122 142 323 90 106 127 66 35 16 15
ROCKLAND Rate 35.7% 18.5% 44.4% 56.9% 41.4% 19.6% 46.8% 57.6% 21.5% 17.3% 28.6% 50.0%
Cases 227 108 54 65 162 56 47 59 65 52 7 6
ST LAWRENCE Rate 41.8% 20.3% 36.8% 56.3% 46.4% 27.1% 40.0% 58.3% 23.1% 4.8% 23.1% 44.4%
Cases 263 69 68 126 211 48 55 108 52 21 13 18
SARATOGA Rate 36.0% 26.5% 39.5% 50.0% 45.9% 38.9% 45.6% 54.4% 13.7% 9.0% 25.0% 18.2%
Cases 333 162 81 90 231 95 57 79 102 67 24 11
SCHENECTADY Rate 34.2% 23.0% 29.7% 57.5% 38.4% 27.5% 34.2% 58.1% 13.5% 4.2% 13.6% 50.0%
Cases 307 126 101 80 255 102 79 74 52 24 22 6
SCHOHARIE Rate 16.7% 5.6% 9.1% 35.0% 23.5% 14.3% 15.4% 35.7% 7.7% 0.0% 0.0% 33.3%
Cases 60 18 22 20 34 7 13 14 26 11 9 6
SCHUYLER Rate 15.8% 10.0% 33.3% 8.3% 16.2% 5.9% 50.0% 0.0% 15.0% 15.4% 0.0% 50.0%
Cases 57 30 15 12 37 17 10 10 20 13 5 2
SENECA Rate 17.6% 0.0% 6.3% 47.1% 28.6% 0.0% 14.3% 50.0% 4.3% 0.0% 0.0% 33.3%
Cases 51 18 16 17 28 7 7 14 23 11 9 3
STEUBEN Rate 27.7% 9.5% 31.2% 50.0% 35.3% 14.3% 33.3% 62.3% 7.7% 0.0% 25.0% 0.0%
Cases 238 95 77 66 173 63 57 53 65 32 20 13
SUFFOLK Rate – – – – – – – – – – – –
Cases – – – – – – – – – – – –
SULLIVAN Rate 27.8% 5.9% 32.6% 47.7% 35.9% 6.1% 37.5% 53.8% 11.9% 5.7% 18.2% 23.1%
Cases 176 68 43 65 117 33 32 52 59 35 11 13
TIOGA Rate 36.0% 26.9% 39.3% 40.0% 46.2% 40.0% 50.0% 46.7% 8.3% 9.1% 12.5% 0.0%
Cases 89 26 28 35 65 15 20 30 24 11 8 5
TOMPKINS Rate 32.0% 12.3% 25.9% 55.6% 43.2% 20.0% 31.6% 64.6% 13.4% 6.3% 15.0% 26.7%
Cases 178 57 58 63 111 25 38 48 67 32 20 15
ULSTER Rate 38.7% 23.5% 32.7% 59.4% 45.0% 29.0% 37.2% 61.2% 16.7% 15.0% 14.3% 33.3%
Cases 403 153 107 143 313 93 86 134 90 60 21 9
WARREN Rate 33.8% 19.7% 32.9% 53.7% 38.9% 26.5% 34.4% 57.1% 11.1% 4.5% 22.2% 20.0%
Cases 198 71 73 54 162 49 64 49 36 22 9 5
WASHINGTON Rate 33.7% 24.2% 32.1% 46.4% 41.5% 33.3% 42.1% 48.0% 12.5% 8.3% 11.1% 33.3%
Cases 89 33 28 28 65 21 19 25 24 12 9 3
WAYNE Rate 30.0% 15.5% 27.7% 49.3% 35.2% 21.4% 31.9% 48.2% 20.0% 9.5% 16.7% 53.3%
Cases 220 84 65 71 145 42 47 56 75 42 18 15
WESTCHESTER Rate 33.7% 11.4% 33.0% 60.9% 42.6% 15.3% 38.4% 62.9% 13.1% 7.7% 16.3% 41.7%
Cases 762 306 200 256 533 150 151 232 229 156 49 24
WYOMING Rate 31.9% 14.3% 21.6% 49.0% 37.8% 16.7% 30.8% 50.0% 11.5% 10.0% 0.0% 40.0%
Cases 116 28 37 51 90 18 26 46 26 10 11 5
YATES Rate 37.9% 22.7% 41.7% 50.0% 40.0% 21.1% 50.0% 50.0% 27.3% 33.3% 16.7% 50.0%Cases 66 22 24 20 55 19 18 18 11 3 6 2
Note: Percentages may not add correctly due to rounding.
* Suffolk Probation Department was excluded because it had not fully implemented COMPAS-Probation as of 2009 and accounted for a substantial number of
admission cases statewide. None of the Hamiltion Probation Department's four 2009 admission cases met the selection critiera for inclusion in the study.
Data Sources: NYS Division of Criminal Justice Services IPRS, Probation-COMPAS and CCH databases.
Source: NYS Division of Criminal Justice Services, New York State COMPAS-Probation Risk and Needs Assessment Study (2012).
High High
Top Charge Laws and Recidivism Scale Risk Levels
All Cases Penal Law Conviction Charge Cases VTL Conviction Charge Cases
Total Total Total
Table B2 – Continued
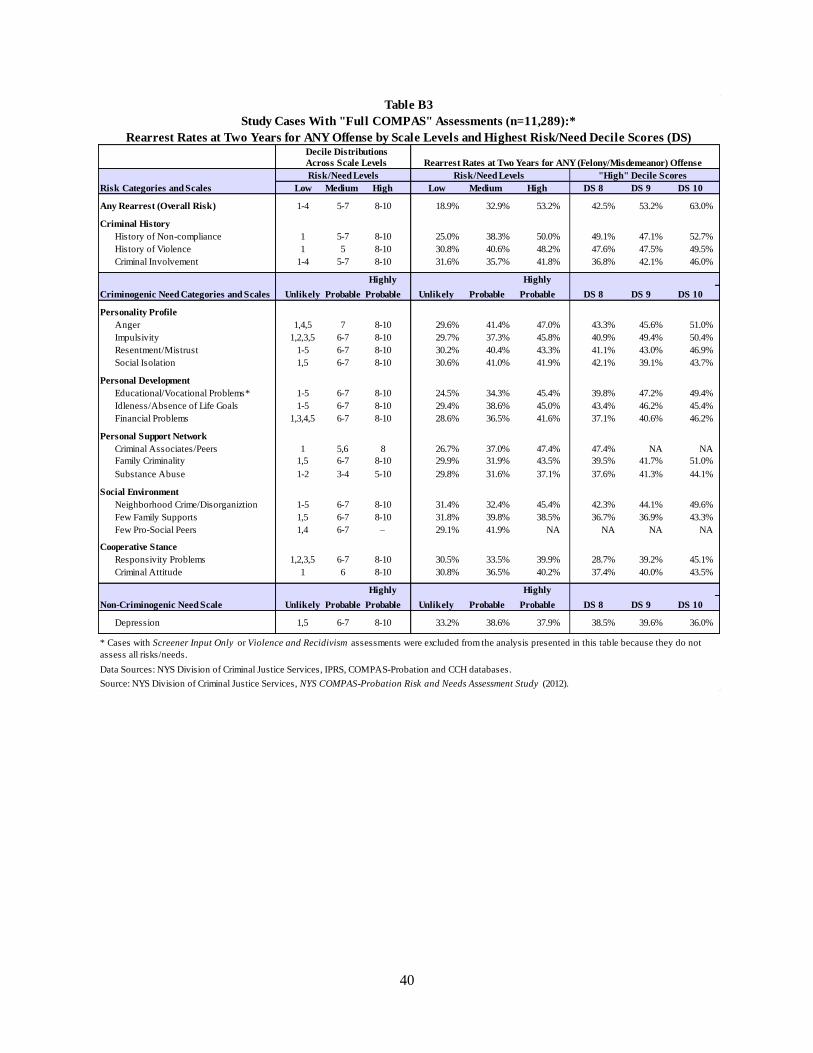
40
Risk Categories and Scales Low Medium High Low Medium High DS 8 DS 9 DS 10
Any Rearrest (Overall Risk) 1-4 5-7 8-10 18.9% 32.9% 53.2% 42.5% 53.2% 63.0%
Criminal History
History of Non-compliance 1 5-7 8-10 25.0% 38.3% 50.0% 49.1% 47.1% 52.7%
History of Violence 1 5 8-10 30.8% 40.6% 48.2% 47.6% 47.5% 49.5%
Criminal Involvement 1-4 5-7 8-10 31.6% 35.7% 41.8% 36.8% 42.1% 46.0%
Highly Highly
Criminogenic Need Categories and Scales Unlikely Probable Probable Unlikely Probable Probable DS 8 DS 9 DS 10
Personality Profile
Anger 1,4,5 7 8-10 29.6% 41.4% 47.0% 43.3% 45.6% 51.0%
Impulsivity 1,2,3,5 6-7 8-10 29.7% 37.3% 45.8% 40.9% 49.4% 50.4%
Resentment/Mistrust 1-5 6-7 8-10 30.2% 40.4% 43.3% 41.1% 43.0% 46.9%
Social Isolation 1,5 6-7 8-10 30.6% 41.0% 41.9% 42.1% 39.1% 43.7%
Personal Development
Educational/Vocational Problems* 1-5 6-7 8-10 24.5% 34.3% 45.4% 39.8% 47.2% 49.4%
Idleness/Absence of Life Goals 1-5 6-7 8-10 29.4% 38.6% 45.0% 43.4% 46.2% 45.4%
Financial Problems 1,3,4,5 6-7 8-10 28.6% 36.5% 41.6% 37.1% 40.6% 46.2%
Personal Support Network
Criminal Associates/Peers 1 5,6 8 26.7% 37.0% 47.4% 47.4% NA NA
Family Criminality 1,5 6-7 8-10 29.9% 31.9% 43.5% 39.5% 41.7% 51.0%
Substance Abuse 1-2 3-4 5-10 29.8% 31.6% 37.1% 37.6% 41.3% 44.1%
Social Environment
Neighborhood Crime/Disorganiztion 1-5 6-7 8-10 31.4% 32.4% 45.4% 42.3% 44.1% 49.6%
Few Family Supports 1,5 6-7 8-10 31.8% 39.8% 38.5% 36.7% 36.9% 43.3%
Few Pro-Social Peers 1,4 6-7 – 29.1% 41.9% NA NA NA NA
Cooperative Stance
Responsivity Problems 1,2,3,5 6-7 8-10 30.5% 33.5% 39.9% 28.7% 39.2% 45.1%
Criminal Attitude 1 6 8-10 30.8% 36.5% 40.2% 37.4% 40.0% 43.5%
Highly Highly
Non-Criminogenic Need Scale Unlikely Probable Probable Unlikely Probable Probable DS 8 DS 9 DS 10
Depression 1,5 6-7 8-10 33.2% 38.6% 37.9% 38.5% 39.6% 36.0%
* Cases with Screener Input Only or Violence and Recidivism assessments were excluded from the analysis presented in this table because they do not
assess all risks/needs.
Data Sources: NYS Division of Criminal Justice Services, IPRS, COMPAS-Probation and CCH databases.
Source: NYS Division of Criminal Justice Services, NYS COMPAS-Probation Risk and Needs Assessment Study (2012).
Study Cases With "Full COMPAS" Assessments (n=11,289):*
Rearrest Rates at Two Years for ANY Offense by Scale Levels and Highest Risk/Need Decile Scores (DS)Decile Distributions
Across Scale Levels Rearrest Rates at Two Years for ANY (Felony/Misdemeanor) Offense
Risk/Need Levels "High" Decile Scores Risk/Need Levels
Table B3
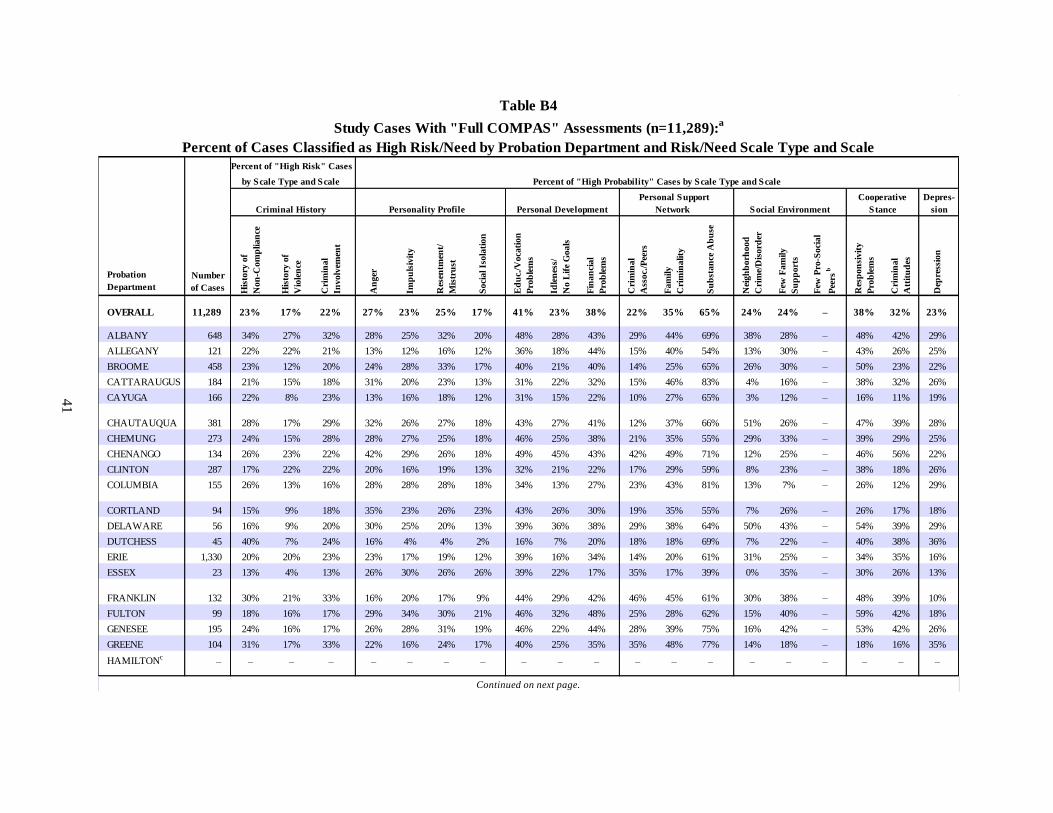
41
Probation
Department His
tory
of
Non
-Com
plian
ce
His
tory
of
Vio
len
ce
Cri
min
al
Involv
emen
t
An
ger
Imp
uls
ivit
y
Res
entm
ent/
Mis
tru
st
Soci
al Is
ola
tion
Ed
uc.
/Voca
tion
Pro
ble
ms
Idle
nes
s/
No L
ife
Goals
Fin
an
cial
Pro
ble
ms
Cri
min
al
Ass
oc.
/Pee
rs
Fam
ily
Cri
min
ality
Su
bst
an
ce A
bu
se
Nei
gh
borh
ood
Cri
me/
Dis
ord
er
Few
Fam
ily
Su
pp
ort
s
Few
Pro
-Soci
al
Pee
rsb
Res
pon
sivit
y
Pro
ble
ms
Cri
min
al
Att
itu
des
Dep
ress
ion
OVERALL 11,289 23% 17% 22% 27% 23% 25% 17% 41% 23% 38% 22% 35% 65% 24% 24% – 38% 32% 23%
ALBANY 648 34% 27% 32% 28% 25% 32% 20% 48% 28% 43% 29% 44% 69% 38% 28% – 48% 42% 29%
ALLEGANY 121 22% 22% 21% 13% 12% 16% 12% 36% 18% 44% 15% 40% 54% 13% 30% – 43% 26% 25%
BROOME 458 23% 12% 20% 24% 28% 33% 17% 40% 21% 40% 14% 25% 65% 26% 30% – 50% 23% 22%
CATTARAUGUS 184 21% 15% 18% 31% 20% 23% 13% 31% 22% 32% 15% 46% 83% 4% 16% – 38% 32% 26%
CAYUGA 166 22% 8% 23% 13% 16% 18% 12% 31% 15% 22% 10% 27% 65% 3% 12% – 16% 11% 19%
CHAUTAUQUA 381 28% 17% 29% 32% 26% 27% 18% 43% 27% 41% 12% 37% 66% 51% 26% – 47% 39% 28%
CHEMUNG 273 24% 15% 28% 28% 27% 25% 18% 46% 25% 38% 21% 35% 55% 29% 33% – 39% 29% 25%
CHENANGO 134 26% 23% 22% 42% 29% 26% 18% 49% 45% 43% 42% 49% 71% 12% 25% – 46% 56% 22%
CLINTON 287 17% 22% 22% 20% 16% 19% 13% 32% 21% 22% 17% 29% 59% 8% 23% – 38% 18% 26%
COLUMBIA 155 26% 13% 16% 28% 28% 28% 18% 34% 13% 27% 23% 43% 81% 13% 7% – 26% 12% 29%
CORTLAND 94 15% 9% 18% 35% 23% 26% 23% 43% 26% 30% 19% 35% 55% 7% 26% – 26% 17% 18%
DELAWARE 56 16% 9% 20% 30% 25% 20% 13% 39% 36% 38% 29% 38% 64% 50% 43% – 54% 39% 29%
DUTCHESS 45 40% 7% 24% 16% 4% 4% 2% 16% 7% 20% 18% 18% 69% 7% 22% – 40% 38% 36%
ERIE 1,330 20% 20% 23% 23% 17% 19% 12% 39% 16% 34% 14% 20% 61% 31% 25% – 34% 35% 16%
ESSEX 23 13% 4% 13% 26% 30% 26% 26% 39% 22% 17% 35% 17% 39% 0% 35% – 30% 26% 13%
FRANKLIN 132 30% 21% 33% 16% 20% 17% 9% 44% 29% 42% 46% 45% 61% 30% 38% – 48% 39% 10%
FULTON 99 18% 16% 17% 29% 34% 30% 21% 46% 32% 48% 25% 28% 62% 15% 40% – 59% 42% 18%
GENESEE 195 24% 16% 17% 26% 28% 31% 19% 46% 22% 44% 28% 39% 75% 16% 42% – 53% 42% 26%
GREENE 104 31% 17% 33% 22% 16% 24% 17% 40% 25% 35% 35% 48% 77% 14% 18% – 18% 16% 35%
HAMILTONc
– – – – – – – – – – – – – – – – – – – –
Percent of Cases Classified as High Risk/Need by Probation Department and Risk/Need Scale Type and Scale
Study Cases With "Full COMPAS" Assessments (n=11,289):a
Table B4
Continued on next page.
by Scale Type and Scale
Criminal History Personality Profile
Percent of "High Risk" Cases
Personal Support Cooperative
Personal Development Social Environment
Number
of Cases
Network Stance
Percent of "High Probability" Cases by Scale Type and Scale
Depres-
sion
41
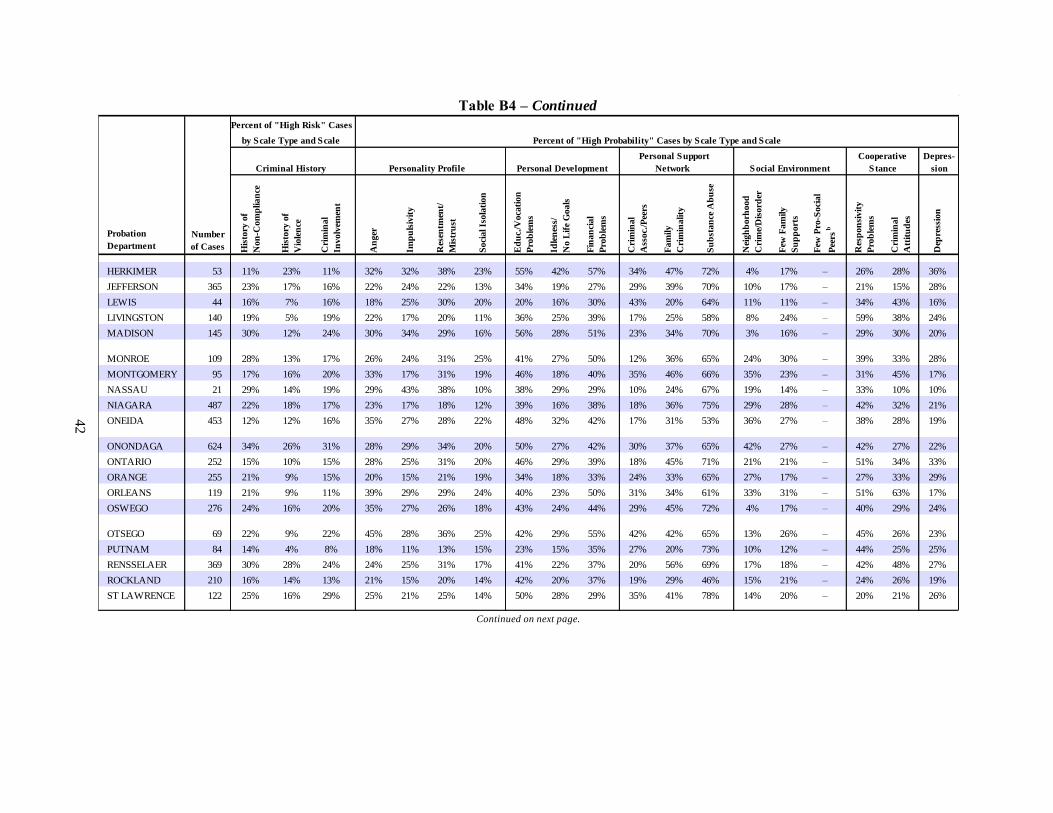
42
Probation
Department His
tory
of
Non
-Com
plian
ce
His
tory
of
Vio
len
ce
Cri
min
al
Involv
emen
t
An
ger
Imp
uls
ivit
y
Res
entm
ent/
Mis
tru
st
Soci
al Is
ola
tion
Ed
uc.
/Voca
tion
Pro
ble
ms
Idle
nes
s/
No L
ife
Goals
Fin
an
cial
Pro
ble
ms
Cri
min
al
Ass
oc.
/Pee
rs
Fam
ily
Cri
min
ality
Su
bst
an
ce A
bu
se
Nei
gh
borh
ood
Cri
me/
Dis
ord
er
Few
Fam
ily
Su
pp
ort
s
Few
Pro
-Soci
al
Pee
rsb
Res
pon
sivit
y
Pro
ble
ms
Cri
min
al
Att
itu
des
Dep
ress
ion
HERKIMER 53 11% 23% 11% 32% 32% 38% 23% 55% 42% 57% 34% 47% 72% 4% 17% – 26% 28% 36%
JEFFERSON 365 23% 17% 16% 22% 24% 22% 13% 34% 19% 27% 29% 39% 70% 10% 17% – 21% 15% 28%
LEWIS 44 16% 7% 16% 18% 25% 30% 20% 20% 16% 30% 43% 20% 64% 11% 11% – 34% 43% 16%
LIVINGSTON 140 19% 5% 19% 22% 17% 20% 11% 36% 25% 39% 17% 25% 58% 8% 24% – 59% 38% 24%
MADISON 145 30% 12% 24% 30% 34% 29% 16% 56% 28% 51% 23% 34% 70% 3% 16% – 29% 30% 20%
MONROE 109 28% 13% 17% 26% 24% 31% 25% 41% 27% 50% 12% 36% 65% 24% 30% – 39% 33% 28%
MONTGOMERY 95 17% 16% 20% 33% 17% 31% 19% 46% 18% 40% 35% 46% 66% 35% 23% – 31% 45% 17%
NASSAU 21 29% 14% 19% 29% 43% 38% 10% 38% 29% 29% 10% 24% 67% 19% 14% – 33% 10% 10%
NIAGARA 487 22% 18% 17% 23% 17% 18% 12% 39% 16% 38% 18% 36% 75% 29% 28% – 42% 32% 21%
ONEIDA 453 12% 12% 16% 35% 27% 28% 22% 48% 32% 42% 17% 31% 53% 36% 27% – 38% 28% 19%
ONONDAGA 624 34% 26% 31% 28% 29% 34% 20% 50% 27% 42% 30% 37% 65% 42% 27% – 42% 27% 22%
ONTARIO 252 15% 10% 15% 28% 25% 31% 20% 46% 29% 39% 18% 45% 71% 21% 21% – 51% 34% 33%
ORANGE 255 21% 9% 15% 20% 15% 21% 19% 34% 18% 33% 24% 33% 65% 27% 17% – 27% 33% 29%
ORLEANS 119 21% 9% 11% 39% 29% 29% 24% 40% 23% 50% 31% 34% 61% 33% 31% – 51% 63% 17%
OSWEGO 276 24% 16% 20% 35% 27% 26% 18% 43% 24% 44% 29% 45% 72% 4% 17% – 40% 29% 24%
OTSEGO 69 22% 9% 22% 45% 28% 36% 25% 42% 29% 55% 42% 42% 65% 13% 26% – 45% 26% 23%
PUTNAM 84 14% 4% 8% 18% 11% 13% 15% 23% 15% 35% 27% 20% 73% 10% 12% – 44% 25% 25%
RENSSELAER 369 30% 28% 24% 24% 25% 31% 17% 41% 22% 37% 20% 56% 69% 17% 18% – 42% 48% 27%
ROCKLAND 210 16% 14% 13% 21% 15% 20% 14% 42% 20% 37% 19% 29% 46% 15% 21% – 24% 26% 19%
ST LAWRENCE 122 25% 16% 29% 25% 21% 25% 14% 50% 28% 29% 35% 41% 78% 14% 20% – 20% 21% 26%
Number
of Cases
Continued on next page.
Criminal History Personality Profile Personal Development Network Social Environment Stance sion
Personal Support Cooperative
Percent of "High Risk" Cases
Table B4 – Continued
by Scale Type and Scale Percent of "High Probability" Cases by Scale Type and Scale
Depres-
42
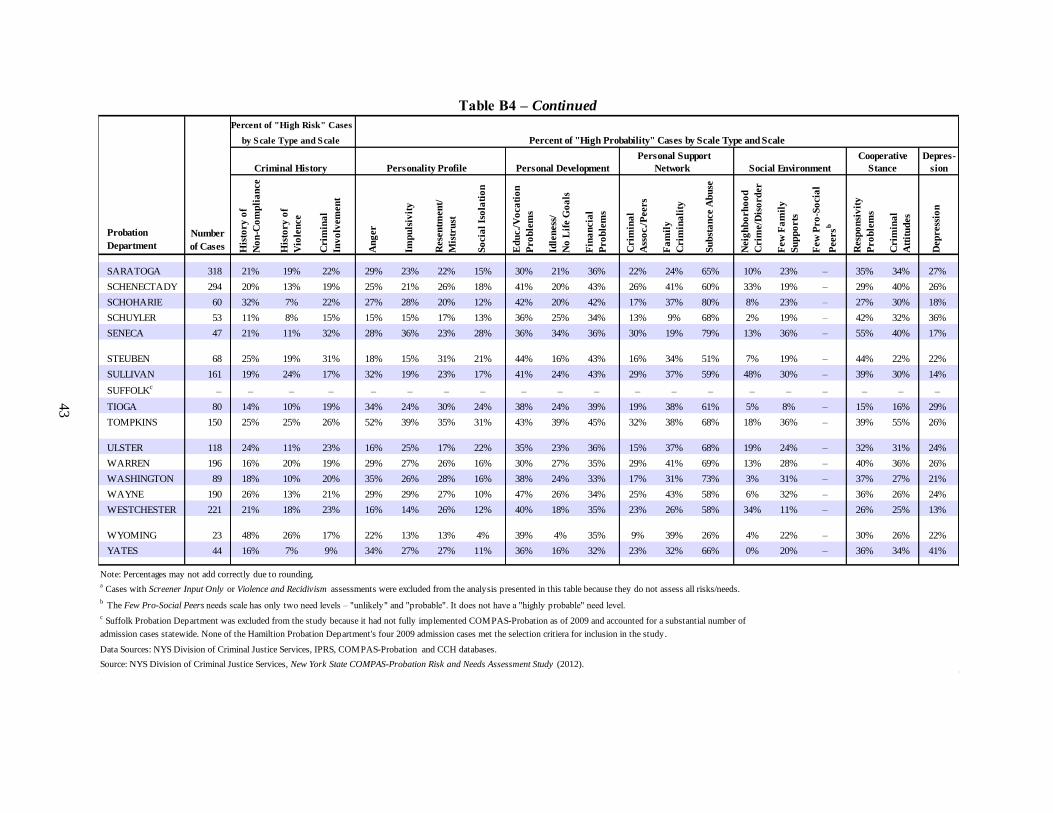
43
Probation
Department His
tory
of
No
n-C
om
pli
an
ce
His
tory
of
Vio
len
ce
Crim
ina
l
Inv
olv
em
en
t
An
ger
Imp
uls
ivit
y
Rese
ntm
en
t/
Mis
tru
st
So
cia
l Is
ola
tio
n
Ed
uc./
Vo
ca
tio
n
Pro
ble
ms
Idle
ness
/
No
Lif
e G
oa
ls
Fin
an
cia
l
Pro
ble
ms
Crim
ina
l
Ass
oc./
Peers
Fa
mil
y
Crim
ina
lity
Su
bst
an
ce A
bu
se
Neig
hb
orh
oo
d
Crim
e/D
iso
rd
er
Few
Fa
mil
y
Su
pp
orts
Few
Pro
-So
cia
l
Peers
b
Resp
on
siv
ity
Pro
ble
ms
Crim
ina
l
Att
itu
des
Dep
ress
ion
SARATOGA 318 21% 19% 22% 29% 23% 22% 15% 30% 21% 36% 22% 24% 65% 10% 23% – 35% 34% 27%
SCHENECTADY 294 20% 13% 19% 25% 21% 26% 18% 41% 20% 43% 26% 41% 60% 33% 19% – 29% 40% 26%
SCHOHARIE 60 32% 7% 22% 27% 28% 20% 12% 42% 20% 42% 17% 37% 80% 8% 23% – 27% 30% 18%
SCHUYLER 53 11% 8% 15% 15% 15% 17% 13% 36% 25% 34% 13% 9% 68% 2% 19% – 42% 32% 36%
SENECA 47 21% 11% 32% 28% 36% 23% 28% 36% 34% 36% 30% 19% 79% 13% 36% – 55% 40% 17%
STEUBEN 68 25% 19% 31% 18% 15% 31% 21% 44% 16% 43% 16% 34% 51% 7% 19% – 44% 22% 22%
SULLIVAN 161 19% 24% 17% 32% 19% 23% 17% 41% 24% 43% 29% 37% 59% 48% 30% – 39% 30% 14%
SUFFOLKc
– – – – – – – – – – – – – – – – – – – –
TIOGA 80 14% 10% 19% 34% 24% 30% 24% 38% 24% 39% 19% 38% 61% 5% 8% – 15% 16% 29%
TOMPKINS 150 25% 25% 26% 52% 39% 35% 31% 43% 39% 45% 32% 38% 68% 18% 36% – 39% 55% 26%
ULSTER 118 24% 11% 23% 16% 25% 17% 22% 35% 23% 36% 15% 37% 68% 19% 24% – 32% 31% 24%
WARREN 196 16% 20% 19% 29% 27% 26% 16% 30% 27% 35% 29% 41% 69% 13% 28% – 40% 36% 26%
WASHINGTON 89 18% 10% 20% 35% 26% 28% 16% 38% 24% 33% 17% 31% 73% 3% 31% – 37% 27% 21%
WAYNE 190 26% 13% 21% 29% 29% 27% 10% 47% 26% 34% 25% 43% 58% 6% 32% – 36% 26% 24%
WESTCHESTER 221 21% 18% 23% 16% 14% 26% 12% 40% 18% 35% 23% 26% 58% 34% 11% – 26% 25% 13%
WYOMING 23 48% 26% 17% 22% 13% 13% 4% 39% 4% 35% 9% 39% 26% 4% 22% – 30% 26% 22%
YATES 44 16% 7% 9% 34% 27% 27% 11% 36% 16% 32% 23% 32% 66% 0% 20% – 36% 34% 41%
Note: Percentages may not add correctly due to rounding.a Cases with Screener Input Only or Violence and Recidivism assessments were excluded from the analysis presented in this table because they do not assess all risks/needs.
b Suffolk Probation Department was excluded from the study because it had not fully implemented COMPAS-Probation as of 2009 and accounted for a substantial number of The Few Pro-Social Peers needs scale has only two need levels – "unlikely" and "probable". It does not have a "highly probable" need level.
c Suffolk Probation Department was excluded from the study because it had not fully implemented COMPAS-Probation as of 2009 and accounted for a substantial number of
admission cases statewide. None of the Hamiltion Probation Department's four 2009 admission cases met the selection critiera for inclusion in the study.
Data Sources: NYS Division of Criminal Justice Services, IPRS, COMPAS-Probation and CCH databases.
Source: NYS Division of Criminal Justice Services, New York State COMPAS-Probation Risk and Needs Assessment Study (2012).
Table B4 – Continued
Personal Support
Percent of "High Risk" Cases
by Scale Type and Scale Percent of "High Probability" Cases by Scale Type and Scale
Number
of Cases
Cooperative Depres-
Criminal History Personality Profile Personal Development Network Social Environment Stance sion
43
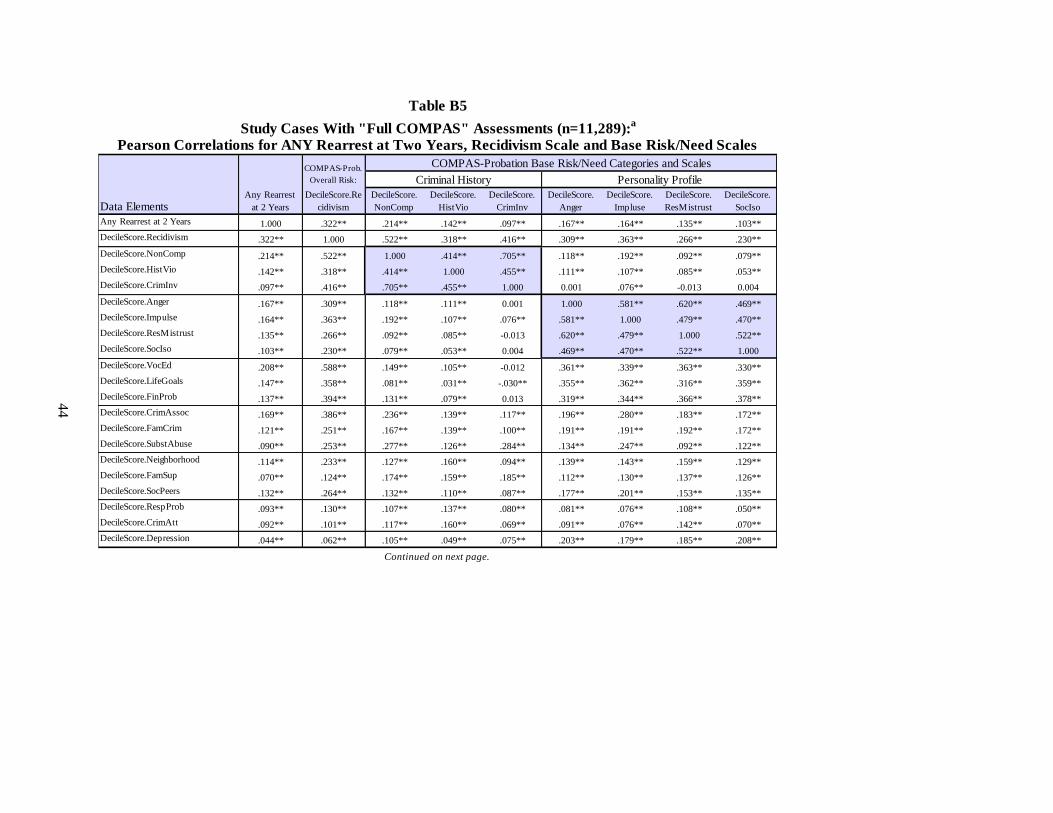
44
Criminal History
Data ElementsAny Rearrest
at 2 Years
DecileScore.Re
cidivism
DecileScore.
NonComp
DecileScore.
HistVio
DecileScore.
CrimInv
DecileScore.
Anger
DecileScore.
Impluse
DecileScore.
ResMistrust
DecileScore.
SocIso
Any Rearrest at 2 Years 1.000 .322** .214** .142** .097** .167** .164** .135** .103**
DecileScore.Recidivism .322** 1.000 .522** .318** .416** .309** .363** .266** .230**
DecileScore.NonComp .214** .522** 1.000 .414** .705** .118** .192** .092** .079**
DecileScore.HistVio .142** .318** .414** 1.000 .455** .111** .107** .085** .053**
DecileScore.CrimInv .097** .416** .705** .455** 1.000 0.001 .076** -0.013 0.004
DecileScore.Anger .167** .309** .118** .111** 0.001 1.000 .581** .620** .469**
DecileScore.Impulse .164** .363** .192** .107** .076** .581** 1.000 .479** .470**
DecileScore.ResMistrust .135** .266** .092** .085** -0.013 .620** .479** 1.000 .522**
DecileScore.SocIso .103** .230** .079** .053** 0.004 .469** .470** .522** 1.000
DecileScore.VocEd .208** .588** .149** .105** -0.012 .361** .339** .363** .330**
DecileScore.LifeGoals .147** .358** .081** .031** -.030** .355** .362** .316** .359**
DecileScore.FinProb .137** .394** .131** .079** 0.013 .319** .344** .366** .378**
DecileScore.CrimAssoc .169** .386** .236** .139** .117** .196** .280** .183** .172**
DecileScore.FamCrim .121** .251** .167** .139** .100** .191** .191** .192** .172**
DecileScore.SubstAbuse .090** .253** .277** .126** .284** .134** .247** .092** .122**
DecileScore.Neighborhood .114** .233** .127** .160** .094** .139** .143** .159** .129**
DecileScore.FamSup .070** .124** .174** .159** .185** .112** .130** .137** .126**
DecileScore.SocPeers .132** .264** .132** .110** .087** .177** .201** .153** .135**
DecileScore.RespProb .093** .130** .107** .137** .080** .081** .076** .108** .050**
DecileScore.CrimAtt .092** .101** .117** .160** .069** .091** .076** .142** .070**
DecileScore.Depression .044** .062** .105** .049** .075** .203** .179** .185** .208**
Pearson Correlations for ANY Rearrest at Two Years, Recidivism Scale and Base Risk/Need Scales
Table B5
Study Cases With "Full COMPAS" Assessments (n=11,289):a
Personality Profile
COMPAS-Probation Base Risk/Need Categories and ScalesCOMPAS-Prob.
Overall Risk:
Continued on next page.
44
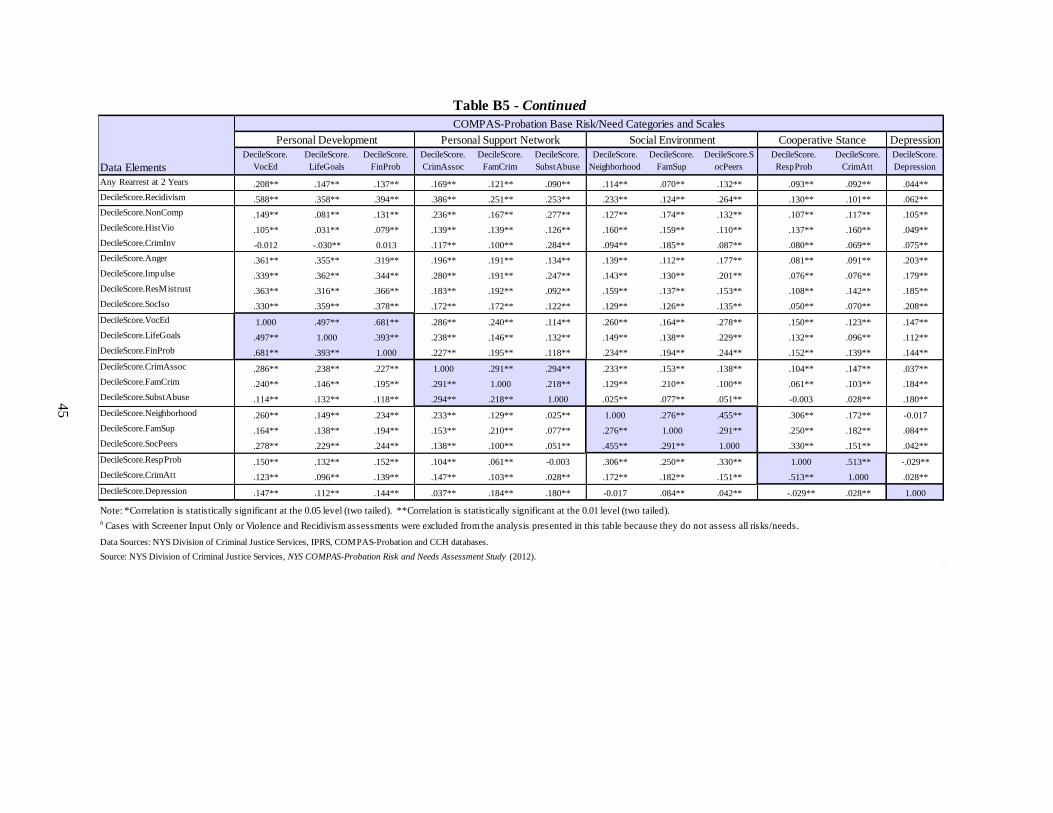
45
Personal Development Personal Support Network Social Environment Depression
Data Elements
DecileScore.
VocEd
DecileScore.
LifeGoals
DecileScore.
FinProb
DecileScore.
CrimAssoc
DecileScore.
FamCrim
DecileScore.
SubstAbuse
DecileScore.
Neighborhood
DecileScore.
FamSup
DecileScore.S
ocPeers
DecileScore.
CrimAtt
DecileScore.
Depression
Any Rearrest at 2 Years .208** .147** .137** .169** .121** .090** .114** .070** .132** .093** .092** .044**
DecileScore.Recidivism .588** .358** .394** .386** .251** .253** .233** .124** .264** .130** .101** .062**
DecileScore.NonComp .149** .081** .131** .236** .167** .277** .127** .174** .132** .107** .117** .105**
DecileScore.HistVio .105** .031** .079** .139** .139** .126** .160** .159** .110** .137** .160** .049**
DecileScore.CrimInv -0.012 -.030** 0.013 .117** .100** .284** .094** .185** .087** .080** .069** .075**
DecileScore.Anger .361** .355** .319** .196** .191** .134** .139** .112** .177** .081** .091** .203**
DecileScore.Impulse .339** .362** .344** .280** .191** .247** .143** .130** .201** .076** .076** .179**
DecileScore.ResMistrust .363** .316** .366** .183** .192** .092** .159** .137** .153** .108** .142** .185**
DecileScore.SocIso .330** .359** .378** .172** .172** .122** .129** .126** .135** .050** .070** .208**
DecileScore.VocEd 1.000 .497** .681** .286** .240** .114** .260** .164** .278** .150** .123** .147**
DecileScore.LifeGoals .497** 1.000 .393** .238** .146** .132** .149** .138** .229** .132** .096** .112**
DecileScore.FinProb .681** .393** 1.000 .227** .195** .118** .234** .194** .244** .152** .139** .144**
DecileScore.CrimAssoc .286** .238** .227** 1.000 .291** .294** .233** .153** .138** .104** .147** .037**
DecileScore.FamCrim .240** .146** .195** .291** 1.000 .218** .129** .210** .100** .061** .103** .184**
DecileScore.SubstAbuse .114** .132** .118** .294** .218** 1.000 .025** .077** .051** -0.003 .028** .180**
DecileScore.Neighborhood .260** .149** .234** .233** .129** .025** 1.000 .276** .455** .306** .172** -0.017
DecileScore.FamSup .164** .138** .194** .153** .210** .077** .276** 1.000 .291** .250** .182** .084**
DecileScore.SocPeers .278** .229** .244** .138** .100** .051** .455** .291** 1.000 .330** .151** .042**
DecileScore.RespProb .150** .132** .152** .104** .061** -0.003 .306** .250** .330** 1.000 .513** -.029**
DecileScore.CrimAtt .123** .096** .139** .147** .103** .028** .172** .182** .151** .513** 1.000 .028**
DecileScore.Depression .147** .112** .144** .037** .184** .180** -0.017 .084** .042** -.029** .028** 1.000
Note: *Correlation is statistically significant at the 0.05 level (two tailed). **Correlation is statistically significant at the 0.01 level (two tailed).a Cases with Screener Input Only or Violence and Recidivism assessments were excluded from the analysis presented in this table because they do not assess all risks/needs.
Data Sources: NYS Division of Criminal Justice Services, IPRS, COMPAS-Probation and CCH databases.
Source: NYS Division of Criminal Justice Services, NYS COMPAS-Probation Risk and Needs Assessment Study (2012).
DecileScore.
RespProb
Table B5 - Continued
Cooperative Stance
COMPAS-Probation Base Risk/Need Categories and Scales
45
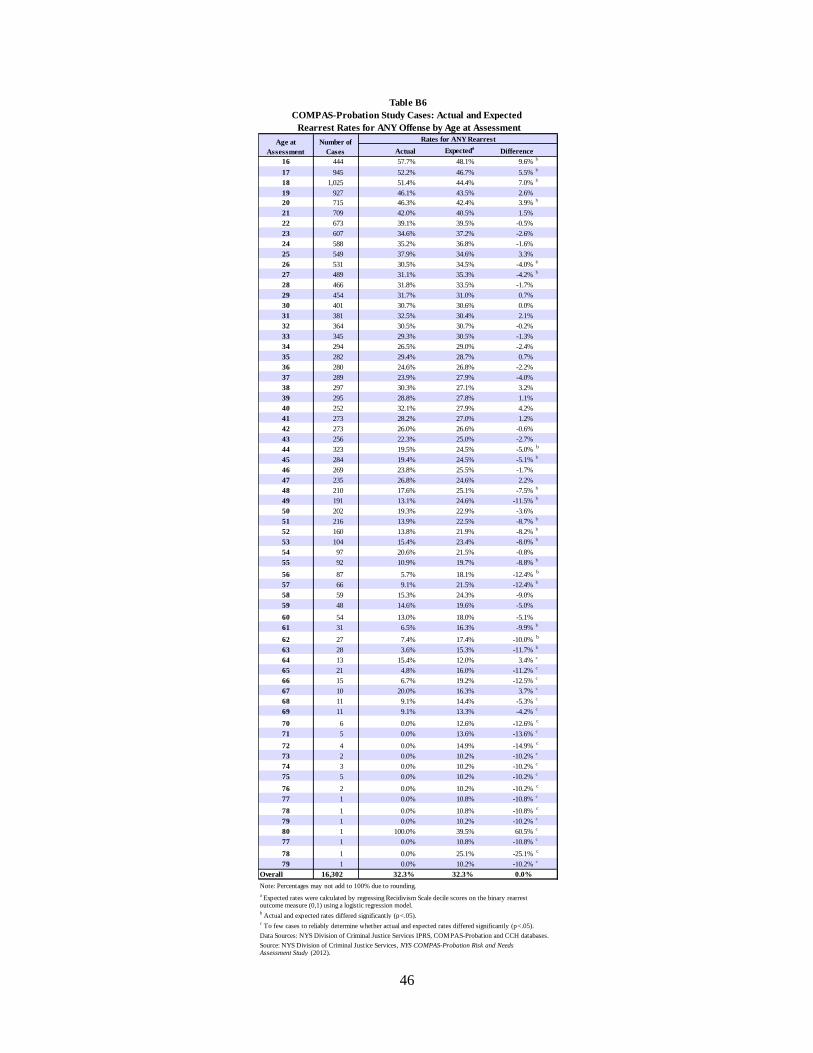
46
Actual Expecteda
Difference
16 444 57.7% 48.1% 9.6%b
17 945 52.2% 46.7% 5.5%b
18 1,025 51.4% 44.4% 7.0%b
19 927 46.1% 43.5% 2.6%
20 715 46.3% 42.4% 3.9%b
21 709 42.0% 40.5% 1.5%
22 673 39.1% 39.5% -0.5%
23 607 34.6% 37.2% -2.6%
24 588 35.2% 36.8% -1.6%
25 549 37.9% 34.6% 3.3%
26 531 30.5% 34.5% -4.0%b
27 489 31.1% 35.3% -4.2%b
28 466 31.8% 33.5% -1.7%
29 454 31.7% 31.0% 0.7%
30 401 30.7% 30.6% 0.0%
31 381 32.5% 30.4% 2.1%
32 364 30.5% 30.7% -0.2%
33 345 29.3% 30.5% -1.3%
34 294 26.5% 29.0% -2.4%
35 282 29.4% 28.7% 0.7%
36 280 24.6% 26.8% -2.2%
37 289 23.9% 27.9% -4.0%
38 297 30.3% 27.1% 3.2%
39 295 28.8% 27.8% 1.1%
40 252 32.1% 27.9% 4.2%
41 273 28.2% 27.0% 1.2%
42 273 26.0% 26.6% -0.6%
43 256 22.3% 25.0% -2.7%
44 323 19.5% 24.5% -5.0%b
45 284 19.4% 24.5% -5.1%b
46 269 23.8% 25.5% -1.7%
47 235 26.8% 24.6% 2.2%
48 210 17.6% 25.1% -7.5%b
49 191 13.1% 24.6% -11.5%b
50 202 19.3% 22.9% -3.6%
51 216 13.9% 22.5% -8.7%b
52 160 13.8% 21.9% -8.2%b
53 104 15.4% 23.4% -8.0%b
54 97 20.6% 21.5% -0.8%
55 92 10.9% 19.7% -8.8%b
56 87 5.7% 18.1% -12.4%b
57 66 9.1% 21.5% -12.4%b
58 59 15.3% 24.3% -9.0%
59 48 14.6% 19.6% -5.0%
60 54 13.0% 18.0% -5.1%
61 31 6.5% 16.3% -9.9%b
62 27 7.4% 17.4% -10.0%b
63 28 3.6% 15.3% -11.7%b
64 13 15.4% 12.0% 3.4%c
65 21 4.8% 16.0% -11.2%c
66 15 6.7% 19.2% -12.5%c
67 10 20.0% 16.3% 3.7%c
68 11 9.1% 14.4% -5.3%c
69 11 9.1% 13.3% -4.2%c
70 6 0.0% 12.6% -12.6%c
71 5 0.0% 13.6% -13.6%c
72 4 0.0% 14.9% -14.9%c
73 2 0.0% 10.2% -10.2%c
74 3 0.0% 10.2% -10.2%c
75 5 0.0% 10.2% -10.2%c
76 2 0.0% 10.2% -10.2%c
77 1 0.0% 10.8% -10.8%c
78 1 0.0% 10.8% -10.8%c
79 1 0.0% 10.2% -10.2%c
80 1 100.0% 39.5% 60.5%c
77 1 0.0% 10.8% -10.8%c
78 1 0.0% 25.1% -25.1%c
79 1 0.0% 10.2% -10.2%c
Overall 16,302 32.3% 32.3% 0.0%
Note: Percentages may not add to 100% due to rounding.
a Expected rates were calculated by regressing Recidivism Scale decile scores on the binary rearrest
outcome measure (0,1) using a logistic regression model.b Actual and expected rates differed significantly (p<.05).
c To few cases to reliably determine whether actual and expected rates differed significantly (p<.05).
Data Sources: NYS Division of Criminal Justice Services IPRS, COMPAS-Probation and CCH databases.
Source: NYS Division of Criminal Justice Services, NYS COMPAS-Probation Risk and NeedsAssessment Study (2012).
Table B6
COMPAS-Probation Study Cases: Actual and Expected
Rearrest Rates for ANY Offense by Age at Assessment
Number of
Cases
Rates for ANY RearrestAge at
Assessment

47
Actual Expected Difference
D1 1,634 9.1% 10.8% -1.7% *
D2 1,156 16.1% 13.8% 2.3% *
D3 1,513 19.1% 17.5% 1.6%
D4 1,757 22.8% 21.9% 0.8%
D5 1,465 28.1% 27.1% 1.0%
D6 1,595 33.1% 33.0% 0.1%
D7 1,661 36.4% 39.5% -3.2% *
D8 1,694 42.6% 46.4% -3.8% *
D9 1,797 52.6% 53.4% -0.8%
D10 2,031 64.1% 60.3% 3.8% *
Overall 16,303
Actual Expected Difference
D1 814 12.7% 10.8% 1.9%
D2 594 19.9% 13.8% 6.1% *
D3 814 25.2% 17.5% 7.7% *
1,092 29.4% 21.9% 7.5% *
D5 1,047 33.0% 27.1% 5.8% *
D6 1,228 37.8% 33.0% 4.8% *
D7 1,319 40.9% 39.5% 1.4%
D8 1,416 45.8% 46.4% -0.6%
D9 1,575 54.0% 53.4% 0.5%
D10 1,863 65.4% 60.3% 5.1% *
Overall 11,762
Actual Expected Difference
D1 820 5.5% 10.8% -5.3% *
D2 562 12.1% 13.8% -1.7%
D3 699 12.0% 17.5% -5.5% *
D4 665 11.9% 21.9% -10.0% *
D5 418 16.0% 27.1% -11.1% *
D6 367 17.4% 33.0% -15.6% *
D7 342 18.7% 39.5% -20.8% *
D8 278 26.3% 46.4% -20.1% *
D9 222 43.2% 53.4% -10.2% *
D10 168 50.0% 60.3% -10.3% *
Overall 4,541
Note: Percentages may not add to 100% due to rounding. The asterisk (*) indicates that actual and expected rates differ significantly (p<.05).a
Expected rates were calculated by regressing Recidivism Scale decile scores on the binary rearrest outcome measure (0,1) using a logistic regression model.
Data Sources: NYS Division of Criminal Justice Services IPRS,
COMPAS-Probation and CCH databases.
Source: NYS Division of Criminal Justice Services, NYS COMPAS-Probation
Risk and Needs Assessment Study ( 2012).
Recidivism Scale Decile Scores and Law Type
Table B7
COMPAS-Probation Study Cases:
Actual and Expected Rearrest Rates for ANY Offense by
All COMPAS-Probation Cases
Full-Case Model
Lo
wM
ed
.H
igh
Recidivism Scale
Decile Scores
Number of
Cases
Recidivism Scale
Decile Scores
Number of
Cases
Penal Law Cases = 72% of All Cases
Full-Case Model
Lo
wM
ed
.H
igh
Lo
wM
ed
.H
igh
VTL Cases = 28% of All Cases
Full-Case ModelNumber of
Cases
Recidivism Scale
Decile Scores

48
Appendix C: Additional Figure
Figure C1
All COMPAS-Probation Study Cases: Recidivism Scale
Frequency Distributions by Law Type and Seriousness
Source: NYS Division of Criminal Justice Services, NYS COMPAS-Probation Risk and Needs Assessment Study (2012).
701
518
466
422
361
329
354
245
188
269
0 250 500 750 1,000 1,250
10
9
8
7
6
5
4
3
2
1
Re
cid
ivis
m S
cale
DS
Number of Cases
Felony Penal Law = 24% of All Cases
1,162
1,057
950
897
867
718
738
569
406
545
0 250 500 750 1,000 1,250
10
9
8
7
6
5
4
3
2
1
Re
cid
ivis
m S
cale
DS
Number of Cases
Misdemeanor Penal Law = 49% of All Cases
77
98
141
137
164
194
278
281
205
249
0 250 500 750 1,000 1,250
10
9
8
7
6
5
4
3
2
1
Re
cid
ivis
m S
cale
DS
Number of Cases
Felony VTL = 11% of All Cases
91
124
137
205
203
224
387
418
357
571
0 250 500 750 1,000 1,250
10
9
8
7
6
5
4
3
2
1
Re
cid
ivis
m S
cale
DS
Number of Cases
Misdemeanor VTL = 17% of All Cases
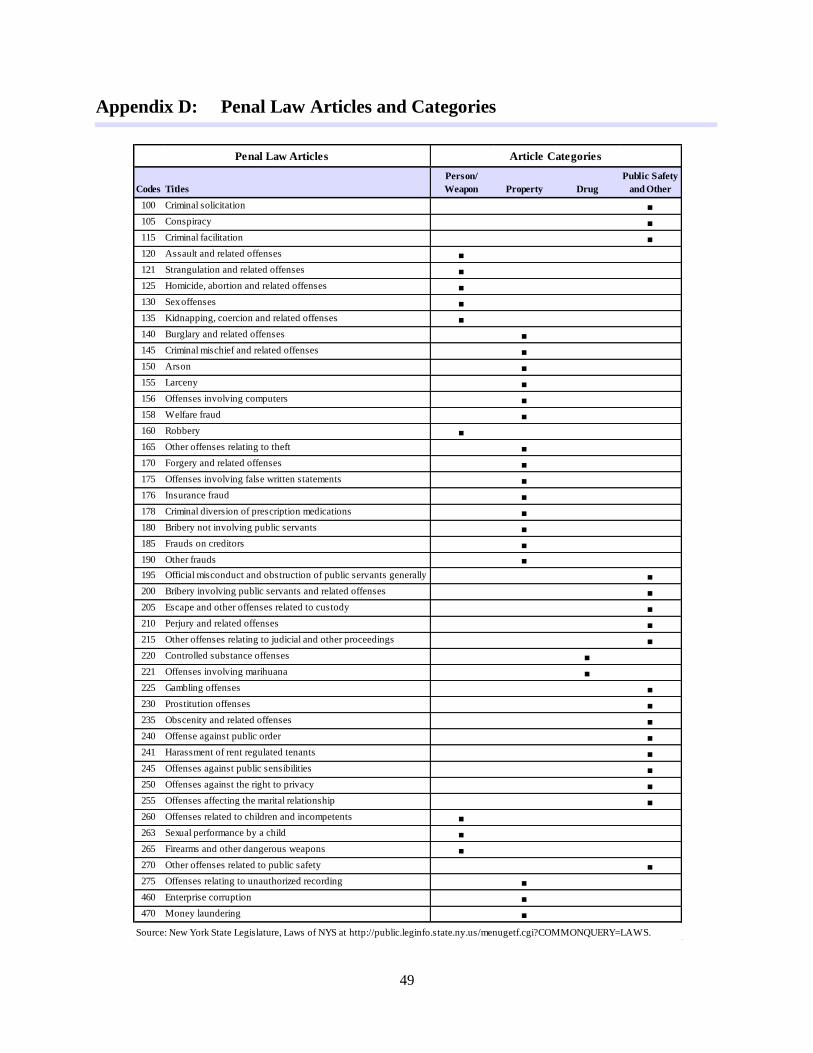
49
Appendix D: Penal Law Articles and Categories
Codes Titles
Person/
Weapon Property Drug
Public Safety
and Other
100 Criminal solicitation ■
105 Conspiracy ■
115 Criminal facilitation ■
120 Assault and related offenses ■
121 Strangulation and related offenses ■
125 Homicide, abortion and related offenses ■
130 Sex offenses ■
135 Kidnapping, coercion and related offenses ■
140 Burglary and related offenses ■
145 Criminal mischief and related offenses ■
150 Arson ■
155 Larceny ■
156 Offenses involving computers ■
158 Welfare fraud ■
160 Robbery ■
165 Other offenses relating to theft ■
170 Forgery and related offenses ■
175 Offenses involving false written statements ■
176 Insurance fraud ■
178 Criminal diversion of prescription medications ■
180 Bribery not involving public servants ■
185 Frauds on creditors ■
190 Other frauds ■
195 Official misconduct and obstruction of public servants generally ■
200 Bribery involving public servants and related offenses ■
205 Escape and other offenses related to custody ■
210 Perjury and related offenses ■
215 Other offenses relating to judicial and other proceedings ■
220 Controlled substance offenses ■
221 Offenses involving marihuana ■
225 Gambling offenses ■
230 Prostitution offenses ■
235 Obscenity and related offenses ■
240 Offense against public order ■
241 Harassment of rent regulated tenants ■
245 Offenses against public sensibilities ■
250 Offenses against the right to privacy ■
255 Offenses affecting the marital relationship ■
260 Offenses related to children and incompetents ■
263 Sexual performance by a child ■
265 Firearms and other dangerous weapons ■
270 Other offenses related to public safety ■
275 Offenses relating to unauthorized recording ■
460 Enterprise corruption ■
470 Money laundering ■
Source: New York State Legislature, Laws of NYS at http://public.leginfo.state.ny.us/menugetf.cgi?COMMONQUERY=LAWS.
Penal Law Articles Article Categories