crime in louisiana 2010 - louisiana commission...
TRANSCRIPT
LOUISIANA UNIFORM CRIME REPORTING PROGRAM
CRIME IN LOUISIANA 2010
A REPORT ON THE NUMBER OF OFFENSES REPORTED TO AND THE ARRESTS MADE BY
THE LAW ENFORCEMENT AGENCIES OF LOUISIANA
MAY 2012
LOUISIANA SHERIFFS’ ASSOCIATION LOUISIANA UNIFORM CRIME REPORTING PROGRAM 1175 NICHOLSON DRIVE BATON ROUGE, LOUISIANA 70802 Office 225-343-8402 Fax 225-336-0343
LOUISIANA COMMISSION ON LAW ENFORCEMENT AND ADMINISTRATION OF CRIMINAL JUSTICE P O Box 3133 (602 North 5th Street) BATON ROUGE, LOUISIANA 70821-3133 Office 225-342-1500 Fax 225-342-1824
ii
LOUISIANA UNIFORM CRIME REPORTING PROGRAM
Louisiana Sheriffs’ Association
Sheriff Mike Cazes President
Louisiana Commission on Law Enforcement And Administration of Criminal Justice
Sheriff Jeff Wiley
Chairman
Honorable Harry J. Morel, Jr. Vice Chairman
This public document was published at a cost of $6,730.76. The initial printing of this public document included 550 copies at a cost of $6,730.76. This document was published by the Louisiana Commission on Law Enforcement Uniform Crime Reporting Section, to inform the public of the number of offenses and arrests made in Louisiana under authority of Louisiana Revised Statutes Title 15:1204.2. This material was printed in accordance with provisions of TItle 43 of the Louisiana Revised Statutes. Funding was provided by the State Justice Statistics Grant number B09-8-001 from the United States Department of Justice, Bureau of Justice Assistance through the Louisiana Commission on Law Enforcement.

iii
TABLE OF CONTENTS
Statement of Purpose ............................................................................................ 1
Crime in Louisiana – The Publication .................................................................... 2
The FBI’s Uniform Crime Reporting Program ........................................................ 3
Louisiana’s Uniform Crime Reporting Program ..................................................... 4
Summary UCR System ......................................................................................... 4
UCR-Online ........................................................................................................... 6
Louisiana Incident-Based Reporting System (LIBRS) ........................................... 6
Louisiana Law Enforcement Management Information Systems ........................... 8
Criminal Justice Records Improvement Program .................................................. 9
Reporting Agencies ............................................................................................. 12
2010 Louisiana Part I Offenses ........................................................................... 15
City ...................................................................................................... 16
Metropolitan Parishes ......................................................................... 19
Non-Metropolitan Parishes .................................................................. 19
Tribal State and Other State Agencies ................................................ 21
University and College Police Departments ........................................ 22
Summary of All Reported Crimes through UCR by Juvenile and Adult ............... 23
Total Index Crimes in Louisiana .......................................................................... 24
Percent Change in Index Crime 2009-2010 ........................................................ 35
Index Crime for Select Cities Comparable in Size to New Orleans ..................... 40
Louisiana’s National Ranking in Index Crime Categories .................................... 43
Louisiana’s Index Crime Trend over Ten Years .................................................. 54
Louisiana Arrest Data 2009-2010 ........................................................................ 61
Weapons Used in Murder, Robbery and Aggravated Assault ............................. 67
iii
Highest Reported Homicides ............................................................................... 75
Law Enforcement Officers Feloniously Killed ...................................................... 77
Law Enforcement Officers and Employees ......................................................... 78
Glossary of Terms ............................................................................................... 83
Comparison of UCR and LIBRS/NIBRS Definitions ............................................ 85
Standard Metropolitan Statistical Areas .............................................................. 89
Contact Information ............................................................................................. 90
iv

- 1 -
STATEMENT OF PURPOSE
The purpose of Crime in Louisiana is to provide the reader with the most current certified information available regarding the number of offenses reported and the number of arrests made by Louisiana law enforcement agencies as recorded in the Summary Uniform Crime Reporting System (UCR). The information is designed to increase public awareness and understanding of such issues. The crime summary points out changes in crime rates between the years of 2009 and 2010 for the agencies that reported the entire 12-month reporting period. Crime trends covering the years of 2001 through 2010 are also included in the report. There are several charts with information on regional breakdowns by cities, metropolitan & non-metropolitan parishes, colleges & universities and other law enforcement entities with offenses on pages 16-22 and data on law enforcement officers on pages 77-82. The reader is reminded that the comparison of data between years and between villages, towns, cities, parishes or law enforcement agencies is discouraged due to the fact that the data presented may not have all of the same contributors year to year or the mitigating circumstances that impact crime rates is not included in the statistics presented in this publication. These statistics represent the available data for this 12-month snapshot by participating agencies for January 1, 2010 through December 31, 2010.
- 2 -
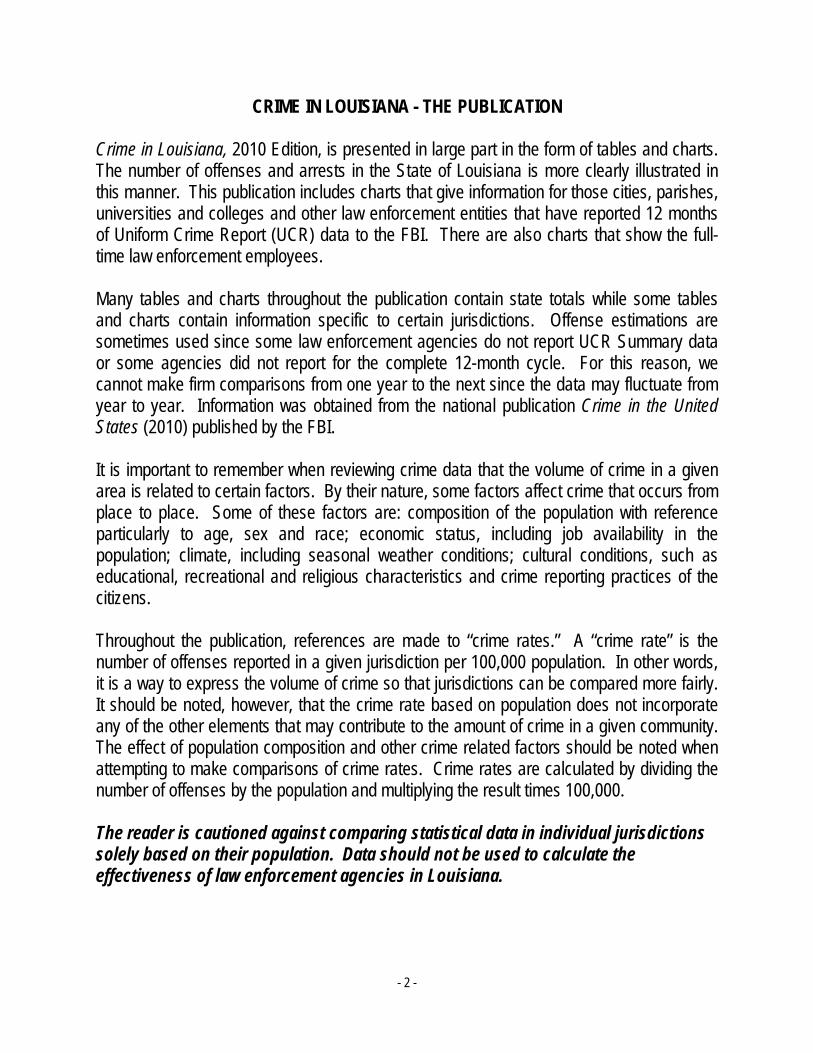
CRIME IN LOUISIANA - THE PUBLICATION Crime in Louisiana, 2010 Edition, is presented in large part in the form of tables and charts. The number of offenses and arrests in the State of Louisiana is more clearly illustrated in this manner. This publication includes charts that give information for those cities, parishes, universities and colleges and other law enforcement entities that have reported 12 months of Uniform Crime Report (UCR) data to the FBI. There are also charts that show the full-time law enforcement employees. Many tables and charts throughout the publication contain state totals while some tables and charts contain information specific to certain jurisdictions. Offense estimations are sometimes used since some law enforcement agencies do not report UCR Summary data or some agencies did not report for the complete 12-month cycle. For this reason, we cannot make firm comparisons from one year to the next since the data may fluctuate from year to year. Information was obtained from the national publication Crime in the United States (2010) published by the FBI. It is important to remember when reviewing crime data that the volume of crime in a given area is related to certain factors. By their nature, some factors affect crime that occurs from place to place. Some of these factors are: composition of the population with reference particularly to age, sex and race; economic status, including job availability in the population; climate, including seasonal weather conditions; cultural conditions, such as educational, recreational and religious characteristics and crime reporting practices of the citizens. Throughout the publication, references are made to “crime rates.” A “crime rate” is the number of offenses reported in a given jurisdiction per 100,000 population. In other words, it is a way to express the volume of crime so that jurisdictions can be compared more fairly. It should be noted, however, that the crime rate based on population does not incorporate any of the other elements that may contribute to the amount of crime in a given community. The effect of population composition and other crime related factors should be noted when attempting to make comparisons of crime rates. Crime rates are calculated by dividing the number of offenses by the population and multiplying the result times 100,000. The reader is cautioned against comparing statistical data in individual jurisdictions solely based on their population. Data should not be used to calculate the effectiveness of law enforcement agencies in Louisiana.
- 3 -
UNIFORM CRIME REPORTING
THE FBI's UNIFORM CRIME REPORTING PROGRAM (UCR) Before 1929, there was no comprehensive system of crime information on a national scale. This was primarily because the terminology defining criminal behavior in criminal statutes varied greatly from state to state. Addressing this problem between 1927 and 1929, the International Association of Chiefs of Police (IACP) conceived, developed and implemented the UCR Program. They designed the program to serve as an operational, administrative, and management tool for law enforcement. Through Congressional action, the Attorney General was authorized to gather the crime data. The responsibility was placed on the FBI, which has acted as the national clearinghouse for statistical information on crime and as administrator of the program since 1930. To provide a picture of the changes in crime across the parish and to provide useful data to police agencies, it was incumbent upon the IACP to limit the statistics to be gathered. Recognizing the problem, among others, of coping with volume, they decided that only those criminal acts deemed most serious, most pervasive across the country, most likely to be reported and most frequently committed would be counted. Furthermore, it was decided to include only criminal acts brought to the attention of police, whether or not there was an arrest. As a result, seven crimes were chosen and standardized definitions were created to assure uniformity. Those seven offenses were murder, rape, robbery, aggravated assault, burglary, larceny theft, and motor vehicle theft. The original publication was a complete manual for police records and statistics. Over the years, the program was expanded to include data on persons arrested, law enforcement officers killed and supplemental information on homicides. To promote participation by sheriffs, in 1966 the National Sheriff’s Association formed the Committee on Uniform Crime Reporting. Later, data on officers assaulted, arson, and bias-motivated crimes were added to the information gathered. Since 1930, the FBI’s Uniform Crime Reporting Program has been collecting crime data from participating states, either from the individual agencies within the states or directly from state programs. Crime data is made available to the public in the FBI’s annual publications, Crime in the United States, Law Enforcement Officers Killed and Assaulted, and Hate Crime Statistics. These statistics are also available at www.fbi.gov/ucr/ucr.htm. Agencies are expected to count all offenses reported to them using the national definitions, disregarding state or local statutes. Because these statistics are meant to assist law enforcement in identifying the crime problem, the decision of a prosecutor, or the findings of a court, coroner, or jury are not taken into consideration in counting offenses. Previously

- 4 -
reported criminal offenses that have been determined through investigation to be unfounded or false are eliminated from an agency’s count. The number of actual offenses known (the final figure used for statistical purposes) counts all offenses regardless if anyone is arrested for the crime, stolen property is recovered, or prosecution is undertaken. In addition, the Summary UCR Program uses the Hierarchy Rule. In this system, the eight Part 1 offenses are ranked in a specific order. In multiple-offense situations, the rule requires counting only the highest offense on the list of Part I offenses and ignoring all other offenses. Justifiable homicide, motor vehicle theft, and arson are exceptions to the rule. Data is collected on arrests for all crimes with the exception of traffic violations. The age, race and sex of offenders are recorded for both adults and juveniles. Because identities of individuals are not involved, confidentiality laws pertaining to juveniles do not preclude their inclusion in the statistical count. Jurisdictional guidelines were developed to prevent duplication in reporting and to accurately depict the nature and volume of crime in a community. They were not intended to indicate which agency claims or takes credit for an investigation or arrest. The guidelines, simplified, state that police report offenses within their city jurisdiction and sheriffs report those offenses outside the city jurisdiction. Agencies count arrests for offenses committed and recovery of property for items reported stolen within their jurisdiction.
LOUISIANA’S UNIFORM CRIME REPORTING PROGRAM (LUCR) In the legislative session of 1991, House Bill 1176 passed both the House and the Senate to become Act 509 creating Louisiana Revised Statute 15:1204.2. This law created and allows for the establishment of a uniform crime reporting system in Louisiana. The Summary Uniform Crime Reporting System was the first of three components to be established. Following it, development of the Louisiana Incident Based Reporting System and the Louisiana Law Enforcement Management Information System began.
SUMMARY UCR SYSTEM The Louisiana Uniform Crime Reporting Program staff established the Summary UCR program in 1991. In September 1993, a formal request for certification was made to the FBI. In October 1993, the FBI certified the Louisiana Summary UCR program. To maintain this certification the LUCR staff must ensure the following:
1. The program must conform to national UCR Program standards, definitions and information requirements.
- 5 -
2. The program must be statewide, proven, and effective and must have instituted acceptable quality control procedures.
3. Coverage within the state by the program must be, at least, equal to that attained by the national program through direct reporting.
4. The program must have adequate field staff assigned to conduct audits and to assist contributing agencies in record-keeping practices and crime reporting procedures.
5. The program must furnish to the FBI all of the detailed data regularly collected by the FBI in the form of duplicate returns, computer printouts, and/or magnetic tapes.
6. The program must have the proven capability (tested over a period of time) to supply all the statistical data required in time to meet national UCR Program publication deadlines.
In 2010, 104 of 144 law enforcement agencies that participate in submitting UCR data reported all 12 months to the FBI. Special effort has been placed on obtaining data from the state’s Standard Metropolitan Statistical Areas (SMSA’s). Currently, the majority of the agencies within the state’s SMSA’s are reporting. The LUCR staff continues to fulfill its responsibilities in connection with the program by editing and reviewing agency reports mailed to LCLE monthly for both completeness and quality. Each report submitted is examined thoroughly for arithmetical accuracy and for deviations, which may indicate errors. To ensure quality, the field staff maintains constant contact with the individual contributors. Minor errors are corrected by telephone, email or by fax between the field agent and the agency. Site visits are conducted regularly and the field staff is “on call” at any time to give technical assistance to agencies in need. The personal contacts are invaluable to the accuracy and quality of reporting and are a vital link between the Summary UCR program and the contributors. Periodic seminars are conducted in key areas of the state as an effort to ensure data quality and to encourage reporting. Seminar instruction includes basic information necessary to begin reporting such as classifying and scoring crimes using UCR crime definitions and preparing all the forms. In addition to seminars, “one-on-one” training sessions are conducted by field staff as needed.

- 6 -
UCR ONLINE UCR Online is a web-based system that was built to securely and accurately manage Louisiana’s Summary Uniform Crime Reporting statistics. The system collects UCR report information from participating agencies from across the state and compiles it into one secure database. The program can be accessed from any computer with Internet access and is compatible with Internet Explorer and Mozilla Firefox. The flow of the system begins with the agency users. Agency users can add and submit new reports online, save a report-in-progress to complete later, view the status of a submitted report, edit previously submitted reports and re-submit them to LCLE. After LCLE receives the submitted UCR report, they have the ability to approve the report and forward the information to the FBI, or reject the report. If a report is rejected, it is sent back to the agency user to review, edit, and re-submit. There are security measures built into the UCR Online system. Each user will be given a user name, an encrypted password in order to access their account and will only see data from their authorized agencies. The web site has a SSL certificate giving the user a secure session. This ensures that data leaving one machine is encrypted until it reaches the server. Furthermore, the database server is isolated from the application server and is protected with a firewall. This means that there is no Internet access to the database server where all crime data is stored. The database server is located in a national hosting site where the physical environment is closely monitored to ensure the protection of the server and all of its information.
LOUISIANA’S INCIDENT-BASED REPORTING SYSTEM (LIBRS) In addition to the ongoing efforts of the Summary Uniform Crime Reporting Program, the state has developed the Louisiana Incident-Based Reporting System (LIBRS). Incident-Based Reporting (IBR), the more generic term used here, is a more detailed form of reporting. It is the result of a study done by law enforcement agencies in our nation in the 1980's to find the needs of law enforcement. Incident-Based Reporting will enhance the quantity, quality and timeliness of statistical data collected by the law enforcement community. It will also improve the methodology used for compiling, analyzing, auditing, and publishing collected crime data.
Incident-Based Reporting is a system that collects information on an incident-by-incident basis. It provides us with all the crimes that occur during a criminal incident, unlike the Summary UCR System that follows the “Hierarchy Rule” which will list the most serious offense and not record the others. An example is that the murder of a woman that has been
- 7 -
robbed, beaten and raped would only document the murder and not the other three crimes. IBR would record the murder, robbery and the rape as three offenses although it all occurred at one time. The IBR system includes a category called “Crimes Against Society” which produces data on crimes such as drug and narcotic offenses. Another important feature of IBR is the expansion of victim-to-offender relationships. The system will also have increased “circumstances” reporting, where more information will be collected in the area of circumstances involved in the offense. There will be more correlation between offenses, property, victims, offenders and arrestees, all pertinent information necessary in crime analysis. In addition, a new area of social concern, hate crimes, has been included in Incident-Based Reporting. Hate crimes are crimes that show prejudice and bias toward a group of people or an individual member of a group. Federal law includes the areas of race, ethnicity, sexual orientation and religion in its definition of hate crime. LIBRS is to serve several functions. It is to replace Summary UCR as the base statistical system for crime data in the state. Second, it is intended to provide the additional statistical information necessary to properly plan modifications to the state criminal justice system. Examples of this include determining the need for additional state prison or local jail space, and the need for additional law enforcement officers. In addition, it will help determine the impact of proposed changes in terms of both cost and programmatic effect. LIBRS is also part of a larger effort to improve criminal justice records at the local level where it serves to both standardize the information collected at point of incident and point of arrest, and to create standards for the electronic transfer of law enforcement data statewide. It is through its role in the improvement of criminal justice records at the local level that LIBRS provides the basis for the state level Criminal Justice Records Improvement Program. The reader will find information regarding the Criminal Justice Records Improvement Program later in this publication. In March 2003, the LIBRS program received FBI (NIBRS) certification. LIBRS is available to law enforcement agencies at no cost to the agencies. By December 2010, there were 40 certified LIBRS agencies in Louisiana. The LIBRS and LUCR staff is working diligently to get more agencies with more detail inclusive LIBRS reporting that will benefit the agencies crime reporting abilities as well as the statewide efforts to report crime in more detail. Please refer to pages 11-13 for a list UCR participating agencies and those that are LIBRS certified agencies.
- 8 -
LOUISIANA LAW ENFORCEMENT MANAGEMENT INFORMATION SYSTEMS
There are numerous law enforcement agencies in the state that do not have computerized law enforcement management software. Because of this, the Louisiana Sheriffs’ Association and the Louisiana Commission on Law Enforcement joined efforts in developing a software package for law enforcement agencies. The first package of software was called LA-LEMIS (Louisiana Law Enforcement Management Information System) and was developed in dBase. In order to provide a more versatile and expandable software package, a newer version called LA-LEMIS 2000 was developed using Oracle for its database engine and it was created to be compatible with the LIBRS 2.0 specifications. LA-LEMIS 2000 automates the operational and record keeping functions of field reporting, inmate bookings, case management, prisoner tracking and administrative and statistical reporting. It also automates functions such as calls for service; incident and arrest reporting; ticket, citation and warrant tracking; property control; and personnel. In addition, LA-LEMIS 2000 features several jail management modules that make up what is known as LOCKDOWN 2000. LOCKDOWN 2000 automates the collection, storage and maintenance of inmate bookings. This includes logs, medical data, housing classification, agency and inmate billings and inmate releases. LOCKDOWN 2000 assigns a unique inmate booking number for the current booking event but the number will be tied to any other bookings that the inmate may have. LCLE also provides the Computer Aided Dispatch 2000 (CAD) software for law enforcement agencies to use in their local territories to dispatch officers to calls and emergencies. LA-LEMIS 2000, which includes CAD 2000 and LOCKDOWN 2000, was developed utilizing Oracle Developer 6 as the graphical interface and Oracle 8 relational database. Recognizing the need to improve Oracle based LA-LEMIS 2000, the Louisiana Sheriffs’ Association and the Louisiana Commission on Law Enforcement began the development of LEMIS IBR. LEMIS IBR, Version 2.0, is a client/server-based record management system for law enforcement agencies currently undergoing beta testing. Once fully tested and accepted LEMIS IBR Version 2.0 will serve as a replacement for LEMIS 2000. The Louisiana Commission on Law Enforcement and Louisiana Sheriffs’ Association will provide LEMIS IBR Version 2.0 application support free of charge to all Louisiana law enforcement agencies. There is no software license required and no database software to purchase. LEMIS IBR Version 2.0 runs on the following Microsoft operating systems which include Server 2003, Windows XP Professional, Windows 2000 Professional, Microsoft Vista Business, Windows 7 Professional and Server 2008. LEMIS IBR Version 2.0 will have
- 9 -
jail management and CAD systems. The major functions of LEMIS IBR Version 2.0 include the following:
• Record Management System (RMS) that handles; complaints, incidents, warrants, citations, tickets and vehicle data
• Simplified installation • Backup utility • LIBRS/NIBRS reporting which eliminates agencies filling out Summary UCR reports
for the FBI • Improved Security • Enhanced User Access control
While not ready for statewide distribution, LEMIS IBR represents the future of crime reporting coupled with record management capabilities in Louisiana. The software packages described in this section give Louisiana law enforcement a complete statewide records management system that coordinates their efforts from the initial contact until the inmate is release or their case has been resolved.
CRIMINAL JUSTICE RECORDS IMPROVEMENT PROGRAM
Since the inception of the Crime Control Act of 1990, the Louisiana Commission on Law Enforcement has undertaken several initiatives to improve Louisiana’s criminal justice records. The LCLE has worked continuously in collaboration with the Louisiana Supreme Court, the Louisiana Department of Public Safety and Corrections, the Louisiana Sheriffs’ Association, the Louisiana Association of Chiefs of Police, and the Louisiana District Attorneys’ Association to design and develop an Integrated Criminal Justice Information System (ICJIS) for the State of Louisiana. The primary goal of the ICJIS is to create a criminal justice information system that will provide timely and accurate information to criminal justice decision makers at the crucial time it is needed, a system that would not only benefit the entire criminal justice community but the citizens of Louisiana as well. In order to begin development of a Louisiana ICJIS, it was necessary that an advisory board be created that would bring all the participating agencies together. In the 1999 Regular Legislative session, the ICJIS Policy Board was established. The Board consists of thirteen members from all different areas of the criminal justice community. Representatives from each of the following make up the ICJIS Policy Board: Louisiana Supreme Court, Louisiana Senate, Louisiana House of Representatives, Governor’s Designee, Louisiana Commission on Law Enforcement, Attorney General Designee, Department of Public Safety and
- 10 -
Corrections, Office of Public Safety Services, Louisiana Association of Chiefs of Police, Louisiana Sheriffs’ Association, Louisiana District Attorneys’ Association, Louisiana District Court Judges Association and the Louisiana Association of Clerks of Court. The purpose of the Board is to assist the agencies involved in the operations of the individual systems by facilitating the development of the Integrated Criminal Justice Information System (ICJIS), providing for common standards which ensure communications among systems, and providing a common forum for the discussion of issues affecting the agencies involved.” Some of their specific duties include: (1) the coordination of the design, development, maintenance, and use of an ICJIS serving the criminal justice agencies in Louisiana; (2) the development and maintenance of a strategic plan for the design, development, maintenance and overall ICJIS; (3) the development and maintenance of a criminal justice data dictionary for use by all criminal justice agencies in their activities relative to the ICJIS so as to facilitate communication among agencies on the system; (4) the development and maintenance of communication hardware and software standards to be used by all criminal justice agencies desiring to participate in the ICJIS; (5) the development of policy coordinating the development, maintenance, and utilization of the ICJIS and the state level criminal justice information systems in their capacity as components of the ICJIS; and (6) the coordination of developmental plans prepared by specific agencies charged with the responsibility of operating state level criminal justice information systems only in their capacity as components of the ICJIS to ensure that individual development plans are in accord with the overall system development effort. The ICJIS is a collective effort among the agencies and associations listed above to provide access to appropriate information contained in the following systems: the Automated Fingerprint Identification System (AFIS), the Computerized Criminal History (CCH), the Louisiana Incident Based Reporting System (LIBRS) from law enforcement; the Case Management Information System (CMIS) and the Statewide Protective Order Repository (SPOR) from the courts; the Prosecutors’ Information Management System (PIMS) from the Louisiana District Attorneys’ Association, the Corrections and Justice Unified Network (CAJUN) and the Juvenile Electronic Tracking System (JETS) from corrections, and the Louisiana Automated Victim Notification System (LAVNS) administered by the LCLE. A major advancement in the ICJIS effort was the Board’s decision to direct funding received from the federal COPS Technology Program to the development and implementation of the Louisiana Civil and Criminal Information Exchange (LACCIE) system. LACCIE was developed by the Jefferson Davis Parish Sheriff’s Office, through a sub grant from LCLE, and is currently administered by the Louisiana Sheriffs’ Association (LSA). LACCIE is available to Louisiana criminal justice agencies 7 days per week, 24 hours per day, 365 days per year basis. Major state and local databases are linked to LACCIE, thereby
- 11 -
providing cross database analytical capabilities to participating agencies. This connectivity is seen as a major gain for criminal justice information systems statewide. The LCLE continues to coordinate and monitor the LACCIE project, in partnership with the LSA, in order to ensure that local efforts remain in line with the goals and objectives of the ICJIS.

*Denotes LIBRS certified agency. 12
REPORTING AGENCIES – 2010 ACKNOWLEDGMENTS
Although Uniform Crime Reporting is mandated by Louisiana Revised Statute 15:1204.2, the following agencies participation in reporting crime data to the State of Louisiana is greatly appreciated. We realize that it is their willingness to support the program and their dedication that make the program a success. We would like to acknowledge the following law enforcement agencies for their participation in Summary Uniform Crime Reporting. As stated previously, the FBI only includes the agencies that have reported for all 12 months of a calendar year. There are currently 40 certified LIBRS agencies as indicated by the asterisks below as of December 2010. * Denotes LIBRS Certified AgencyACADIA PARISH Acadia Parish S.O. Church Pointe P.D. Crowley P.D. Rayne P.D. ALLEN PARISH Kinder P.D. ASCENSION PARISH Ascension Parish S.O* Donaldsonville P.D. Gonzales P.D.* Sorrento P.D.* ASSUMPTION PARISH Assumption Parish S.O. Napoleonville P.D. AVOYELLES PARISH Avoyelles S. O. Bunkie P.D. Cottonport P.D. Marksville P.D. Moreauville P.D. Simmsport P.D. BEAUREGARD PARISH Beauregard S.O. DeRidder P.D. Merryville P.D. BIENVILLE PARISH Bienville S.O.
BOSSIER PARISH Bossier Parish S.O.* Bossier City P.D.* Haughton P.D. CADDO PARISH Caddo Parish S.O. Blanchard P.D. LSU Health Sciences P.D. LSU – Shreveport C.P. Shreveport P.D. Southern University Shreveport C.P. Vivian P.D. CALCASIEU PARISH Calcasieu Parish S.O.* DeQunicy P.D.* Iowa P.D. Lake Charles P.D. Maplewood P.D. McNeese C.P.* Sulphur P.D. Vinton P.D* Westlake P.D.* CALDWELL PARISH Caldwell Parish S.O. CAMERON PARISH Cameron Parish S.O.*
CATAHOULA PARISH Catahoula Parish S.O. Harrisonburg P.D. Jonesville P.D. Sicily Island P.D. CLAIBORNE PARISH Claiborne Parish S.O. Haynesville P.D. Homer P.D. CONCORDIA PARISH Concordia Parish S.O. Clayton P.D. Ferriday P.D. Vidalia P.D. DeSOTO PARISH DeSoto Parish S.O. Mansfield P.D. Stonewall P.D. EAST BATON ROUGE PARISH East Baton Rouge Parish S.O. Baker P.D.* Baton Rouge P.D. LA Dept of Public Safety LSU A&M College C.P. Southern Univ. Baton Rouge C.P. Zachary P.D. EAST CARROLL PARISH East Carroll Parish S.O.* Lake Providence P.D.

*Denotes LIBRS certified agency. 13
EAST FELICIANA PARISH Clinton P.D. Jackson PD. EVANGELINE PARISH Evangeline Parish S.O.* Basile P.D. * Mamou P.D.* Ville Platte P.D. FRANKLIN PARISH Franklin Parish S.O. Baskin P.D. Winnsboro P.D. GRANT PARISH Grant Parish S.O. Pollock P.D. IBERIA PARISH Iberia Parish S.O.* Jeanerette P.D. Loreauville P.D. IBERVILLE PARISH Iberville Parish S.O. Maringouin P.D. Plaquemine P.D.* Grosse Tete P.D. Rosedale P.D. St. Gabriel P.D. White Castle P.D. JACKSON PARISH Jackson Parish S.O. Jonesboro P.D. JEFFERSON PARISH Jefferson Parish S.O. Grande Isle P.D. Gretna P.D. Harahan P.D. Kenner P.D. Westwego P.D.
JEFFERSON DAVIS PARISH Jefferson Davis Parish S.O.* Elton P.D. Jennings P.D.* Lake Arthur P.D.* Welsh P.D. LAFAYETTE PARISH Lafayette Parish S.O. Broussard P.D. Duson P.D. Lafayette P.D. Scott P.D. Youngsville P.D. UL-Lafayette C.P. LAFOURCHE PARISH Lafourche Parish S.O. Golden Meadow P.D. Lockport P.D. Nicholls State Univ. C.P. Thibodaux P.D. LaSALLE PARISH LaSalle Parish S.O. Jena P.D. Olla P.D* LINCOLN PARISH Lincoln Parish S.O. Dubach P.D. Grambling P.D. Grambling State University C.P. Louisiana Tech University C.P. Ruston P.D. LIVINGSTON PARISH Livingston Parish S.O Denham Springs P.D. French Settlement P.D. Port Vincent P.D. MADISON PARISH Madison Parish S.O.* Tallulah P.D.*
MOREHOUSE PARISH Morehouse Parish S.O.* Bastrop P.D. Bonita P.D.* Collingston P.D.* Mer Rouge P.D.* Oak Ridge P.D.* NATCHITOCHES PARISH Natchitoches Parish S.O. Clarence P.D. Natchitoches P.D. UL at Natchitoches C.P. ORLEANS PARISH Delgado Community College C.P. LSU Medical Center C.P. New Orleans P.D. Southern University –NO C.P. UNO C.P. Tulane C.P. OUACHITA PARISH Ouachita Parish S.O. Monroe P.D. Richwood P.D. Sterlington P.D.* Tensas Basin Levee P.D UL – Monroe C.P. West Monroe P.D. PLAQUEMINES PARISH Plaquemines Parish S.O.* POINTE COUPEE PARISH Pointe Coupee Parish S.O.* New Roads P.D. RAPIDES PARISH Rapides Parish S.O.* Alexandria P.D. Ball P.D. Chaneyville P.D. Glenmora P.D. LeCompte P.D. McNary P.D. Pineville P.D. Woodworth P.D.

*Denotes LIBRS certified agency. 14
RED RIVER PARISH Red River Parish S.O. Coushatta P.D. RICHLAND PARISH Richland Parish S.O. Delhi P.D. Mangham P.D. Rayville P.D. SABINE PARISH Sabine Parish S.O. Many P.D. Zwolle P.D. ST. BERNARD PARISH St. Bernard Parish S.O. ST. CHARLES PARISH St. Charles Parish S.O. ST. HELENA PARISH St. Helena Parish S.O. ST. JAMES PARISH St. James Parish S.O.* Gramercy P.D. Lutcher P.D. ST. JOHN THE BAPTIST PARISH St. John the Baptist Parish S.O. ST. LANDRY PARISH St. Landry Parish S.O. Arnaudville P.D. Eunice P.D. Krotz Springs P.D. LSU Eunice C.P. Opelousas P.D. Port Barre P.D. Sunset P.D. Washington P.D. ST. MARTIN PARISH St. Martin S.O. Breaux Bridge P.D. Parks P.D. St. Martinville P.D.
ST. MARY PARISH St. Mary Parish S.O. Baldwin P.D. Berwick P.D. Franklin P.D. Morgan City P.D. Patterson P.D. ST. TAMMANY PARISH St. Tammany Parish S.O. Abita Springs P.D. Covington P.D. Mandeville P.D. Pearl River P.D, Slidell PD. TANGIPAHOA PARISH Tangipahoa Parish S.O. Hammond P.D. Independence P.D. Kentwood P.D. Ponchatoula P.D. Southeastern University C.P.* Tickfaw P.D. TENSAS PARISH Tensas Parish S.O.* Newellton P.D. St. Joseph P.D. Waterproof P.D. TERREBONNE PARISH Terrebonne Parish S.O. Houma P.D. UNION PARISH Union Parish S.O. Bernice P.D.* Farmerville P.D. VERMILION PARISH Vermilion Parish S.O. Abbeville P.D. Delcambre P.D. Erath P.D. Gueydan P.D Kaplan City P.D.
VERNON PARISH Vernon Parish S.O. Leesville P.D. New Llano P.D. WASHINGTON PARISH Washington Parish S.O. Bogalusa P.D. Franklinton P.D. WEBSTER PARISH Webster Parish S.O. Cullen P.D. Dixie Inn P.D. Minden P.D. Springhill P.D. WEST BATON ROUGE PARISH West Baton Rouge Parish S.O. Addis P.D. Port Allen P.D.* WEST CARROLL PARISH West Carroll Parish S.O. Oak Grove P.D. WEST FELICIANA PARISH West Feliciana Parish S.O.* St. Francisville P.D. WINN PARISH Winn Parish S.O. Winnfield P.D.
15
2010 LOUISIANA PART 1 OFFENSES This section lists the eight Part 1 Crimes. The violent crimes are murder and non-negligent manslaughter, forcible rape, robbery and aggravated assault. The non-violent Part 1 Crimes included burglary, larceny-theft, motor vehicle theft and arson. The tables that follow show numbers of offenses in cities, parishes and metropolitan versus non-metropolitan areas of Louisiana in 2010. The tables capture a snapshot of the eight Part 1 Crimes. These tables were taken from the Crime in the US website and thus only include those agencies that reported all 12 months of data. The agencies that reported 11 or fewer months are not included so that an average of data for the same number of months is illustrated. The data included shows a sampling of the crime statistics in the state since the 2010 Census Survey shows a population of 4,533,372. Source: http://www.fbi.gov/about-us/cjis/ucr/crime-in-the-u.s/2010/crime-in-the-u.s.-2010

16
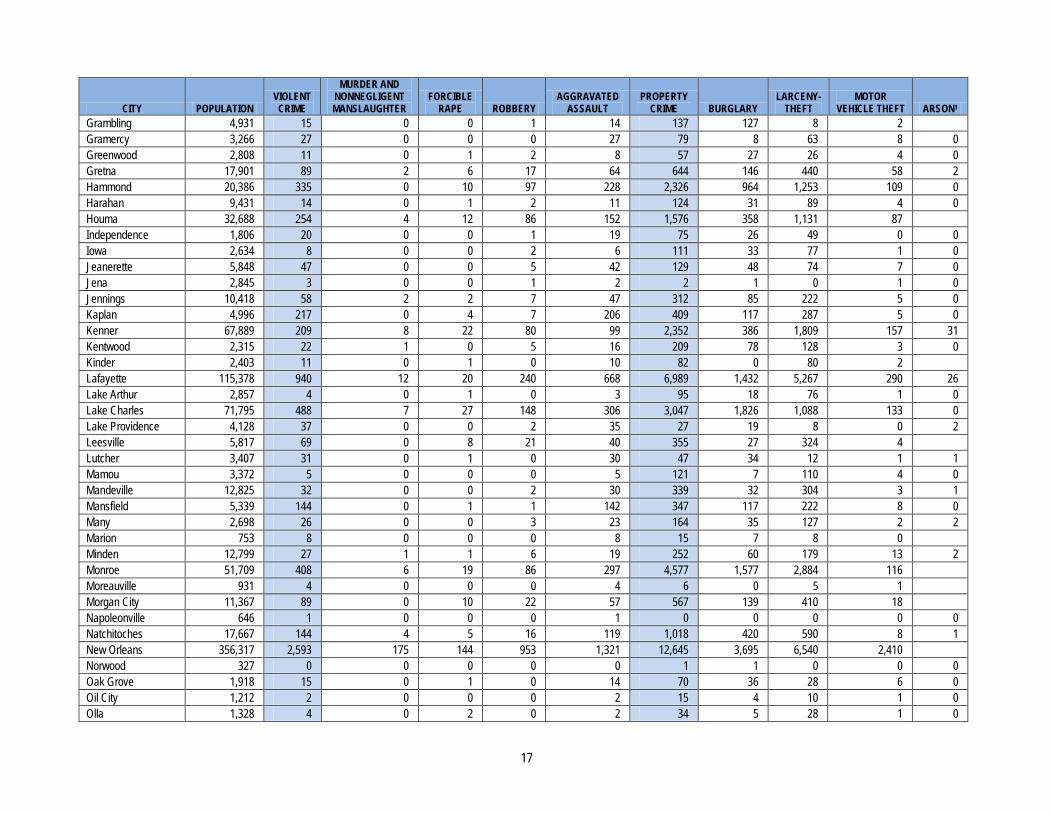
2010 LOUISIANA PART 1 OFFENSES LISTED BY CITY
CITY POPULATION VIOLENT
CRIME
MURDER AND NONNEGLIGENT MANSLAUGHTER
FORCIBLE RAPE ROBBERY
AGGRAVATED ASSAULT
PROPERTY CRIME BURGLARY
LARCENY-THEFT
MOTOR VEHICLE THEFT ARSON1
Abbeville 12,310 123 1 5 14 103 428 160 259 9 0 Addis 4,043 6 0 0 0 6 1 0 1 0 0 Alexandria 49,283 592 4 11 184 393 3,787 943 2,714 130 Amite 4,386 71 0 5 11 55 467 131 324 12 3 Baker 13,460 23 0 2 12 9 503 132 347 24 1 Basile 2,357 3 0 0 0 3 9 1 8 0 0 Bastrop 11,542 118 0 3 26 89 1,349 454 832 63 5 Berwick 4,266 5 0 0 1 4 66 25 39 2 0 Blanchard 2,734 1 0 0 0 1 51 14 35 2 0 Bogalusa 12,581 182 0 12 40 130 838 301 486 51 8 Bossier City 64,232 397 1 27 71 298 2,663 480 2,036 147 3 Broussard 8,227 43 2 5 9 27 665 349 316 0 0 Brusly 2,129 0 0 0 0 0 2 1 1 0 0 Carencro 6,897 71 0 1 11 59 260 65 183 12 0 Church Point 4,664 34 0 2 3 29 67 39 25 3 Clarence 501 0 0 0 0 0 0 0 0 0 0 Clinton 1,867 11 0 0 1 10 40 11 27 2 1 Coushatta 2,030 23 0 0 1 22 56 15 41 0 0 Covington 9,325 34 0 2 4 28 272 49 213 10 2 Crowley 13,878 112 1 4 15 92 526 129 382 15 0 Cullen 1,345 18 0 0 1 17 12 5 7 0 0 Denham Springs 10,504 53 0 5 16 32 817 135 665 17 0 DeRidder 10,250 70 0 0 0 70 261 59 201 1 Epps 1,090 9 0 0 0 9 2 2 0 0 0 Erath 2,160 15 0 0 4 11 11 1 10 0 0 Eunice 11,492 125 0 8 15 102 764 253 497 14 1 Farmerville 3,574 39 0 3 2 34 194 55 132 7 0 Ferriday 3,529 33 1 0 2 30 52 49 0 3 0 Franklin 7,538 76 2 0 11 63 468 85 368 15 0 Franklinton 3,771 25 0 1 1 23 219 46 166 7 0 French Settlement 1,081 3 0 0 1 2 33 2 30 1 0 Georgetown 320 1 0 0 0 1 1 1 0 0 0 Golden Meadow 2,095 12 0 0 4 8 50 19 31 0 0 Gonzales2 9,738 9 0 0 1 8 378 17 0
17
CITY POPULATION VIOLENT
CRIME
MURDER AND NONNEGLIGENT MANSLAUGHTER
FORCIBLE RAPE ROBBERY
AGGRAVATED ASSAULT
PROPERTY CRIME BURGLARY
LARCENY-THEFT
MOTOR VEHICLE THEFT ARSON1
Grambling 4,931 15 0 0 1 14 137 127 8 2 Gramercy 3,266 27 0 0 0 27 79 8 63 8 0 Greenwood 2,808 11 0 1 2 8 57 27 26 4 0 Gretna 17,901 89 2 6 17 64 644 146 440 58 2 Hammond 20,386 335 0 10 97 228 2,326 964 1,253 109 0 Harahan 9,431 14 0 1 2 11 124 31 89 4 0 Houma 32,688 254 4 12 86 152 1,576 358 1,131 87 Independence 1,806 20 0 0 1 19 75 26 49 0 0 Iowa 2,634 8 0 0 2 6 111 33 77 1 0 Jeanerette 5,848 47 0 0 5 42 129 48 74 7 0 Jena 2,845 3 0 0 1 2 2 1 0 1 0 Jennings 10,418 58 2 2 7 47 312 85 222 5 0 Kaplan 4,996 217 0 4 7 206 409 117 287 5 0 Kenner 67,889 209 8 22 80 99 2,352 386 1,809 157 31 Kentwood 2,315 22 1 0 5 16 209 78 128 3 0 Kinder 2,403 11 0 1 0 10 82 0 80 2 Lafayette 115,378 940 12 20 240 668 6,989 1,432 5,267 290 26 Lake Arthur 2,857 4 0 1 0 3 95 18 76 1 0 Lake Charles 71,795 488 7 27 148 306 3,047 1,826 1,088 133 0 Lake Providence 4,128 37 0 0 2 35 27 19 8 0 2 Leesville 5,817 69 0 8 21 40 355 27 324 4 Lutcher 3,407 31 0 1 0 30 47 34 12 1 1 Mamou 3,372 5 0 0 0 5 121 7 110 4 0 Mandeville 12,825 32 0 0 2 30 339 32 304 3 1 Mansfield 5,339 144 0 1 1 142 347 117 222 8 0 Many 2,698 26 0 0 3 23 164 35 127 2 2 Marion 753 8 0 0 0 8 15 7 8 0 Minden 12,799 27 1 1 6 19 252 60 179 13 2 Monroe 51,709 408 6 19 86 297 4,577 1,577 2,884 116 Moreauville 931 4 0 0 0 4 6 0 5 1 Morgan City 11,367 89 0 10 22 57 567 139 410 18 Napoleonville 646 1 0 0 0 1 0 0 0 0 0 Natchitoches 17,667 144 4 5 16 119 1,018 420 590 8 1 New Orleans 356,317 2,593 175 144 953 1,321 12,645 3,695 6,540 2,410 Norwood 327 0 0 0 0 0 1 1 0 0 0 Oak Grove 1,918 15 0 1 0 14 70 36 28 6 0 Oil City 1,212 2 0 0 0 2 15 4 10 1 0 Olla 1,328 4 0 2 0 2 34 5 28 1 0

18
CITY POPULATION VIOLENT
CRIME
MURDER AND NONNEGLIGENT MANSLAUGHTER
FORCIBLE RAPE ROBBERY
AGGRAVATED ASSAULT
PROPERTY CRIME BURGLARY
LARCENY-THEFT
MOTOR VEHICLE THEFT ARSON1
Opelousas 23,268 248 6 15 41 186 1,364 370 931 63 Pearl River 2,256 11 0 2 0 9 88 17 66 5 0 Pineville 15,064 47 1 0 7 39 693 119 552 22 Plaquemine 6,646 56 2 0 3 51 295 33 250 12 0 Pollock 385 3 0 0 0 3 12 5 7 0 0 Ponchatoula 6,524 74 0 5 8 61 350 117 218 15 0 Port Allen 4,892 21 0 1 4 16 221 63 143 15 0 Port Vincent 541 8 0 0 1 7 40 19 19 2 0 Rayville 3,988 25 0 1 5 19 259 40 211 8 0 Ruston 21,391 111 0 7 20 84 1,013 368 620 25 1 Scott 9,335 27 1 1 2 23 204 37 156 11 Shreveport 199,900 1,533 26 121 355 1,031 9,459 2,616 6,317 526 99 Slidell 27,772 106 0 16 21 69 1,549 177 1,295 77 0 Springhill 5,064 6 0 0 3 3 142 31 111 0 0 Sterlington 1,447 4 0 1 0 3 6 4 2 0 0 Stonewall 1,930 1 0 0 0 1 7 1 6 0 Sulphur 19,632 269 0 3 19 247 999 220 753 26 3 Tallulah 7,218 62 1 2 6 53 257 83 169 5 0 Thibodaux 14,487 69 0 4 16 49 796 119 653 24 1 Tickfaw 703 4 1 0 3 0 27 0 25 2 0 Vidalia 4,070 39 0 2 3 34 176 38 137 1 0 Vinton 3,385 11 0 1 0 10 105 28 71 6 0 Walker 6,567 45 0 4 13 28 368 77 285 6 3 West Monroe 12,930 71 2 7 11 51 949 205 709 35 Westwego 10,226 15 0 0 3 12 196 45 138 13 1 Winnfield 4,995 140 0 3 13 124 264 89 160 15 1 Zachary 15,696 44 2 1 8 33 219 22 189 8 0 Zwolle 1,737 13 0 1 2 10 40 39 1 0 TOTAL 1,608,403 11,811 276 593 2,841 8,101 74,387 20,919 48,904 4,959 201 1 The FBI does not publish arson data unless it receives data from either the agency or the state for all 12 months of the calendar year. 2 The FBI determined that the agency did not follow national Uniform Crime Reporting Program guidelines for reporting an offense. Consequently, this figure is not included in this table. Note the population from the 2010 Census Survey documented that the number of persons living in Louisiana is 4,533,372.
19
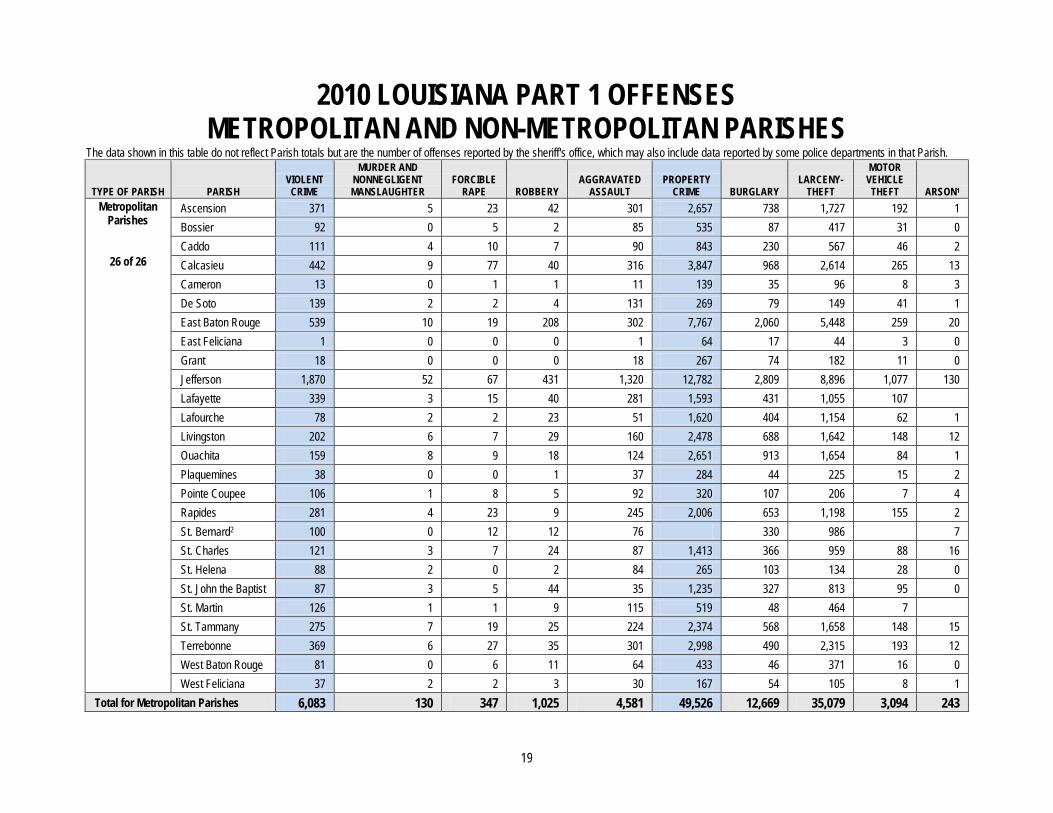
2010 LOUISIANA PART 1 OFFENSES METROPOLITAN AND NON-METROPOLITAN PARISHES
The data shown in this table do not reflect Parish totals but are the number of offenses reported by the sheriff's office, which may also include data reported by some police departments in that Parish.
TYPE OF PARISH PARISH VIOLENT
CRIME
MURDER AND NONNEGLIGENT MANSLAUGHTER
FORCIBLE RAPE ROBBERY
AGGRAVATED ASSAULT
PROPERTY CRIME BURGLARY
LARCENY-THEFT
MOTOR VEHICLE
THEFT ARSON1 Metropolitan
Parishes
26 of 26
Ascension 371 5 23 42 301 2,657 738 1,727 192 1 Bossier 92 0 5 2 85 535 87 417 31 0 Caddo 111 4 10 7 90 843 230 567 46 2 Calcasieu 442 9 77 40 316 3,847 968 2,614 265 13 Cameron 13 0 1 1 11 139 35 96 8 3 De Soto 139 2 2 4 131 269 79 149 41 1 East Baton Rouge 539 10 19 208 302 7,767 2,060 5,448 259 20 East Feliciana 1 0 0 0 1 64 17 44 3 0 Grant 18 0 0 0 18 267 74 182 11 0 Jefferson 1,870 52 67 431 1,320 12,782 2,809 8,896 1,077 130 Lafayette 339 3 15 40 281 1,593 431 1,055 107 Lafourche 78 2 2 23 51 1,620 404 1,154 62 1 Livingston 202 6 7 29 160 2,478 688 1,642 148 12 Ouachita 159 8 9 18 124 2,651 913 1,654 84 1 Plaquemines 38 0 0 1 37 284 44 225 15 2 Pointe Coupee 106 1 8 5 92 320 107 206 7 4 Rapides 281 4 23 9 245 2,006 653 1,198 155 2 St. Bernard2 100 0 12 12 76 330 986 7 St. Charles 121 3 7 24 87 1,413 366 959 88 16 St. Helena 88 2 0 2 84 265 103 134 28 0 St. John the Baptist 87 3 5 44 35 1,235 327 813 95 0 St. Martin 126 1 1 9 115 519 48 464 7 St. Tammany 275 7 19 25 224 2,374 568 1,658 148 15 Terrebonne 369 6 27 35 301 2,998 490 2,315 193 12 West Baton Rouge 81 0 6 11 64 433 46 371 16 0 West Feliciana 37 2 2 3 30 167 54 105 8 1
Total for Metropolitan Parishes 6,083 130 347 1,025 4,581 49,526 12,669 35,079 3,094 243
20
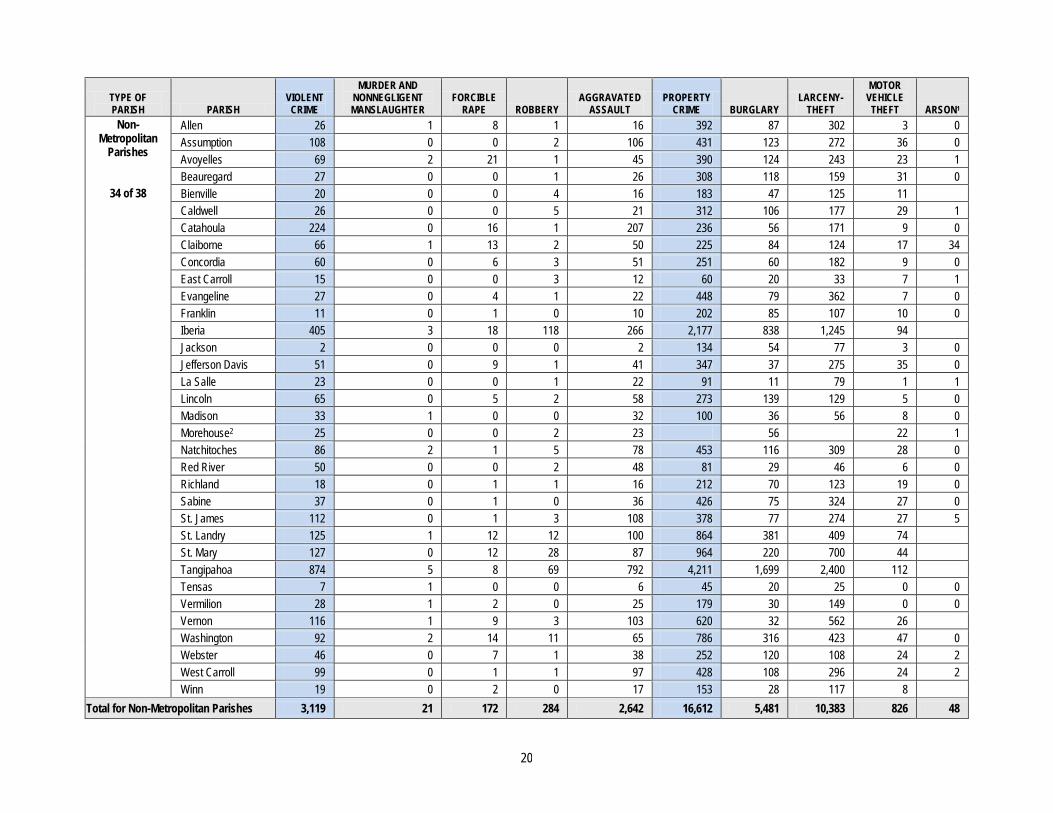
TYPE OF PARISH PARISH
VIOLENT CRIME
MURDER AND NONNEGLIGENT MANSLAUGHTER
FORCIBLE RAPE ROBBERY
AGGRAVATED ASSAULT
PROPERTY CRIME BURGLARY
LARCENY-THEFT
MOTOR VEHICLE
THEFT ARSON1 Non-
Metropolitan Parishes
34 of 38
Allen 26 1 8 1 16 392 87 302 3 0 Assumption 108 0 0 2 106 431 123 272 36 0 Avoyelles 69 2 21 1 45 390 124 243 23 1 Beauregard 27 0 0 1 26 308 118 159 31 0 Bienville 20 0 0 4 16 183 47 125 11 Caldwell 26 0 0 5 21 312 106 177 29 1 Catahoula 224 0 16 1 207 236 56 171 9 0 Claiborne 66 1 13 2 50 225 84 124 17 34 Concordia 60 0 6 3 51 251 60 182 9 0 East Carroll 15 0 0 3 12 60 20 33 7 1 Evangeline 27 0 4 1 22 448 79 362 7 0 Franklin 11 0 1 0 10 202 85 107 10 0 Iberia 405 3 18 118 266 2,177 838 1,245 94 Jackson 2 0 0 0 2 134 54 77 3 0 Jefferson Davis 51 0 9 1 41 347 37 275 35 0 La Salle 23 0 0 1 22 91 11 79 1 1 Lincoln 65 0 5 2 58 273 139 129 5 0 Madison 33 1 0 0 32 100 36 56 8 0 Morehouse2 25 0 0 2 23 56 22 1 Natchitoches 86 2 1 5 78 453 116 309 28 0 Red River 50 0 0 2 48 81 29 46 6 0 Richland 18 0 1 1 16 212 70 123 19 0 Sabine 37 0 1 0 36 426 75 324 27 0 St. James 112 0 1 3 108 378 77 274 27 5 St. Landry 125 1 12 12 100 864 381 409 74 St. Mary 127 0 12 28 87 964 220 700 44 Tangipahoa 874 5 8 69 792 4,211 1,699 2,400 112 Tensas 7 1 0 0 6 45 20 25 0 0 Vermilion 28 1 2 0 25 179 30 149 0 0 Vernon 116 1 9 3 103 620 32 562 26 Washington 92 2 14 11 65 786 316 423 47 0 Webster 46 0 7 1 38 252 120 108 24 2 West Carroll 99 0 1 1 97 428 108 296 24 2 Winn 19 0 2 0 17 153 28 117 8
Total for Non-Metropolitan Parishes 3,119 21 172 284 2,642 16,612 5,481 10,383 826 48
21
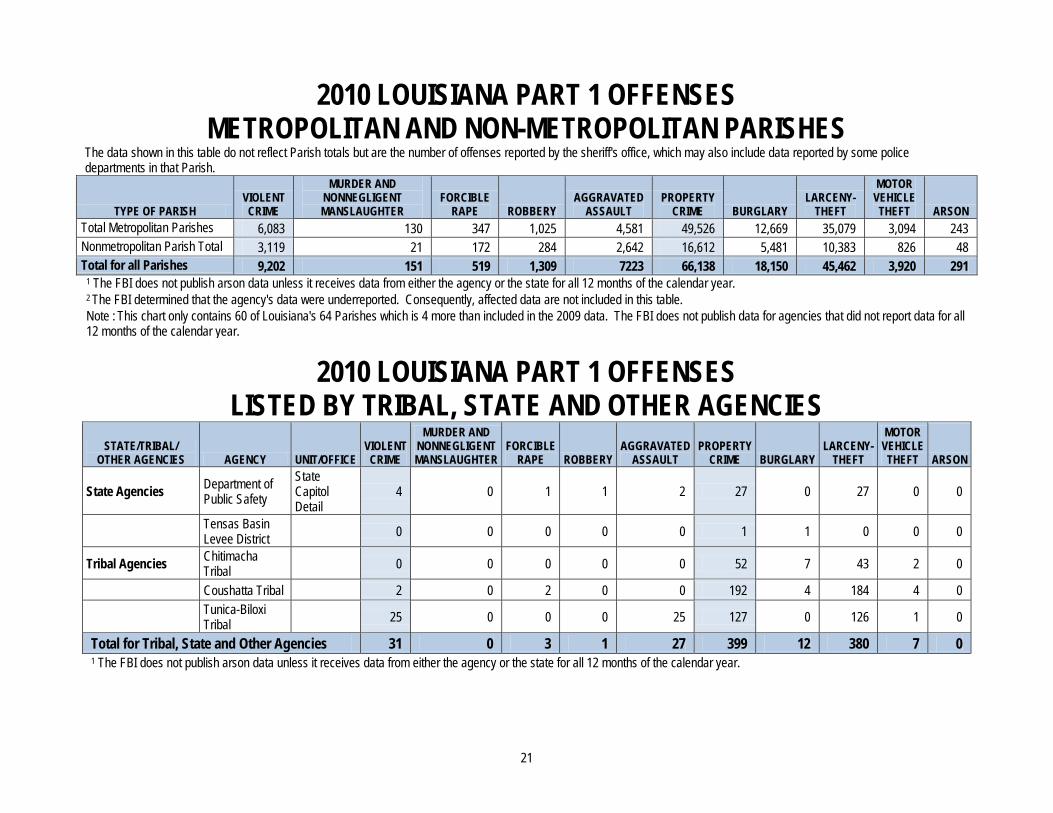
2010 LOUISIANA PART 1 OFFENSES METROPOLITAN AND NON-METROPOLITAN PARISHES
The data shown in this table do not reflect Parish totals but are the number of offenses reported by the sheriff's office, which may also include data reported by some police departments in that Parish.
TYPE OF PARISH VIOLENT CRIME
MURDER AND NONNEGLIGENT MANSLAUGHTER
FORCIBLE RAPE ROBBERY
AGGRAVATED ASSAULT
PROPERTY CRIME BURGLARY
LARCENY-THEFT
MOTOR VEHICLE THEFT ARSON
Total Metropolitan Parishes 6,083 130 347 1,025 4,581 49,526 12,669 35,079 3,094 243 Nonmetropolitan Parish Total 3,119 21 172 284 2,642 16,612 5,481 10,383 826 48 Total for all Parishes 9,202 151 519 1,309 7223 66,138 18,150 45,462 3,920 291
1 The FBI does not publish arson data unless it receives data from either the agency or the state for all 12 months of the calendar year. 2 The FBI determined that the agency's data were underreported. Consequently, affected data are not included in this table. Note : This chart only contains 60 of Louisiana's 64 Parishes which is 4 more than included in the 2009 data. The FBI does not publish data for agencies that did not report data for all 12 months of the calendar year.
2010 LOUISIANA PART 1 OFFENSES LISTED BY TRIBAL, STATE AND OTHER AGENCIES
STATE/TRIBAL/ OTHER AGENCIES AGENCY UNIT/OFFICE
VIOLENT CRIME
MURDER AND NONNEGLIGENT MANSLAUGHTER
FORCIBLE RAPE ROBBERY
AGGRAVATED ASSAULT
PROPERTY CRIME BURGLARY
LARCENY-THEFT
MOTOR VEHICLE THEFT ARSON
State Agencies Department of Public Safety
State Capitol Detail
4 0 1 1 2 27 0 27 0 0
Tensas Basin Levee District 0 0 0 0 0 1 1 0 0 0
Tribal Agencies Chitimacha Tribal 0 0 0 0 0 52 7 43 2 0
Coushatta Tribal 2 0 2 0 0 192 4 184 4 0
Tunica-Biloxi Tribal 25 0 0 0 25 127 0 126 1 0
Total for Tribal, State and Other Agencies 31 0 3 1 27 399 12 380 7 0 1 The FBI does not publish arson data unless it receives data from either the agency or the state for all 12 months of the calendar year.

22
2010 LOUISIANA PART 1 OFFENSES UNIVERSITY AND COLLEGE
UNIVERSITY/COLLEGE CAMPUS STUDENT
ENROLLMENT1 VIOLENT
CRIME
MURDER AND NONNEGLIGENT MANSLAUGHTER
FORCIBLE RAPE ROBBERY
AGGRAVATED ASSAULT
PROPERTY CRIME BURGLARY
LARCENY- THEFT
MOTOR VEHICLE THEFT ARSON2
Delgado Community College New Orleans 16,758 0 0 0 0 0 19 0 19 0 0
Grambling State University 4,992 2 0 0 1 1 102 19 80 3 0
Louisiana State University:
Alexandria Baton Rouge3 19 0 2 4 13 489 61 416 12 3 Eunice 3,332 0 0 0 0 0 1 0 1 0 0 Health Sciences Center, Shreveport 823 4 0 1 0 3 34 4 27 3 0
Shreveport 4,667 4 0 0 1 3 30 6 24 0 0 Louisiana Tech University 11,264 4 0 0 1 3 127 21 100 6 2 McNeese State University 8,638 0 0 0 0 0 55 2 51 2 0 Nicholls State University 7,169 5 0 1 0 4 44 4 40 0 0 Northwestern State University 9,247 0 0 0 0 0 73 43 30 0
Southeastern Louisiana University 15,151 0 0 0 0 0 136 7 128 1 0
Southern University and A&M College:
Baton Rouge 7,619 13 0 0 7 6 192 16 174 2 0 New Orleans 3,141 0 0 0 0 0 4 1 3 0 0 Shreveport 3,014 1 0 0 0 1 42 26 16 0 0
Tulane University 11,464 7 0 4 1 2 195 21 171 3 0 University of Louisiana: Lafayette 16,361 11 0 1 3 7 183 17 166 0 2 Monroe 9,004 9 0 1 0 8 84 10 71 3 0 University of New Orleans 11,724 1 0 0 0 1 53 9 40 4 Total 144,368 80 0 10 18 52 1,863 267 1,557 39 7
1 The student enrollment figures provided by the United States Department of Education are for the 2009 school year, the most recent available. The enrollment figures include full-time and part-time students. 2 The FBI does not publish arson data unless it receives data from either the agency or the state for all 12 months of the calendar year. 3 Student enrollment figures were not available. NOTE: Caution should be exercised in making any intercampus comparisons or ranking schools because university/college crime statistics are affected by a variety of factors. These include demographic characteristics of the surrounding community, ratio of male to female students, number of on-campus residents, accessibility of the campus to outside visitors, size of enrollment, etc.

23
2010 SUMMARY OF ALL REPORTED CRIME THROUGH UCR BY JUVENILE AND ADULT
2010 ESTIMATED POPULATION SERVED BY 106 REPORTING AGENICIES = 2,616,792 2010 STATEWIDE POPULATION PER THE CENSUS = 4,533,372
Age Total All Classes1
Violent Crime2
Property Crime2
Murder And Nonnegligent Manslaughter
Forcible Rape Robbery
Aggravated Assault Burglary Larceny- Theft
Motor Vehicle Theft Arson
Adults 126,290 7,866 18,274 131 158 701 6,876 2,957 14,703 543 71
Under 18 16,582 1,438 4,336 32 34 205 1,167 855 3,305 145 31 Total all ages 142,872 9,304 22,610 163 192 906 8,043 3,812 18,008 688 102
Age Other
Assaults Forgery And
Counterfeiting Fraud Embezzlement
Stolen Property; Buying,
Receiving, Possessing Vandalism
Weapons; Carrying,
Possessing, Etc.
Prostitution And Commercialized
Vice
Sex Offenses (Except
Forcible Rape And
Prostitution)
Drug Abuse
Violations Gambling Adults 12,474 613 1,852 156 1,073 1,757 1,517 248 507 17,844 53 Under 18 3,159 16 32 3 206 544 233 9 86 1,480 8 Total all ages 15,633 629 1,884 159 1,279 2,301 1,750 257 593 19,324 61
Age
Offenses Against The Family And
Children Driving Under The Influence
Liquor Laws Drunkenness
Disorderly Conduct Vagrancy
All Other Offenses (Except Traffic) Suspicion
Curfew And Loitering Law
Violations Runaways Adults 1,023 8,099 2,022 2,385 5,464 181 42,798 84 Under 18 69 44 154 21 1,765 31 2,804 11 133 Total all ages 1,092 8,143 2,176 2,406 7,229 212 45,602 95 133 1 Does not include traffic arrests. 2 Violent crimes are offenses of murder and nonnegligent manslaughter, forcible rape, robbery, and aggravated assault. Property crimes are offenses of burglary, larceny-theft, motor vehicle theft, and arson. NOTE: Because the number of agencies submitting arrest data varies from year to year, users are cautioned about making direct comparisons between 2010 arrest totals and those published in previous years' editions of Crime in the Louisiana, e.g. 2009 Arrest data was captured from 118 agencies and there are only 106 captured in the 2010 data. Further, arrest figures may vary widely from state to state because some Part II crimes are not defined the same way in some states.
24
TOTAL INDEX CRIMES IN LOUISIANA The Part One Crime Index Total is composed of the crimes of murder and non-negligent manslaughter, forcible rape, robbery, aggravated assault, burglary, larceny theft and motor vehicle theft. The tables and charts that follow show numbers of offenses and crime rates in our state in 2010 as well as a comparison of 2008, 2009 and 2010. Trends are included for the years 2001 through 2010 and percentages of violent crime compared to non-violent (property) crime. The Crime is calculated as follows: Crime Rate = Number of Offense/population X 100,000

25
LOUISIANA INDEX CRIMES BY NUMBER OF OFFENSES
OFFENSE 2009 2010 Murder and Non-Negligent Homicide 530 427 Forcible Rape 1,359 1,125 Robbery 6,105 4,169 Aggravated Assault 19,855 15,403 Burglary 46,246 39,348 Larceny - Theft 112,493 96,303 Motor Vehicle Theft 11,717 8,925 Arson 886 499 CRIME INDEX OFFENSE TOTAL 199,191 166,199
LOUISIANA INDEX CRIMES BY CRIME RATE
OFFENSE 2009 2010 Murder and Non-Negligent Homicide 11.80 9.42 Forcible Rape 30.25 24.82 Robbery 135.91 91.96 Aggravated Assault 442.00 339.77 Burglary 1,029.50 867.96 Larceny - Theft 2,504.25 2,124.31 Motor Vehicle Theft 260.84 196.87 Arson 19.72 11.01 CRIME INDEX OFFENSE TOTAL 4,434.27 3,666.12 Population 2009: 4,492,076 2010: 4,533,372 Index Crime Rate = Number of Offense/population X 100,000

26
LOUISIANA INDEX CRIMES 2010
Murder and Non-Negligent Homicide
427 0.26%
Forcible Rape 1,125 0.68% Robbery
4,169 2.51%
Aggravated Assault 15,403 9.27%
Burglary 39,348 23.68%
Larceny - Theft 96,303 57.94%
Motor Vehicle Theft 8,925 5.37%
Arson 499
0.30%
Murder and Non-Negligent Homicide Forcible RapeRobbery Aggravated AssaultBurglary Larceny - TheftMotor Vehicle Theft Arson
27
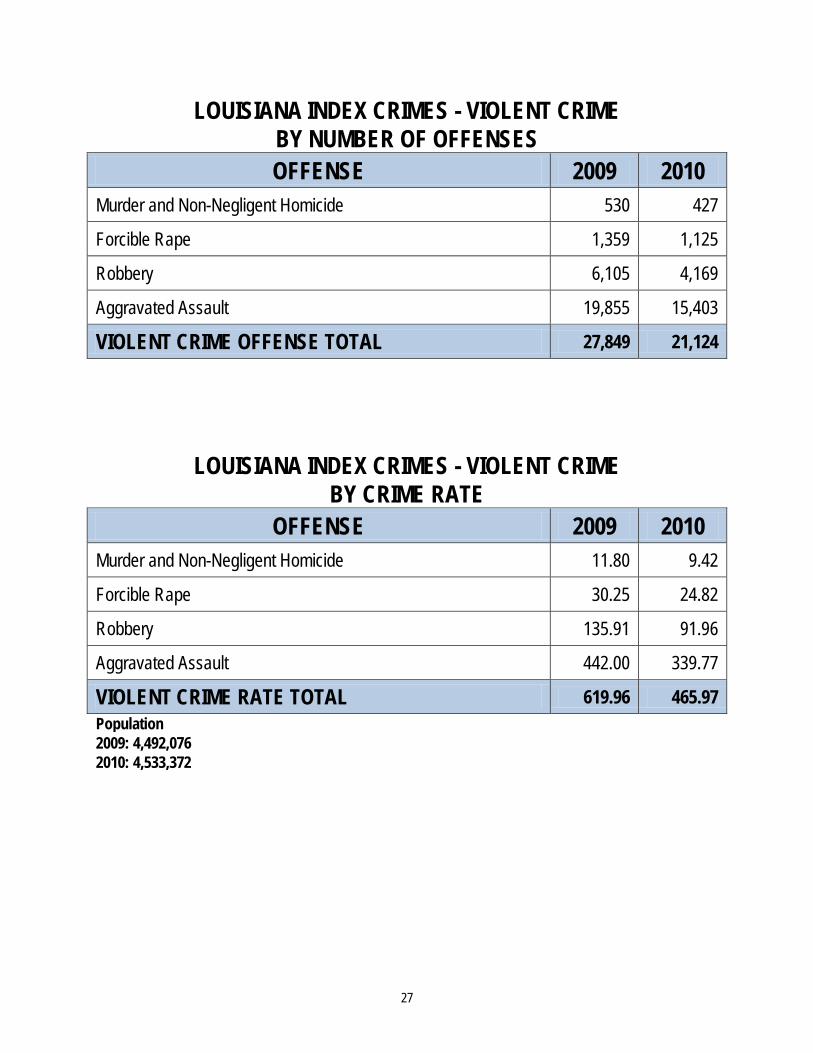
LOUISIANA INDEX CRIMES - VIOLENT CRIME BY NUMBER OF OFFENSES OFFENSE 2009 2010
Murder and Non-Negligent Homicide 530 427
Forcible Rape 1,359 1,125
Robbery 6,105 4,169
Aggravated Assault 19,855 15,403
VIOLENT CRIME OFFENSE TOTAL 27,849 21,124
LOUISIANA INDEX CRIMES - VIOLENT CRIME BY CRIME RATE
OFFENSE 2009 2010 Murder and Non-Negligent Homicide 11.80 9.42
Forcible Rape 30.25 24.82
Robbery 135.91 91.96
Aggravated Assault 442.00 339.77
VIOLENT CRIME RATE TOTAL 619.96 465.97 Population 2009: 4,492,076 2010: 4,533,372
28
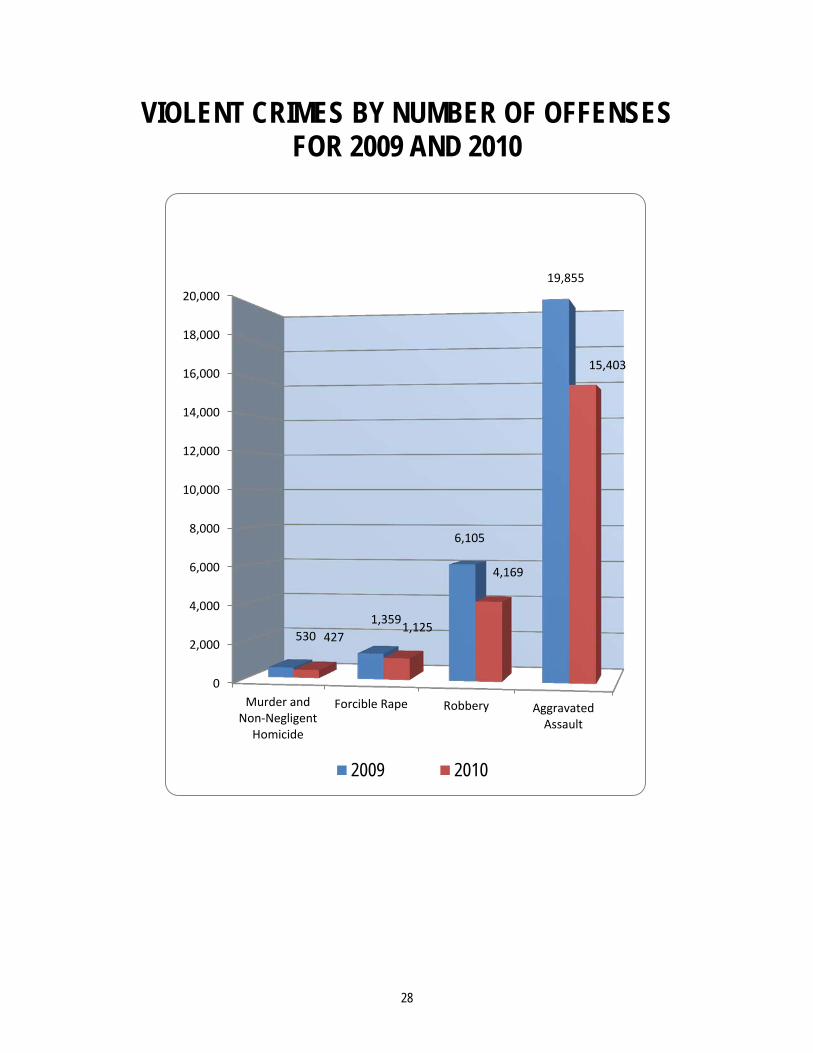
VIOLENT CRIMES BY NUMBER OF OFFENSES FOR 2009 AND 2010
0
2,000
4,000
6,000
8,000
10,000
12,000
14,000
16,000
18,000
20,000
Murder andNon-Negligent
Homicide
Forcible Rape Robbery AggravatedAssault
530 1,359
6,105
19,855
427 1,125
4,169
15,403
2009 2010

29
PERCENTAGE OF VIOLENT CRIMES BY OFFENSE
2009 AND 2010
Murder and Non-Negligent
Homicide 530 2%
Forcible Rape 1,359 5%
Robbery 6,105 22%
Aggravated Assault 19,855 71%
2009
Murder and Non-Negligent Homicide Forcible RapeRobbery Aggravated Assault
Murder and Non-Negligent
Homicide 427 2%
Forcible Rape 1,125 5%
Robbery 4,169 20%
Aggravated Assault 15,403 73%
2010
Murder and Non-Negligent Homicide Forcible RapeRobbery Aggravated Assault
30
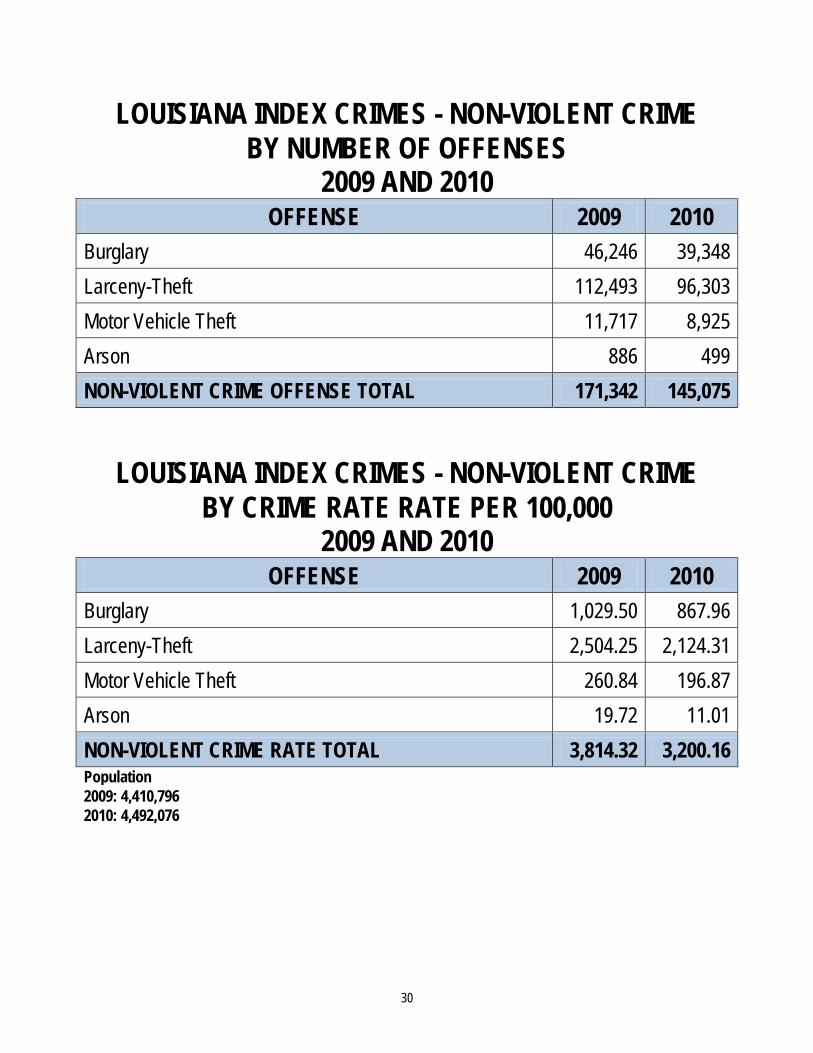
LOUISIANA INDEX CRIMES - NON-VIOLENT CRIME BY NUMBER OF OFFENSES
2009 AND 2010 OFFENSE 2009 2010
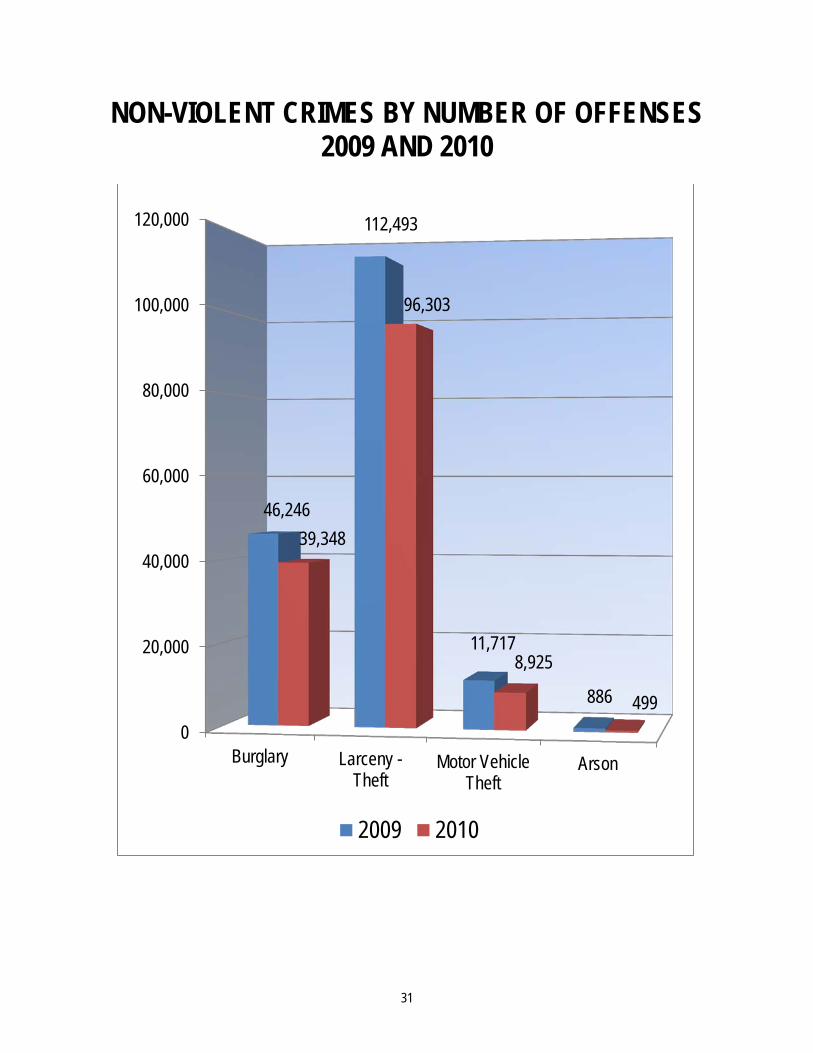
Burglary 46,246 39,348 Larceny-Theft 112,493 96,303 Motor Vehicle Theft 11,717 8,925 Arson 886 499 NON-VIOLENT CRIME OFFENSE TOTAL 171,342 145,075
LOUISIANA INDEX CRIMES - NON-VIOLENT CRIME BY CRIME RATE RATE PER 100,000
2009 AND 2010 OFFENSE 2009 2010
Burglary 1,029.50 867.96 Larceny-Theft 2,504.25 2,124.31 Motor Vehicle Theft 260.84 196.87 Arson 19.72 11.01 NON-VIOLENT CRIME RATE TOTAL 3,814.32 3,200.16 Population 2009: 4,410,796 2010: 4,492,076
31
NON-VIOLENT CRIMES BY NUMBER OF OFFENSES 2009 AND 2010
0
20,000
40,000
60,000
80,000
100,000
120,000
Burglary Larceny -Theft
Motor VehicleTheft
Arson
46,246
112,493
11,717
886
39,348
96,303
8,925
499
2009 2010

32
PERCENTAGE OF NON-VIOLENT CRIMES BY OFFENSES
2009 AND 2010
Burglary 46,246 26.99%
Larceny - Theft 112,493
66%
Motor Vehicle Theft
11,717 6.84%
Arson 886
0.52%
2009
Burglary Larceny - Theft Motor Vehicle Theft Arson
Burglary 39,348 27%
Larceny - Theft 96,303 67%
Motor Vehicle Theft 8,925 6%
Arson 499 0%
2010
Burglary Larceny - Theft Motor Vehicle Theft Arson

33
-
50,000
100,000
150,000
200,000
250,000
NUMB
ER O
F OF
FENS
ES
VIOLENT AND PROPERTY CRIME TRENDS BY NUMBER OF OFFENSES
2001-2010
VIOLENT PROPERTY (VIOLENT)
34
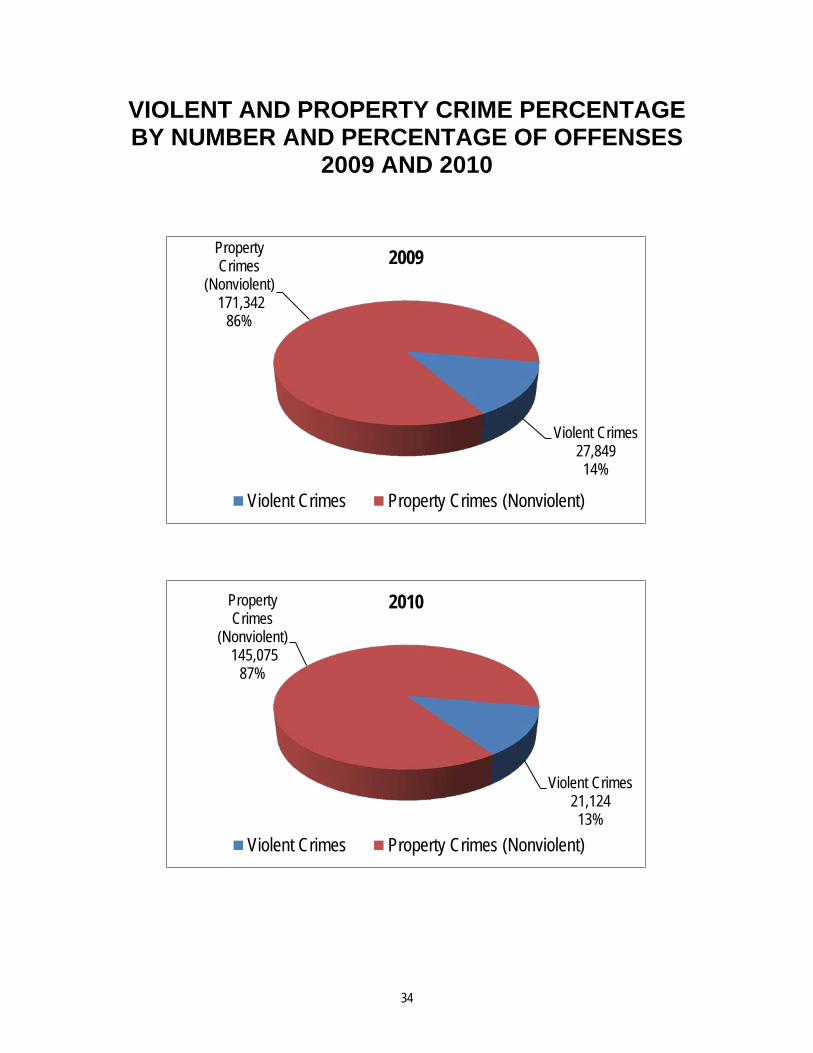
VIOLENT AND PROPERTY CRIME PERCENTAGE BY NUMBER AND PERCENTAGE OF OFFENSES
2009 AND 2010
Violent Crimes 27,849 14%
Property Crimes
(Nonviolent) 171,342
86%
2009
Violent Crimes Property Crimes (Nonviolent)
Violent Crimes 21,124 13%
Property Crimes
(Nonviolent) 145,075
87%
2010
Violent Crimes Property Crimes (Nonviolent)

35
PERCENT CHANGE IN INDEX CRIMES 2009 TO 2010 The tables and charts that follow show the percent change in index crime from 2009 to 2010.

36
LOUISIANA INDEX CRIMES PERCENTAGE CHANGE BY NUMBER OF OFFENSES
OFFENSE 2009 2010 % CHANGE Murder and Non-Negligent Homicide 530 427 -19.43 Forcible Rape 1,359 1,125 -17.22 Robbery 6,105 4,169 -31.71 Aggravated Assault 19,855 15,403 -22.42 VIOLENT CRIME TOTAL 27,849 21,124 -24.15 Burglary 46,246 39,348 -14.92 Larceny - Theft 112,493 96,303 -14.39 Motor Vehicle Theft 11,717 8,925 -23.83 Arson 886 499 -43.68 NON-VIOLENT (PROPETY) CRIME TOTAL 171,342 145,075 -15.33 CRIME INDEX OFFENSE TOTAL 199,191 166,199 -16.56
LOUISIANA INDEX CRIMES PERCENTAGE CHANGE BY CRIME RATE PER 100,000
OFFENSE 2009 2010 % CHANGE Murder and Non-Negligent Homicide 11.80 9.42 -20.17 Forcible Rape 30.25 24.82 -17.95 Robbery 135.91 91.96 -32.34 Aggravated Assault 442.00 339.77 -23.13 VIOLENT CRIME TOTAL 619.96 465.97 -24.84 Burglary 1,029.50 867.96 -15.69 Larceny - Theft 2,504.25 2,124.31 -15.17 Motor Vehicle Theft 260.84 196.87 -24.52 Arson 19.72 11.01 -44.17 NON-VIOLENT (PROPETY) CRIME TOTAL 3,814.32 3,200.16 -16.10 CRIME INDEX OFFENSE TOTAL 4,434.27 3,666.12 -17.32 Population 2009: 4,492,076 2010: 4,533,372

37
Percent Change in Index Crimes 2009 to 2010
Murder and
Non-Negligent Homicide
-19.43
Forcible Rape -17.22
Robbery -31.71
Aggravated Assault -22.42
Burglary -14.92
Larceny - Theft -14.39
Motor Vehicle
Theft -23.83
Arson -43.68 -50.00
-45.00
-40.00
-35.00
-30.00
-25.00
-20.00
-15.00
-10.00
-5.00
0.00
PERCENTAGE CHANGE OF OFFENSES BY NUMBER OF OFFENSES
% Change
Murder and
Non-Negligent Homicide
-20.17
Forcible Rape -17.97
Robbery -32.33
Aggravated Assault -23.13
Burglary -15.69
Larceny - Theft -15.17 Motor
Vehicle Theft -24.52
Arson -44.19
-50.00
-40.00
-30.00
-20.00
-10.00
0.00
PERCENTAGE CHANGE OF OFFENSES BY CRIME RATE
% Change

38
Murder and Non-Negligent Homicide
427 0.26%
Forcible Rape 1,125 0.68%
Robbery 4,169 2.51%
Aggravated Assault 15,403 9.27%
Burglary 39,348 23.68%
Larceny - Theft 96,303 57.94%
Motor Vehicle Theft 8,925 5.37%
Arson 499
0.30%
LOUISIANA INDEX CRIMES PERCENTAGE CHANGE BY NUMBER OF
OFFENSES
Murder and Non-Negligent Homicide Forcible RapeRobbery Aggravated AssaultBurglary Larceny - TheftMotor Vehicle Theft Arson
39
INDEX CRIME TOTALS AND RATES FOR SELECT CITIES IN 2010
The following tables show the number of index crimes and rate of crime for cities comparable in size to New Orleans and for the principal cities of Louisiana’s metropolitan areas.
40
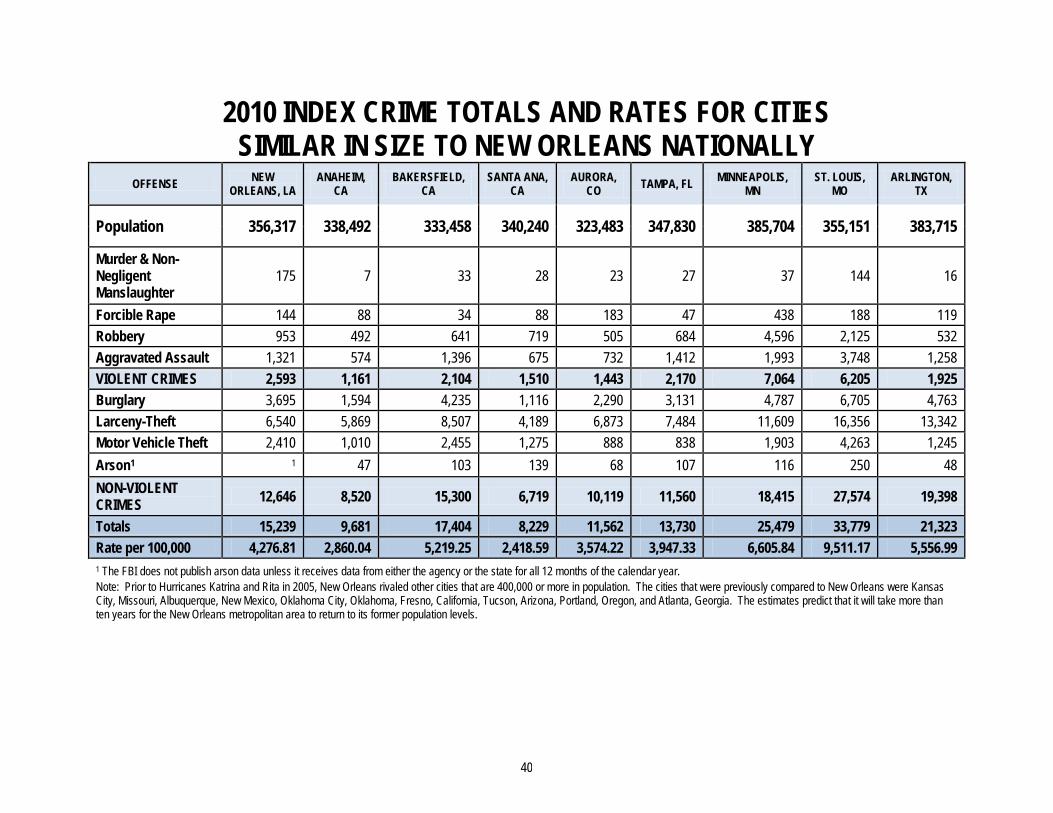
2010 INDEX CRIME TOTALS AND RATES FOR CITIES SIMILAR IN SIZE TO NEW ORLEANS NATIONALLY
OFFENSE NEW ORLEANS, LA
ANAHEIM, CA
BAKERSFIELD, CA
SANTA ANA, CA
AURORA, CO TAMPA, FL MINNEAPOLIS,
MN ST. LOUIS,
MO ARLINGTON,
TX
Population 356,317 338,492 333,458 340,240 323,483 347,830 385,704 355,151 383,715
Murder & Non-Negligent Manslaughter
175 7 33 28 23 27 37 144 16
Forcible Rape 144 88 34 88 183 47 438 188 119 Robbery 953 492 641 719 505 684 4,596 2,125 532 Aggravated Assault 1,321 574 1,396 675 732 1,412 1,993 3,748 1,258 VIOLENT CRIMES 2,593 1,161 2,104 1,510 1,443 2,170 7,064 6,205 1,925 Burglary 3,695 1,594 4,235 1,116 2,290 3,131 4,787 6,705 4,763 Larceny-Theft 6,540 5,869 8,507 4,189 6,873 7,484 11,609 16,356 13,342 Motor Vehicle Theft 2,410 1,010 2,455 1,275 888 838 1,903 4,263 1,245 Arson1 1 47 103 139 68 107 116 250 48 NON-VIOLENT CRIMES 12,646 8,520 15,300 6,719 10,119 11,560 18,415 27,574 19,398
Totals 15,239 9,681 17,404 8,229 11,562 13,730 25,479 33,779 21,323 Rate per 100,000 4,276.81 2,860.04 5,219.25 2,418.59 3,574.22 3,947.33 6,605.84 9,511.17 5,556.99 1 The FBI does not publish arson data unless it receives data from either the agency or the state for all 12 months of the calendar year. Note: Prior to Hurricanes Katrina and Rita in 2005, New Orleans rivaled other cities that are 400,000 or more in population. The cities that were previously compared to New Orleans were Kansas City, Missouri, Albuquerque, New Mexico, Oklahoma City, Oklahoma, Fresno, California, Tucson, Arizona, Portland, Oregon, and Atlanta, Georgia. The estimates predict that it will take more than ten years for the New Orleans metropolitan area to return to its former population levels.

41
2010 INDEX CRIME TOTALS AND RATES FOR TEN LARGEST LOUISIANA CITIES1
OFFENSE NEW ORLEANS
BATON ROUGE2, 3
SHREVEPORT LAFAYETTE LAKE CHARLES
KENNER BOSSIER CITY2
MONROE3 ALEXANDRIA HOUMA SLIDELL3
Population 356,317 229,493 199,900 115,378 71,795 67,899 64,232 51,709 49,283 32,688 27,772
Murder & Non-Negligent Manslaughter
175 26 12 7 8 1 6 4 4 0
Forcible Rape 144 121 20 2027 22 27 19 11 12 16 Robbery 953 355 240 148 80 71 86 184 86 21 Aggravated Assault 1,321 10,31 668 306 99 298 297 393 152 69
VIOLENT CRIME TOTAL 2,593 0 502 940 2488 209 397 408 592 254 106
Burglary 3,695 2,616 1,432 1,826 386 480 1,577 943 358 177
Larceny-Theft 6,540 6,317 5,267 1,088 1,809 2,036 2,884 2714 1,131 1,295
Motor Vehicle Theft 2,410 526 290 133 157 147 116 130 87 77
Arson 99 26 0 31 3 NON-VIOLENT CRIME TOTAL 12,645 0 9,558 7,015 3,047 2,383 2,666 4,577 3,787 1,576 1,549
Totals 15,238 0 10,060 7,955 5,535 2,592 3,063 4,985 4,379 1,830 1,655
Rate per 100,000 4,276.53 0.00 5,032.52 6,894.73 7,709.45 3,817.43 4,768.65 9,640.49 8,885.42 5,598.38 5,959.24 1. The 10 cities listed are the largest of those that reported data for all 12 months of the calendar year through the UCR Program to the FBI. There may be other cities that have larger populations than those included in this list. 2 The FBI determined that the agency’s data were underreported. Consequently, those data were not included in this table by the FBI. 3. The Baton Rouge Police Department only reported the first six months of the year and thus was not included in the FBI reports for 2010. Monroe was not included in the 2009 FBI report but did have all 12 months included in the 2010 report. For comparisons sake, Slidell was included in this chart to give 10 cities to compare instead of just nine since the Baton Rouge data was not available.

42
2010 INDEX CRIME TOTALS AND RATES FOR PRINCIPAL CITIES LOCATED IN MSA
OFFENSE ALEXANDRIA BATON ROUGE 2
HOUMA, BAYOU CANE & THIBODAUX LAFAYETTE
LAKE CHARLES MONROE
NEW ORLEANS, METAIRIE &
KENNER1 SHREVEPORT & BOSSIER CITY
Parishes Included
Grant & Rapides Parishes
Ascension, East Baton Rouge, East Feliciana,
Iberville, Livingston, Pointe Coupee, St. Helena, West
Baton Rouge & West Feliciana Parishes
Lafourche & Terrebonne
Parishes
Lafayette & St Martin Parishes
Calcasieu & Cameron Parishes
Ouachita & Union
Orleans, Jefferson, Plaquemines, St.
Bernard1, St. Charles, St. John the
Baptist, & St. Tammany Parishes
Caddo, Bossier, & DeSoto Parishes
Population 154,654 787,715 204,653 266,765 195,066 175,187 1,201,385 394,702 Percentage of SMA Reporting 94.40% 100.00% 94.50% 96.00% 98.80% 100.00% 98.30% Murder & Non-Negligent Manslaughter
9 12 19 16 16 250 33
Forcible Rape 34 46 44 109 40 307 168 Robbery 200 164 319 210 117 1,620 443 Aggravated Assault 705 565 1,195 896 568 3,427 1,796 Violent Crimes 948 787 1,577 1,231 741 5,604 2,440 Burglary 1,795 1,394 2,391 3,112 2,776 9,055 3,691 Larceny-Theft 4,653 5,324 7,651 4,750 5,476 24,669 9,852 Motor Vehicle Theft 318 366 427 441 245 809 Property Crimes (Non-Violent) 6,766 0 7,084 10,469 8,303 8,497 33,724 14,352 Totals 7,714 0 7,871 12,046 9,534 9,238 39,328 16,792 Rate per 100,000 4,708.59 0.00 3,846.02 4,267.23 4,692.07 5,209.94 3,273.56 4,182.02 1 The FBI determined that the agency’s data were underreported. Consequently, those data were not included in this table. 2 Baton Rouge Police Department only reported for the first six months of 2010 so no data was recorded in the FBI’s Crime in the US for this Metropolitan Statistical Area although some of the other police and/or sheriffs’ departments did report some or all 12 months.

43
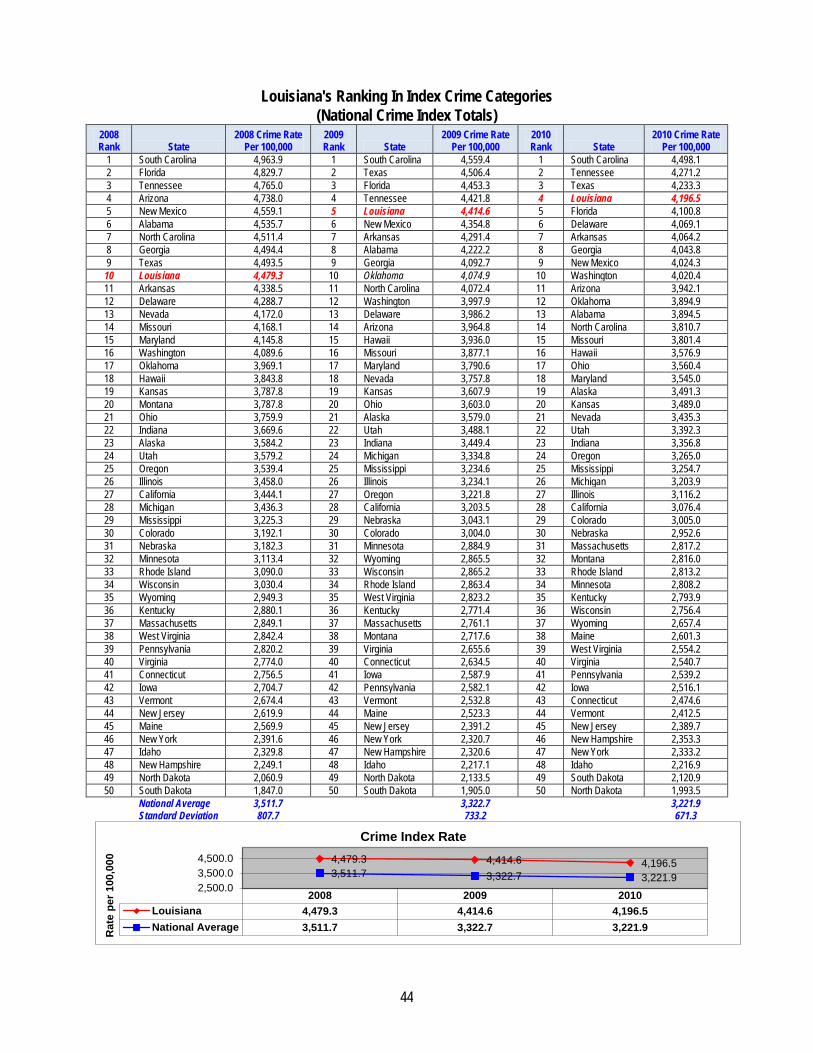
LOUISIANA’S NATIONAL RANKING
IN INDEX CRIME CATEGORIES
The tables that follow show where Louisiana ranks compared to the rest of the states in the nation in the individual index offenses. Rankings are also given for the total violent crimes of murder, rape, robbery, and aggravated assault as well as for the nonviolent crimes of burglary, larceny-theft and motor vehicle theft.
OFFENSE 2009 RANK
2010 RANK
Murder and Non-Negligent Manslaughter 1st 1st Forcible Rape 28th 34th Robbery 13th 6th Aggravated Assault 5th 6th Violent Crime Ranking 6th 7th Burglary 6th 6th Larceny-Theft 7th 18th Motor Vehicle Theft 15th 22nd Property/Non-Violent Crime Ranking 4th 5th Total Index Crime Ranking 5th 9th
44
Louisiana's Ranking In Index Crime Categories (National Crime Index Totals)
2008 Rank State
2008 Crime Rate Per 100,000
2009 Rank State
2009 Crime Rate Per 100,000
2010 Rank State
2010 Crime Rate Per 100,000
1 South Carolina 4,963.9 1 South Carolina 4,559.4 1 South Carolina 4,498.1 2 Florida 4,829.7 2 Texas 4,506.4 2 Tennessee 4,271.2 3 Tennessee 4,765.0 3 Florida 4,453.3 3 Texas 4,233.3 4 Arizona 4,738.0 4 Tennessee 4,421.8 4 Louisiana 4,196.5 5 New Mexico 4,559.1 5 Louisiana 4,414.6 5 Florida 4,100.8 6 Alabama 4,535.7 6 New Mexico 4,354.8 6 Delaware 4,069.1 7 North Carolina 4,511.4 7 Arkansas 4,291.4 7 Arkansas 4,064.2 8 Georgia 4,494.4 8 Alabama 4,222.2 8 Georgia 4,043.8 9 Texas 4,493.5 9 Georgia 4,092.7 9 New Mexico 4,024.3 10 Louisiana 4,479.3 10 Oklahoma 4,074.9 10 Washington 4,020.4 11 Arkansas 4,338.5 11 North Carolina 4,072.4 11 Arizona 3,942.1 12 Delaware 4,288.7 12 Washington 3,997.9 12 Oklahoma 3,894.9 13 Nevada 4,172.0 13 Delaware 3,986.2 13 Alabama 3,894.5 14 Missouri 4,168.1 14 Arizona 3,964.8 14 North Carolina 3,810.7 15 Maryland 4,145.8 15 Hawaii 3,936.0 15 Missouri 3,801.4 16 Washington 4,089.6 16 Missouri 3,877.1 16 Hawaii 3,576.9 17 Oklahoma 3,969.1 17 Maryland 3,790.6 17 Ohio 3,560.4 18 Hawaii 3,843.8 18 Nevada 3,757.8 18 Maryland 3,545.0 19 Kansas 3,787.8 19 Kansas 3,607.9 19 Alaska 3,491.3 20 Montana 3,787.8 20 Ohio 3,603.0 20 Kansas 3,489.0 21 Ohio 3,759.9 21 Alaska 3,579.0 21 Nevada 3,435.3 22 Indiana 3,669.6 22 Utah 3,488.1 22 Utah 3,392.3 23 Alaska 3,584.2 23 Indiana 3,449.4 23 Indiana 3,356.8 24 Utah 3,579.2 24 Michigan 3,334.8 24 Oregon 3,265.0 25 Oregon 3,539.4 25 Mississippi 3,234.6 25 Mississippi 3,254.7 26 Illinois 3,458.0 26 Illinois 3,234.1 26 Michigan 3,203.9 27 California 3,444.1 27 Oregon 3,221.8 27 Illinois 3,116.2 28 Michigan 3,436.3 28 California 3,203.5 28 California 3,076.4 29 Mississippi 3,225.3 29 Nebraska 3,043.1 29 Colorado 3,005.0 30 Colorado 3,192.1 30 Colorado 3,004.0 30 Nebraska 2,952.6 31 Nebraska 3,182.3 31 Minnesota 2,884.9 31 Massachusetts 2,817.2 32 Minnesota 3,113.4 32 Wyoming 2,865.5 32 Montana 2,816.0 33 Rhode Island 3,090.0 33 Wisconsin 2,865.2 33 Rhode Island 2,813.2 34 Wisconsin 3,030.4 34 Rhode Island 2,863.4 34 Minnesota 2,808.2 35 Wyoming 2,949.3 35 West Virginia 2,823.2 35 Kentucky 2,793.9 36 Kentucky 2,880.1 36 Kentucky 2,771.4 36 Wisconsin 2,756.4 37 Massachusetts 2,849.1 37 Massachusetts 2,761.1 37 Wyoming 2,657.4 38 West Virginia 2,842.4 38 Montana 2,717.6 38 Maine 2,601.3 39 Pennsylvania 2,820.2 39 Virginia 2,655.6 39 West Virginia 2,554.2 40 Virginia 2,774.0 40 Connecticut 2,634.5 40 Virginia 2,540.7 41 Connecticut 2,756.5 41 Iowa 2,587.9 41 Pennsylvania 2,539.2 42 Iowa 2,704.7 42 Pennsylvania 2,582.1 42 Iowa 2,516.1 43 Vermont 2,674.4 43 Vermont 2,532.8 43 Connecticut 2,474.6 44 New Jersey 2,619.9 44 Maine 2,523.3 44 Vermont 2,412.5 45 Maine 2,569.9 45 New Jersey 2,391.2 45 New Jersey 2,389.7 46 New York 2,391.6 46 New York 2,320.7 46 New Hampshire 2,353.3 47 Idaho 2,329.8 47 New Hampshire 2,320.6 47 New York 2,333.2 48 New Hampshire 2,249.1 48 Idaho 2,217.1 48 Idaho 2,216.9 49 North Dakota 2,060.9 49 North Dakota 2,133.5 49 South Dakota 2,120.9 50 South Dakota 1,847.0 50 South Dakota 1,905.0 50 North Dakota 1,993.5
National Average 3,511.7
3,322.7
3,221.9
Standard Deviation 807.7
733.2
671.3
2008 2009 2010Louisiana 4,479.3 4,414.6 4,196.5National Average 3,511.7 3,322.7 3,221.9
4,479.3 4,414.6 4,196.5 3,511.7 3,322.7 3,221.9
2,500.03,500.04,500.0
Rat
e pe
r 100
,000
Crime Index Rate
45
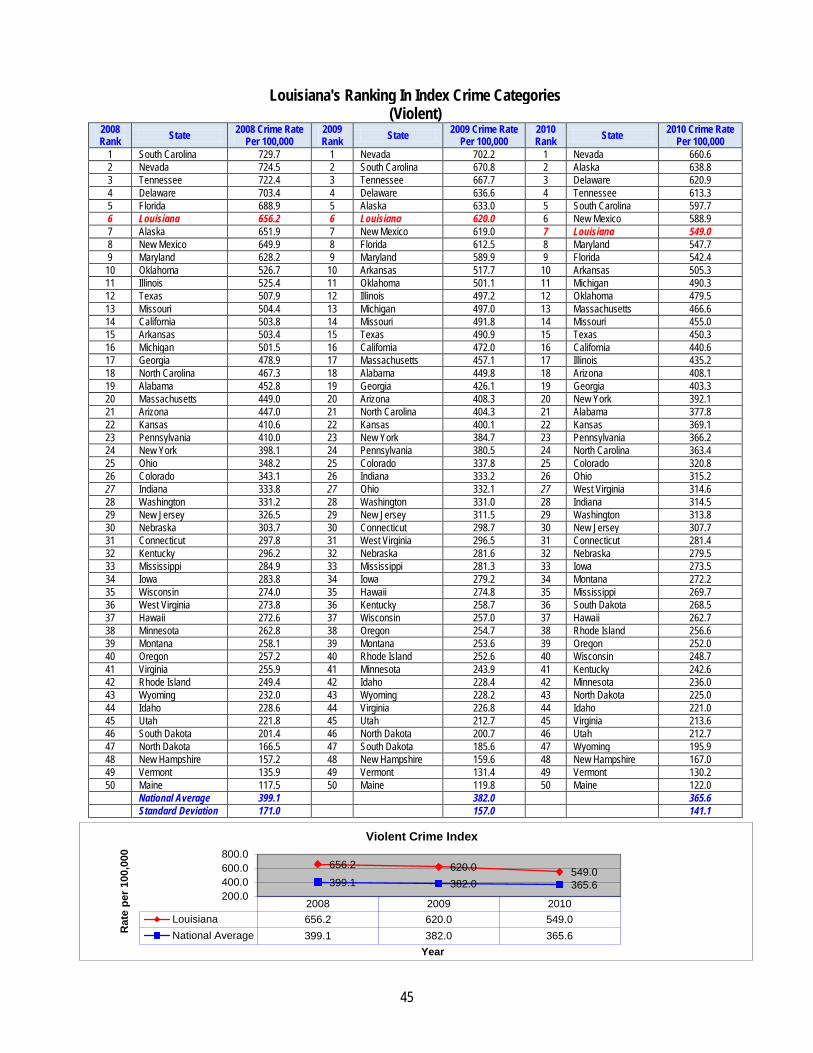
Louisiana's Ranking In Index Crime Categories (Violent)
2008 Rank State 2008 Crime Rate
Per 100,000 2009 Rank State 2009 Crime Rate
Per 100,000 2010 Rank State 2010 Crime Rate
Per 100,000 1 South Carolina 729.7 1 Nevada 702.2 1 Nevada 660.6 2 Nevada 724.5 2 South Carolina 670.8 2 Alaska 638.8 3 Tennessee 722.4 3 Tennessee 667.7 3 Delaware 620.9 4 Delaware 703.4 4 Delaware 636.6 4 Tennessee 613.3 5 Florida 688.9 5 Alaska 633.0 5 South Carolina 597.7 6 Louisiana 656.2 6 Louisiana 620.0 6 New Mexico 588.9 7 Alaska 651.9 7 New Mexico 619.0 7 Louisiana 549.0 8 New Mexico 649.9 8 Florida 612.5 8 Maryland 547.7 9 Maryland 628.2 9 Maryland 589.9 9 Florida 542.4 10 Oklahoma 526.7 10 Arkansas 517.7 10 Arkansas 505.3 11 Illinois 525.4 11 Oklahoma 501.1 11 Michigan 490.3 12 Texas 507.9 12 Illinois 497.2 12 Oklahoma 479.5 13 Missouri 504.4 13 Michigan 497.0 13 Massachusetts 466.6 14 California 503.8 14 Missouri 491.8 14 Missouri 455.0 15 Arkansas 503.4 15 Texas 490.9 15 Texas 450.3 16 Michigan 501.5 16 California 472.0 16 California 440.6 17 Georgia 478.9 17 Massachusetts 457.1 17 Illinois 435.2 18 North Carolina 467.3 18 Alabama 449.8 18 Arizona 408.1 19 Alabama 452.8 19 Georgia 426.1 19 Georgia 403.3 20 Massachusetts 449.0 20 Arizona 408.3 20 New York 392.1 21 Arizona 447.0 21 North Carolina 404.3 21 Alabama 377.8 22 Kansas 410.6 22 Kansas 400.1 22 Kansas 369.1 23 Pennsylvania 410.0 23 New York 384.7 23 Pennsylvania 366.2 24 New York 398.1 24 Pennsylvania 380.5 24 North Carolina 363.4 25 Ohio 348.2 25 Colorado 337.8 25 Colorado 320.8 26 Colorado 343.1 26 Indiana 333.2 26 Ohio 315.2 27 Indiana 333.8 27 Ohio 332.1 27 West Virginia 314.6 28 Washington 331.2 28 Washington 331.0 28 Indiana 314.5 29 New Jersey 326.5 29 New Jersey 311.5 29 Washington 313.8 30 Nebraska 303.7 30 Connecticut 298.7 30 New Jersey 307.7 31 Connecticut 297.8 31 West Virginia 296.5 31 Connecticut 281.4 32 Kentucky 296.2 32 Nebraska 281.6 32 Nebraska 279.5 33 Mississippi 284.9 33 Mississippi 281.3 33 Iowa 273.5 34 Iowa 283.8 34 Iowa 279.2 34 Montana 272.2 35 Wisconsin 274.0 35 Hawaii 274.8 35 Mississippi 269.7 36 West Virginia 273.8 36 Kentucky 258.7 36 South Dakota 268.5 37 Hawaii 272.6 37 Wisconsin 257.0 37 Hawaii 262.7 38 Minnesota 262.8 38 Oregon 254.7 38 Rhode Island 256.6 39 Montana 258.1 39 Montana 253.6 39 Oregon 252.0 40 Oregon 257.2 40 Rhode Island 252.6 40 Wisconsin 248.7 41 Virginia 255.9 41 Minnesota 243.9 41 Kentucky 242.6 42 Rhode Island 249.4 42 Idaho 228.4 42 Minnesota 236.0 43 Wyoming 232.0 43 Wyoming 228.2 43 North Dakota 225.0 44 Idaho 228.6 44 Virginia 226.8 44 Idaho 221.0 45 Utah 221.8 45 Utah 212.7 45 Virginia 213.6 46 South Dakota 201.4 46 North Dakota 200.7 46 Utah 212.7 47 North Dakota 166.5 47 South Dakota 185.6 47 Wyoming 195.9 48 New Hampshire 157.2 48 New Hampshire 159.6 48 New Hampshire 167.0 49 Vermont 135.9 49 Vermont 131.4 49 Vermont 130.2 50 Maine 117.5 50 Maine 119.8 50 Maine 122.0
National Average 399.1
382.0
365.6
Standard Deviation 171.0
157.0
141.1
2008 2009 2010Louisiana 656.2 620.0 549.0National Average 399.1 382.0 365.6
656.2 620.0 549.0 399.1 382.0 365.6
200.0400.0600.0800.0
Rat
e pe
r 100
,000
Year
Violent Crime Index
46
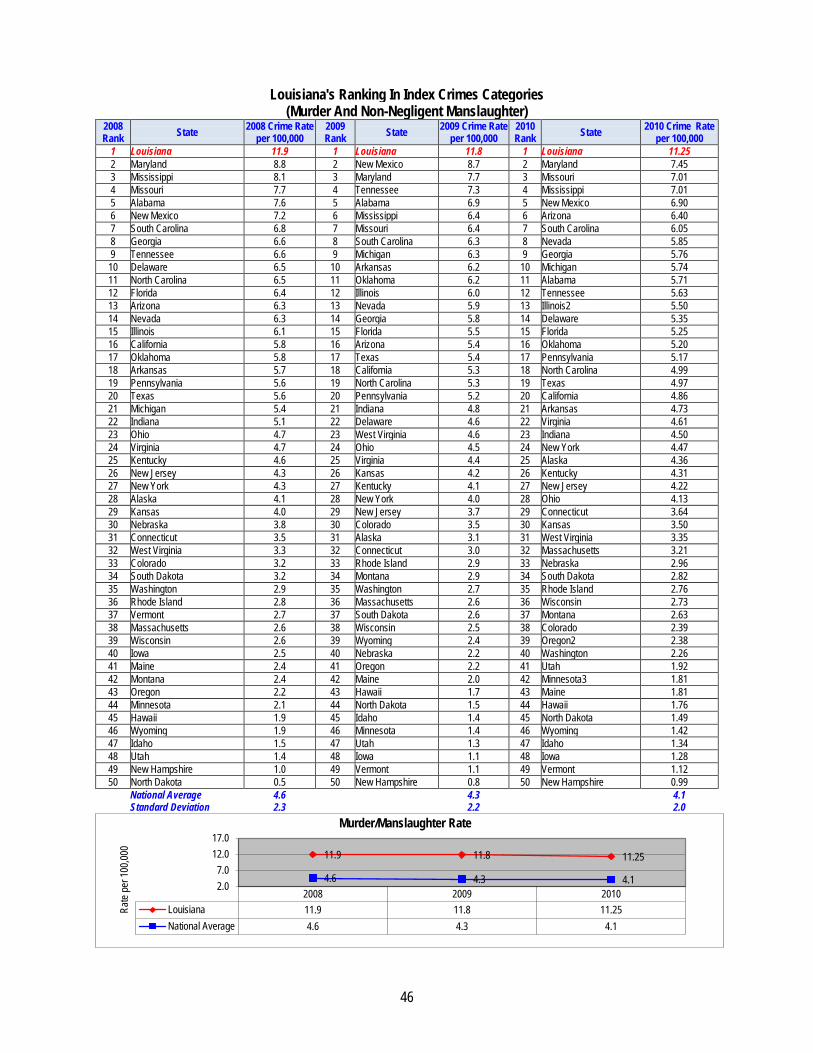
Louisiana's Ranking In Index Crimes Categories (Murder And Non-Negligent Manslaughter)
2008 Rank State 2008 Crime Rate
per 100,000 2009 Rank State 2009 Crime Rate
per 100,000 2010 Rank State 2010 Crime Rate
per 100,000 1 Louisiana 11.9 1 Louisiana 11.8 1 Louisiana 11.25 2 Maryland 8.8 2 New Mexico 8.7 2 Maryland 7.45 3 Mississippi 8.1 3 Maryland 7.7 3 Missouri 7.01 4 Missouri 7.7 4 Tennessee 7.3 4 Mississippi 7.01 5 Alabama 7.6 5 Alabama 6.9 5 New Mexico 6.90 6 New Mexico 7.2 6 Mississippi 6.4 6 Arizona 6.40 7 South Carolina 6.8 7 Missouri 6.4 7 South Carolina 6.05 8 Georgia 6.6 8 South Carolina 6.3 8 Nevada 5.85 9 Tennessee 6.6 9 Michigan 6.3 9 Georgia 5.76 10 Delaware 6.5 10 Arkansas 6.2 10 Michigan 5.74 11 North Carolina 6.5 11 Oklahoma 6.2 11 Alabama 5.71 12 Florida 6.4 12 Illinois 6.0 12 Tennessee 5.63 13 Arizona 6.3 13 Nevada 5.9 13 Illinois2 5.50 14 Nevada 6.3 14 Georgia 5.8 14 Delaware 5.35 15 Illinois 6.1 15 Florida 5.5 15 Florida 5.25 16 California 5.8 16 Arizona 5.4 16 Oklahoma 5.20 17 Oklahoma 5.8 17 Texas 5.4 17 Pennsylvania 5.17 18 Arkansas 5.7 18 California 5.3 18 North Carolina 4.99 19 Pennsylvania 5.6 19 North Carolina 5.3 19 Texas 4.97 20 Texas 5.6 20 Pennsylvania 5.2 20 California 4.86 21 Michigan 5.4 21 Indiana 4.8 21 Arkansas 4.73 22 Indiana 5.1 22 Delaware 4.6 22 Virginia 4.61 23 Ohio 4.7 23 West Virginia 4.6 23 Indiana 4.50 24 Virginia 4.7 24 Ohio 4.5 24 New York 4.47 25 Kentucky 4.6 25 Virginia 4.4 25 Alaska 4.36 26 New Jersey 4.3 26 Kansas 4.2 26 Kentucky 4.31 27 New York 4.3 27 Kentucky 4.1 27 New Jersey 4.22 28 Alaska 4.1 28 New York 4.0 28 Ohio 4.13 29 Kansas 4.0 29 New Jersey 3.7 29 Connecticut 3.64 30 Nebraska 3.8 30 Colorado 3.5 30 Kansas 3.50 31 Connecticut 3.5 31 Alaska 3.1 31 West Virginia 3.35 32 West Virginia 3.3 32 Connecticut 3.0 32 Massachusetts 3.21 33 Colorado 3.2 33 Rhode Island 2.9 33 Nebraska 2.96 34 South Dakota 3.2 34 Montana 2.9 34 South Dakota 2.82 35 Washington 2.9 35 Washington 2.7 35 Rhode Island 2.76 36 Rhode Island 2.8 36 Massachusetts 2.6 36 Wisconsin 2.73 37 Vermont 2.7 37 South Dakota 2.6 37 Montana 2.63 38 Massachusetts 2.6 38 Wisconsin 2.5 38 Colorado 2.39 39 Wisconsin 2.6 39 Wyoming 2.4 39 Oregon2 2.38 40 Iowa 2.5 40 Nebraska 2.2 40 Washington 2.26 41 Maine 2.4 41 Oregon 2.2 41 Utah 1.92 42 Montana 2.4 42 Maine 2.0 42 Minnesota3 1.81 43 Oregon 2.2 43 Hawaii 1.7 43 Maine 1.81 44 Minnesota 2.1 44 North Dakota 1.5 44 Hawaii 1.76 45 Hawaii 1.9 45 Idaho 1.4 45 North Dakota 1.49 46 Wyoming 1.9 46 Minnesota 1.4 46 Wyoming 1.42 47 Idaho 1.5 47 Utah 1.3 47 Idaho 1.34 48 Utah 1.4 48 Iowa 1.1 48 Iowa 1.28 49 New Hampshire 1.0 49 Vermont 1.1 49 Vermont 1.12 50 North Dakota 0.5 50 New Hampshire 0.8 50 New Hampshire 0.99
National Average 4.6 4.3 4.1 Standard Deviation 2.3 2.2 2.0
2008 2009 2010Louisiana 11.9 11.8 11.25National Average 4.6 4.3 4.1
11.9 11.8 11.25
4.6 4.3 4.1 2.07.0
12.017.0
Rate
per 1
00,00
0
Murder/Manslaughter Rate
47
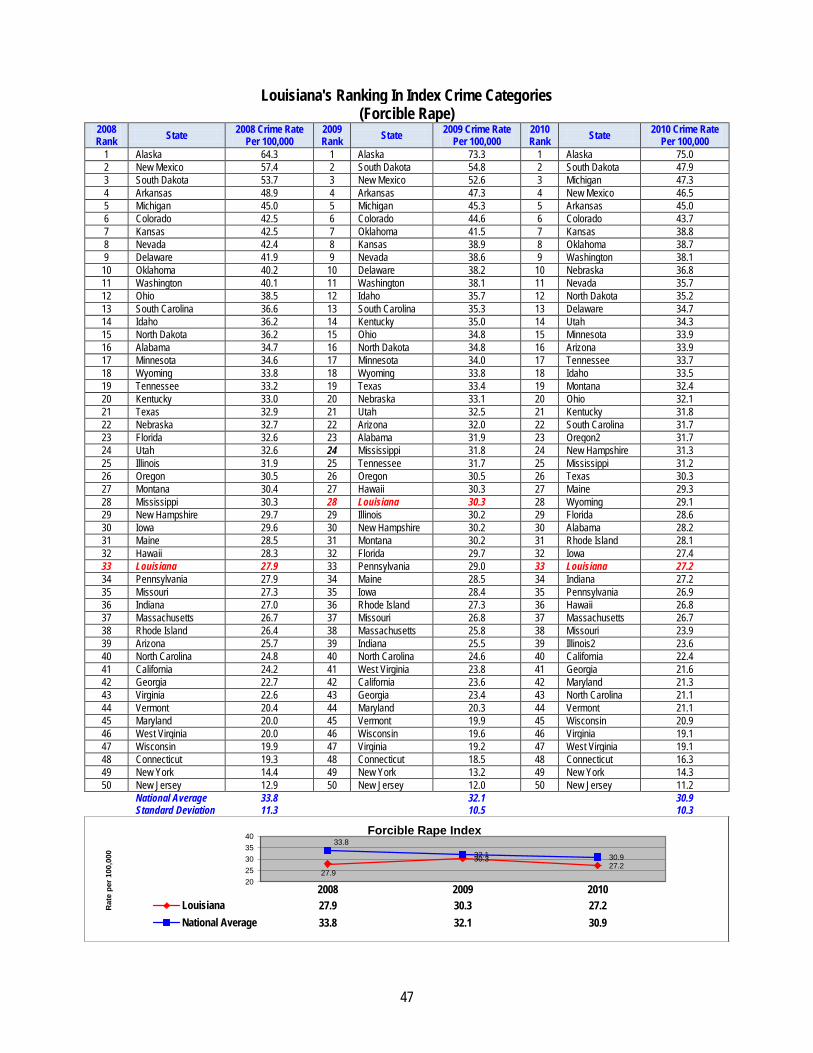
Louisiana's Ranking In Index Crime Categories (Forcible Rape)
2008 Rank State 2008 Crime Rate
Per 100,000 2009 Rank State 2009 Crime Rate
Per 100,000 2010 Rank State 2010 Crime Rate
Per 100,000 1 Alaska 64.3 1 Alaska 73.3 1 Alaska 75.0 2 New Mexico 57.4 2 South Dakota 54.8 2 South Dakota 47.9 3 South Dakota 53.7 3 New Mexico 52.6 3 Michigan 47.3 4 Arkansas 48.9 4 Arkansas 47.3 4 New Mexico 46.5 5 Michigan 45.0 5 Michigan 45.3 5 Arkansas 45.0 6 Colorado 42.5 6 Colorado 44.6 6 Colorado 43.7 7 Kansas 42.5 7 Oklahoma 41.5 7 Kansas 38.8 8 Nevada 42.4 8 Kansas 38.9 8 Oklahoma 38.7 9 Delaware 41.9 9 Nevada 38.6 9 Washington 38.1 10 Oklahoma 40.2 10 Delaware 38.2 10 Nebraska 36.8 11 Washington 40.1 11 Washington 38.1 11 Nevada 35.7 12 Ohio 38.5 12 Idaho 35.7 12 North Dakota 35.2 13 South Carolina 36.6 13 South Carolina 35.3 13 Delaware 34.7 14 Idaho 36.2 14 Kentucky 35.0 14 Utah 34.3 15 North Dakota 36.2 15 Ohio 34.8 15 Minnesota 33.9 16 Alabama 34.7 16 North Dakota 34.8 16 Arizona 33.9 17 Minnesota 34.6 17 Minnesota 34.0 17 Tennessee 33.7 18 Wyoming 33.8 18 Wyoming 33.8 18 Idaho 33.5 19 Tennessee 33.2 19 Texas 33.4 19 Montana 32.4 20 Kentucky 33.0 20 Nebraska 33.1 20 Ohio 32.1 21 Texas 32.9 21 Utah 32.5 21 Kentucky 31.8 22 Nebraska 32.7 22 Arizona 32.0 22 South Carolina 31.7 23 Florida 32.6 23 Alabama 31.9 23 Oregon2 31.7 24 Utah 32.6 24 Mississippi 31.8 24 New Hampshire 31.3 25 Illinois 31.9 25 Tennessee 31.7 25 Mississippi 31.2 26 Oregon 30.5 26 Oregon 30.5 26 Texas 30.3 27 Montana 30.4 27 Hawaii 30.3 27 Maine 29.3 28 Mississippi 30.3 28 Louisiana 30.3 28 Wyoming 29.1 29 New Hampshire 29.7 29 Illinois 30.2 29 Florida 28.6 30 Iowa 29.6 30 New Hampshire 30.2 30 Alabama 28.2 31 Maine 28.5 31 Montana 30.2 31 Rhode Island 28.1 32 Hawaii 28.3 32 Florida 29.7 32 Iowa 27.4 33 Louisiana 27.9 33 Pennsylvania 29.0 33 Louisiana 27.2 34 Pennsylvania 27.9 34 Maine 28.5 34 Indiana 27.2 35 Missouri 27.3 35 Iowa 28.4 35 Pennsylvania 26.9 36 Indiana 27.0 36 Rhode Island 27.3 36 Hawaii 26.8 37 Massachusetts 26.7 37 Missouri 26.8 37 Massachusetts 26.7 38 Rhode Island 26.4 38 Massachusetts 25.8 38 Missouri 23.9 39 Arizona 25.7 39 Indiana 25.5 39 Illinois2 23.6 40 North Carolina 24.8 40 North Carolina 24.6 40 California 22.4 41 California 24.2 41 West Virginia 23.8 41 Georgia 21.6 42 Georgia 22.7 42 California 23.6 42 Maryland 21.3 43 Virginia 22.6 43 Georgia 23.4 43 North Carolina 21.1 44 Vermont 20.4 44 Maryland 20.3 44 Vermont 21.1 45 Maryland 20.0 45 Vermont 19.9 45 Wisconsin 20.9 46 West Virginia 20.0 46 Wisconsin 19.6 46 Virginia 19.1 47 Wisconsin 19.9 47 Virginia 19.2 47 West Virginia 19.1 48 Connecticut 19.3 48 Connecticut 18.5 48 Connecticut 16.3 49 New York 14.4 49 New York 13.2 49 New York 14.3 50 New Jersey 12.9 50 New Jersey 12.0 50 New Jersey 11.2
National Average 33.8 32.1 30.9 Standard Deviation 11.3 10.5 10.3
2008 2009 2010Louisiana 27.9 30.3 27.2National Average 33.8 32.1 30.9
27.9
30.3 27.2
33.8 32.1 30.9
2025303540
Rat
e pe
r 100
,000
Forcible Rape Index

48
Louisiana's Ranking In Index Crime Categories (Robbery)
2009 Rank State 2009 Crime Rate per
100,000 2009 Rank State 2009 Crime Rate
per 100,000 2006 Rank State 2006 Crime Rate
per 100,000 1 Nevada 248.9 1 Nevada 227.8 1 Delaware 203.7 2 Maryland 234.4 2 Maryland 210.7 2 Nevada 196.2 3 Delaware 210.5 3 Delaware 188.8 3 Maryland 191.5 4 Florida 197.9 4 Illinois 177.6 4 Illinois2 156.3 5 California 188.8 5 California 173.4 5 California 156.0 6 Illinois 186.4 6 Florida 166.7 6 New York 146.9 7 Georgia 179.2 7 Ohio 154.1 7 Ohio 142.8 8 Tennessee 173.8 8 Texas 153.5 8 Florida 138.7 9 New York 163.0 9 Tennessee 153.2 9 New Jersey 134.4
10 Ohio 163.0 10 Georgia 148.6 10 Tennessee 131.8 11 Alabama 157.6 11 New York 144.0 11 Texas 130.6 12 North Carolina 155.4 12 Pennsylvania 139.0 12 Pennsylvania 128.8 13 Texas 155.2 13 Louisiana 135.9 13 Georgia 127.7 14 Pennsylvania 151.6 14 New Jersey 133.7 14 Michigan 116.3 15 Arizona 149.2 15 Alabama 132.9 15 Louisiana 114.9 16 South Carolina 147.3 16 North Carolina 126.1 16 Arizona 108.5 17 New Jersey 146.3 17 South Carolina 125.7 17 South Carolina 107.7 18 Louisiana 135.9 18 Missouri 124.5 18 Massachusetts 105.0 19 Michigan 129.6 19 Michigan 123.7 19 Missouri 102.4 20 Missouri 125.0 20 Arizona 122.8 20 North Carolina 100.8 21 Indiana 118.1 21 Indiana 114.5 21 Alabama 99.6 22 Connecticut 111.6 22 Connecticut 113.4 22 Connecticut 99.4 23 New Mexico 109.5 23 Massachusetts 112.6 23 Indiana 95.9 24 Massachusetts 108.8 24 Washington 100.5 24 Mississippi 93.7 25 Mississippi 102.6 25 Mississippi 100.4 25 Oklahoma 89.0 26 Oklahoma 101.1 26 Alaska 93.8 26 Washington 88.2 27 Washington 96.9 27 New Mexico 93.1 27 Kentucky 86.4 28 Arkansas 95.8 28 Oklahoma 90.7 28 Alaska 83.6 29 Virginia 95.7 29 Arkansas 89.4 29 Arkansas 81.3 30 Alaska 94.0 30 Wisconsin 85.8 30 Wisconsin 79.2 31 Kentucky 93.8 31 Kentucky 84.1 31 New Mexico 78.4 32 Wisconsin 91.1 32 Hawaii 79.8 32 Hawaii 77.5 33 Hawaii 84.3 33 Virginia 79.4 33 Rhode Island 74.1 34 Rhode Island 83.7 34 Rhode Island 74.6 34 Virginia 70.7 35 Minnesota 80.0 35 Minnesota 68.7 35 Minnesota3 63.9 36 Nebraska 72.8 36 Nebraska 67.9 36 Oregon2 62.4 37 Oregon 69.7 37 Colorado 67.4 37 Colorado 62.3 38 Colorado 68.1 38 Oregon 64.3 38 Nebraska 56.1 39 Kansas 60.1 39 Kansas 63.4 39 Kansas 54.1 40 Utah 51.9 40 West Virginia 50.4 40 Utah 45.9 41 West Virginia 49.0 41 Utah 46.7 41 West Virginia 44.7 42 Iowa 41.6 42 Iowa 39.7 42 New Hampshire 34.3 43 New Hampshire 31.8 43 New Hampshire 34.4 43 Iowa 33.2 44 Maine 25.3 44 Maine 30.3 44 Maine 31.2 45 Montana 17.8 45 Montana 22.2 45 South Dakota 18.9 46 Wyoming 16.1 46 Vermont 17.9 46 Montana 15.9 47 Idaho 15.8 47 North Dakota 16.2 47 Idaho 13.7 48 South Dakota 14.9 48 Idaho 15.9 48 Wyoming 13.5 49 Vermont 14.3 49 Wyoming 14.2 49 North Dakota 13.4 50 North Dakota 11.2 50 South Dakota 13.7 50 Vermont 11.8
National Average 108.5 109.6 111.3 Standard Deviation 60.5 61.6 63.1
2008 2009 2010Louisiana 135.9 135.9 114.9National Average 108.5 100.1 90.3
135.9 135.9
114.9 108.5 100.1
90.3 75
100
125
150
Rat
e pe
r 100
,000
Year
Robbery Index
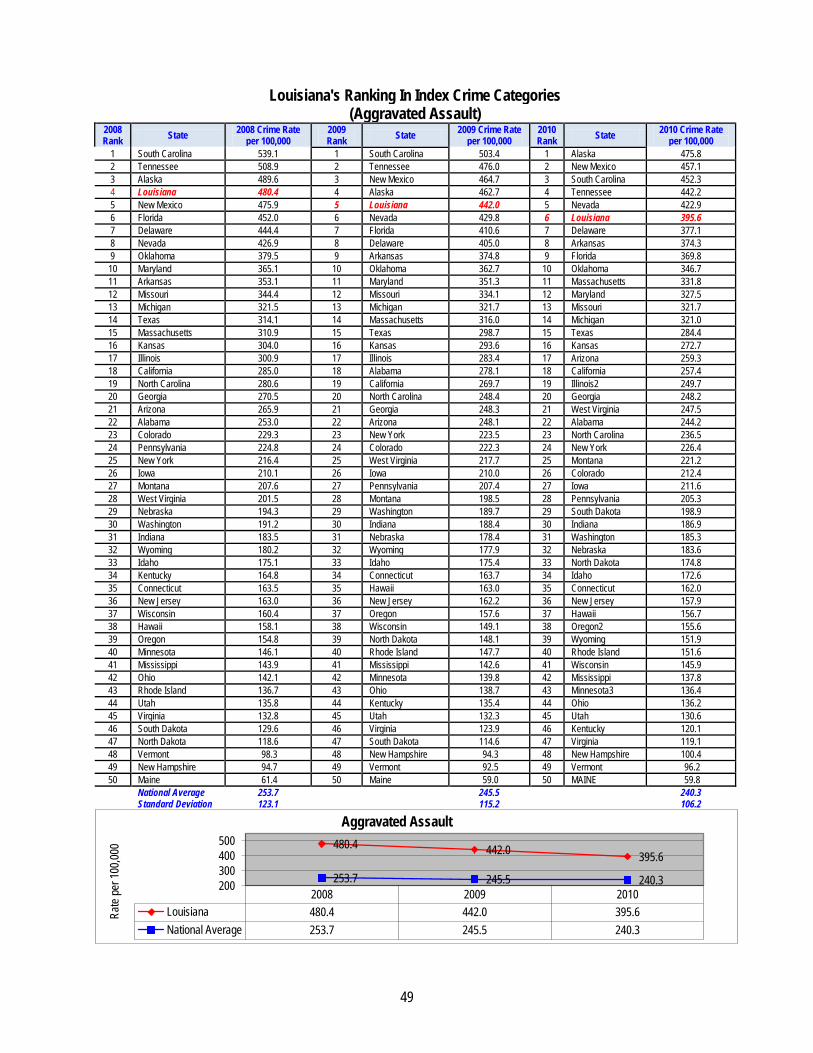
49
Louisiana's Ranking In Index Crime Categories (Aggravated Assault)
2008 Rank State 2008 Crime Rate
per 100,000 2009 Rank State 2009 Crime Rate
per 100,000 2010 Rank State 2010 Crime Rate
per 100,000 1 South Carolina 539.1 1 South Carolina 503.4 1 Alaska 475.8 2 Tennessee 508.9 2 Tennessee 476.0 2 New Mexico 457.1 3 Alaska 489.6 3 New Mexico 464.7 3 South Carolina 452.3 4 Louisiana 480.4 4 Alaska 462.7 4 Tennessee 442.2 5 New Mexico 475.9 5 Louisiana 442.0 5 Nevada 422.9 6 Florida 452.0 6 Nevada 429.8 6 Louisiana 395.6 7 Delaware 444.4 7 Florida 410.6 7 Delaware 377.1 8 Nevada 426.9 8 Delaware 405.0 8 Arkansas 374.3 9 Oklahoma 379.5 9 Arkansas 374.8 9 Florida 369.8 10 Maryland 365.1 10 Oklahoma 362.7 10 Oklahoma 346.7 11 Arkansas 353.1 11 Maryland 351.3 11 Massachusetts 331.8 12 Missouri 344.4 12 Missouri 334.1 12 Maryland 327.5 13 Michigan 321.5 13 Michigan 321.7 13 Missouri 321.7 14 Texas 314.1 14 Massachusetts 316.0 14 Michigan 321.0 15 Massachusetts 310.9 15 Texas 298.7 15 Texas 284.4 16 Kansas 304.0 16 Kansas 293.6 16 Kansas 272.7 17 Illinois 300.9 17 Illinois 283.4 17 Arizona 259.3 18 California 285.0 18 Alabama 278.1 18 California 257.4 19 North Carolina 280.6 19 California 269.7 19 Illinois2 249.7 20 Georgia 270.5 20 North Carolina 248.4 20 Georgia 248.2 21 Arizona 265.9 21 Georgia 248.3 21 West Virginia 247.5 22 Alabama 253.0 22 Arizona 248.1 22 Alabama 244.2 23 Colorado 229.3 23 New York 223.5 23 North Carolina 236.5 24 Pennsylvania 224.8 24 Colorado 222.3 24 New York 226.4 25 New York 216.4 25 West Virginia 217.7 25 Montana 221.2 26 Iowa 210.1 26 Iowa 210.0 26 Colorado 212.4 27 Montana 207.6 27 Pennsylvania 207.4 27 Iowa 211.6 28 West Virginia 201.5 28 Montana 198.5 28 Pennsylvania 205.3 29 Nebraska 194.3 29 Washington 189.7 29 South Dakota 198.9 30 Washington 191.2 30 Indiana 188.4 30 Indiana 186.9 31 Indiana 183.5 31 Nebraska 178.4 31 Washington 185.3 32 Wyoming 180.2 32 Wyoming 177.9 32 Nebraska 183.6 33 Idaho 175.1 33 Idaho 175.4 33 North Dakota 174.8 34 Kentucky 164.8 34 Connecticut 163.7 34 Idaho 172.6 35 Connecticut 163.5 35 Hawaii 163.0 35 Connecticut 162.0 36 New Jersey 163.0 36 New Jersey 162.2 36 New Jersey 157.9 37 Wisconsin 160.4 37 Oregon 157.6 37 Hawaii 156.7 38 Hawaii 158.1 38 Wisconsin 149.1 38 Oregon2 155.6 39 Oregon 154.8 39 North Dakota 148.1 39 Wyoming 151.9 40 Minnesota 146.1 40 Rhode Island 147.7 40 Rhode Island 151.6 41 Mississippi 143.9 41 Mississippi 142.6 41 Wisconsin 145.9 42 Ohio 142.1 42 Minnesota 139.8 42 Mississippi 137.8 43 Rhode Island 136.7 43 Ohio 138.7 43 Minnesota3 136.4 44 Utah 135.8 44 Kentucky 135.4 44 Ohio 136.2 45 Virginia 132.8 45 Utah 132.3 45 Utah 130.6 46 South Dakota 129.6 46 Virginia 123.9 46 Kentucky 120.1 47 North Dakota 118.6 47 South Dakota 114.6 47 Virginia 119.1 48 Vermont 98.3 48 New Hampshire 94.3 48 New Hampshire 100.4 49 New Hampshire 94.7 49 Vermont 92.5 49 Vermont 96.2 50 Maine 61.4 50 Maine 59.0 50 MAINE 59.8
National Average 253.7 245.5 240.3 Standard Deviation 123.1 115.2 106.2
2008 2009 2010Louisiana 480.4 442.0 395.6National Average 253.7 245.5 240.3
480.4 442.0 395.6
253.7 245.5 240.3 200300400500
Rate
per 1
00,00
0
Aggravated Assault
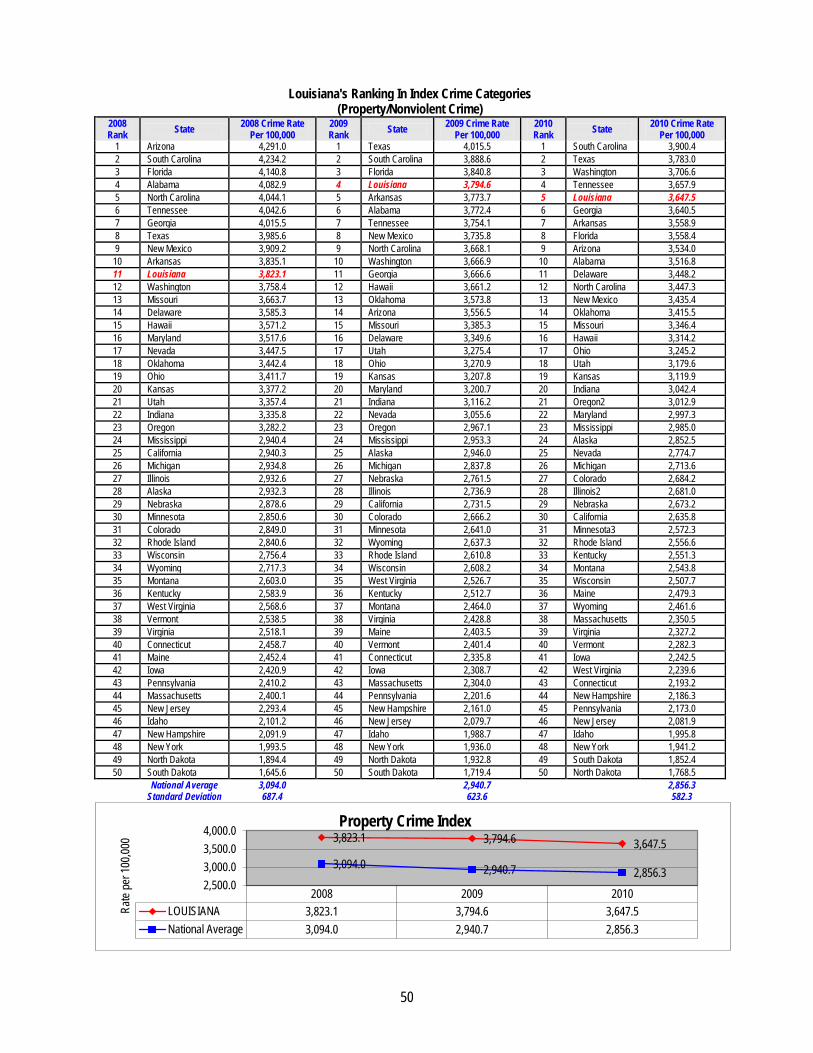
50
Louisiana's Ranking In Index Crime Categories (Property/Nonviolent Crime)
2008 Rank State 2008 Crime Rate
Per 100,000 2009 Rank State 2009 Crime Rate
Per 100,000 2010 Rank State 2010 Crime Rate
Per 100,000 1 Arizona 4,291.0 1 Texas 4,015.5 1 South Carolina 3,900.4 2 South Carolina 4,234.2 2 South Carolina 3,888.6 2 Texas 3,783.0 3 Florida 4,140.8 3 Florida 3,840.8 3 Washington 3,706.6 4 Alabama 4,082.9 4 Louisiana 3,794.6 4 Tennessee 3,657.9 5 North Carolina 4,044.1 5 Arkansas 3,773.7 5 Louisiana 3,647.5 6 Tennessee 4,042.6 6 Alabama 3,772.4 6 Georgia 3,640.5 7 Georgia 4,015.5 7 Tennessee 3,754.1 7 Arkansas 3,558.9 8 Texas 3,985.6 8 New Mexico 3,735.8 8 Florida 3,558.4 9 New Mexico 3,909.2 9 North Carolina 3,668.1 9 Arizona 3,534.0
10 Arkansas 3,835.1 10 Washington 3,666.9 10 Alabama 3,516.8 11 Louisiana 3,823.1 11 Georgia 3,666.6 11 Delaware 3,448.2 12 Washington 3,758.4 12 Hawaii 3,661.2 12 North Carolina 3,447.3 13 Missouri 3,663.7 13 Oklahoma 3,573.8 13 New Mexico 3,435.4 14 Delaware 3,585.3 14 Arizona 3,556.5 14 Oklahoma 3,415.5 15 Hawaii 3,571.2 15 Missouri 3,385.3 15 Missouri 3,346.4 16 Maryland 3,517.6 16 Delaware 3,349.6 16 Hawaii 3,314.2 17 Nevada 3,447.5 17 Utah 3,275.4 17 Ohio 3,245.2 18 Oklahoma 3,442.4 18 Ohio 3,270.9 18 Utah 3,179.6 19 Ohio 3,411.7 19 Kansas 3,207.8 19 Kansas 3,119.9 20 Kansas 3,377.2 20 Maryland 3,200.7 20 Indiana 3,042.4 21 Utah 3,357.4 21 Indiana 3,116.2 21 Oregon2 3,012.9 22 Indiana 3,335.8 22 Nevada 3,055.6 22 Maryland 2,997.3 23 Oregon 3,282.2 23 Oregon 2,967.1 23 Mississippi 2,985.0 24 Mississippi 2,940.4 24 Mississippi 2,953.3 24 Alaska 2,852.5 25 California 2,940.3 25 Alaska 2,946.0 25 Nevada 2,774.7 26 Michigan 2,934.8 26 Michigan 2,837.8 26 Michigan 2,713.6 27 Illinois 2,932.6 27 Nebraska 2,761.5 27 Colorado 2,684.2 28 Alaska 2,932.3 28 Illinois 2,736.9 28 Illinois2 2,681.0 29 Nebraska 2,878.6 29 California 2,731.5 29 Nebraska 2,673.2 30 Minnesota 2,850.6 30 Colorado 2,666.2 30 California 2,635.8 31 Colorado 2,849.0 31 Minnesota 2,641.0 31 Minnesota3 2,572.3 32 Rhode Island 2,840.6 32 Wyoming 2,637.3 32 Rhode Island 2,556.6 33 Wisconsin 2,756.4 33 Rhode Island 2,610.8 33 Kentucky 2,551.3 34 Wyoming 2,717.3 34 Wisconsin 2,608.2 34 Montana 2,543.8 35 Montana 2,603.0 35 West Virginia 2,526.7 35 Wisconsin 2,507.7 36 Kentucky 2,583.9 36 Kentucky 2,512.7 36 Maine 2,479.3 37 West Virginia 2,568.6 37 Montana 2,464.0 37 Wyoming 2,461.6 38 Vermont 2,538.5 38 Virginia 2,428.8 38 Massachusetts 2,350.5 39 Virginia 2,518.1 39 Maine 2,403.5 39 Virginia 2,327.2 40 Connecticut 2,458.7 40 Vermont 2,401.4 40 Vermont 2,282.3 41 Maine 2,452.4 41 Connecticut 2,335.8 41 Iowa 2,242.5 42 Iowa 2,420.9 42 Iowa 2,308.7 42 West Virginia 2,239.6 43 Pennsylvania 2,410.2 43 Massachusetts 2,304.0 43 Connecticut 2,193.2 44 Massachusetts 2,400.1 44 Pennsylvania 2,201.6 44 New Hampshire 2,186.3 45 New Jersey 2,293.4 45 New Hampshire 2,161.0 45 Pennsylvania 2,173.0 46 Idaho 2,101.2 46 New Jersey 2,079.7 46 New Jersey 2,081.9 47 New Hampshire 2,091.9 47 Idaho 1,988.7 47 Idaho 1,995.8 48 New York 1,993.5 48 New York 1,936.0 48 New York 1,941.2 49 North Dakota 1,894.4 49 North Dakota 1,932.8 49 South Dakota 1,852.4 50 South Dakota 1,645.6 50 South Dakota 1,719.4 50 North Dakota 1,768.5
National Average 3,094.0 2,940.7 2,856.3 Standard Deviation 687.4 623.6 582.3
2008 2009 2010LOUISIANA 3,823.1 3,794.6 3,647.5National Average 3,094.0 2,940.7 2,856.3
3,823.1 3,794.6 3,647.5 3,094.0 2,940.7 2,856.3
2,500.03,000.03,500.04,000.0
Rate
per 1
00,00
0
Property Crime Index
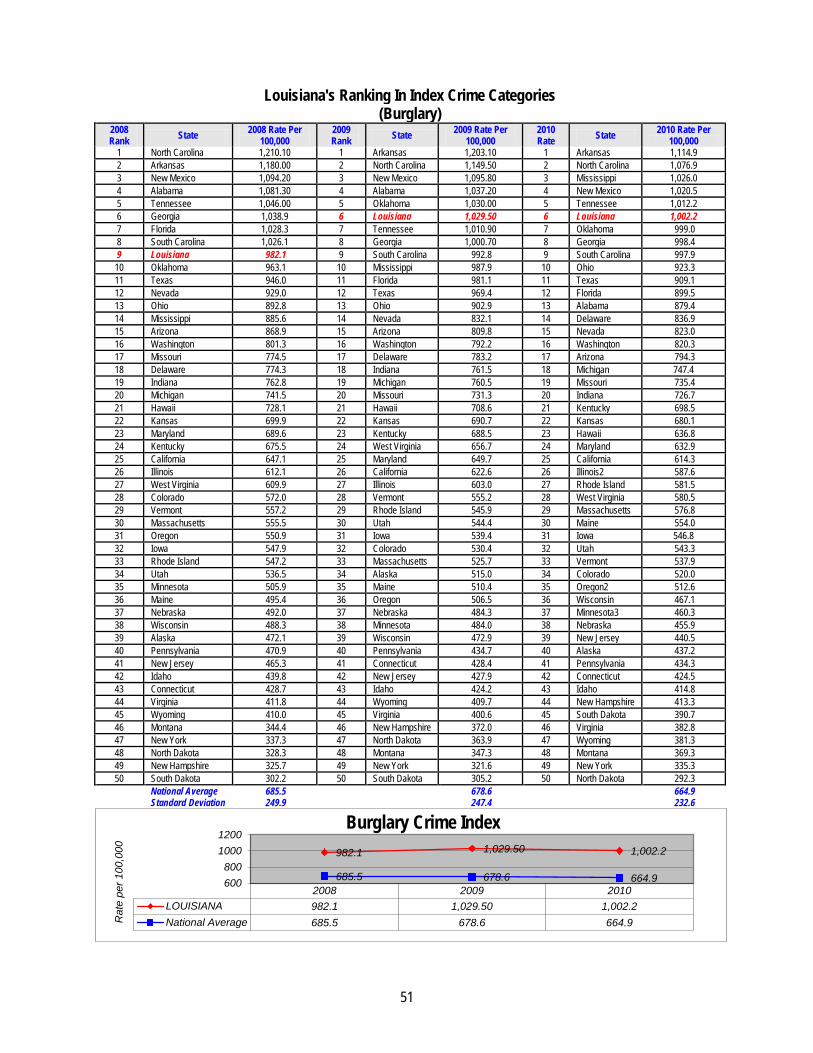
51
Louisiana's Ranking In Index Crime Categories (Burglary)
2008 Rank State 2008 Rate Per
100,000 2009 Rank State 2009 Rate Per
100,000 2010 Rate State 2010 Rate Per
100,000 1 North Carolina 1,210.10 1 Arkansas 1,203.10 1 Arkansas 1,114.9 2 Arkansas 1,180.00 2 North Carolina 1,149.50 2 North Carolina 1,076.9 3 New Mexico 1,094.20 3 New Mexico 1,095.80 3 Mississippi 1,026.0 4 Alabama 1,081.30 4 Alabama 1,037.20 4 New Mexico 1,020.5 5 Tennessee 1,046.00 5 Oklahoma 1,030.00 5 Tennessee 1,012.2 6 Georgia 1,038.9 6 Louisiana 1,029.50 6 Louisiana 1,002.2 7 Florida 1,028.3 7 Tennessee 1,010.90 7 Oklahoma 999.0 8 South Carolina 1,026.1 8 Georgia 1,000.70 8 Georgia 998.4 9 Louisiana 982.1 9 South Carolina 992.8 9 South Carolina 997.9 10 Oklahoma 963.1 10 Mississippi 987.9 10 Ohio 923.3 11 Texas 946.0 11 Florida 981.1 11 Texas 909.1 12 Nevada 929.0 12 Texas 969.4 12 Florida 899.5 13 Ohio 892.8 13 Ohio 902.9 13 Alabama 879.4 14 Mississippi 885.6 14 Nevada 832.1 14 Delaware 836.9 15 Arizona 868.9 15 Arizona 809.8 15 Nevada 823.0 16 Washington 801.3 16 Washington 792.2 16 Washington 820.3 17 Missouri 774.5 17 Delaware 783.2 17 Arizona 794.3 18 Delaware 774.3 18 Indiana 761.5 18 Michigan 747.4 19 Indiana 762.8 19 Michigan 760.5 19 Missouri 735.4 20 Michigan 741.5 20 Missouri 731.3 20 Indiana 726.7 21 Hawaii 728.1 21 Hawaii 708.6 21 Kentucky 698.5 22 Kansas 699.9 22 Kansas 690.7 22 Kansas 680.1 23 Maryland 689.6 23 Kentucky 688.5 23 Hawaii 636.8 24 Kentucky 675.5 24 West Virginia 656.7 24 Maryland 632.9 25 California 647.1 25 Maryland 649.7 25 California 614.3 26 Illinois 612.1 26 California 622.6 26 Illinois2 587.6 27 West Virginia 609.9 27 Illinois 603.0 27 Rhode Island 581.5 28 Colorado 572.0 28 Vermont 555.2 28 West Virginia 580.5 29 Vermont 557.2 29 Rhode Island 545.9 29 Massachusetts 576.8 30 Massachusetts 555.5 30 Utah 544.4 30 Maine 554.0 31 Oregon 550.9 31 Iowa 539.4 31 Iowa 546.8 32 Iowa 547.9 32 Colorado 530.4 32 Utah 543.3 33 Rhode Island 547.2 33 Massachusetts 525.7 33 Vermont 537.9 34 Utah 536.5 34 Alaska 515.0 34 Colorado 520.0 35 Minnesota 505.9 35 Maine 510.4 35 Oregon2 512.6 36 Maine 495.4 36 Oregon 506.5 36 Wisconsin 467.1 37 Nebraska 492.0 37 Nebraska 484.3 37 Minnesota3 460.3 38 Wisconsin 488.3 38 Minnesota 484.0 38 Nebraska 455.9 39 Alaska 472.1 39 Wisconsin 472.9 39 New Jersey 440.5 40 Pennsylvania 470.9 40 Pennsylvania 434.7 40 Alaska 437.2 41 New Jersey 465.3 41 Connecticut 428.4 41 Pennsylvania 434.3 42 Idaho 439.8 42 New Jersey 427.9 42 Connecticut 424.5 43 Connecticut 428.7 43 Idaho 424.2 43 Idaho 414.8 44 Virginia 411.8 44 Wyoming 409.7 44 New Hampshire 413.3 45 Wyoming 410.0 45 Virginia 400.6 45 South Dakota 390.7 46 Montana 344.4 46 New Hampshire 372.0 46 Virginia 382.8 47 New York 337.3 47 North Dakota 363.9 47 Wyoming 381.3 48 North Dakota 328.3 48 Montana 347.3 48 Montana 369.3 49 New Hampshire 325.7 49 New York 321.6 49 New York 335.3 50 South Dakota 302.2 50 South Dakota 305.2 50 North Dakota 292.3
National Average 685.5 678.6 664.9 Standard Deviation 249.9 247.4 232.6
2008 2009 2010LOUISIANA 982.1 1,029.50 1,002.2National Average 685.5 678.6 664.9
982.1 1,029.50 1,002.2
685.5 678.6 664.9 600800
10001200
Rat
e pe
r 100
,000
Burglary Crime Index

52
Louisiana's Ranking In Index Crime Categories (Larceny-Theft)
2008 Rank State 2008 Crime Rate
Per 100,000 2009 Rank State 2009 Crime Rate
Per 100,000 2009 Rank State 2010 Rate Per
100,000 1 Arizona 2,849.5 1 Texas 2,737.3 1 South Carolina 2,617.2 2 South Carolina 2,814.1 2 South Carolina 2,598.4 2 Texas 2,603.3 3 Florida 2,766.0 3 Florida 2,588.6 3 Washington 2,503.7 4 Alabama 2,713.0 4 Hawaii 2,580.0 4 Florida 2,438.4 5 Texas 2,688.8 5 Washington 2,519.4 5 Louisiana 2,427.1 6 Tennessee 2,687.3 6 Tennessee 2,505.4 6 Utah 2,421.0 7 Georgia 2,567.5 7 Louisiana 2,504.3 7 Alabama 2,415.6 8 Utah 2,557.9 8 Alabama 2,499.9 8 Tennessee 2,411.9 9 North Carolina 2,544.0 9 Utah 2,483.0 9 Arizona 2,403.2 10 Missouri 2,537.9 10 Missouri 2,362.1 10 Delaware 2,396.5 11 Louisiana 2,529.4 11 Arkansas 2,359.3 11 Missouri 2,343.0 12 Washington 2,524.6 12 Arizona 2,352.8 12 Georgia 2,329.3 13 Delaware 2,520.0 13 Delaware 2,351.0 13 Hawaii 2,302.4 14 Hawaii 2,444.7 14 Georgia 2,328.7 14 Oregon2 2,267.7 15 Oregon 2,432.3 15 New Mexico 2,317.8 15 Arkansas 2,253.8 16 Arkansas 2,427.1 16 Kansas 2,305.9 16 Kansas 2,229.2 17 Kansas 2,413.4 17 North Carolina 2,305.2 17 Alaska 2,187.3 18 New Mexico 2,411.6 18 Oklahoma 2,261.7 18 North Carolina 2,178.4 19 Maryland 2,378.3 19 Maryland 2,206.7 19 New Mexico 2,160.1 20 Indiana 2,299.2 20 Oregon 2,202.6 20 Oklahoma 2,144.8 21 Ohio 2,270.5 21 Alaska 2,189.2 21 Ohio 2,138.8 22 Alaska 2,221.5 22 Ohio 2,169.8 22 Indiana 2,113.4 23 Oklahoma 2,180.5 23 Indiana 2,138.7 23 Maryland 2,051.7 24 Wyoming 2,173.4 24 Wyoming 2,085.9 24 Montana 2,020.3 25 Nebraska 2,151.8 25 Nebraska 2,083.5 25 Nebraska 2,019.4 26 Minnesota 2,151.6 26 Minnesota 1,995.3 26 Wyoming 1,975.4 27 Montana 2,095.9 27 Wisconsin 1,977.4 27 Minnesota3 1,950.0 28 Illinois 2,068.1 28 Montana 1,967.4 28 Colorado 1,940.5 29 Wisconsin 2,063.4 29 Illinois 1,927.3 29 Wisconsin 1,897.5 30 Colorado 2,003.3 30 Colorado 1,887.9 30 Illinois2 1,868.9 31 Rhode Island 1,988.9 31 Virginia 1,883.4 31 Maine 1,850.8 32 Virginia 1,935.6 32 Rhode Island 1,837.7 32 Virginia 1,812.5 33 Nevada 1,906.8 33 Maine 1,815.7 33 Mississippi 1,778.4 34 Vermont 1,887.1 34 Michigan 1,782.6 34 Rhode Island 1,747.2 35 Maine 1,867.7 35 Mississippi 1,782.5 35 Kentucky 1,709.7 36 Mississippi 1,838.7 36 Vermont 1,774.2 36 New Hampshire 1,699.5 37 Michigan 1,831.1 37 Nevada 1,755.2 37 Michigan 1,689.5 38 West Virginia 1,782.2 38 West Virginia 1,719.4 38 Vermont 1,673.9 39 Connecticut 1,774.0 39 New Hampshire 1,704.1 39 California 1,612.1 40 California 1,769.4 40 Connecticut 1,694.9 40 Pennsylvania 1,607.4 41 Pennsylvania 1,758.8 41 Kentucky 1,683.3 41 Massachusetts 1,598.8 42 Iowa 1,728.8 42 California 1,665.1 42 Connecticut 1,581.0 43 Kentucky 1,728.8 43 Iowa 1,640.0 43 Nevada 1,574.5 44 New Hampshire 1,660.8 44 Pennsylvania 1,625.5 44 Iowa 1,571.8 45 Massachusetts 1,648.6 45 Massachusetts 1,600.3 45 West Virginia 1,531.7 46 New Jersey 1,595.7 46 New York 1,502.5 46 New York 1,500.4 47 Idaho 1,552.0 47 New Jersey 1,473.7 47 Idaho 1,496.7 48 New York 1,527.3 48 Idaho 1,471.2 48 New Jersey 1,464.5 49 North Dakota 1,428.6 49 North Dakota 1,437.1 49 South Dakota 1,364.1 50 South Dakota 1,244.0 50 South Dakota 1,314.2 50 North Dakota 1,348.5
National Average 2,138.8 2,039.1 1,984.5 Standard Deviation 401.9 366.5 354.4
2008 2009 2010LOUISIANA 2,529.4 2,504.3 2,427.1National Average 2,138.8 2,039.1 1,984.5
2,529.4 2,504.3 2,427.1 2,138.8 2,039.1 1,984.5
1,750.02,250.02,750.0
Rat
e pe
r 100
,000
Larceny Theft Index

53
Louisiana's Ranking In Index Crime Categories (Motor Vehicle Theft)
2008 Rank State 2008 Rate per
100,000 2009 Rank State 2009 Rate per
100,000 2010 Rank State 2010 Rate per
100,000 1 Nevada 611.6 1 Nevada 468.4 1 California 409.4 2 Arizona 572.6 2 California 443.8 2 Washington 382.6 3 California 523.8 3 Arizona 394 3 Nevada 377.1 4 Maryland 449.7 4 Hawaii 372.1 4 Hawaii 374.9 5 Washington 432.6 5 Washington 355.3 5 Arizona 336.5 6 Georgia 409.1 6 Maryland 344.2 6 Georgia 312.8 7 New Mexico 403.4 7 Georgia 337.2 7 Maryland 312.6 8 Hawaii 398.5 8 New Mexico 322.2 8 South Carolina 285.3 9 South Carolina 394 9 Texas 308.9 9 Michigan 276.8 10 Michigan 362.3 10 South Carolina 297.4 10 Oklahoma 271.6 11 Missouri 351.3 11 Michigan 294.7 11 Texas 270.5 12 Texas 350.8 12 Missouri 291.9 12 Missouri 268.0 13 Florida 346.5 13 Oklahoma 282.2 13 New Mexico 254.8 14 Louisiana 311.6 14 Florida 271.1 14 Tennessee 233.8 15 Tennessee 309.3 15 Louisiana 260.8 15 Oregon2 232.6 16 Rhode Island 304.5 16 Oregon 258 16 Alaska 228.0 17 Oregon 299 17 Colorado 247.9 17 Rhode Island 227.9 18 Oklahoma 298.7 18 Utah 247.9 18 Illinois2 224.4 19 Delaware 291 19 Alaska 241.8 19 Colorado 223.6 20 North Carolina 290 20 Tennessee 237.8 20 Alabama 221.8 21 Alabama 288.7 21 Alabama 235.3 21 Florida 220.5 22 Colorado 273.7 22 Rhode Island 227.2 22 Louisiana 218.2 23 Indiana 273.7 23 Indiana 216.1 23 Utah 215.2 24 Kansas 263.9 24 Delaware 215.5 24 Delaware 214.8 25 Utah 262.9 25 North Carolina 213.5 25 Kansas 210.6 26 Connecticut 256 26 Connecticut 212.5 26 Indiana 202.3 27 Illinois 252.5 27 Arkansas 211.2 27 Nebraska 197.9 28 Ohio 248.4 28 Kansas 211.2 28 North Carolina 192.0 29 Alaska 238.7 29 Illinois 206.6 29 Arkansas 190.1 30 Nebraska 234.8 30 Ohio 198.3 30 Connecticut 187.7 31 New Jersey 232.4 31 Nebraska 193.8 31 Ohio 183.1 32 Arkansas 228 32 Mississippi 183 32 Mississippi 180.6 33 Mississippi 216.2 33 New Jersey 178.1 33 New Jersey 176.9 34 Wisconsin 204.7 34 Massachusetts 178 34 Massachusetts 174.9 35 Massachusetts 196 35 Minnesota 161.8 35 Minnesota3 161.9 36 Minnesota 193.1 36 Wisconsin 157.8 36 Montana 154.2 37 Pennsylvania 180.5 37 West Virginia 150.6 37 Wisconsin 143.1 38 Kentucky 179.6 38 Montana 149.3 38 Kentucky 143.1 39 West Virginia 176.6 39 Virginia 144.9 39 Virginia 131.8 40 Virginia 170.7 40 Wyoming 141.7 40 Pennsylvania 131.2 41 Montana 162.6 41 Pennsylvania 141.4 41 North Dakota 127.7 42 Iowa 144.3 42 Kentucky 140.9 42 West Virginia 127.4 43 North Dakota 137.5 43 North Dakota 131.7 43 Iowa 124.0 44 Wyoming 133.9 44 Iowa 129.3 44 New York 105.4 45 New York 128.9 45 New York 111.9 45 Wyoming 104.9 46 Idaho 109.5 46 South Dakota 100.1 46 South Dakota 97.6 47 New Hampshire 105.4 47 Idaho 93.3 47 Idaho 84.3 48 South Dakota 99.5 48 New Hampshire 84.9 48 Maine 74.5 49 Vermont 94.2 49 Maine 77.4 49 New Hampshire 73.5 50 Maine 89.3 50 Vermont 72.1 50 Vermont 70.5
National Average 269.7 222.9 206.9 Standard Deviation 120.3 92.3 83.3
2008 2009 2010LOUISIANA 311.6 260.8 218.2National Average 269.7 222.9 206.9
311.6 260.8
218.2 269.7
222.9 206.9 150
200250300350
Rate
per 1
00,00
0
Motor Vehicle Theft Index
54
LOUISIANA’S INDEX CRIME TREND OVER TEN YEARS
The following tables and charts show trends in index crimes in Louisiana from the year 2001 through 2010. The tables and charts include the number of index crimes and the crime rates followed by graphs showing trends in violent and non-violent crime.

55
LOUISIANA INDEX CRIME TREND OVER 10 YEARS
2001-2010 YEAR POPULATION OFFENSES CRIME RATE
2001 4,465,430 238,371 5,338.1
2002 4,482,646 228,528 5,098.1
2003 4,496,334 224,631 4,995.9
2004 4,515,770 227,997 5,048.9
2005 4,523,628 193,500 4,277.5
2006 4,287,768 201,158 4,691.4
2007 4,293,204 206,308 4,805.5
2008 4,410,796 197,574 4,479.3
2009 4,492,076 198,305 4,414.6
2010* 4,553,372 166,199 3,666.1 *Note: The 2010 data includes arson data.

56
Crime Trends Over 10 Years
0
50,000
100,000
150,000
200,000
250,000
300,000
2001 2002 2003 2004 2005 2006 2007 2008 2009 2010
Offe
nses
Years
Offense Trend of Index Crimes Over 10 Years
Year
0.0
1,000.0
2,000.0
3,000.0
4,000.0
5,000.0
6,000.0
2001 2002 2003 2004 2005 2006 2007 2008 2009 2010
Crim
e R
ate
Years
Crime Rate Trend Over 10 Years
Year

57
LOUISIANA VIOLENT CRIME BASED ON NUMBER OF OFFENSES
2001 - 2010
Year Murder/Non-
Negligent Manslaughter
Forcible Rape Robbery Aggravated
Assault Total Violent
Crime Offenses
2001 501 1,403 7,864 20,910 30,678 2002 593 1,529 7,123 20,445 29,690 2003 586 1,849 7,069 19,558 29,062 2004 574 1,616 6,564 20,090 28,844 2005 450 1,421 5,337 19,681 26,889 2006 530 1,562 5,729 22,098 29,919 2007 608 1,393 6,083 23,233 31,317 2008 527 1,232 5,994 21,191 28,944 2009 530 1,359 6,105 19,855 27,849 2010 427 1,125 4,169 15,403 21,124
0
5,000
10,000
15,000
20,000
25,000
30,000
35,000
2001 2002 2003 2004 2005 2006 2007 2008 2009 2010
Numb
er of
Offe
sne
Year
Louisiana Violent Crime Based on the Number of Offenses
Murder/Non-Negligent Manslaughter Forcible RapeRobbery Aggravated AssaultTotal Violent Crime Offenses
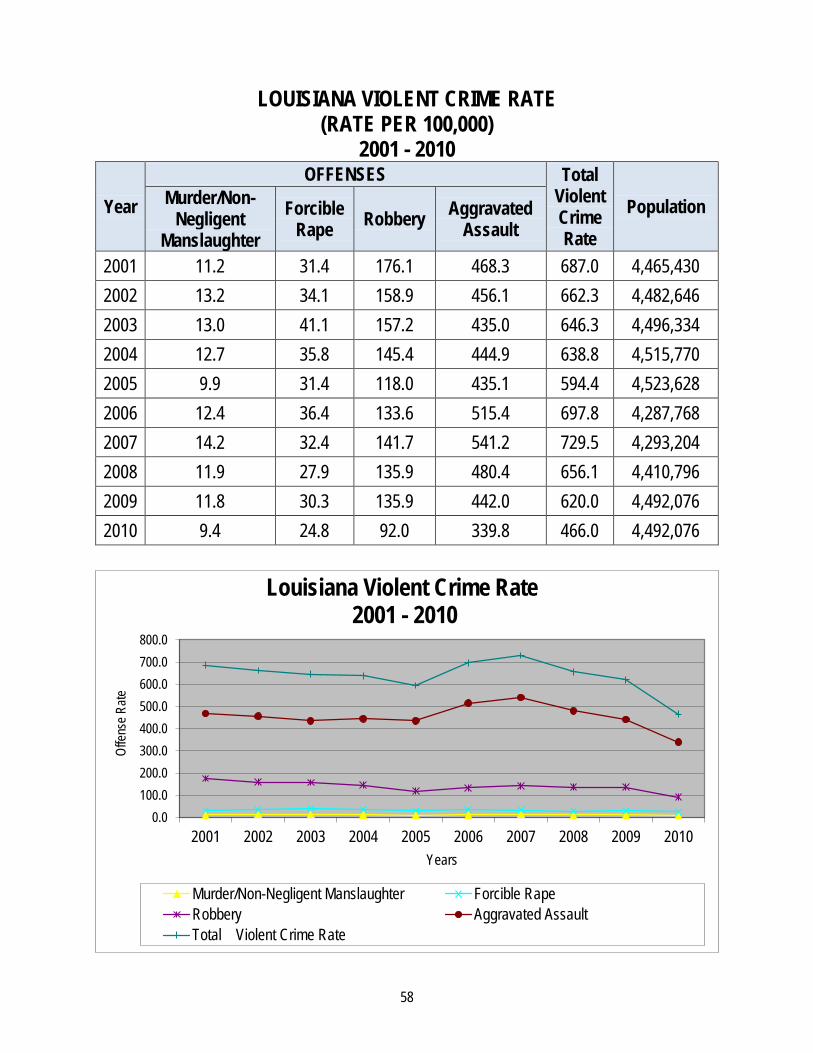
58
LOUISIANA VIOLENT CRIME RATE (RATE PER 100,000)
2001 - 2010
Year OFFENSES Total
Violent Crime Rate
Population Murder/Non-Negligent
Manslaughter Forcible
Rape Robbery Aggravated Assault
2001 11.2 31.4 176.1 468.3 687.0 4,465,430 2002 13.2 34.1 158.9 456.1 662.3 4,482,646 2003 13.0 41.1 157.2 435.0 646.3 4,496,334 2004 12.7 35.8 145.4 444.9 638.8 4,515,770 2005 9.9 31.4 118.0 435.1 594.4 4,523,628 2006 12.4 36.4 133.6 515.4 697.8 4,287,768 2007 14.2 32.4 141.7 541.2 729.5 4,293,204 2008 11.9 27.9 135.9 480.4 656.1 4,410,796 2009 11.8 30.3 135.9 442.0 620.0 4,492,076 2010 9.4 24.8 92.0 339.8 466.0 4,492,076
0.0100.0200.0300.0400.0500.0600.0700.0800.0
2001 2002 2003 2004 2005 2006 2007 2008 2009 2010
Offen
se R
ate
Years
Louisiana Violent Crime Rate 2001 - 2010
Murder/Non-Negligent Manslaughter Forcible RapeRobbery Aggravated AssaultTotal Violent Crime Rate
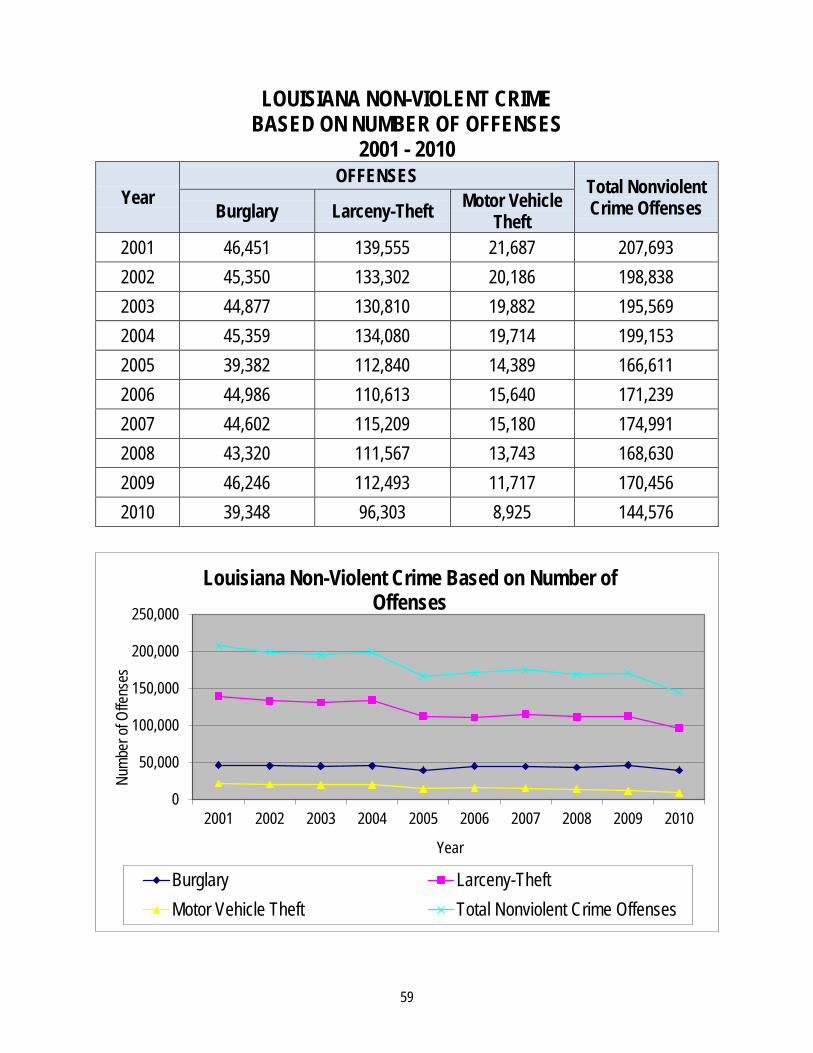
59
LOUISIANA NON-VIOLENT CRIME BASED ON NUMBER OF OFFENSES
2001 - 2010
Year OFFENSES Total Nonviolent
Crime Offenses Burglary Larceny-Theft Motor Vehicle Theft
2001 46,451 139,555 21,687 207,693 2002 45,350 133,302 20,186 198,838 2003 44,877 130,810 19,882 195,569 2004 45,359 134,080 19,714 199,153 2005 39,382 112,840 14,389 166,611 2006 44,986 110,613 15,640 171,239 2007 44,602 115,209 15,180 174,991 2008 43,320 111,567 13,743 168,630 2009 46,246 112,493 11,717 170,456 2010 39,348 96,303 8,925 144,576
0
50,000
100,000
150,000
200,000
250,000
2001 2002 2003 2004 2005 2006 2007 2008 2009 2010
Numb
er of
Offe
nses
Year
Louisiana Non-Violent Crime Based on Number of Offenses
Burglary Larceny-TheftMotor Vehicle Theft Total Nonviolent Crime Offenses
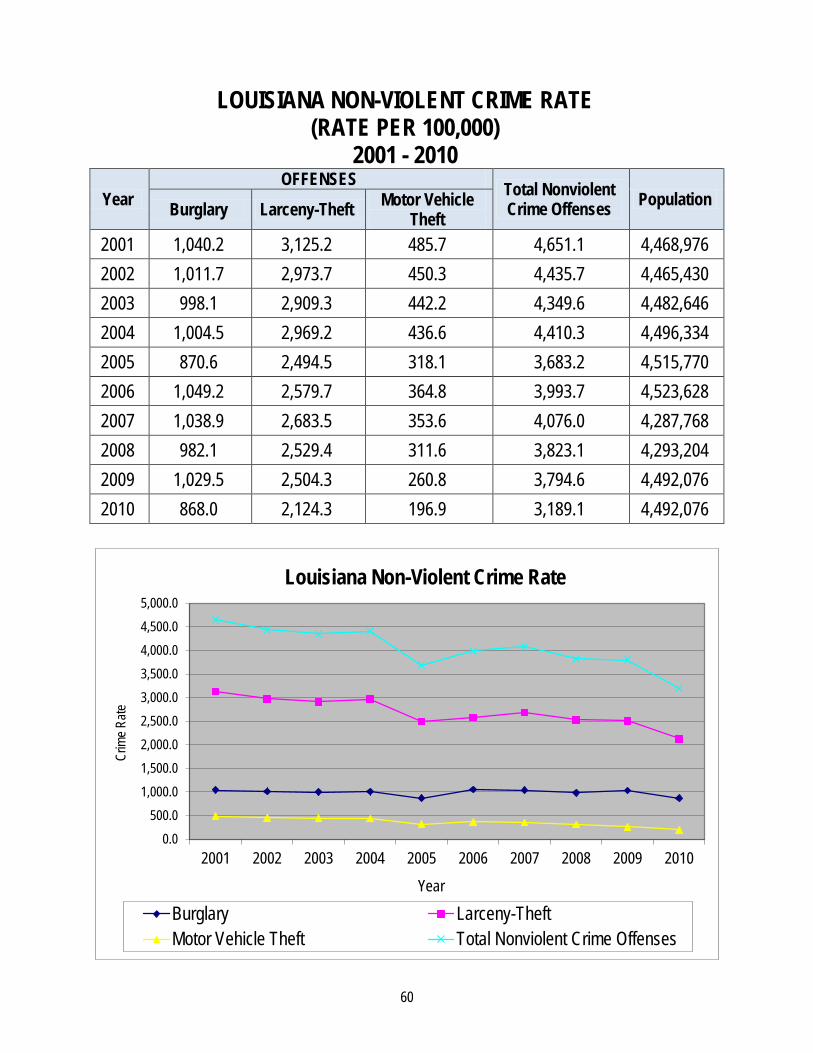
60
LOUISIANA NON-VIOLENT CRIME RATE (RATE PER 100,000)
2001 - 2010 Year
OFFENSES Total Nonviolent Crime Offenses Population Burglary Larceny-Theft Motor Vehicle
Theft 2001 1,040.2 3,125.2 485.7 4,651.1 4,468,976 2002 1,011.7 2,973.7 450.3 4,435.7 4,465,430 2003 998.1 2,909.3 442.2 4,349.6 4,482,646 2004 1,004.5 2,969.2 436.6 4,410.3 4,496,334 2005 870.6 2,494.5 318.1 3,683.2 4,515,770 2006 1,049.2 2,579.7 364.8 3,993.7 4,523,628 2007 1,038.9 2,683.5 353.6 4,076.0 4,287,768 2008 982.1 2,529.4 311.6 3,823.1 4,293,204 2009 1,029.5 2,504.3 260.8 3,794.6 4,492,076 2010 868.0 2,124.3 196.9 3,189.1 4,492,076
0.0500.0
1,000.01,500.02,000.02,500.03,000.03,500.04,000.04,500.05,000.0
2001 2002 2003 2004 2005 2006 2007 2008 2009 2010
Crim
e Rate
Year
Louisiana Non-Violent Crime Rate
Burglary Larceny-TheftMotor Vehicle Theft Total Nonviolent Crime Offenses

61
LOUISIANA ARREST DATA FOR 2009 and 2010 The tables and charts that follow show arrests in Louisiana for 2009 and 2010. Figures are given for adult and juvenile arrests as well as total arrests. Charts are also included to show arrests for violent and non-violent crime.
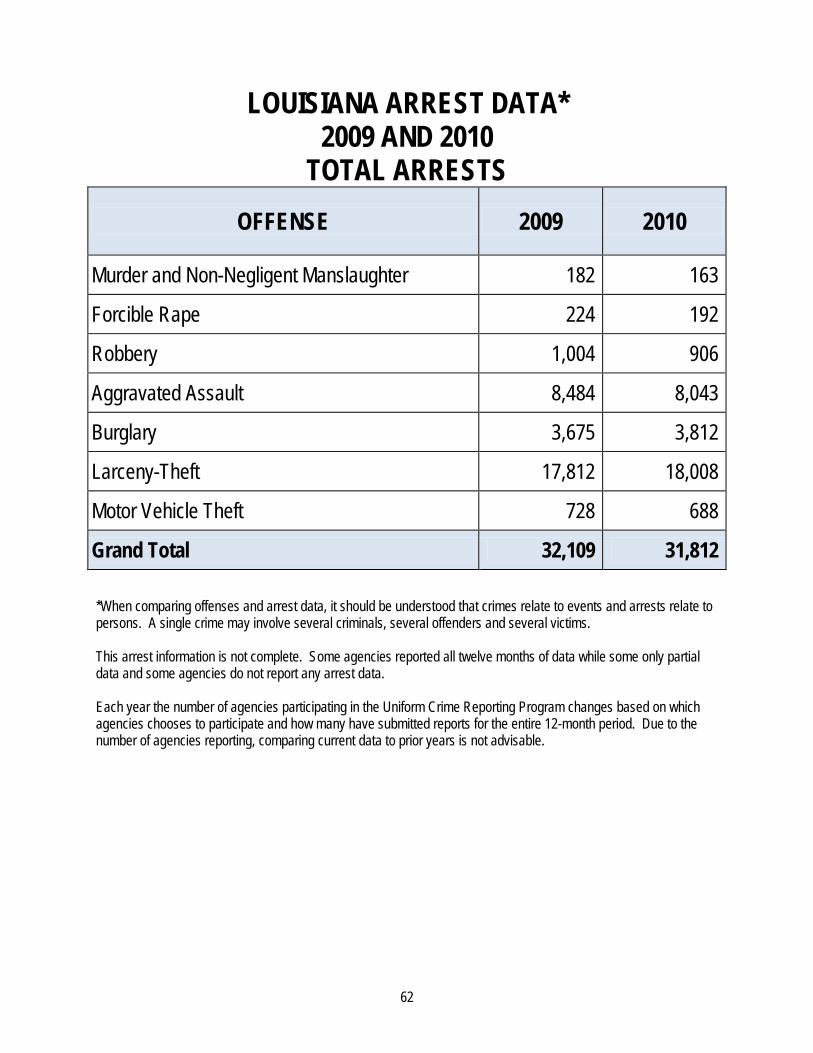
62
LOUISIANA ARREST DATA* 2009 AND 2010
TOTAL ARRESTS OFFENSE 2009 2010
Murder and Non-Negligent Manslaughter 182 163
Forcible Rape 224 192
Robbery 1,004 906
Aggravated Assault 8,484 8,043
Burglary 3,675 3,812
Larceny-Theft 17,812 18,008
Motor Vehicle Theft 728 688
Grand Total 32,109 31,812 *When comparing offenses and arrest data, it should be understood that crimes relate to events and arrests relate to persons. A single crime may involve several criminals, several offenders and several victims. This arrest information is not complete. Some agencies reported all twelve months of data while some only partial data and some agencies do not report any arrest data. Each year the number of agencies participating in the Uniform Crime Reporting Program changes based on which agencies chooses to participate and how many have submitted reports for the entire 12-month period. Due to the number of agencies reporting, comparing current data to prior years is not advisable.
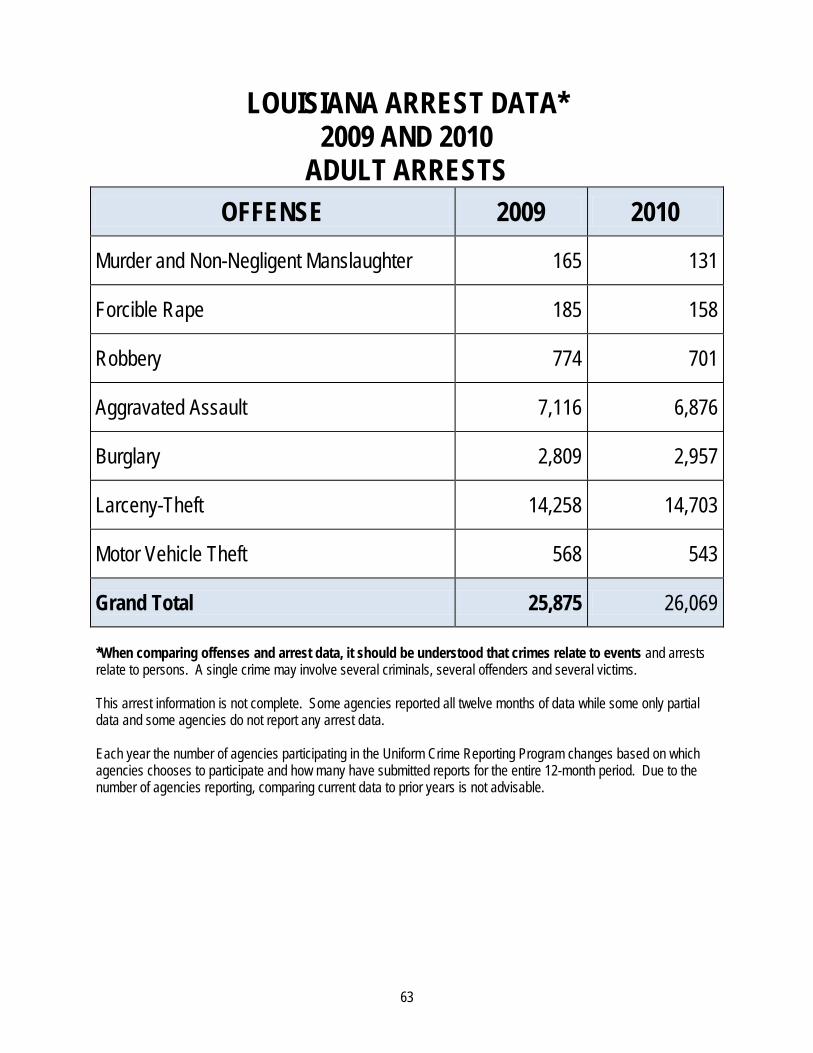
63
LOUISIANA ARREST DATA* 2009 AND 2010
ADULT ARRESTS OFFENSE 2009 2010
Murder and Non-Negligent Manslaughter 165 131
Forcible Rape 185 158
Robbery 774 701
Aggravated Assault 7,116 6,876
Burglary 2,809 2,957
Larceny-Theft 14,258 14,703
Motor Vehicle Theft 568 543
Grand Total 25,875 26,069 *When comparing offenses and arrest data, it should be understood that crimes relate to events and arrests relate to persons. A single crime may involve several criminals, several offenders and several victims. This arrest information is not complete. Some agencies reported all twelve months of data while some only partial data and some agencies do not report any arrest data. Each year the number of agencies participating in the Uniform Crime Reporting Program changes based on which agencies chooses to participate and how many have submitted reports for the entire 12-month period. Due to the number of agencies reporting, comparing current data to prior years is not advisable.

64
LOUISIANA ARREST DATA* 2009 and 2010
JUVENILE ARRESTS OFFENSE 2009 2010
Murder and Non-Negligent Manslaughter 17 32 Forcible Rape 39 34 Robbery 230 205 Aggravated Assault 1,368 1,167 Burglary 866 855 Larceny-Theft 3,554 3,305 Motor Vehicle Theft 160 145 Grand Total 6,234 5,743 *When comparing offenses and arrest data, it should be understood that crimes relate to events and arrests relate to persons. A single crime may involve several criminals, several offenders and several victims. This arrest information is not complete. Some agencies reported all twelve months of data while some only partial data and some agencies do not report any arrest data. Each year the number of agencies participating in the Uniform Crime Reporting Program changes based on which agencies chooses to participate and how many have submitted reports for the entire 12-month period. Due to the number of agencies reporting, comparing current data to prior years is not advisable.

65
ARREST DATA FOR 2009
0100020003000400050006000700080009000
Murder ForcibleRape
Robbery AggravatedAssault
182 224 1,004
8,484
165 185 774
7,116
17 39 230 1,368
Num
ber o
f Arr
ests
Type of Offense
Louisiana Arrest Data Violent Crimes 2009
TOTAL ARRESTS ADULT ARRESTS JUVENILE ARRESTS
02,0004,0006,0008,000
10,00012,00014,00016,00018,000
Burglary Larceny-Theft Motor VehicleTheft
3,675
17,812
728
2,809
14,258
568 866
3,554
160 Num
ber o
f Arr
ests
Type of Offense
Louisiana Arrest Data Non-Violent Crimes 2009
TOTAL ARRESTS ADULT ARRESTS JUVENILE ARRESTS

66
ARREST DATA FOR 2010
0100020003000400050006000700080009000
Murder Forcible Rape Robbery AggravatedAssault
163 192 906
8,043
131 158 701
6,876
32 34 205 1,167
Num
ber o
f Arre
sts
Type of Offense
Louisiana Arrest Data Violent Crimes 2010
TOTAL ARRESTS ADULT ARRESTS JUVENILE ARRESTS
0
5,000
10,000
15,000
20,000
Burglary Larceny-Theft Motor VehicleTheft
3,812
18,008
688 2,957
14,703
543 855 3,305
145 Num
ber o
f Arr
ests
Type of Offense
Louisiana Arrest Data Non-Violent Crimes 2010
TOTAL ARRESTS ADULT ARRESTS JUVENILE ARRESTS
67
TYPE OF WEAPON USED DURING MURDER, ROBBERY AND AGGRAVATED ASSAULT
2009 and 2010
The tables and charts that follow show weapons used for the offenses of murder, robbery and aggravated assault. The homicide data in some cases does not include weapons used for all homicides reported. The data for robberies and aggravated assaults includes only the offenses for which breakdowns were received for twelve months.
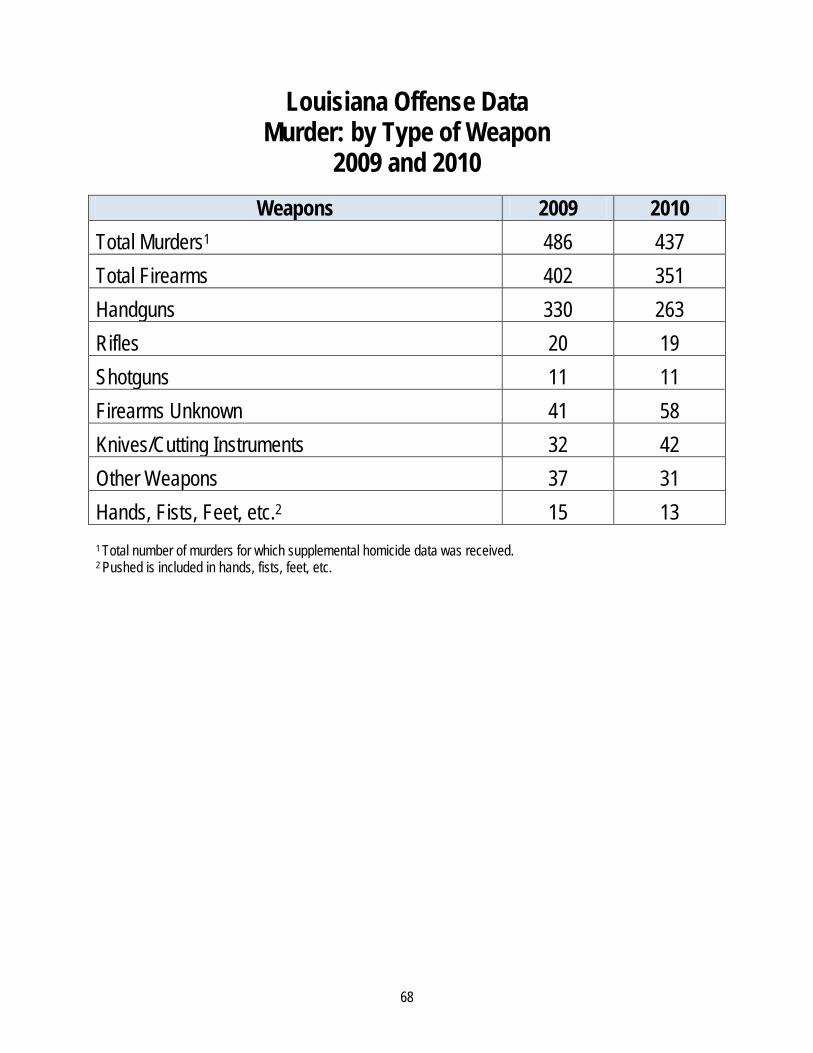
68
Louisiana Offense Data Murder: by Type of Weapon
2009 and 2010 Weapons 2009 2010 Total Murders1 486 437 Total Firearms 402 351 Handguns 330 263 Rifles 20 19 Shotguns 11 11 Firearms Unknown 41 58 Knives/Cutting Instruments 32 42 Other Weapons 37 31 Hands, Fists, Feet, etc.2 15 13 1 Total number of murders for which supplemental homicide data was received. 2 Pushed is included in hands, fists, feet, etc.
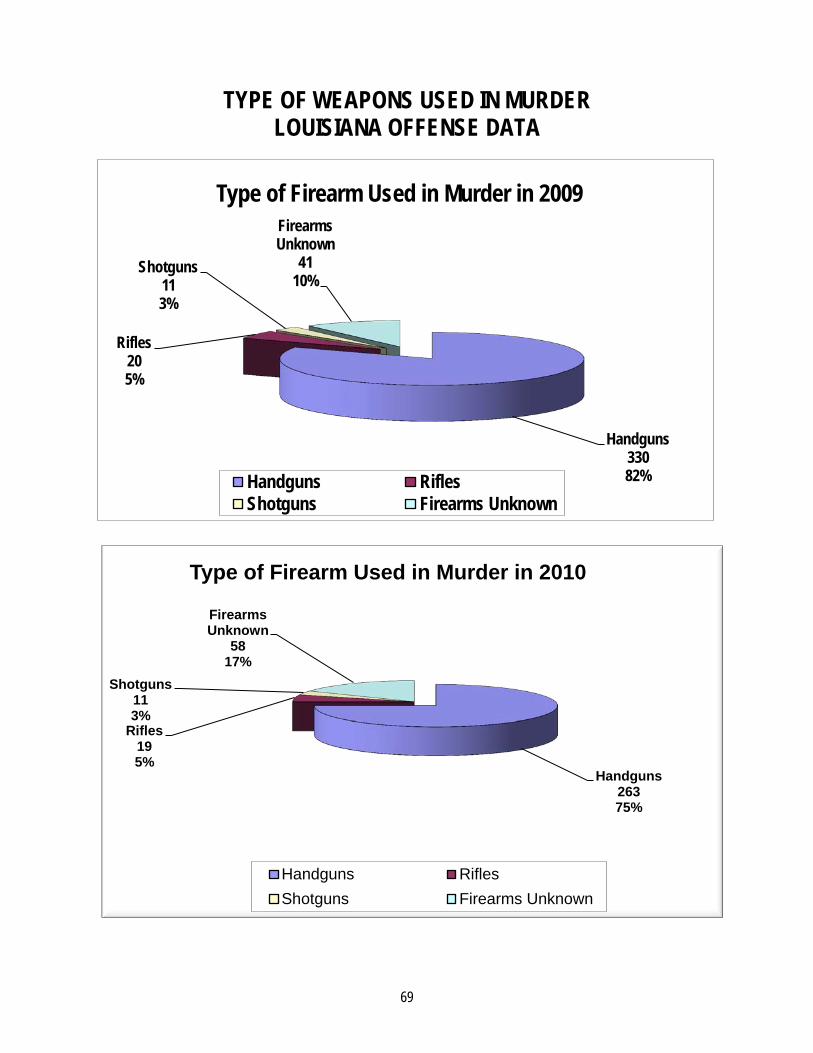
69
TYPE OF WEAPONS USED IN MURDER LOUISIANA OFFENSE DATA
Handguns 330 82%
Rifles 20 5%
Shotguns 11 3%
Firearms Unknown
41 10%
Type of Firearm Used in Murder in 2009
Handguns RiflesShotguns Firearms Unknown
Handguns 263 75%
Rifles 19 5%
Shotguns 11 3%
Firearms Unknown
58 17%
Type of Firearm Used in Murder in 2010
Handguns RiflesShotguns Firearms Unknown
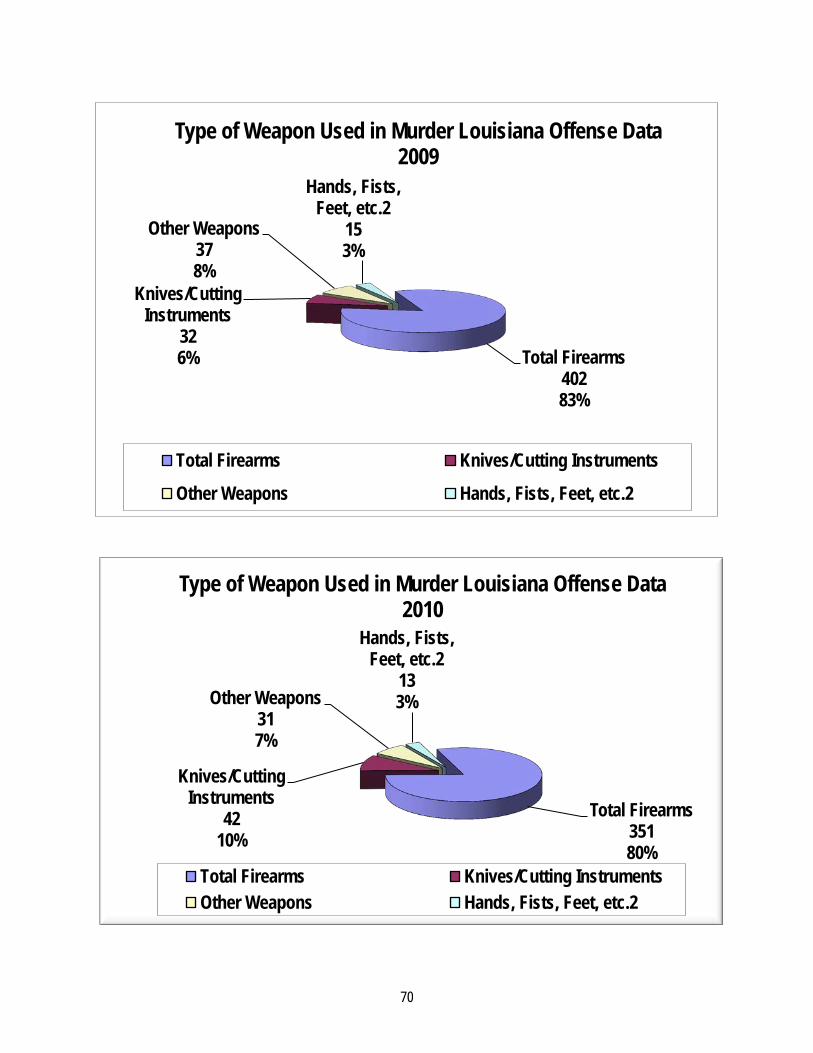
70
Total Firearms 402 83%
Knives/Cutting Instruments
32 6%
Other Weapons 37 8%
Hands, Fists, Feet, etc.2
15 3%
Type of Weapon Used in Murder Louisiana Offense Data 2009
Total Firearms Knives/Cutting Instruments
Other Weapons Hands, Fists, Feet, etc.2
Total Firearms 351 80%
Knives/Cutting Instruments
42 10%
Other Weapons 31 7%
Hands, Fists, Feet, etc.2
13 3%
Type of Weapon Used in Murder Louisiana Offense Data 2010
Total Firearms Knives/Cutting InstrumentsOther Weapons Hands, Fists, Feet, etc.2
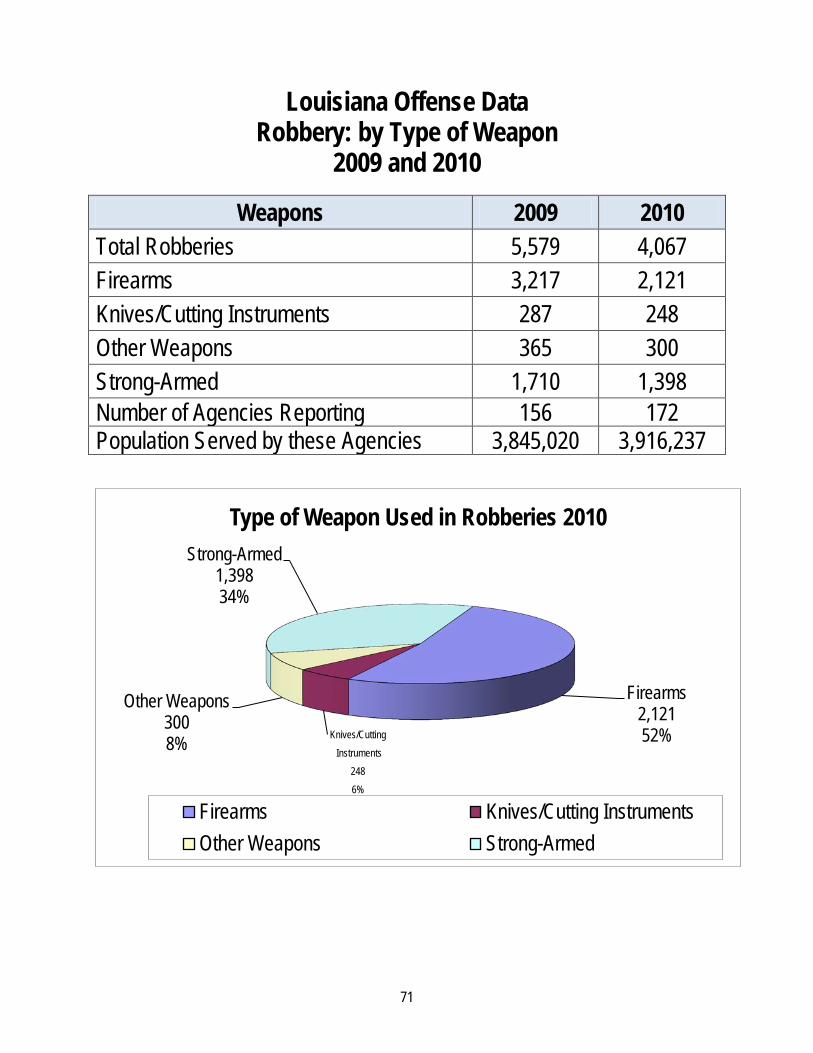
71
Louisiana Offense Data Robbery: by Type of Weapon
2009 and 2010 Weapons 2009 2010 Total Robberies 5,579 4,067 Firearms 3,217 2,121 Knives/Cutting Instruments 287 248 Other Weapons 365 300 Strong-Armed 1,710 1,398 Number of Agencies Reporting 156 172 Population Served by these Agencies 3,845,020 3,916,237
Firearms 2,121 52% Knives/Cutting
Instruments 248 6%
Other Weapons 300 8%
Strong-Armed 1,398 34%
Type of Weapon Used in Robberies 2010
Firearms Knives/Cutting InstrumentsOther Weapons Strong-Armed
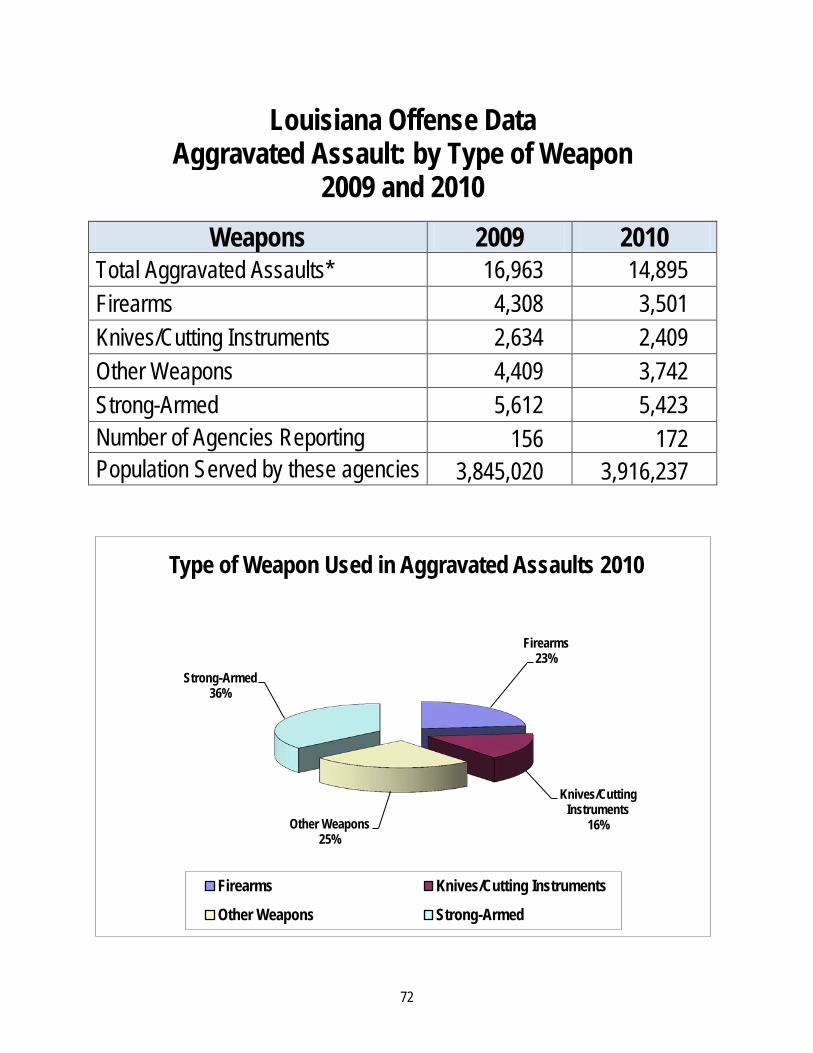
72
Louisiana Offense Data Aggravated Assault: by Type of Weapon
2009 and 2010 Weapons 2009 2010 Total Aggravated Assaults* 16,963 14,895 Firearms 4,308 3,501 Knives/Cutting Instruments 2,634 2,409 Other Weapons 4,409 3,742 Strong-Armed 5,612 5,423 Number of Agencies Reporting 156 172 Population Served by these agencies 3,845,020 3,916,237
Firearms 23%
Knives/Cutting Instruments
16% Other Weapons 25%
Strong-Armed 36%
Type of Weapon Used in Aggravated Assaults 2010
Firearms Knives/Cutting Instruments
Other Weapons Strong-Armed
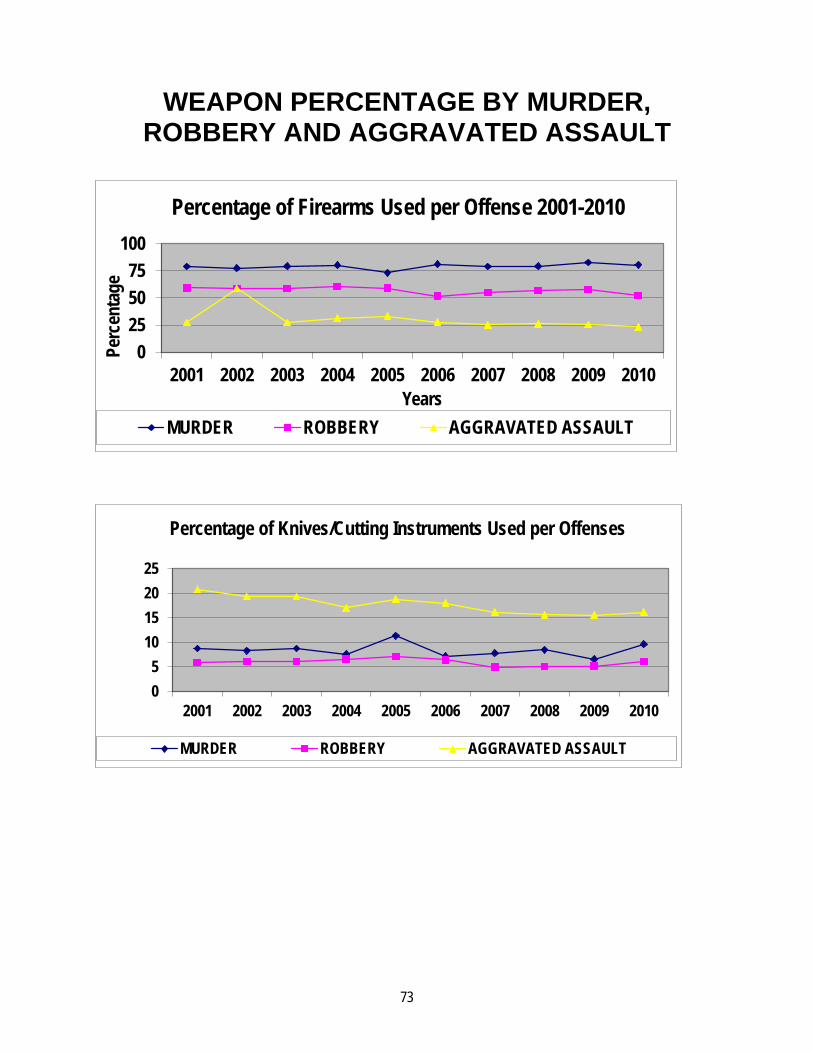
73
WEAPON PERCENTAGE BY MURDER, ROBBERY AND AGGRAVATED ASSAULT
0255075
100
2001 2002 2003 2004 2005 2006 2007 2008 2009 2010
Perc
enta
ge
Years
Percentage of Firearms Used per Offense 2001-2010
MURDER ROBBERY AGGRAVATED ASSAULT
05
10152025
2001 2002 2003 2004 2005 2006 2007 2008 2009 2010
Percentage of Knives/Cutting Instruments Used per Offenses
MURDER ROBBERY AGGRAVATED ASSAULT
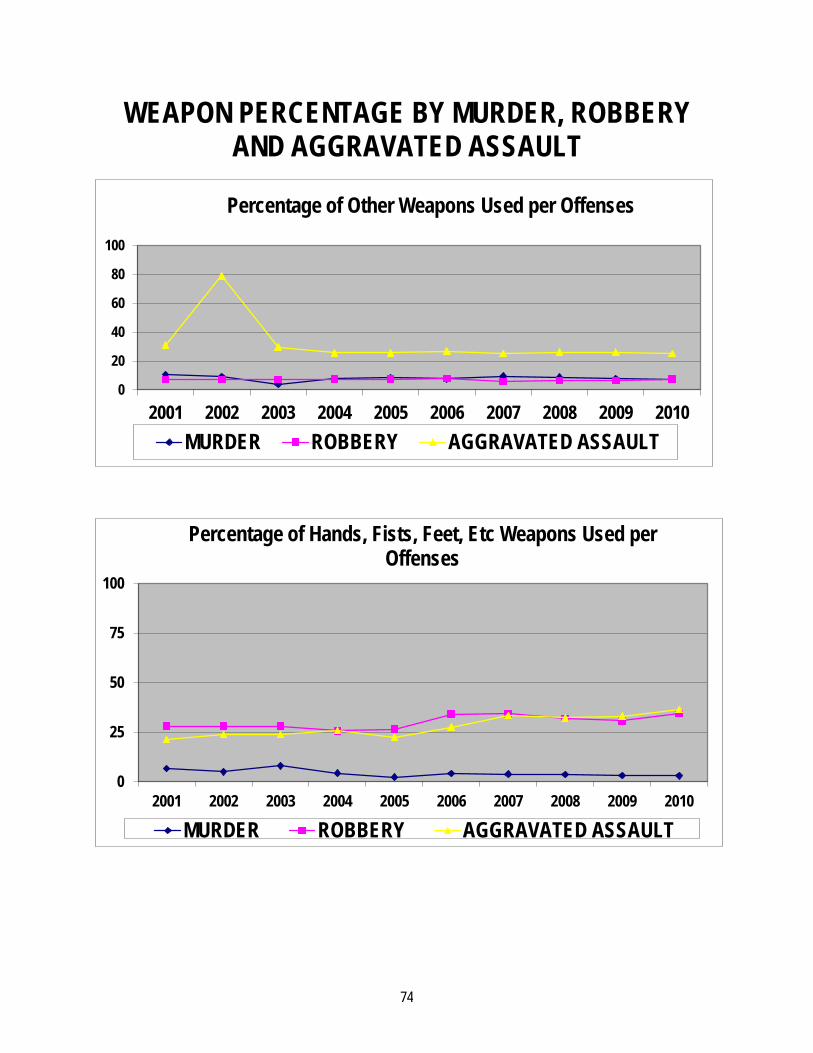
74
WEAPON PERCENTAGE BY MURDER, ROBBERY AND AGGRAVATED ASSAULT
0
20
40
60
80
100
2001 2002 2003 2004 2005 2006 2007 2008 2009 2010
Percentage of Other Weapons Used per Offenses
MURDER ROBBERY AGGRAVATED ASSAULT
0
25
50
75
100
2001 2002 2003 2004 2005 2006 2007 2008 2009 2010
Percentage of Hands, Fists, Feet, Etc Weapons Used per Offenses
MURDER ROBBERY AGGRAVATED ASSAULT

75
HOMICIDES IN LOUISIANA The following tables show homicides (murder and non-negligent manslaughter) in Louisiana for the year 2009. It is important to note the definition of homicide when reviewing these tables. Homicide (murder and non-negligent manslaughter) is the willful, non-negligent killing of one human being by another. The classification of this offense is based solely on police investigation as opposed to the determination of a court, medical examiner, coroner, jury or other judicial body. Not included in the count for this offense classification are deaths caused by negligence, suicide, accident, justifiable homicides, and attempts to murder or assault to murder, which are scored as aggravated assaults.

76
2010 HIGHEST REPORTED HOMICIDES BY POLICE DEPARTMENTS AND SHERIFF’S DEPARTMENTS
TYPE OF DEPARTMENT AGENCY POPULATION NUMBER OF HOMICIDES
Police Departments1
New Orleans 356,317 175 Baton Rouge3 229,493 70 Shreveport 199,900 26 Lafayette 115,378 12 Kenner 67,889 8 Lake Charles 71,795 7 Monroe 51,709 6 Opelousas 23,268 6 Alexandria 49,283 4 Houma 32,688 4 City of Natchitoches 17,667 4
Sheriff’s Offices (Parish)2
Jefferson 432,552 52 East Baton Rouge 440,178 10 Calcasieu 192,768 9 Ouachita 153,720 8 St. Tammany 233,740 7 Livingston 128,069 6 Terrebonne 111,860 6 Ascension 107,169 5 Tangipahoa 121,097 5 Caddo 254,969 4 Rapides 131,613 4
CHART TOTALS 3,523,122 438 State Totals 4,533,372 4273
Source: FBI’s Crime in the United States 2009. 1 The population numbers for the police departments was taken from Table 8 of FBI’s Crime in the United States 2009. 2 Most of the Sheriff’s Departments report for areas outside of city or town limits, however there are several that collect and report the data of cities or towns within their Parish. The population for the Sheriff’s Departments was taken from the estimate provided by the Louisiana website for Demographics and Geography found at http://louisiana.gov/Explore/Demographics_and_Geography/ParishEstimates_2010v2011.php 3 The Baton Rouge Police Department published their statistics on their website for 2010. The inclusion of Baton Rouge’s homicide data caused the state total to be smaller than the chart total since their data was not included in the FBI’s report for 2010. The homicide figures above include only the willful (non-negligent) killing of one human being by another. This includes the crimes of murder and non-negligent manslaughter. Excluded are attempts to kill, suicides, accidental deaths, justifiable homicides and manslaughter by negligence. In addition, it is possible that some homicide investigations are still in progress and this could affect these figures. The agencies included above had the 10 highest numbers of homicides for each category.
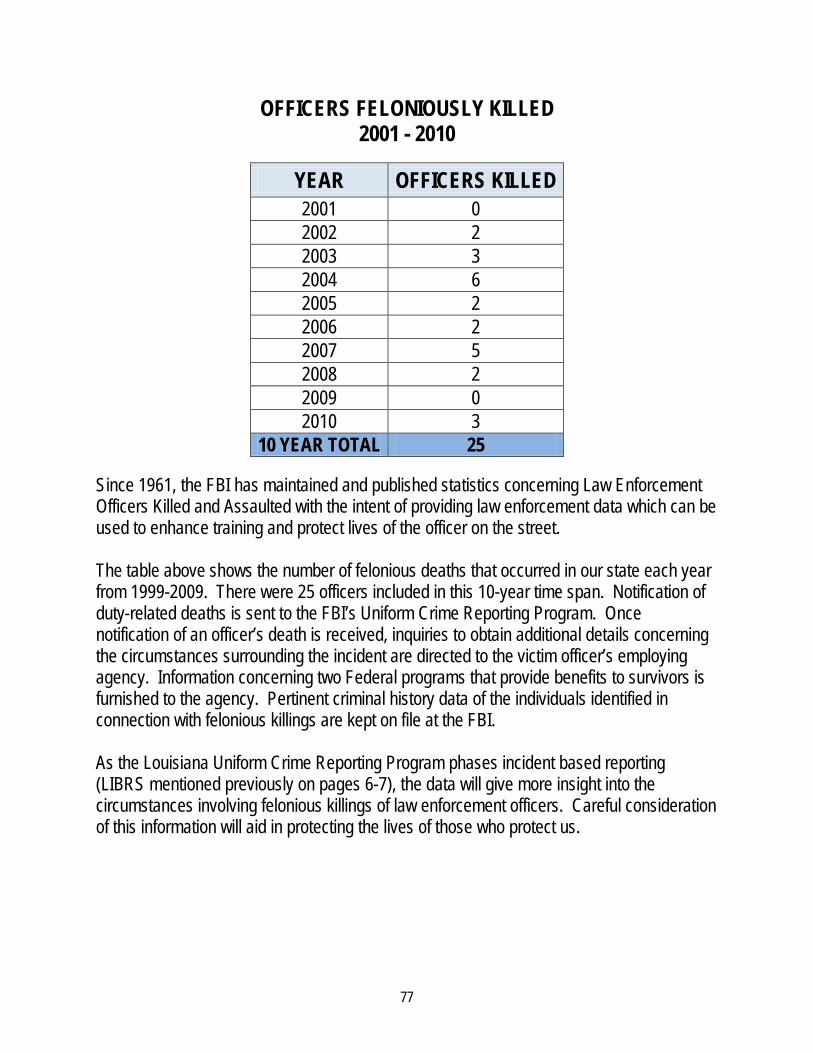
77
OFFICERS FELONIOUSLY KILLED 2001 - 2010
YEAR OFFICERS KILLED 2001 0 2002 2 2003 3 2004 6 2005 2 2006 2 2007 5 2008 2 2009 0 2010 3
10 YEAR TOTAL 25 Since 1961, the FBI has maintained and published statistics concerning Law Enforcement Officers Killed and Assaulted with the intent of providing law enforcement data which can be used to enhance training and protect lives of the officer on the street. The table above shows the number of felonious deaths that occurred in our state each year from 1999-2009. There were 25 officers included in this 10-year time span. Notification of duty-related deaths is sent to the FBI’s Uniform Crime Reporting Program. Once notification of an officer’s death is received, inquiries to obtain additional details concerning the circumstances surrounding the incident are directed to the victim officer’s employing agency. Information concerning two Federal programs that provide benefits to survivors is furnished to the agency. Pertinent criminal history data of the individuals identified in connection with felonious killings are kept on file at the FBI. As the Louisiana Uniform Crime Reporting Program phases incident based reporting (LIBRS mentioned previously on pages 6-7), the data will give more insight into the circumstances involving felonious killings of law enforcement officers. Careful consideration of this information will aid in protecting the lives of those who protect us.

78
LAW ENFORCEMENT OFFICERS AND EMPLOYEES The following charts document the number of civilian and law officers employed by police departments, sheriffs, universities and colleges and other state agencies in Louisiana. These are not exhaustive charts since only those law enforcement agencies that submitted 12 months of data to the FBI are included.

79
2010 FULL-TIME LAW ENFORCEMENT EMPLOYEES BY CITY1
CITY POPULATION TOTAL LAW
ENFORCEMENT EMPLOYEES
TOTAL OFFICERS
TOTAL CIVILIANS
Abbeville 12,310 43 41 2 Addis 4,043 12 11 1 Alexandria 49,283 188 155 33 Baker 13,460 39 37 2 Baldwin 2,639 9 8 1 Baton Rouge 226,001 832 728 104 Bernice 1,618 7 7 0 Berwick 4,266 13 12 1 Blanchard 2,734 6 5 1 Bogalusa 12,581 57 36 21 Bossier City 64,232 214 173 41 Breaux Bridge 8,109 23 18 5 Brusly 2,129 9 8 1 Bunkie 4,444 12 9 3 Carencro 6,897 26 24 2 Clarence 501 3 3 0 Clinton 1,867 9 8 1 Covington 9,325 51 39 12 Crowley 13,878 43 37 6 Denham Springs 10,504 43 35 8 Dixie Inn 341 2 2 0 Epps 1,090 5 3 2 Erath 2,160 10 7 3 Farmerville 3,574 14 14 0
CITY POPULATION TOTAL LAW
ENFORCEMENT EMPLOYEES
TOTAL OFFICERS
TOTAL CIVILIANS
Franklin 7,538 22 20 2 Franklinton 3,771 23 17 6 Georgetown 320 3 2 1 Glenmora 1,567 3 3 0 Golden Meadow 2,095 6 5 1 Gonzales 9,738 44 40 4 Grambling 4,931 15 10 5 Gretna 17,901 129 99 30 Hammond 20,386 104 80 24 Haughton 3,032 7 7 0 Iowa 2,634 12 9 3 Jeanerette 5,848 14 14 0 Jena 2,845 7 6 1 Jennings 10,418 35 23 12 Kaplan 4,996 23 17 6 Kenner 67,889 235 169 66 Kentwood 2,315 8 7 1 Kinder 2,403 17 12 5 Krotz Springs 1,300 6 5 1 Lafayette 115,378 321 259 62 Lake Charles 71,795 183 180 3 Lecompte 1,321 5 5 0 Mandeville 12,825 52 38 14 Many 2,698 11 9 2
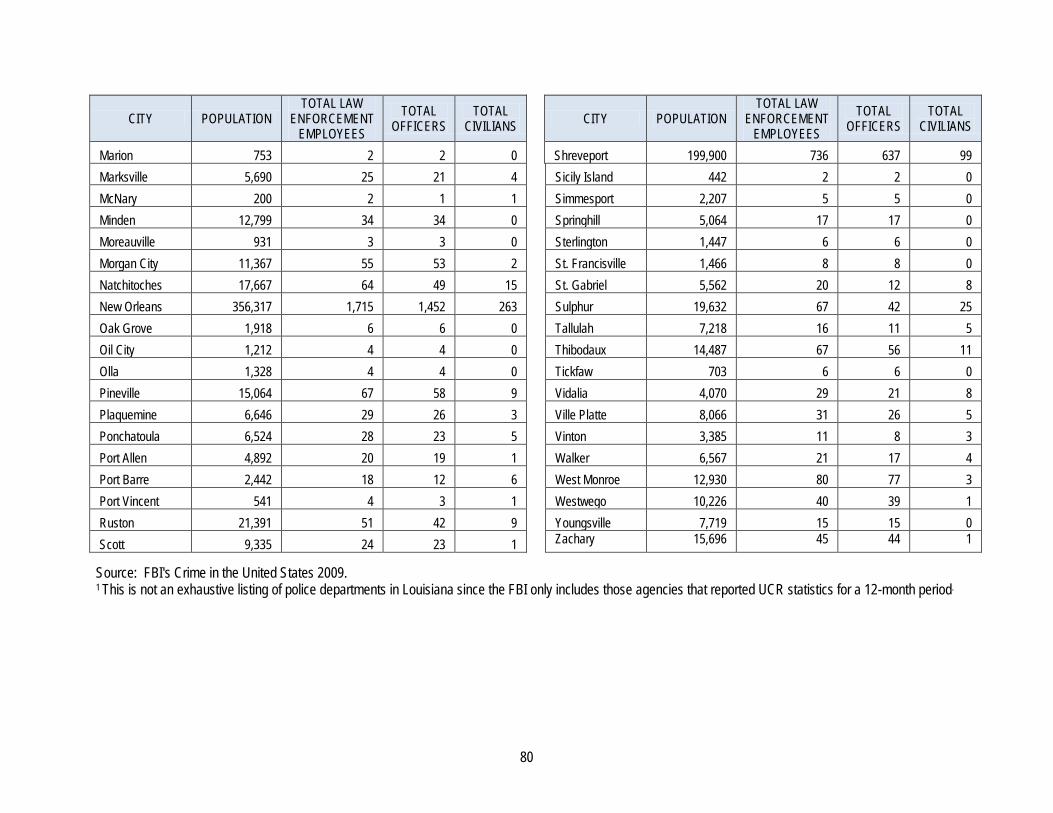
80
CITY POPULATION TOTAL LAW
ENFORCEMENT EMPLOYEES
TOTAL OFFICERS
TOTAL CIVILIANS
Marion 753 2 2 0 Marksville 5,690 25 21 4 McNary 200 2 1 1 Minden 12,799 34 34 0 Moreauville 931 3 3 0 Morgan City 11,367 55 53 2 Natchitoches 17,667 64 49 15 New Orleans 356,317 1,715 1,452 263 Oak Grove 1,918 6 6 0 Oil City 1,212 4 4 0 Olla 1,328 4 4 0 Pineville 15,064 67 58 9 Plaquemine 6,646 29 26 3 Ponchatoula 6,524 28 23 5 Port Allen 4,892 20 19 1 Port Barre 2,442 18 12 6 Port Vincent 541 4 3 1 Ruston 21,391 51 42 9 Scott 9,335 24 23 1
CITY POPULATION TOTAL LAW
ENFORCEMENT EMPLOYEES
TOTAL OFFICERS
TOTAL CIVILIANS
Shreveport 199,900 736 637 99 Sicily Island 442 2 2 0 Simmesport 2,207 5 5 0 Springhill 5,064 17 17 0 Sterlington 1,447 6 6 0 St. Francisville 1,466 8 8 0 St. Gabriel 5,562 20 12 8 Sulphur 19,632 67 42 25 Tallulah 7,218 16 11 5 Thibodaux 14,487 67 56 11 Tickfaw 703 6 6 0 Vidalia 4,070 29 21 8 Ville Platte 8,066 31 26 5 Vinton 3,385 11 8 3 Walker 6,567 21 17 4 West Monroe 12,930 80 77 3 Westwego 10,226 40 39 1 Youngsville 7,719 15 15 0 Zachary 15,696 45 44 1
Source: FBI's Crime in the United States 2009. 1 This is not an exhaustive listing of police departments in Louisiana since the FBI only includes those agencies that reported UCR statistics for a 12-month period.

81
2010 FULL-TIME LAW ENFORCEMENT EMPLOYEES BY METROPOLITAN AND NONMETROPOLITAN PARISHES
METROPOLITAN PARISHES
NON-METROPOLITAN PARISHES
PARISH
TOTAL LAW ENFORCEMENT
EMPLOYEES TOTAL
OFFICERS TOTAL
CIVILIANS
PARISH
TOTAL LAW ENFORCEMENT
EMPLOYEES TOTAL
OFFICERS TOTAL
CIVILIANS
Ascension 279 239 40 Acadia 108 55 53
Bossier 370 293 77 Avoyelles 398 398 0
Caddo 650 446 204 Bienville 55 33 22
Calcasieu 842 428 414 Caldwell 27 26 1
Cameron 73 61 12 Catahoula 106 16 90
De Soto 110 90 20 Claiborne 34 34 0 East Baton Rouge 838 703 135 Evangeline 62 23 39
East Feliciana 59 59 0 Franklin 134 109 25
Grant 67 49 18 Jackson 169 34 135
Lafayette 643 464 179 Jefferson Davis 65 50 15
Livingston 240 240 0 La Salle 45 45 0
Ouachita 391 290 101 Lincoln 63 47 16
Rapides 458 360 98 Natchitoches 82 58 24
St. Bernard 271 237 34 Red River 44 44 0
St. Charles 376 279 97 Sabine 74 74 0
St. Helena 53 24 29 St. James 99 77 22
St. Martin 241 136 105 St. Landry 221 97 124
St. Tammany 682 413 269 St. Mary 204 203 1
Terrebonne 373 160 213 Tangipahoa 263 104 159
Union 52 36 16 Tensas 124 30 94 West Baton Rouge 191 153 38 Vermilion 129 109 20 West Feliciana 74 49 25
Webster 146 47 99
West Carroll 18 18 0
Source: FBI's Crime in the United States This is 45 of Louisiana's 64 Parish Sheriff's Departments. The FBI only includes those departments that have submitted UCR statistics for a 12-month period. No data was included to document which agencies did not participate or failed to submit all 12 reports.

82
2010 FULLTIME LAW ENFORCEMENT EMPLOYEES BY UNIVERSITIES AND COLLEGES
UNIVERSITY/COLLEGE CAMPUS STUDENT
ENROLLMENT1
TOTAL LAW ENFORCEMENT
EMPLOYEES TOTAL
OFFICERS TOTAL
CIVILIANS Delgado Community College 16,758 37 25 12
Louisiana State University:
Baton Rouge2 65 62 3 Health Sciences Center, New Orleans 2,644 28 28 0
Health Sciences Center, Shreveport 823 61 45 16
Shreveport 4,667 9 9 0 McNeese State University 8,638 18 12 6 Nicholls State University 7,169 15 10 5 Northwestern State University 9,247 24 18 6
Southeastern Louisiana University 15,151 33 23 10
Tulane University 11,464 56 43 13 University of New Orleans 11,724 24 24 0
1 The student enrollment figures provided by the United States Department of Education are for the 2009 school year, the most recent available. The enrollment figures include full-time and part-time students. 2 Student enrollment figures were not available.
2010 LOUISIANA FULL-TIME LAW ENFORCEMENT EMPLOYEES BY STATE AND OTHER AGENCY
STATE/TRIBAL/OTHER AGENCIES UNIT/OFFICE TOTAL LAW ENFORCEMENT EMPLOYEES
TOTAL OFFICERS
TOTAL CIVILIANS
State Agencies Department of Public Safety State Capitol Detail 41 35 Tensas Basin Levee District 3 2
Tribal Agencies Chitimacha Tribal 14 9 Coushatta Tribal 20 18
Source: FBI's Crime in the United States 2010
83
GLOSSARY OF TERMS
Arrest - Arrest is the taking of a person into custody by law enforcement with the intention of seeking charges and recording the detention. All persons who are served a citation or a summons for committing an offense are counted as arrested. Juveniles taken into custody, counseled and released without being charged are counted in UCR as arrested. UCR arrest data does not include traffic offenses with the exception of DWI. Crime Rate - The number of Index Offenses reported within a specific geographic area and divided by the population of the area, produces a crime rate per capita statistic. This is then scaled to represent some standard population unit, such as the factor 100,000 utilized by the FBI in scaling their national and regional crime statistics. Thus, “Crime Rate Per Capita” multiplied by 100,000 produces the statistic commonly referred to as “Crime Per 100,000 Population”, or more frequently, simply, “Crime Rate.” Single and multi-jurisdictional areas can then be compared to each other, without regard to population variation. Index Crime - A term devised by the International Association of Chiefs of Police for use in their Uniform Crime Reporting Program. Recognizing the problem, among others, of coping with volume, they decided that only those criminal acts deemed most serious, most pervasive across the country, most likely to be reported and most frequently committed would be counted. Furthermore, they decided to include only criminal acts brought to the attention of police, whether or not there was an arrest. As a result, seven crimes were chosen and standardized definitions were created to assure uniformity. Those seven offenses were murder, rape, robbery, aggravated assault, burglary, larceny theft, and motor vehicle theft. Many years later the crime of arson was added.
LUCR - Louisiana Uniform Crime Reporting Program. The LUCR program is comprised of the Summary UCR Unit, Louisiana Incident Based Reporting System (LIBRS) and the Louisiana Law Enforcement Management Information System (LA-LEMIS).
UCR – Uniform Crime Reporting. The Summary UCR unit is responsible for collecting crime statistics and performing quality assurance functions prior to forwarding the statistics to the FBI. Early stages of development for the Summary UCR program began in 1991, and by 1993 Louisiana’s Program was certified by the Federal Bureau of Investigation. LA-LEMIS – Louisiana Law Enforcement Management Information System. This is the RMS (Record Management System) software that Louisiana developed for agencies to use. It is LIBRS compliant and currently we have more agencies certified with this RMS software than any others. LIBRS - Louisiana Incident Based Reporting System. LIBRS certified agencies are no longer required to generate and submit UCR paper reports. Their monthly LIBRS data submissions are converted to NIBRS specifications by the LIBRS computer system and submitted to the FBI electronically. LIBRS was certified by the FBI as NIBRS compliant in March 2003. NIBRS - National Incident Based Reporting System. A redesign of UCR, NIBRS is the FBI’s incident-based reporting system. It is an electronic data collection system modernizing crime information. A more detailed form of crime reporting, it incorporates information not captured by UCR regarding the circumstances involved in incidents. It includes more correlation between offenses, property, victims, offenders and arrestees and expands the crimes included to 22 categories. In

84
order to submit NIBRS data, an agency’s records management system must be compliant with LIBRS. Nonviolent Crime – In UCR the crimes of burglary, larceny-theft, motor vehicle theft, and arson are referred to as Property Crimes. For this publication, they are referred to as non-violent crimes. Offenses Reported - Sometimes referred to as a crime occurrence, this term refers to actual offenses reported or made known to law enforcement agencies. Offenses reported, but later determined to be “unfounded,” are excluded from the final tabulation of crime statistics used by the FBI for publication in Crime in the United States. The final figures used are referred to as “Actual Offenses.” Violent Crime - The crimes of murder and non-negligent manslaughter, forcible rape, robbery and aggravated assault. According to UCR definitions, violent crimes involve force or threat of force. Comparisons of Definitions Offenses in incident-based reporting were defined differently from those in UCR. To help the reader make comparisons between the traditional UCR and new NIBRS definitions, both are listed on the following pages
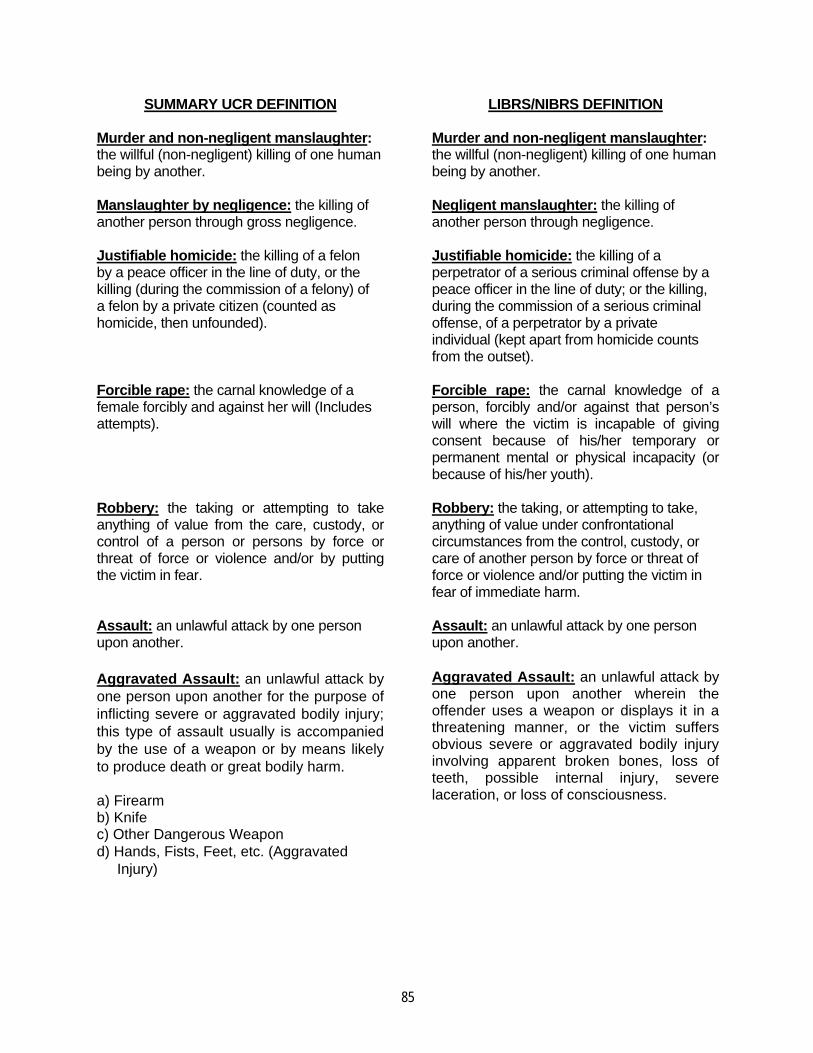
85
SUMMARY UCR DEFINITION
Murder and non-negligent manslaughter: the willful (non-negligent) killing of one human being by another. Manslaughter by negligence: the killing of another person through gross negligence. Justifiable homicide: the killing of a felon by a peace officer in the line of duty, or the killing (during the commission of a felony) of a felon by a private citizen (counted as homicide, then unfounded). Forcible rape: the carnal knowledge of a female forcibly and against her will (Includes attempts). Robbery: the taking or attempting to take anything of value from the care, custody, or control of a person or persons by force or threat of force or violence and/or by putting the victim in fear. Assault: an unlawful attack by one person upon another.
Aggravated Assault: an unlawful attack by one person upon another for the purpose of inflicting severe or aggravated bodily injury; this type of assault usually is accompanied by the use of a weapon or by means likely to produce death or great bodily harm. a) Firearm b) Knife c) Other Dangerous Weapon d) Hands, Fists, Feet, etc. (Aggravated Injury)
LIBRS/NIBRS DEFINITION
Murder and non-negligent manslaughter: the willful (non-negligent) killing of one human being by another. Negligent manslaughter: the killing of another person through negligence. Justifiable homicide: the killing of a perpetrator of a serious criminal offense by a peace officer in the line of duty; or the killing, during the commission of a serious criminal offense, of a perpetrator by a private individual (kept apart from homicide counts from the outset). Forcible rape: the carnal knowledge of a person, forcibly and/or against that person’s will where the victim is incapable of giving consent because of his/her temporary or permanent mental or physical incapacity (or because of his/her youth). Robbery: the taking, or attempting to take, anything of value under confrontational circumstances from the control, custody, or care of another person by force or threat of force or violence and/or putting the victim in fear of immediate harm. Assault: an unlawful attack by one person upon another. Aggravated Assault: an unlawful attack by one person upon another wherein the offender uses a weapon or displays it in a threatening manner, or the victim suffers obvious severe or aggravated bodily injury involving apparent broken bones, loss of teeth, possible internal injury, severe laceration, or loss of consciousness.

86
SUMMARY UCR DEFINITION (continued)
Simple Assault: all assaults and attempted assaults which are not of an aggravated nature and do not result in serious injury to the victim (NOT included in the tabulation of index crimes). e) Other Assaults - Simple, Not Aggravated: unlawful physical attack where neither the offender displays a weapon, nor the victim suffers obvious severe or aggravated bodily injury involving apparent broken bones, loss of teeth, possible internal injury, severe laceration, or loss of consciousness. To unlawfully place another person in reasonable fear of bodily harm through the use of threatening words and/or other conduct, but without displaying a weapon or subjecting the victim to actual physical attack (e.g., intimidation). Examples: Simple Assault Stalking Minor Assault Intimidation Assault & Battery Coercion Resisting an Officer Hazing Injury by culpable negligence Attempts to commit any of the above
Burglary: the unlawful entry of a structure to commit a felony or a theft (Includes attempts. Excludes tents, trailers and other mobile units used for recreational purposes). Applies “Hotel Rule.”
LIBRS/NIBRS DEFINITION (continued)
Simple Assault: an unlawful physical attack by one person upon another where neither the offender displays a weapon, nor the victim suffers obvious severe or aggravated bodily injury involving apparent broken bones, loss of teeth, possible internal injury, severe laceration or loss of consciousness. Intimidation: to unlawfully place another person in reasonable fear of bodily harm through the use of threatening words and/or other conduct, but without displaying a weapon or subjecting the victim to actual physical attack. Burglary: the unlawful entry into a building or other structure with the intent to commit a felony or a theft (excludes tents, trailers and other mobile units used for recreational purposes). Applies expanded “Hotel Rule” to include temporary storage facility. Because burglary is defined in terms of theft, only the burglary is to be reported.

87
SUMMARY UCR DEFINITION (continued)
Larceny: the unlawful taking, carrying, leading, or riding away of property from the possession, or constructive possession, of another (Includes attempts). Categories: a) Pocket-picking: the theft of articles from a person by stealth where the victim usually does not become immediately aware of the theft. b) Purse-snatching: the grabbing or snatching of a purse, handbag, etc. from the custody of an individual. c) Shoplifting: the theft by a person (other than an employee) of goods or merchandise exposed for sale. d) Theft from motor vehicles: (except theft of motor vehicle parts and accessories) the theft of articles from a motor vehicle, whether locked or unlocked. e) Theft of motor vehicle parts and ac-cessories: the theft of any part or accessory attached to the interior or exterior of a motor vehicle in a manner which would make the part an attachment to the vehicle or necessary for the operation of the vehicle. f) Theft of bicycles: the unlawful taking of any bicycle, tandem bicycle, unicycle, etc. g) Theft from building: a theft from within a building that is open to the general public and where the offender has legal access. h) Theft from coin-operated device or machine: the theft from a device or machine that is operated or activated by the use of a coin. i) All other larceny - theft not specifically classified: all thefts that do not fit the definition of the specific categories of larceny listed above.
LIBRS/NIBRS DEFINITION (continued)
Larceny: the unlawful taking, carrying, leading, or riding away of property from the possession, or constructive possession, of another person. Categories: a) Pocket-picking: the theft of articles from another person’s physical possession by stealth where the victim usually does not become immediately aware of the theft. b) Purse-snatching: the grabbing or snatching of a purse, handbag, etc., from the physical possession of another person. c) Shoplifting: the theft, by someone other than an employee of the victim, of goods or merchandise exposed for sale. d) Theft from motor vehicle: the theft of articles from a motor vehicle, whether locked or unlocked. e) Theft of motor vehicle parts or ac-cessories: the theft of any part or accessory affixed to the interior or exterior of a motor vehicle in a manner which would make the item an attachment of the vehicle or necessary for its operation. f) Theft of bicycles: classified according to the location from which the bicycle was taken. g) Theft from building: a theft from within a building that is either open to the general public or where the offender has legal access. h) Theft from coin-operated machine or device: a theft from a machine or device that is operated or activated by the use of coins. i) All other larceny: all thefts that do not fit any of the definitions of the specific subcategories of Larceny/Theft listed above.

88
SUMMARY UCR DEFINITION (continued)
Motor vehicle theft: the theft or attempted theft of a motor vehicle. A motor vehicle is defined for UCR purposes as a self-propelled vehicle that runs on land surface and not on rails. Excluded are farm equipment, bulldozers, construction equipment, airplanes, and watercraft. a) Autos: all sedans, station wagons, coupes, convertibles, and other similar motor vehicles which serve the primary purpose of transporting people from one place to another; also include automobiles used as taxis. (Includes SUV’s). b) Trucks and Buses: vehicles specifically designed (but not necessarily used) to commercially transport people and cargo; include pickup trucks and cargo vans regardless of their use and self-propelled motor homes. c) Other vehicles: all other vehicles that meet the UCR definition, such as snowmobiles, motorcycles, motor scooters, trail bikes, mopeds, golf carts, all-terrain vehicles, and motorized wheelchairs.
LIBRS/NIBRS DEFINITION (continued)
Motor vehicle theft: the theft of a motor vehicle a “motor vehicle” is defined for UCR purposes as a self-propelled vehicle that runs on land surface and not on rails and which fits one of the following property descriptions: a) Automobiles: sedans, coupes, station wagons, convertibles, taxicabs, or other similar motor vehicles which serve the b) primary purpose of transporting people. b) Trucks: motor vehicles which are spe-cifically designed (but not necessarily used) to transport cargo on a commercial basis. c) Buses: motor vehicles which are spe-cifically designed (but not necessarily used) to transport groups of people on a commercial basis. d) Recreational vehicles: motor vehicles which are specifically designed (but not necessarily used) to transport people and also to provide them temporary lodging for recreational purposes. e) Other motor vehicles: any other motor vehicles, e.g., motorcycles, motor scooters, trail bikes, mopeds, snowmobiles, golf carts, whose primary purpose is to transport people.

89
Standard Metropolitan Statistical Area (SMSA) - The U.S. Bureau of Census defines Standard Metropolitan Statistical Area as a parish (county) or group of contiguous parishes that contain at least one principal city or urbanized area with a population of at least 50,000 inhabitants. MSA’s include the principal city, the parish in which the city is located and other adjacent parishes that have, as defined by the OMB, a high degree of economic and social integration with the principal and parish as measured through commuting. In the UCR Program, parishes within an MSA are considered metropolitan. MSA’s can cross state boundaries. The only MSA in Louisiana that currently has the potential to cross a state line is the Shreveport/Bossier MSA. The following parishes and principal cities are classified as major metropolitan areas: SMSA Alexandria Baton Rouge Houma - Bayou Cane - Thibodaux Lafayette Monroe New Orleans – Metairie - Kenner Shreveport - Bossier City
PARISH Grant Rapides Ascension East Baton Rouge East Feliciana Iberville Livingston Pointe Coupee St. Helena West Baton Rouge West Feliciana Lafourche Terrebonne Acadia Lafayette St. Landry St. Martin Ouachita Union Jefferson Orleans Plaquemines St. Bernard St. Charles St. John the Baptist St. Tammany Bossier Caddo Webster
PRINCIPAL CITIES Alexandria Pineville Baton Rouge Houma Thibodaux Lafayette Monroe New Orleans Kenner Shreveport Bossier City

90
LOUISIANA UNIFORM CRIME REPORTING PROGRAM CONTACT INFORMATION
LOUISIANA SHERIFF’S ASSOCIATION
LIBRS Program (225) 383-8342
LOUISIANA COMMISSION ON LAW ENFORCEMENT http://lcle.la.gov/
Crime Victims Reparations 1-888-6-VICTIM
(1-888-684-2846) Local Calls in Baton Rouge (225) 342-1749 LAVNS (Victims Notification System) 1-866-LAVNS-4-U
(1-866-528-6748)
LAVNS Administrative Line (225) 342-1689 LEMIS Program (225) 342-1888 LIBRS Program (225) 342-1809 Louisiana Sentencing Commission (225) 342-1729 POST (Peace Officers Standards Training) (225) 342-1530 Policy Planning (225) 342-1867 Statistical Analysis Center (SAC) (225) 342-1954 SUMMARY UCR PROGRAM (225) 342-1569
North Region (225) 342-1569 Southwest Region (225) 342-1859 Southeast Region (225) 342-1869
FAX NUMBERS Policy Planning/SAC/UCR/LIBRS/LEMIS/ARRA (225) 342-1824 Executive/Human Resources (225) 342-1580 Grants/Fiscal (225) 342-1846 POST/CVR (225) 342-1672
EMAIL ADDRESSES