crime and finance: evidence from colombia by rony pshisva and gustavo a. suarez harvard university...
TRANSCRIPT

Crime and Finance: Evidence from Colombia
By
Rony Pshisva and Gustavo A. Suarez
Harvard University
Second Workshop of the Latin American Finance Network
Cartagena, 2004

Motivation
“Who wants to invest money and effort in building a business if their reward is to risk losing their life and/or their money?”
The Economist, “Fear of Captivity,” June 2004

Suggestive evidence
• Some studies argue that fear of crime may explain:– Individual housing decisions (Katz et al., 2001)
– Firms’ location (Porter, 1995)
• Terrorism is costly for economic activity
(Abadie and Gardeazabal, 2003)

Cross-country studies
Find that political instability reduces:
• Growth
Barro (1991)
• Investment and savings
Alesina and Perotti (1996)

Limitations of cross-country studies
• Reverse causation: Fajnzylber et al. (2002) suggests that crime rates are countercyclical
• Unobserved variables causing both low investment and high crime/terrorism
• Crime reporting standards vary across countries
Micro data can help.

Outline
I. Why Colombia?
II. Firms and crime in Colombia
III. The effect of crime on investment
IV. Conclusions and further research

I. Why Colombia?
1. High crime ratesCountry Population
(million)
Colombia 42South Africa 44Venezuela 24Russia 146Mexico 98United States 282Denmark 5
Source: United Nations
191341
Homicides per 100,000 pop. (1998-2000)
635132

2. Regional and time-series variation
Homicides per 100,000
46.6
232.5
67.1
28.3
177.1
89.4
0
50
100
150
200
250
Bogota Medellin Cali
Hom
icid
es p
er 1
00,0
00
1990 2002
Source: National Police

3. Different types of crime
• Kidnappings• Homicides• Guerrilla Attacks
Not all crime targets firms
Not all crime has economic motivations

II. Crime and Firms in Colombia
1. Crime and terrorism
Year Total Kidnappings Firm-Related Total Total Guerrilla
Kidnappings Kidnappings Homicides Attacks (FARC)
1996 1,091 220 26,130 9341997 1,671 249 24,828 1,1461998 3,023 453 22,673 7901999 3,349 575 23,820 7362000 3,697 NA 25,859 1,9312001 3,050 265 27,356 1,4712002 2,986 223 28,363 1,210
TOTAL 18,867 1,985 179,029 8,218
Source: FONDELIBERTAD
Year Total Kidnappings Firm-Related Total Total GuerrillaKidnappings Kidnappings Homicides Attacks (FARC)
1996 1,091 220 26,130 9341997 1,671 249 24,828 1,1461998 3,023 453 22,673 7901999 3,349 575 23,820 7362000 3,697 NA 25,859 1,9312001 3,050 265 27,356 1,4712002 2,986 223 28,363 1,210
TOTAL 18,867 1,985 179,029 8,218
Source: FONDELIBERTAD, National Police

Distribution of kidnappings
Kidnappings per 100,000
More than 25
Between 9 and 24.9
Between 5 and 8.9
Between 1 and 4.9
Fewer than 1

2. Firms
All firms Private Firms Public Firms1997 6,815 6,700 1151998 7,226 7,159 671999 6,944 6,870 742000 7,209 7,134 752001 4,844 4,767 772002 4,544 4,450 94
TOTAL 37,582 37,080 502
Agriculture, Hunting, Forestry 3,263Manufacturing 10,391Construction 3,849Wholesale and retail trade 9,779Real estate, renting, and business activities 4,061Other 6,239
TOTAL 37,582
PANEL A: Distribution by year (Number of firms)
PANEL B: Distribution by industry (firm-year observations)
All firms Private Firms Public Firms1997 6,815 6,700 1151998 7,226 7,159 671999 6,944 6,870 742000 7,209 7,134 752001 4,844 4,767 772002 4,544 4,450 94
TOTAL 37,582 37,080 502
Agriculture, Hunting, Forestry 3,263Manufacturing 10,391Construction 3,849Wholesale and retail trade 9,779Real estate, renting, and business activities 4,061Other 6,239
TOTAL 37,582
Source: Superintendencia de Valores, Superintendencia de Sociedades
PANEL A: Distribution by year (Number of firms)
PANEL B: Distribution by industry (firm-year observations)

The Effect of Crime on Investment 1. Baseline Regression:
• i indexes firms, j departments, t years, k industries.
• Investment: PPE
• TA: Total Assets
• X: Firm-specific controls (Size, Cash holdings, ROA)
• Z: Regional characteristics (GDP pc, Primary school enrollment, poverty index, extension of paved roads)
tijktitjti
tjtjtj
ti
ti
ZX
HomicidesAttacks GuerrillasKidnappingTA
Investment
,1,1,
1,31,21,1
1,
,
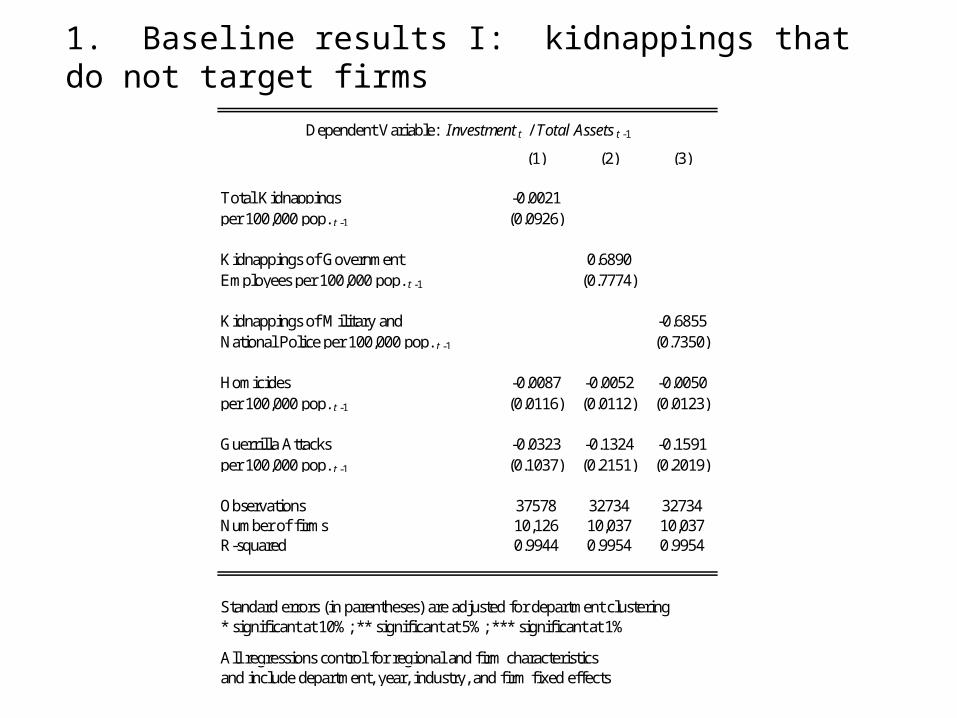
1. Baseline results I: kidnappings that do not target firms
(1) (2) (3)
Total Kidnappings -0.0021per 100,000 pop. t -1 (0.0926)
Kidnappings of Government 0.6890Employees per 100,000 pop. t -1 (0.7774)
Kidnappings of Military and -0.6855National Police per 100,000 pop. t -1 (0.7350)
Homicides -0.0087 -0.0052 -0.0050per 100,000 pop. t -1 (0.0116) (0.0112) (0.0123)
Guerrilla Attacks -0.0323 -0.1324 -0.1591per 100,000 pop. t -1 (0.1037) (0.2151) (0.2019)
Observations 37578 32734 32734Number of firms 10,126 10,037 10,037R-squared 0.9944 0.9954 0.9954
Standard errors (in parentheses) are adjusted for department clustering* significant at 10%; ** significant at 5%; *** significant at 1%
All regressions control for regional and firm characteristics and include department, year, industry, and firm fixed effects
Dependent Variable: Investment t / Total Assets t -1

1. Baseline results II: kidnappings that target firms
(1) (2) (3) (4)
Firm-Related Kidnappings -0.4433**per 100,000 pop. t -1 (0.2202)
Kidnappings of Firms' Top and -2.5125***Middle Management per 100,000 pop. t -1 (0.7777)
Kidnappings of Firms' Top -3.0882*Management per 100,000 pop. t -1 (1.8092)
Kidnappings of Firms' Owners -5.9784***per 100,000 pop. t -1 (2.2904)
Homicides -0.0020 0.0042 -0.0033 0.0031per 100,000 pop. t -1 (0.0125) (0.0118) (0.0116) (0.0115)
Guerrilla Attacks -0.1061 -0.1093 -0.1343 -0.1423per 100,000 pop. t -1 (0.1964) (0.2081) (0.1997) (0.1858)
Observations 32734 32734 32734 32734Number of firms 10,037 10,037 10,037 10,037R-squared 0.9954 0.9954 0.9954 0.9954
Standard errors (in parentheses) are adjusted for department clustering* significant at 10%; ** significant at 5%; *** significant at 1%
All regressions control for regional and firm characteristics and include department, year, industry, and firm fixed effects
Dependent Variable: Investment t / Total Assets t -1

2. Direct effect vs. indirect effect I: firms directly affected
(1) (2) (3) (4)
Firm-Related Kidnappings -7.0539
per 100,000 pop. t -1 (5.2085)
Kidnappings of Firms' Top and -10.9813
Middle Management per 100,000 pop. t -1 (9.2271)
Kidnappings of Firms' Top -27.8749
Management per 100,000 pop. t -1 (37.1192)
Kidnappings of Firms' Owners -31.6153
per 100,000 pop. t -1 (26.2885)
Observations 534 534 534 534Number of firms 147 147 147 147R-squared 0.3248 0.3261 0.3245 0.3255
Standard errors (in parentheses) are adjusted for department clustering* significant at 10%; ** significant at 5%; *** significant at 1%
All regressions control for regional and firm characteristics and include department, year, industry, and firm fixed effects
Sample of Firms Directly Affected by Kidnappings
Dependent Variable: Investment t / Total Assets t -1

2. Direct effect vs. indirect effect II: firms not affected
(1) (2) (3) (4)
Firm-Related Kidnappings -0.4334**per 100,000 pop. t -1 (0.2134)
Kidnappings of Firms' Top and -2.3701***Middle Management per 100,000 pop. t -1 (0.6955)
Kidnappings of Firms' Top -3.0316*Management per 100,000 pop. t -1 (1.6594)
Kidnappings of Firms' Owners -5.9561***per 100,000 pop. t -1 (2.0742)
Observations 32200 32200 32200 32200Number of firms 9890 9890 9890 9890R-squared 0.9955 0.9955 0.9955 0.9955
Standard errors (in parentheses) are adjusted for department clustering* significant at 10%; ** significant at 5%; *** significant at 1%
All regressions control for regional and firm characteristics and include department, year, industry, and firm fixed effects
Sample of Firms not Directly Affected by Kidnappings
Dependent Variable: Investment t / Total Assets t -1

3. Kidnappings in the same industry vs. other industries
Firm-Related Kidnappings in the Same Industry t -1 -0.0345**(0.0160)
Firm-Related Kidnappings in Other Industries t -1 -0.0031***(0.0007)
Observations 32,652Number of firmsR-squared 0.995
Standard errors (in parentheses) are adjusted for department clustering* significant at 10%; ** significant at 5%; *** significant at 1%
All regressions control for regional and firm characteristics and include department, year, industry, and firm fixed effects
Dependent Variable: Investment t / Total Assets t -1

4. Unobserved demand variables? Not likely
(1) (2) (3) (4)
Firm-Related Kidnappings -1.8006***per 100,000 pop. t -1 (0.6301)
Kidnappings of Firms' Top and -2.7547***Middle Management per 100,000 pop. t -1 (1.0655)
Kidnappings of Firms' Top -3.4916*Management per 100,000 pop. t -1 (1.9982)
Kidnappings of Firms' Owners -5.6704**per 100,000 pop. t -1 (2.5337)
Industry Tradability -0.1655* -0.1638* -0.1561* -0.1503*(0.0921) (0.0949) (0.0815) (0.0804)
Industry Tradability Kidnapping Rate 0.0432 0.0449 0.0917 -0.0507(0.0578) (0.0801) (0.1520) (0.1108)
Observations 32542 32542 32542 32542Number of firms 10,035 10,035 10,035 10,035R-squared 0.9954 0.9954 0.9954 0.9954
Standard errors (in parentheses) are adjusted for department clustering* significant at 10%; ** significant at 5%; *** significant at 1%
All regressions control for regional and firm characteristics and include department, year, industry, and firm fixed effectsIndustry tradability is the fraction of exports on sales at the industry level (average 1990-1996)
Dependent Variable: Investment t / Total Assets t -1

IV. Conclusions
• Firms invest less when crime targets them
• Unlikely to be driven by unobserved variables that drive both overall crime rates and investment
• Unlikely to be driven by unobserved demand variables
Conclusions (contd.)
• Higher conditional probability of kidnapping larger effect
• Fear of crime may reduce investment
• Possible explanation: human and physical capital are complements

Further Research
• What is the channel?Possible explanations:
1. Lower demand2. Higher costs3. Tighter financial constraints4. Human and physical capital are
complements
• Do Banks charge larger premia to violent regions?

Appendix

Terrorism decreases capital formation
-20
-10
0
10
20
30
40
50
0 0.05 0.1 0.15 0.2 0.25 0.3 0.35 0.4
Kidnappings per 100,000 people
Gro
ss C
apita
l F
orm
atio
n (%
GD
P)

Terrorism decreases FDI
-20
-15
-10
-5
0
5
10
15
20
0 0.05 0.1 0.15 0.2 0.25 0.3 0.35 0.4 0.45
Kidnappings per 100,000 people
Net
FD
I (%
GD
P)

Distribution of firms, 2000
More than 1,000 firms
Between 200 and 999 firms
Between 100 and 199 firms
Between 1 and 99 firms
Departments with no firms

Descriptive statistics: firm characteristics
Mean Median Standard Deviation
Observations
Total Assets (million dollars) 7.773 2.433 18.558 37,582
Investment / TA (%) 0.290 -0.555 13.891 37,582
Return on Assets (%) 0.033 1.547 12.313 37,582
Real Cash / TA (%) 6.497 2.617 10.171 37,582
Foreign Ownership (Yes=1, No=0) 0.173 0.000 0.379 32,970
Exporter/Importer (Yes=1, No=0) 0.267 0.000 0.442 32,970
1 ** significant at 5%; *** significant at 1% using a two-tailed t-test
This table reports descriptive statistics for the firm variables used in the empirical analysis. Investment is thechange in PPE and TA denotes Total Assets. Returns on Assets is the ratio of net income to total assets. Thedummy variable Foreign Ownership equals 1 if foreigners own at least 10% of the firm. Exporter/Importer isa dummy variable that equals 1 if a firm imports from or exports to other countries.

Descriptive statistics: high vs. low kidnappings
Low Kidnappings
Rate
High Kidnappings
Rate
High Rate –
Low Rate 1
Total Assets (million dollars) Mean 7.643 8.175 0.530**(0.109) (0.201) (0.223)
Observations 28,425 9,157
Investment/TA (%) Mean 0.509 -0.393 -0.903(0.947) (0.118) (1.669)
Observations 28,425 9,157
Return on Assets (%) Mean -0.017 0.186 0.202(0.074) (0.123) (0.148)
Observations 28,425 9,157
Real Cash / TA (%) Mean 6.640 6.055 -0.580***(0.062) (0.098) (0.122)
Observations 28,425 9,157
Foreign Ownership (Yes=1, No=0) Mean 0.198 0.097 -0.102***(0.003) (0.003) (0.005)
Observations 24,869 8,101
Exporter/Importer (Yes=1, No=0) Mean 0.258 0.296 0.038***(0.003) (0.005) (0.006)
Observations 24,869 8,101
1 ** significant at 5%; *** significant at 1% using a two-tailed t-test
This table splits the sample in two groups: (1) firm-year observations in departments with rates of total kidnappings abovethe country median ("high") and (2) firm-year observations in departments with rates below the median ("low"). Wecompare the mean of the firm-level variables used in the regression analysis.

Firm-related kidnappings of Colombians and foreign citizens
Firm-Related Kidnappings of Colombians -1.1941**per 100,000 pop. t -1 (0.5948)
Firm-Related Kidnappings of Non-Colombians -1.6275per 100,000 pop. t -1 (5.5899)
Foreign Ownership 0.2577(0.7541)
Firm-Related Kidnappings ( Foreign Ownership ) 2.9903***of Colombians per 100,000 t -1 (0.7623)
Firm-Related Kidnappings of ( Foreign Ownership ) -11.5103*Non-Colombians per 100,000 t -1 (6.7052)
Observations 27960Number of firms 7,997R-squared 0.3617
Standard errors (in parentheses) are adjusted for department clustering* significant at 10%; ** significant at 5%; *** significant at 1%
All regressions control for regional and firm characteristics and include department, year, industry, and firm fixed effects
Dependent Variable: Investment t / Total Assets t -1

Asset tangibility and the effect of kidnappings on investment
(1) (2) (3) (4)
Firm-Related Kidnappings 1.5219per 100,000 pop. t -1 (1.1971)
Kidnappings of Firms' Top and 2.1177Middle Management per 100,000 pop. t -1 (2.0088)
Kidnappings of Firms' Top 13.8862Management per 100,000 pop. t -1 (8.8206)
Kidnappings of Firms' Owners 16.4253***per 100,000 pop. t -1 (5.8181)
Industry's Tangibility t -1 0.5605*** 0.5443*** 0.5643*** 0.5435***(0.0316) (0.0179) (0.0354) (0.0286)
Kidnappings ( Industry's Tangibility t -1 ) -0.0838* -0.1583 -0.7882* -0.9778***per 100,000 pop. t -1 (0.0445) (0.1058) (0.4429) (0.3190)
Observations 32447 32447 32447 32447Number of firms 9,965 9,965 9,965 9,965R-squared 0.9962 0.9962 0.9962 0.9963
Standard errors (in parentheses) are adjusted for department clustering* significant at 10%; ** significant at 5%; *** significant at 1%
All regressions control for regional and firm characteristics and include department, year, industry, and firm fixed effects
Dependent Variable: Investment t / Total Assets t -1

Firm-related kidnapping and firm borrowing
(1) (2) (3) (4)
Firm-Related Kidnappings 0.0863per 100,000 pop. t -1 (1.3872)
Kidnappings of Firms' Top and 2.7795*Middle Management per 100,000 pop. t -1 (1.4683)
Kidnappings of Firms' Top 3.0019Management per 100,000 pop. t -1 (3.5050)
Kidnappings of Firms' Owners -1.0257per 100,000 pop. t -1 (5.7009)
Homicides 0.0139 0.0045 0.0131 0.0157per 100,000 pop. t -1 (0.0304) (0.0201) (0.0231) (0.0236)
0.2995 0.2993 0.3196 0.2957Guerrilla Attacks (0.2345) (0.2411) (0.2333) (0.2327)per 100,000 pop. t -1
Observations 28581 28581 28581 28581Number of firms 8,995 8,995 8,995 8,995R-squared 0.4065 0.4065 0.4065 0.4065
Standard errors (in parentheses) are adjusted for department clustering* significant at 10%; ** significant at 5%; *** significant at 1%
All regressions control for regional and firm characteristics and include department, year, industry, and firm fixed effects
Dependent Variable: Bank Debt t / Total Assets t -1

Firm-related kidnapping and firms’ costs
(1) (2) (3) (4)
Firm-Related Kidnappings -0.0228*per 100,000 pop. t -1 (0.0117)
Kidnappings of Firms' Top and -0.0028Middle Management per 100,000 pop. t -1 (0.0271)
Kidnappings of Firms' TopManagement per 100,000 pop. t -1 0.3145*
(0.1875)Kidnappings of Firms' Owners 0.0200per 100,000 pop. t -1 (0.1016)
Homicides 0.0004** 0.0003* 0.0001 0.0002per 100,000 pop. t -1 (0.0002) (0.0002) (0.0002) (0.0002)
Guerrilla Attacks -0.0003 -0.0006 0.0014 -0.0006per 100,000 pop. t -1 (0.0022) (0.0024) (0.0029) (0.0024)
Observations 33045 33045 33045 33045Number of firms 10,309 10,309 10,309 10,309R-squared 0.7211 0.7211 0.7211 0.7211
Standard errors (in parentheses) are adjusted for department clustering* significant at 10%; ** significant at 5%; *** significant at 1%
All regressions control for regional and firm characteristics and include department, year, industry, and firm fixed effects
Dependent Variable: Administrative Expenses t / Total Assets t -1