creep and shrinkage characterisation for ;^ analyzing … · · 2017-03-13creep and shrinkage...
TRANSCRIPT

Creep and ShrinkageCharacterisation for
;^ Analyzing PrestressedConcrete Structures
Zdenek P. BalantProfessor of Civil EngineeringNorthwestern UniversityEvanston, Illinois
Liisa Panula*Engineer, TAMS (Tippetts,
Abbett, McCarthy and Stratton)New York, N.Y.
D eformations due to creep andshrinkage are normally several
times larger than elastic deformationsin concrete structures. Frequently,these deformations cause excessivecracking and deflections or possiblefailure with an inherent loss in ser-viceability, durability and long-timesafety of concrete structures. Thus,there is an urgent need for a reliablemethod to predict creep and shrink-age, especially for slender prestressedconcrete structure's.
Recently, we have witnessed effortsto introduce creep and shrinkage intodesign recommendations 1,2,3 and todevelop more realistic prediction for-mulas.4 Over the last decade, how-ever, the subject has been plagued bypersistent disagreement as to what isthe proper and optimal formulation to
be used.s8 Although several pertinentconclusions have been drawn fromtheoretical arguments, 8 we shall de-liberately leave them out. The mostrelevant and convincing argument is,of course, the experimental evidenceand how well the data correlate withthe actual behavior of existing struc-ture s.
Although this has not been gener-ally realized, vast experimental infor-mation on creep and shrinkage has al-ready been accumulated in the liter-ature. 4 Unfortunately, the provisionsof a recent international model codewere supported by very limited com-parisons with test data, selectedsomewhat arbitrarily. This was under-
*Formerly, Graduate Research Assistant,Northwestern University, Evanston, Illinois.
86

standable in view of the tediousnessof test data fitting when performed inthe traditional way—by hand. Re-cently, however, highly effectivecomputer optimization methods foranalyzing and fitting test data havebeen developed5' 6 and, at the sametime, the available test data from vari-ous laboratories have been collectedand organized.'
This enabled development of a newprediction model in Reference 4which we will call the BP model.Compared to other existing mod-els,1,2,3 this one gives a far superioroverall agreement with the bulk ofavailable test data4 (80 different datasets). The coefficient of variation ofthe creep prediction is as low as 8 to12 percent when the elastic modulusor one shrinkage value is known, andabout 16 to 24 percent when it is un-known.
To attain good accuracy, the earlierBP model4 requires that not only thestrength but also several composition(mix) parameters of concrete beknown. Branson's (ACI 209) 2,3 modelis similarly based. On the other hand,the input for the CEB-FIP ModelCode formulation' is more limited,requiring only the strength and thetype of cement, and possibly the elas-tic modulus of concrete. For prelimi-nary design, in which the compositionof the concrete to be used might notyet be known, and also for the designof ordinary structures, it is desirable tohave a simpler model that requires asfew material characteristics as possi-ble, preferably just the strength, whilemaintaining at the same time a suffi-cient accuracy.
Development of such a model,which we will call BP2, is our mainobjective. This model will represent asimplified version of the earlier BPmodel;' hence, the background dis-cussions 4'^ 11 need not be repeated.Although an accurate prediction ofcreep and shrinkage is needed mainly
for prestressed structures, the modelcan of course be used for all concretestructures.
To estimate the error in material de-scription, we adopt as our second ob-jective a statistical analysis of the de-viations from test data. At the sametime, we will compare the data fits forthe present model with those of Bran-son's (ACI) model2'3 and the CEB-FIPModel Code.' In the process thesetwo will be also compared mutually;this has not been done previously, inspite of much discussion. For a com-parison of the previous BP model withthe same and many further test data,Reference 4 may be consulted.
PCI JOURNAUMay-June 1980 87

Proposed Model
The essential structure of ourmodel, which distinguishes it from theACI,2 ' 3 CEB-FIP, 1 and other formula-tions, is as follows:Shrinkage strain:
Esh = E sh ,,k h S (1.), t =— o (1)Tsh
Strain due to unit stress:
E= J(t,t')= Eo +A(t')F(t)+
instant basic creep
kh'P(Ad)B(t')^ I) (2)Tsh /11
drying creep
whereJ (t,t') = creep (compliance)
function34= strain at time t (in days)
caused by a unituniaxial stresssustained since time t'(in days)
t = t — t' = stress durationA d = t — to
= lag of the instant ofloading t' after the startof drying
t = drying durationk h and kh' = functions of ambient
humidityT $h = shrinkage-square
halftime which isproportional to the sizesquare
Note that S, A, F, P, B, and f arefunctions of the indicated variables.
There are no humidity and size ef-fects in the basic creep term; theseeffects appear only in the drying creepterm. A change of humidity is man-ifested by a vertical scaling of thisterm, and a change in size (thickness)
causes in the log-time plots a hori-zontal shift of the drying creep term,''2which can be imagined to slide on topof the basic creep curve depending onthe value of Tsh . The presence of theshrinkage-like function f(t /TSh ) in Eq.(2) means that shrinkage and creep arenot assumed to be simply additive,which agrees with experimental evi-dence. (The relative differences withrespect to other creep laws are dis-cussed in Reference 42.)
ShrinkageWe use4 the hyperbolic law in time
and the cubic humidity dependence:
S( t )=S (3)` T sh ) Tah+ t
k h = 1 — h 3 forh - 0.98; (4a)
k h =- 0.2 forh = 1.00 (4b)
For the effects of size, diffusivityand age, the earlier BP formulas' aresimplified as:
zTsh = C S^ ) ; D = 2 S ,
C 1 (t0)
C 1 (to) = 2.4+ 120 (5)
in whicht = time (in days), repre-
senting the age of con-crete
to = age when drying beginst = duration of drying
E sh = shrinkage strainE shm = ultimate shrinkage
h = relative humidity of theenvironment
Tgh = shrinkage square half-time
C 1 (to) = coefficient proportionalto drying diffusivity atage to
D = effective cross sectionthickness in mm
88

v/s = volume-to-surface ratioin mm
ks= shape factor whichequals 1.0 for a slab, 1.15for a cylinder, 1.25 for asquare prism, 1.30 for asphere, 1.55 for a cube(see Reference 11 whichis based on Reference12)
These formulas are deduced fromthe BP model by omitting the temper-ature dependence and the relativelysmall influence of the increase ofelastic modulus with time. The factthat all shrinkage curves as functionsof t /T8h are proportional, and that TSh isproportional to D 2 , k, and to 1/C1ifollow from nonlinear diffusiontheory.', 12 The remaining aspects areempirical. For a detailed analysis, seeReferences 9 and 12.
Previously, both C 1 (t o ) and E8h,
were derived as functions of the com-position of concrete.' It has now beenfound that no large error is caused byomitting the composition dependenceof C 1 (to), but for E sh. this turns out tobe impossible without introducing er-rors over ±50 percent. It simply is notfeasible to predict all properties ofconcrete without knowing its com-position. For shrinkage, even a verycrude guess of composition parame-ters is far better than none. Therefore,the composition formula from Refer-ence 4 must be retained, except forremoving the influence of elasticmodulus; hence:
E,h. = (1330 - 970y )10-6 (6a)
y = (390z 4 + 1)-' (6b)
/ g ) 2 ]=T 1.25 +0.51
x ( 1 +S/C 11/3 12
l w/c J
ifz % 0, otherwise z = 0 (7)
where
f standard 28-day cylinderstrength in ksi (1 ksi = 6.895N/mm2 )
wlc = water-cement ratioa/c = aggregate-cement ratiog/s = gravel-sand ratio (all by
weight)
Sand is the aggregate passing sieveNo. 4 (4.7 mm), and gravel is the rest.For an analysis and justification of Eq.(7), see Reference 4.
The verification of the above (BP2)formulas by the well documentedshrinkage test data available in the lit-erature'3-16 is shown in Figs. 1 and 2.The basic information on these data issummarized in Reference 4. The fitsare good but not as close as those withthe BP model.4
Basic CreepThis is the creep in the absence of
moisture exchange. It is measured onsealed specimens and is pertinent tomass concrete as well as to the core ofmore massive cross sections. Thecreep under water is almost the same.The double power law, 5,9,10 used inthe BP model, is simple enough to beretained:
J(t,t') = E + C 0 (t,t') (8a)0
C 0 (t,t'.) = o(t' -m + a) (t – t') (8b)
where E 0 is the asymptotic modulus.4The expressions given for parame-
ters m, n, a, (p, and E o give the valueof the conventional static elastic mod-ulus E (roughly in accordance withthe ACI formula for calculatingE fromff)asE=1/J when t–t'=0.1 day issubstituted. The formulas even givethe value of dynamic modulus Ed,,,^ as1/J when t – t' = 10-7 day is substi-tuted, and the age dependence of E
PCI JOURNAUMay-June 1980 89

O
CC_a(n6)C10C
1.2
Keeton,RH = 20'
1.0 Cyl.3°x
0.8
06
oA
0.2
0.8
0.6
0.4
0.2
0
1.0
0.8
0.6
04
0.2
I0
Keeton, 1965 °(Shrinkage- simplified) °RH=20% ° • °t° =8days ^a
M
p +0
Size effect
(a)
IA Ion 10
Keeton, 1965RH = 50 %t° = 8 days
•
P \0• 4
• 6
(b1
II 10 loo 10(o
Keeton, 1965 °o °to=8days
o.y *9
o • o •*
O °
(c)
10 100 10001.2
I.0
0.8
0.6
0.4
0.2
1 10 I0o I 10 100
t - t 0 in days
Fig. 1. Comparison of proposed model with shrinkage data.16
and E dYn . However, to achieve j=0.3+ 15(ff)- 1.2 (9b)simplification, we restrict this broad m = 0.28 + 1/(ff )2 (9c)range of applicability because it is notneeded for normal creep structural n = 0.115 + 0.0002 (f^ )3 (9d)
analysis. a = 0.05 (9e)
The following simplified formulas, where f f is in ksi and 1/E 0 is in 10-6/applicable to normal weight and nor- psi.mal strength concretes for load dura- Because of the afore-mentionedtions t – t' % 1 day, have been iden- simplification, the approximate con-tified: ventional elastic modulus at any age t'
is obtained from these formulas as11E 0 = 0.1 + 0.5/(f^ )2 (9a) E = 1/J for t – t' = 1 day, rather than
90

Hansen, Mattock, 1966(Shrinkage-simplified) o ••RH=50% `c Do Doti oto= 8 days • ° °
01 0 ^LOa
f O • ° ee
o O ^6F+0 ° ° e
0o•0
° e °
e e sealede ••° ♦ •♦ ♦...• • A A
In Inn 1000
Troxell,. Raphael, Davis, 1958 w oto = 28 d0ys Pt''•50 o °
- to x
0.8
0.6
0.4
0.2
0
1,0
)
0.5
0.3
02
0.1
0
M
L'Hermite and Momillon,1968 °^o
1+ ay + 0 °= 2 daysto ,^ryO+M`^i$\p+`p+ +
_ ,t'p 92, N • 00
• e^ +
e Q♦e •
e ° •
10 100 10
10 100 1000
0.5 Kesler, Wallo, Yuan, 1966 ° ••RH=50% °to = 28 days
O.a
0.I
Q to 100 1000
1 10 100 I - 10 100
t -t o in days
Fig. 2. Comparison of proposed model with further published shrinkage data.4,13-15
0.1 day. It should be also mentioned had been used in fitting the data inthat slightly different formulas, figures, and were later modified tonamely: Eq. (9) in order to extend the validity
to relatively high f f and very long1/E 0 = 0.09 + 0.465/(f f ) 2 times beyond the range of test data in
the figures.and
The fits of the available welln = 0.115 + 0.00013 (ff )3.4 documented test data 17,26 are dis-
0.6 1-'Hermite andMamillan, RH•355'1965
so%0.5
o. a
75 %0.3e °
Q2
to = 2 days0.1
PCI JOURNAUMay-June 1980 91

ro
Dworshak Dam, 1968, sealed
bet
°
\ • any• • a
^"M o 0 0
0.50
0.45
0.40
0.35
0.30
0.25
0.20
0.15
0.10N
.800
6C
1.4
1.2
1.0
0,8
0,6
0.4
0.2
Canyon Ferry Dam, 1958, v A0.7 sealed nOo pots
o ^i•^0.6
^ o0.5 i6°'' o
A j` 0
as 6 eov+dos
0.3
• \..365 dad a o
0.2 ■ ■
10 100
ORoss Dam, 1953, 1958, sealed o
0.9 0 °
0.8 d°Yso y.
0.7
0.6
0.5
^eoYso
0.4 • j • ° o
a i • y6 eOy.0.3 yo eav+
0.2 Ei .3b d
to 100 1000
Shasta Dom, 1953 ., 1958, sealed oa840.6
o
08C Hermite, Mamillon, Lefevre, 1965, 1975 (sealed)/
o..ooo(Basic creep - simplified)
o ^
o^eoYs
6 eoY s •
:90 eOYs\, 36 e
- S i.j3o day s p D
D
0.01 0.I I to Io0 Irmn
Q52geoYso
o ti`
0.3 •,,.3b5 dO s• °{.2645 ea so ^
0.2 ■ • • ■
0.1 I.0 IO 100 1 10 100 1000
t - t' in days
Fig. 3. Comparison of proposed model with published data on basic creep.4,14,17 -20,26
0.30
025
Q20
0.15
played in Figs. 3 and 4 (and basic in-formation on test data used can again'be found in Fig. 4). Understandably,the fits are not as close as those withthe BP model.4
92
Drying CreepSimultaneous drying intensifies
creep. This may be described bysuperimposing on the basic creep ex-pression a shrinkage-like term, Cd

1.0
0.9
0.8
0.7
0.6
0.5
0.4
0.3
0.2
0.30
0.25
0.20
0.1510 100 I IC 100 1000
t-t' in daysFig. 4. Comparison of proposed model with further published data on basic creep.2,21-25
(t,t',t 0 ), where t' is the age at loading very thin structures, such as thinand t o is the age at the start of dry- shells, but for most other structuresing: 1' 11 this does not matter because their
drying reaches the stage of moistureJ(t,t') _ — +C,(t,t') +Cd(t,t',to) equilibrium in the micropores long
E ° (10) after their design lifetime.By simplifying the expression of the
The effects of humidity and size BP model,4 the following expressionenter only through the additional, has been obtained:drying creep term. The full model inReference 4 involves another additive Cd(tt',t0) = knt' -in12 S d (t,t' )term, –Cp(t,t',ta), which models the Eodecrease of creep that takes place long (11)after the drying terminates. This termis omitted here, which means that our in which the humidity effect and thesimplified model cannot describe the effect of the time lag of loading aftertest data for predried specimens. the start of drying are given by:
This omission precludes applicationof the formula to long creep times for kn = 1 – h"5 (12a)
PCI JOURNAUMay-June 1980 93

0.6
0.5
0.4
0.3
1.0 L'Hermite, Mamillan, 1965
0.8
1.0
0.8
0.6
0.4
0.2
NQ
1.5ID
0C
1.0
0.5
0.8
0.7
- L'Hermite, Mamillan, Lefevre, Re1965, 1971
(Drying creep-simplified) o °•RH=50% •
•• v
• V
•,^eoYs
n ni- OA I to 100 1000
Troxell, Raphael, Davis, 1958t' = 28 days 018
o »
IF .tpy.•
9`x'o
inn
- Meyers and Maity, 1970RH=50% pD
0
D.4 8 99w
0.2 1000
Lambotte, Mommens, 1976 o0.6 Concrete p26, p29
00
0.5 o P° 20
04 0
0 90.3 o g 0
l0 100
0.6 0 0° q.°o aoi`
::L165%
0.5 0 .
0.4 0.3 o o o o _oa o o 0g °
0.3 0 0.2
10 too 0.I 1 - l0 100 p
t - t' in days
Fig. 5. Comparison of proposed model with published data on creep at drying.4,14,15,17,24,,
f t size and on diffusivity as a function of'Pd = 1 + — tTsh 10 'Pd (106 63k) age [Eq. (5)], as indicated by the non-1O
(12b) linear diffusion theory. A detailed dis-and the time evolution of the shrink- cussion of the individual terms of Eqs.
age-like term is: (9) to (13) can be found in References4 and 11.
\-o.35 Since the use of composition pa-S d (t,t') _ 1 + t _3t (13) rameters is found to be inevitable for
J shrinkage, it would be inappropriatewhere Tgh involves the dependence on to discard the same composition pa-
94
Keeton, 1965
j
lified) ° •
all o
"° pN°
9O I^° a
to In0 inr O
I.Q+.
Keeton, 1965
Humidity effect o).9' Medium size cylinders 4°. • 12°
o • q.°ry0
• ^N
>.S ° 10*
0.4
0.3
10 100 1000
08
0.7
06
Q5
0.4
0.5
0.4
0.3
Keeton, 1965 °Humidity effect, large o • +Size cylinders 6 k 18"
ti?,t Oele
o ^lgN
0 0 ° 1
Lambutte, Mommens, 1976 0Concrete p50, P51
o •o
•
10 100 1000
La mbotte, Mommens, .1976
1reteP13P31eedP3200 o X20 ^
o D
o e
Lambotte, Mommens, 1976 gConcrete p34, p35 and p49 :
br'\^^p Q
r fl \P
e ed0^
D 8 l
8 •
i IO Ian inM
1 1a loo 1000 I 10 100 1000
t - t` in days
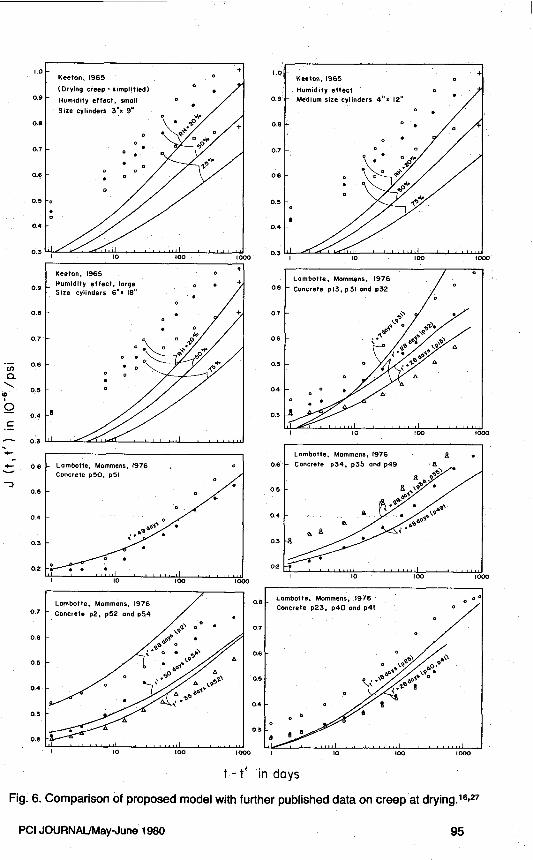
Fig. 6. Comparison of proposed model with further published data on creep at drying.16'27
PCI JOURNAL/May-June 1980 95

rameters for drying creep, and itwould certainly introduce a significanterror. However, at least a simplifiedcomposition dependence has beenidentified:
or = ( -ffl.a^ g )1.3 X
.s`0.00161—
wlc l 'I – 0.85 (14a)
Eah /
.,
forr> 0:cpd = 0.0056+ 0.01891+0.7r 14
otherwise Bp d = 0.0056 (14b)
In Eq. (14a) f f must be in ksi.The fits of the most important test
datals'1723,25 achieved with these for-mulas are shown in Figs. 5 and 6, andbasic information on the test data usedcan again be found in Reference 4.The fits are clearly not as good asthose with the BP model.'
Temperature and Cyclic LoadingThese effects are normally ne-
glected in the design of ordinarystructures. It is preferable, though, toinclude them; the formulas from Ref-erence 4, which do not involve anyfurther composition effects, may beused.
Comparison with CEBand ACI Models
With the help of computer optimi-zation of data fits, the solid curvesshown in Fig. 1 through 6 have beenobtained for the proposed model. Theagreement with test data appears to besatisfactory. For comparison, the pre-dictions of the CEB-FIP Model Code1978 1 and of Branson's (ACI 209)Model3'2 are matched against the sametest 'data in Figs. 7-11. It is seen thatthe proposed (BP2) model gives
clearly superior accuracy. (Compari-sons with all data sets from Reference4 have been considered but not all canbe displayed here.)
Looking at Reference 4, we see thatthe previous BP model gives the bestaccuracy for the same data as dis-played here. Furthermore, it closelyfits the test data on other effects whichare beyond the scope of the ACI andCEB models (such as short-timecreep, very long time creep, creepafter drying, temperature, and cyclicloading).
To make a quantitative comparison,the deviations of the prediction curvesfrom the measured data have beenevaluated at characteristic time points,taken as uniformly spaced points inlog-time scales of t – t' and t –t o , twopoints per decade. From these de-viations, the coefficients of variation wfor all data sets combined have beenevaluated. For the designer, moremeaningful parameters are the 95 per-cent confidence limits o. In Refer-ence 4 and here, the confidence limitsreferred to are one-sided 95 percentlimits, i.e., the probability of ex-ceeding the limit is 5 percent on theplus side, and also 5 percent on theminus side. This corresponds to themore usual two-sided confidence limitof 90 percent. These limits are ob-tained as w 5 = 1.645o and their val-ues, calculated on the basis of numer-ous data sets, are given in Table 1(A).The coefficients of variation and con-fidence limits for individual data setsare listed in Table 2. -The method ofstatistical analysis is described in de-tail in Part VI of Reference 4.
When judging the statistical com-parison in Tables 1 and 2, it must beappreciated that it is strongly biasedagainst very long creep durationst – t' and higher ages at loading t'.This is because the available datapoints for medium creep durationsand medium ages at loading are farmore numerous, and because, in cal-
96

1.2
I.0
0.8
0.6
04
Keeton, 1965 00
RH-20% - •o •Cyl. 3's 9 • A• o--ACI
•i o A
—CEB ^:000^aoi A /
ryP /
A /
10 Ion
Keeton, 19651.0 RH=50k
to=8days _ p • ° .).8 g p •
•
° ah •
m o%.
)4 0 • o a/o
10 100 loon
0.8
O_QE
C
O 0.4
U)
0.20s
Oo i
Keeton, 1965 • •RH = 75 % p 0 • ° °
•
tC = a days0.b'',: ^
0 • ° wee ii^^p°
8
1 10 100 10
t-to in days
)0
0.8
0.6
0.4
Keeton, 1965 o . 0
_ RH=20% • • oo • o.to=8days
0 •0
,4•
O • ~0 • ba /^/^^.
Q /°
1 10 IOU Inr
Keeton, 1965 0
RH=50%0 •0
C yl 3 ` 9° • n0. o
8 • GO
A
g \o^ •a^iai'
4 0/^/
•
I in Inn
0.s
0.4
03
02
0.I
0
t - to in days { tc^
Fig. 7. Comparison of ACI and CEB models with published shrinkage data.4'16
PCI JOURNALJMay-June 1980 97

Table 1. 95 percent confidence limits (in percent).A. Comparison of various models
Model Shrinkage Basic Drying Overallcreep creep
1. ACl209 (1971) 86 52 42, 632. CEB Model Code (1978) 118 47 32 763. Proposed BP2 model 37 45 29 374. BP Model (Ref. 4) 27 39 27 315. BP Model, one initial value given 22 13 16 18
B. Effect of selective use of test data on 95 percent confidence limits of BP model
Data set Material parameters Parameters adjustedkept same for best fit
1. Creep at room temperature:(a) All 36 data sets °(Ref. 4) 31.6 31.6(b) Selected 25 best fitted data
sets 22.51' 16`'(c) Selected 8 best fitted data
sets 8.75 7!2. Shrinkage:
(a) A11 12 data sets "(Ref. 4) 52.2 52.2(b) Selected 8 best fitted data
sets 20.7 13`°
C. Sources of error (95 percent confidence limits) in the BP model
Prediction model Everything One value Each set fitted Error due topredicted known independently composition effects
la) BP ModelShrinkage 27.1" 21.7 8' 19'Basic creep 39.5 13.2 7' 32'Drying creep 26.8 15.8 8' 19fAll combined 31.7 17.3 8' 24f
(b) Present BP2Model (All) 38 10' 28'
(c) ACI 209 (All) 65 35' 30'(d) CEB 78 (All) 75 40' 35'
"From Ba2ant-Panula, 1978-79.Material parameters kept the same as for all sets combined.Material parameters adjusted to give best fit for the selected data.
d This is the intrinsic error due to form of creep and shrinkage law.e For 7 data sets; and 31.7 for 12 data sets (Ref 4).f Denotes very rough estimates.
culating Tables 1 and 2, the sameweight has been given to all samplingpoints uniformly distributed in log-time scales (in order to avoid possiblecriticism of a subjective selection ofuneven weights).
This bias works in favor of the ACIand CEB-FIP models rather than theBP and BP2 models whose broaderscope (very long creep durations, high
and very small ages at loading) is notadequately reflected in the values inTables 1(A) and 2. Nevertheless, de-spite this bias, the proposed modelstill comes out superior.
Compared to the BP model, theproposed model overestimates thecreep of very young concrete, al-though not as much as the ACI model,and its use therefore should be lim-
98
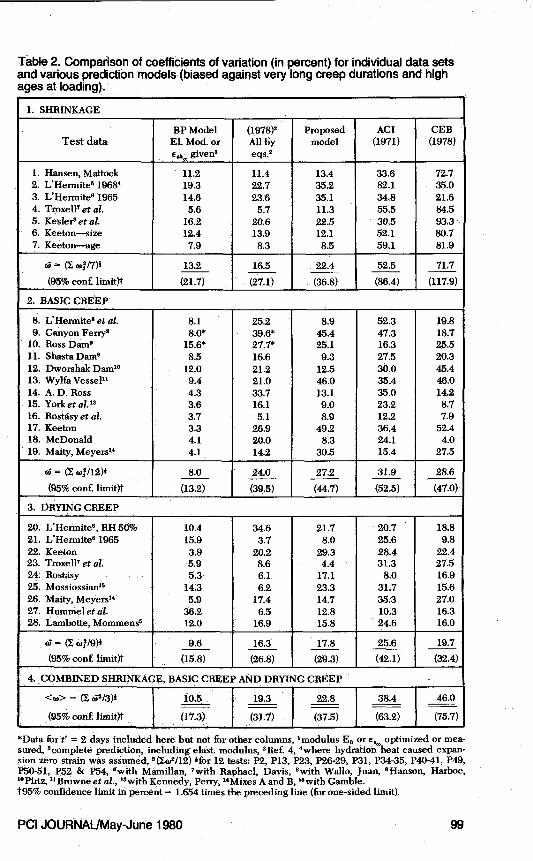
Table 2. Comparison of coefficients of variation (in percent) for individual data setsand various prediction models (biased against very long creep durations and highages at loading).
1. SHRINKAGE
BP Model (1978)$ Proposed ACI CEBTest data E1. Mod. or All by model (1971) (1978)
e,, given' eqs s
1. Hansen, Mattock 11.2 11.4 13.4 33.6 72.72. L'Hermitea 1968 19.3 22.7 35.2 82.1 35.03. L'Hermite° 1965 14.6 23.6 35.1 34.8 21.64. Troxell° et al. 5.6 5.7 11.3 55.5 84.55. Kesleere et al. 16.2 20.6 22.5 30.5 93.36. Keeton-size 12.4 13.9 12.1 52.1 80.77. Keeton-age 7.9 8.3 8.5 59.1 81.9
_ (£ w7/7) 13.2 16.5 22.4 52.5 71.7
(95% con£ limit)t (21.7) (27.1) (36.8) (86.4) (117.9)
2. BASIC CREEP'
8. L'Hermite° et al. 8.1 25.2 8.9 52.3 19.89. Canyon Ferry' 8.0* 39.6* 45.4 47.3 18.7
10. Ross Dam' 15.6* 27.7* 25.1 16.3 25.511. Shasta Dam9 8.5 16.6 9.3 27.5 20.312. Dworshak Dami° 12.0 21.2 12.5 30.0 45.413. Wy1fa Vessel" 9.4 21.0 46.0 35.4 46.014. A. D. Ross 4.3 33.7 13.1 35.0 14.215. York et al. 13 3.6 16.1 9.0 23.2 8.716. Rostasy et al. 3.7 5.1 8.9 12.2 7.917. Keeton 3.3 26.9 49.2 36.4 52.418. McDonald 4.1 20.0 8.3 24.1 4.019. Maity, Meyers 14 4.1 14.2 30.5 15.4 27.5
_ ( wJ/12)4 8.0 24.0 27.2 31.9 28.6(95% con£ limit)t (13.2) (39.5) (44.7) (52.5) (47.0)
3. DRYING CREEP
20. L'Hermite6, RH 50% 10.4 34.6 21.7 20.7 18.821. L'Hermite° 1965 15.9 3.7 8.0 25.6 9.822. Keeton 3.9 20.2 29.3 28.4 22.423. Troxell' et al. 5.9 8.6 4.4 31.3 27.524. Rostasy 5.3 6.1 17.1 8.0 16.925. Mossiossian18 14.3 6.2 23.3 31.7 15.626. Maity, Meyers" 5.9 17.4 14.7 35.3 27.027. Hummel et al. 36.2 6.5 12.8 10.3 16.328. Lambotte, Mommens° 12.0 16.9 15.8 24.6 16.0
cd = (Y. WI/9), 9.6 16.3 17.8 25.6 19.7(95% conf. limit)t (15.8) (26.8) (29.3) (42.1) (32.4)
4. COMBINED SHRINKAGE, BASIC CREEP AND DRYING CREEP
<w> _ (£ w'/3)+ 10.5 19.3 22.8 38.4 46.0
(95% con£ limit)t (17.3) (31.7) (37.5) (63.2) (75.7)
*Data for t' = 2 days included here but not for other columns, 'modulus E. or €, optimized or mea-sured, 'complete prediction, including elast. modulus, 'Ref. 4, 'where hydration heat caused expan-sion zero strain was assumed, 6 ((wr/12) }for 12 tests: P2, P13, P23, P26-29, P31, P34-35 P40-41, P49,P50-51, P52 & P54, ewith Mamillan, 'with Raphael, Davis, 'with Wallo, Juan, 'Hanson, Harboe,1°Pirtz, "Browneet al., "with Kennedy, Perry, "Mixes A and B, "with Gamble.t95% confidence limit in percent = 1.654.times the preceding line (for one-sided limit).
PC] JOURNAL/May-June 1980 99
LI Hermite and /Mamillan /^ / •
1965 / / •J
1 /`O ■
r •
J /
12dOY$
100 100
0.3
0.2
0.1
O
0CC
aiIT0C
U,
////L'Hermite and M6millon, 1968 //^/ //RH = 55% /^^% / .
/to =2 days of //^ O ^ _
--ACI ^`^o^ / a a 7g •
0•. °
0 0 •
4, •
. .!
•
10 100
Hansen, Mattock,1966 09).8 RH=50% 6 o 0°•
to = 8 days O'l' 0 • a o Oaaaa` O • o
o a , Cdr
).4 - °
i • i sealed
oIn - 10f) Ic]nn
0.6
0.5
0.4
0.3
0.2
1000 0.1
0
Troxell, Raphael, Davis, 1958* 0-0 to = 28 days ^•O 0
0ao
0 0).5 • _ --------
o • • --:__------- -i
On 100 1000
Basic Creep oWylfa Vessel Concrete, sealed--- ACI
CEB
o •
6095 1 ' —
a^
^^/ .o ^__ 40 i.
Ross 1953, /RH=93% / / /
).35
7:30 / / / s•
^i . ^^ •. Zed°yyO.25 i^o ■
i °i 6060 ^■• ^yy
a go o ■ on ■ Q o■ e
015
^I.Rostasy, Teichen, Engelke, 1971RH>95
0.9
0.8
0.7
0) 060
46- 0-5
- 0.4C
0.3
• 02
—D
0.30
0.25
0.20 i •Z
0.15IV IOU I IV IOU
t - t ' in days
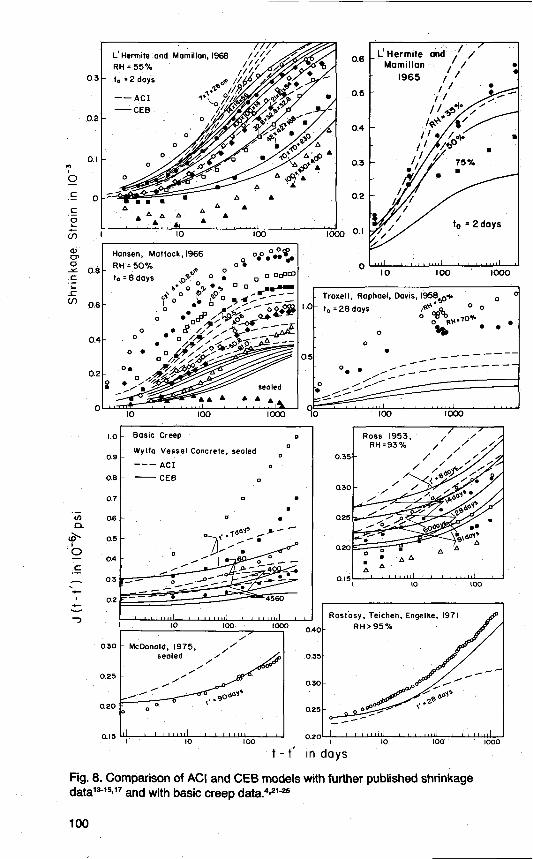
Fig. 8. Comparison of ACI and CEB models with further published shrinkagedata13-15,17 and with basic creep data.4,2145
100

Basic CreepL'Hermite, Mamillon, Lef4vre / /
1965, 1975 (sealed) / o
-----. 1'•7days / i//
65da • ^ e• 90doys p
°730 days p
D
e°
u.vl 5).1 I 10 100 1000
[.Ooo
Ross Dam(953, 1958 (sealed) a oz9 0
z8
IY•2daysz7
)b o
z5 r /
za • / _
^/ ^d%Ysi fGr--^'-b '/ 65 days
l2IV IW IVVV
0.7
0.6
0.5
0.4
0.3
Dworshak Dam, 1968 (sealed) 0000
o °
I'-1 aayo
3 dayso
o /o ^ j
.. 8do s /
90 days
CanyonFerry Dam,
1958 (sealed) p ^///e /
p //^r'•2aars
pi
p/ / T doYs i^ / '
•god. s a oP 365 day; '.,
IV IW
wool 0.001 0.01 0.1. I - 10 l00 Jo00 Shasta Dam, 1953, 1958 (sealed) 0°80o do
0.6
0.5_ York, Kennedy, Perry,. _ // ^.28aays///
1970 (sealedl //
^^ o 0.3 ^^^G^•'^ •36S dots.
- 0 0 0000
2645 VS ■ •^o o a 0 0 0.2 • • •■
O.1 1.0 10 100 1 10 100 1000
t -t' in days
Fig. 9. Comparison of ACI and CEB models with further basic creep data 4,14,'7-2°,26
PCI JOURNAUMay-June 1980 101

L'Hermite, Momillon, 1965
0RH•50%
o0.8
0.6
0.4
0.2
• L' Hermite, Momillan,Lefevre, 1965,1971 /
RH =50%
--ACI—CE8 o a° "^ w
•
001 0.1 I 10 - 100 1000
0.8
0.6
04
0.210 100 1000
0. 8 Meyers and Maity, 1970 mRH = 50% 0
0.7 0
0.6. o pO a
o /
04 B o /8 //
Troxell, Raphael, Davis, 1958 0 0 0
t: = 28 days °# •
0 •RN _ ? _ _ — — —
1.5Q
0)I 1.00
05
0.6
0.5
0.4
000Hummel, et al, 19620 00RH=65% o _—0o i
Ze polo ,/t o /
I 10 100o ° /
0.3/II
y iLambotte, Mommens, 1976 00
0.5
0.4
0.3
0.2
0.6 Concrete P26,,P29 00
o +29 /i
o ° 4 B a
0.1 I l 0 100 1000. I 10 y0O
t - t' in daysFig. 10. Comparison of ACI and CEB models with published data on creep atdrying. 14,15,17, 24, 27-29
ited to loading ages t' % 7 days. Theeffect of the age at loading is generallymore poorly represented in theCEB-FIP Model Code, and morepoorly still in the ACI model; forthese models, both the basic and dry-
ing creeps are much too high at highages of loading. Even though the rep-resentation of drying creep at smallloading ages is acceptable using theCEB-FIP Model Code, the effect ofloading age upon drying creep is not
102

Drying Creep• Keeton, 1965 0
Humidity Effect, small • •• Size Cylinders 3"x 9" o ,^Q
--ACI—CEB o •
oo /
Keeton, 1965- Humidity Effect
Medium Size Cylinders
0
o •a aNO /,ice
a
o h0 f//
3 ^ 1
1.0
0.9
06
0.7
0.6
0.5
0.4
0.8
0.7
0.6
Q5
04
Keeton, 1965 0Humidity Effect, large oSize Cylinders 6` z 18" •
0
o•4'• .0
o P^ --
. • /
.I ,Ito 100
Lambotte, Mommens, 1976 0.6Concrete P2, P52 and P54
o •07
06
05
04
In inn vv
Lambotte, Mommens,1976Concrete P13, P31 and P32 0
0
0
o ° a 2\ ^e D , i
o off' ry0/^ i'do /
9^
10 - 10o IOOC
Lambotte, Mommens, 1976 o °
Concrete P23, P40 and P41
°P\\
o •Qe
o y i^Q
° ^QC 20ao• ^^,
0a°^ a ^'
0
0.6 0.6
0.5 05
04 0.4
0.3 0.3
Q2 021 10 100 1000 I 10 100 100
t - t' in daysFig. 11. Comparison of ACI and CEB models with published data on creep at drying.16,27

JO
Table 3. Comparison of errors (95 percent confidence limits A,) and laboriousness (man-hours, T;) of structural analysis and creepprediction.
1. Error in structural analysis(internal torce, displacement,max. stress) due to method ofstructural analysis alone°
Method of structuralanalysis T, A,
A. Back of envelope '/sh 25%calculation°
B. Stat. determinate 3h 10%simplification(portal method)
C. Simplified stat. 6h 6%indeterminate
D. Slope-deflection 20h 4%method, momentdistribution, yieldline th., etc.
E. Frame program, 60h 2%finite elementprogram'
2. Error in structural analysis due to errorin creep properties alone
2a. Error in predicting 2b. Resulting error ofcreep properties structural analysisas such
bl. Creep sensi- b2. InsensitiveMethod of creep tive problem° problem°
prediction T2 D: Da A+
(a) CCA 78° ¼h 75% 75% 8%
(b) CEB 78 2h 70% 70% 7%
(c) ACI 209 1h 65% 65% 7%or' h'
(d) BP2 2h 40% 40% 4%
(e) BP 3h 30% 30% 3%or Y4hr
(f) BP, initial 3h 18% 18% 2%value known
52-page formulation of Cement and Concrete Association, England, 1978.°Assumes experienced analyst, no human error."For example, precast, simply supported beams made continuous; differential settlement; composite cross section; forces in midspan hinge of segmental bridge;creep buckling; shells.
°For example, stress distribution in a homogeneous frame, stresses in cracked cross section.'Chiefly input preparation, output interpretation.rif the creep prediction formulas are put on a computer.

well represented. The creep datawhich cover a wide range of loadingages (e.g., Wylfa Vessel concrete orDworshak Dam concrete) are not pre-dicted satisfactorily at all by the CEBand ACI models. The extremely largedeviations, exhibited by these modelsin many cases, appear neither in theBP model nor in the proposed model(except that the Wylfa Vessel data arefitted poorly by the proposed model).The fits by the proposed model repre-sent a compromise.
In comparison to the proposedmodel, the ACI and CEB models donot represent very well the overalltrend of the creep curves and espe-cially the basic creep curves; this,therefore, precludes the use of thesemodels for extrapolating short-timecreep data. At the beginning as well asat the end, the creep curves plotted inlog-time scales are much too flat.
In the case of the ACI mode1,2,3based on the work of Branson etal., 3032 one is at least rewarded bysimplicity. In fact, if for the sake ofsimplicity the curves for basic anddrying creeps are chosen to have thesame shape (i.e., to be mutually pro-portional), one cannot really do muchbetter than the ACI model. But, this isnot worth the penalty in error.Moreover, vertical scaling (multiply-ing by a constant factor) of the creepcurves to account for the size effect, asused by the ACI model, is not realis-tic.
Rather, the change of size shouldbe represented, according to the diffu-sion theory, by a horizontal shift of theadditive drying creep term rather thanby vertical scaling, and this procedureagrees with test results. Con-sequently, if vertical scaling is used,the long-time extrapolation of dryingcreep obtained for thin specimens isinevitably much too high, and forthick specimens much too low.
In general, the ACI and CEB mod-els work better for drying creep than
for basic creep. For the CEB ModelCode in particular, the overall be-havior within the available range ofdrying creep data is acceptable.(However, there exist too few dryingcreep data with loading ages outsidethe 28 to 90 days' range.) As for basiccreep, the ACI curves lie generallytoo high, and so do the CEB-FIPcurves, though to a lesser extent. TheACI model humidity dependencedoes not compare well with data; thedifference between h = 20 and 50percent is too small (see data ofKeeton and L'Hermite et al.). Forshrinkage, as opposed to creep, boththe ACI and CEB models are espe-cially far away from the data, whilethe proposed model is rather close. Inthe case of the CEB Model Code, thisis partly due to the lack of composi-tion (mix) factors, which confirms thatthe use of these factors is necessaryfor a good prediction of shrinkage.
The creep formulation from Refer-ences 33 and 34, which has been usedin the German Code DIN and alsoappeared in the preliminary version ofthe CEB-FIP Model Code, 35 wasfound in Reference 36 to be unsatis-factory and distinctly inferior in datafits to Branson's (ACI) model,2,3whereas the current CEB-FIP ModelCode' predicts creep overall some-what better than the ACI Model, al-though it is less simple. The substan-tial improvement is the result of mod-ifications proposed in Reference 36 inorder to compensate for the practice of"vertical shifting" of the creep curves5while displaying data fits. This im-provement, which is based on a com-puter optimization of fits of many testdata (summarized in Appendix A), hasbeen subsequently adopted for thefinal CEB-FIP Model Code' (in whichit however appears under a differentname). By means of Figs. 7-11 andutilizing the values for basic and dry-ing creeps in Table 1, we now demon-strate that this adopted modification of
PCI JOURNAL/May-June 1980 105

References 33-35 does indeed bringabout a rather significant improve-ment, mitigating part of the previouscriticism.
Nevertheless, as we see from thefigures and Tables 1 and 2, the CEB-FIP Model Code formulation' is stillclearly inferior in data fits (confidencelimits). It is also much more limited inscope than the BP model. 4 The proce-dure is not even simpler, although atfirst it might appear so because fewerformulas are used in the Model Code.This is partly because many functionsare defined by graphs (16 curves). Ifall the curves were defined by equa-tions, as in other models, the ModelCode formulation would appear morecomplicated than the BP model. Forcomputer programs, equations are ofcourse clearly preferable to graphs.Formulas are also advantageous forpredictions especially when usingmeasured short-time values of creep.
In discussing the deviations fromthe experimental data, we should ap-preciate the importance of avoidingthe subjective element in selectingthe test data with which we compareour model. When we make a totallyunbiased selection of test data (i.e.,random, by casting a dice), the re-sulting error of course should not sig-nificantly depend on the number ofdata sets used (unless this number istoo small, say six). However, any sub-jective judgment in selecting the datasets can be dangerously misleading.This is illustrated in Table 1(B). Forexample (see Reference 4), if amongthe 12 available shrinkage data sets4one selects the 8 best fitted data sets(which would certainly look to acasual reader as sufficient experi-mental verification), the confidencelimit obtained from comparing ourmodel to the test data drops from 52 to21 percent and if one fits these 8 datasets independently of those whichwere left out, it drops to about 13 per-cent.4 (It was for this reason that prac-
tically all test data which could befound in the literature were used inReference 4.)
With regard to extensions beyondthe range of available test data,theoretical and conceptual aspectsare, of course, very important too.For their critical analysis, otherworks 7' 9" 1°,41 are applicable.
Model Accuracy and ComplexityThe fact that an increase in accuracy
of prediction is inevitably accom-panied by an increase in complexity ofthe model prompts us to ask: Is theincrease in complexity worthwhile?The question must be viewed in con-text of the entire structural analysisprocess. The analysis of complex pre-stressed concrete structures is fre-quently performed by sophisticatedmethods (e.g., computer frameanalysis, finite elements and elasto-plastic methods), the error of whichmight be less than 2 percent, whereasthe creep and shrinkage strains, whichare several times larger than the elas-tic strains, are usually predicted bymodels whose error exceeds 65 per-cent with a 10 percent probability andis much larger than the error instrength. Such an approach makes lit-tle sense. Optimally, the effort spenton various tasks in the structuralanalysis process should be commen-surate with the expected accuracygain due to refinement of that task. Arough illustrative comparison of thistype is attempted in Table 3. Althoughthe precise values in this table may bedisputed, they nevertheless give ageneral idea of the problem. It is ap-parent from this table that none of theexisting methods for creep predictionis too complicated for all but creep-in-sensitive structures.
Errors Stemming from Creep Lawand Composition Effects
What is the main source of error—is
106

it the form of the creep and shrinkagelaws or the material parameters in-
volved?-Decidedly the latter. Table1(C) shows that for our model the lat-ter source causes about three-quartersof the total prediction error. The in-trinsic error of the creep and shrink-age laws was determined by fittingthe data set for each concrete inde-pendently of others, which was donein References 10 and 11. It is solelythis type of experimental verificationwhich should be used to judgewhether the chosen form of creep andshrinkage law is good. 1011 The BP andpresent models appear in such com-parisons far superior to any otheravailable model.10"11
If we do not determine the bestmaterial parameters for given concretebut predict them from strength andcomposition, the error increases. Un-fortunately, this increase, which rep-resents the error due to compositioneffects, is comparatively very large forall models [see Table 1(C)]. Despitemuch effort, our formulas for predict-ing the material parameters fromcomposition are apparently not toogood, and obviously there is muchroom for further research.
When the composition error is muchlarger than the intrinsic error of the.creep law, as is true of our model incontrast to other models, a great im-provement of prediction must resultwhen even one short-time (or initial)value is measured. The improvementis found for our model to be indeedsignificant. For example, Reference 4and Table 1(C) shows that the errordrops on the average to one-third inbasic creep and to two-thirds in dryingenvironment. Note that for a creep lawwhose intrinsic form is not too realis-tic (theoretically unfounded, as insome other models), the improvementbased on one measured value is rela-tively much less significant. It is herewhere the main advantage of the pro-posed model lies.
Prediction Improvement if aShort-Time Value is Known
The improvement on the basis of ameasured short-time value can beachieved easily only if the creep andshrinkage laws are defined by for-mulas rather than graphs, and if theseformulas can be inverted to allow asimple calculation of material param-eters. The proposed model, like theBP model and unlike the CEB 78model, makes this possible, as we willnow demonstrate.
We should note that, to minimizethe error, the measured short-timedeformation value should be deter-mined as an average from severalspecimens. Moreover, the averageshould be taken, if possible, only afterthe time curve of each specimen issmoothed in the vicinity of the chosenshort time (e.g., 10 minutes, or 1 day).
Assume we know the value ofe8h°),corresponding to some time t (not too
short, though, t> T h/3), time t° , andsome D, h and k3. We may then pro-ceed as follows:
First, calculate C,, T1h , k h , S fromEqs. (3) to (5).
Then, solve e8h = Egn°) /k hS fromEq. (1).
Now, using this value of e8^,, we canthen calculate esh for other values of t,t 0 , D, h and ks, obtaining a farsuperior prediction, much better thanthat in Figs. 1 and 2. Obviously, byacquiring a single measured shrinkagevalue, we can disregard the composi-tion parameters altogether.
Still closer predictions are possibleif two shrinkage values e shl) and €,2)for two sufficiently different valuest(1), t (2) (say t (2) % 3Tsh, t (1) "'r h/2), andpossibly also for two different h (, ) , hu)and D (, ) , Da ) , are measured. We thendiscard Eqs. (6) and (5) for e$h„ and C,and calculate:
1 t(2) – At(1)C 2 (t0 ) A(ksD (1))2 – (ksD(2))2
(15a)
PCI JOURNAUMay-June 1980 - 107

t (2) Es (1) k h 2
`2) (15b)A = tcv E sA2) kh(1)
T, (1) ks D2 (y= (15c)C1(to)
Tg (2) = kSD2cz) (15d)C1(to)
S(i)=t(j) (15e)
Tsh + t(i)
Sn) =czt(2) (151)
Tsh + t(2)
E s (2) __ Eshl)E8^^ = kh2)S(2) k(I)Sci)
(15g)
From the above equations we canpredict e sh (t,to) for any other case.
Basic CreepIf the elastic modulus or some
short-time strain value is known, theprediction accuracy approximately tri-ples.4 Assume we know the value ofthe conventional static modulus,which is here obtained as J att – t' = Ot = 1 day, i.e.,
E (t') = 1/J (t' + A t, t' )The following procedure can then
be used:1. Evaluate cp,, m, n and a from Eq.
(9).2. Substitute these values along
with) (t' + At, t') = 1/E (t').and t – t' = At into Eq. (8) and solvefor E0:
E o = E(t')[1+ rp 1 (t'-"'+ a)Otn](16)
where Atn = l= 1.
3. Using this E 0 value instead ofthat found from Eq. (9), substantiallybetter predictions of J (t,t') at any tand t' can be obtained, much betterthan those in Figs. 3 and 4.
If we also measure one short-timecreep value J„ e.g., for t – t' = t2 = 14days, t' = 28 days, we further improvethe prediction:
1. Calculate m, n and a from Eq.(9).
2. Write Eq. (8) twice, once for) atthe aforementioned times, and oncefor 1/E as before; this yields a systemof two linear equations for 1/E 0 and(p,/E0:
+ (t' -" + a) At ' = E (17a)E 0E0
1 + (t' -- + a)q P' = Jl(17b)Eo Eo
3. Solving 1/E 0 and (p 1 /E 0 , we canthen predict J(t,t') for any t and t'from Eq. (8).
Other alternatives of course, arepossible. For example:
1. Use Eq. (9) to get 11E 0 , m and a.2. Noting that log Co = n log
(t –t') + log[(t'-m + a),p l /E 0 ], writethis relation for Co = (1/E) – (1/E0)and for Co = J1 – 1/E 0 (with t – t' = t2= 14 days):
nlogAt+ log Eo=log(_ E )\ o
log(t'-m + a) (18a)
1nlogt2 + log `p =log J 1 -- –
Eo Ea
log(t'-m + a) (18b)
which is a system of two linear equa-ions for n and log (4, 1 1E 0 ). Solvingthem, we can obtain n and ,IE0,upon which we can predict J (t,t') forany time t' and t from Eq. (8).
108
The latter prediction will normallydiffer somewhat from the previousone [Eq. (17)]. It may, however, beadvisable to carry out both predictionsto get an idea of the range to expect.Various other alternative proceduresare possible, too, but they requiresolving transcendental equations.
Drying CreepIf we can measure the value of
J(t,t') for some relatively small t – t'value (perhaps t – t' % r,,/10) andcertain parameters t', to , D, h, ks, wecan again greatly improve the accu-racy:
1. Calculate Eo, ^p 1 , m, n and a fromEq. (9) and also k,, S,(t,t') from Eqs.(12) and (13), and Co (t,t') from Eq. (8).
2. Then solve C,(t,t' ,to ) for these t,t' and to values from Eq. (10), and alsosolve the (p d value from Eq. (11)._ 3. Now use this (p d value, instead ofBpd from Eqs. (12) and (14), to calculateJ(t,t') for any other t, t', to , D, h andk, greatly improving the accuracy andat the same time eliminating the needfor composition parameters.
Further accuracy is possible if we,in addition, have the experimentalelastic modulus E (e.g., for t – t' = 1day). Then we do not need to estimateE. from Eq. (9), as above, but insteadwe can calculate it from Eq. (8), as incase of basic creep. We then proceedusing Steps 1, 2, 3 as described above.
It is interesting to note that by hav-ing some measurements we can disre-gard the composition parameters inthe BP model.4 For this, we need toknow the measured values of: (1)shrinkage at two different times orthicknesses, (2) elastic modulus andone short-time basic creep value (for,say, t –t' = 7 days) to predict basiccreep, and (3) elastic modulus and twocreep values to predict drying creep.
It is also worth mentioning that, be-cause graphs are employed rather thanformulas, the CEB-FIP model be-
comes too cumbersome to use effec-tively when a measured short-timecreep value or two shrinkage valuesare given.
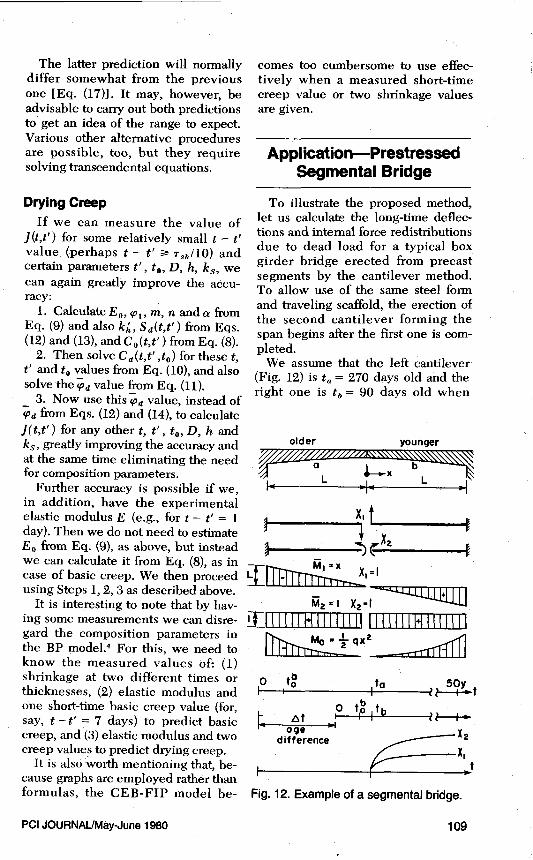
Application—PrestressedSegmental Bridge
To illustrate the proposed method,let us calculate the long-time deflec-tions and internal force redistributionsdue to dead load for a typical boxgirder bridge erected from precastsegments by the cantilever method.To allow use of the same steel formand traveling scaffold, the erection ofthe second cantilever forming thespan begins after the first one is com-pleted.
We assume that the left cantilever(Fig. 12) is t4 = 270 days old and theright one is t, = 90 days old when
X,
IIIIIIAIII•I•II IIIIIIICIIIIIII
aI.-, fT--i 2 5i t
bt 10 t o, t^-rt b--i 2--1►
age X2difference
X,t
Fig. 12. Example of a segmental bridge.
PCI JOURNAL/May-June 1980 109

they are joined at midspan. The join-ing is continuous or by a hinge. Thecantilevers are connected without anyjacking, and so the force in the joint iszero at the beginning. For simplicitywe assume that both cantilevers arefixed at their ends.
Although our proposed method isapplicable to varying ages of concretealong the span, we assume that withineach cantilever the age is uniform inorder to abbreviate the length of cal-culations. In practice, the dead weightincreases gradually as the cantileversgrow, but for the sake of simplicity weconsider that all dead weight isapplied at once, when the concrete ist' = 60 days old. We further assumethat the dead load is uniform withq = 140 kN/m.
Each cantilever is 48 m long(span = 96 m). The centroidal mo-ments of inertia of the cross sectionsspaced at intervals Ax = 12 m, begin-ning at midspan, are I = 2.52, 4.27,10.9, 28.3, and 64.2 m 4 . (These valuesare taken from first author's design ofthe bridge over Vltava at Hladna,Czechoslovakia, in 1961.) We assumeour bridge is built of concrete of 6000psi (6 ksi) standard cylindricalstrength, water-cement ratio 0.42, andsand-gravel-cement ratio 2.1:2.7:1. Letus now go to the detailed calculations.
From Eq. (7):
E
=- [ 1.254.. 8+0.5( 2:i) ]x
1+2.1 1113_ 12=5.0030.42 J
From Eq. (6):
y = (390 x 5.003-' + 1) = 0.616
e,h _ (1330 - 970 x 0.616) x 10-6= 732 x 10-6
From Eq. (9):
1/E0 = (0.1 + 0.5/0.62 ) x 10-8 (19a)= 0.1139 x 10⁻⁶/psi
(p 1 = 0.3 + 15/61.2 = 2.047 (19b)m = 0.28 + 6-2 = 0.3078 (19c)n = 0.115 + 0.0002 x 6 3 = 0.158
(19d)a = 0.05
(19e)
As for the effects of drying we willassume, again for the sake of simplic-ity, that all segments of the girder are0.35 m thick (D = 350 mm, ks = 1),drying on both surfaces in an envi-ronment of 65 percent relativehumidity (h = 0.65), and that the ex-posure to the environment beginswhen the concrete is 7 days old(to = 7 days). From Eqs. (1) through(5):
C, (to ) = 2.4 + 120/ f7= 47.76 (20a)k h = 1 - 0.653 = 0.725' (20b)T, = (1 x 350)2/47.76 = 2565 days
(20c)
The bridge is to be designed for thelife span t i = 50 years (i.e., 18263days). Then:
t = t 1 - to = 18,263-7 = 18255 daysand
S(i) = (1 + 2565/18255)-1= 0.9364(21a)
e 3h (t,to ) = 732 x 10-6 x 0.7254x 0.9364 (21b)
= 497 x 10-8
From Eq. (8):
E (60) = J(60+ 1,60Y' (22a)= {0.1139E1 + 2 .047(60-0.3078 +
0.05) x 10.158]}-1= 5.216 x 10⁶ psi
E (90) = {0.1139[1 + 2 .047(90-0.3078 +0.05) x 10.1581}- 1 (22b)5.437X 10⁶ psi
E (270) = { 0.113911 + 2.047(270-0.3078+ 0.05) x 10 .158 1}-1 (22c)
=5.982 x 10⁶ psi
110
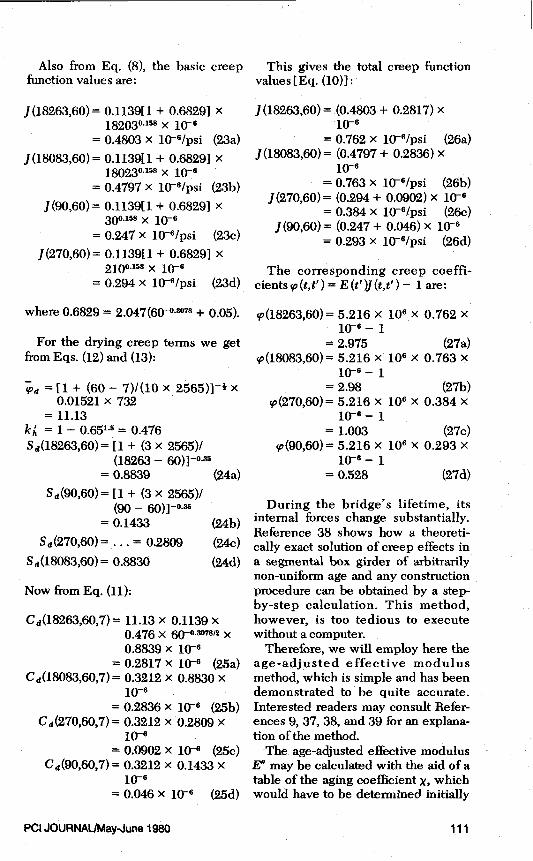
Also from Eq. (8), the basic creep This gives the total creep functionfunction values are: values [Eq. (10)]:
J(18263,60)= 0.1139[ 1 + 0.6829] X182030.15$ x 10-6
= 0.4803 x 10- 6/psi (23a)
J(18083,60) = 0.1139[ 1 + 0.6829] x180230.158 x 10-6
= 0.4797 X 10⁻⁶ /psi (23b)
J(90,60)= 0.1139[ 1 + 0.6829] x300.158 x 10-°
= 0.247 X 10⁻⁶/psi (23c)
J(270,60)= 0.1139[ 1 + 0.6829] x
J(18263,60)= (0.4803 + 0.2817) x10-6
= 0.762 x 10⁻⁶ /psi (26a)J(18083,60)= (0.4797 + 0.2836) x
10-6= 0.763 x 10⁻⁶/psi (26b)
J (270,60) = (0.294 + 0.0902) x 10-6= 0.384 x 10-°/psi (26c)
J (90,60) = (0.247 + 0.046) x 10-°= 0.293 X 10⁻⁶/psi (26d)
210° •1S8 X 10-6 The corresponding creep coeffi-= 0.294 X 10⁻⁶/psi (23d) cients cp (t,t') = E (t' )J (t,t') - 1 are:
where 0.6829 = 2.047(60- 0.3078 + 0.05).
For the drying creep terms we getfrom Eqs. (12) and (13):
fpa = [1 + (60 - 7)1(10 x 2565)]- t x0.01521 x 732
= 11.13= 1 - 0.651.5 = 0.476
Sa(18263,60)= [1 + (3 x 2565)/(18263 - 60)] -0.35
= 0.8839 (24a)
S d (90,60) _ [ 1 + (3 x 2565)1(90 - 60)] -0.350.1433 (24b)
S d(270,60) = ... = 0.2809 (24c)S d (18083,60) = 0.8830 (24d)
Now from Eq. (11):
C d(18263,60,7)= 11.13x 0.1139x0.476 x 60-0.a07e!2 x0.8839 x 10-6
= 0.2817 x 10⁻⁸ (25a)C d (18083,60,7)= 0.3212 x 0.8830 x
10-6= 0.2836 x 10⁻⁶ (25b)
C d (270,60,7)= 0.3212 x 0.2809 x10-6
= 0.0902 X 10⁻⁶ (25c)Ca(90,60,7) = 0.3212 x 0.1433 x
10-6= 0.046X 10⁻⁶ (25d)
(p (18263,60) = 5.216 x 10 6 x 0.762 x10-6 -1
= 2.975 (27a)('(18083,60)= 5.216 x 10 6 x 0.763 x
10-6 - 1
= 2.98 (27b),p(270,60) = 5.216 x 106 x 0.384 x
10-6 - 1
= 1.003 (27c)ç(90,60) = 5.216 x 10 6 x 0.293 x
10-6 - 1
= 0.528 (27d)
During the bridge's lifetime, itsinternal forces change substantially.Reference 38 shows how a theoreti-cally exact solution of creep effects ina segmental box girder of arbitrarilynon-uniform age and any constructionprocedure can be obtained by a step-by-step calculation. This method,however, is too tedious to executewithout a computer.
Therefore, we will employ here theage-adjusted effective modulusmethod, which is simple and has beendemonstrated to be quite accurate.Interested readers may consult Refer-ences 9, 37, 38, and 39 for an explana-tion of the method.
The age-adjusted effective modulusE" may be calculated with the aid of atable of the aging coefficient X, whichwould have to be determined initially
PCI JOURNAL/May-June 1980 111

for our creep function. We may, how-ever, dispense with a table of .X andcalculate E" as:
E"(t,t')= E(t')- R(t,t') (28)'p(t,t' )
where R (t,t') is the relaxation func-tion, for which recently a general andfairly accurate approximate formulahas been established:40
R (t, t') = 0.992 - 0.115
J(t,t') J(t,t- 1)x
J (t' +,t') - 1) (29a)J(t,t - e) 1
where f = (t-t' )/2 (29b)
To use Eq. (29) we need to knowthe following additional values, cal-culated similarly as before:Fort = 18083, t' = 90:
Jb (t + e,t') = 0.409 X 10⁻⁶ /psi (30a)
where= 8996days,Jb=E0' +C 0 =part off due to basic creep [ Eq. (10)] ;
(p= 11.12,S d = 0.8055,C d = 0.243 X 10⁻⁶/psi (30b)
J (t' + e,t') _ (0.409 + 0.243) x 10-6= 0.652 X 10⁻⁶/psi (30c)
Jb (t,t - e)= 0.2225 X 10⁻⁶/psi (31a)(p d = 9.5709, S d = 0.80548,
C d = 0.1028 x 10- 6/psi (31b)J(t,t - 6) = (0.2225 + 0.1028) x 10-6
= 0.3253 X 10⁻⁶ /psi (31c)
Fort = 18263, t' = 270:
J b (t' + e,t') = 0.3395 x 10- 6/psi (32a)(p d = 11.08, S d = 0.8093,C d = 0.2054 x 10⁻⁶ /psi (32b)
J (t' + e,t') = (0.3395 + 0.2054) x 10-6= 0.5449 X 10⁻⁶ /psi (32c)
Jb (t,t - C)= 0.2221 x 10⁻⁶/psi (33a)(pd = 9.546, S = 0.8055,C d = 0.1022 X 10⁻⁶ /psi (33b)
J(t,t - e) = (0.2221 + 0.1022) x 10-6= 0.3243 X 10⁻⁶ /psi (33c)
112
Fort = 18,063, t' = 90:
Jb (t,t' )= 0.4432 x 10⁻⁶/psi (34a)
PPd = 11.188,5 4 = 0.8828,C d = 0.2662 x 10⁻⁶/psi (34b)
J (t,t') = (0.3243 + 0.2662) x 10-6= 0.5905 x 10⁻⁶/psi (34c)
Fort= 18263; t' = 270:
Jb (t,t') = 0.3644 x 10- 6/psi (35a)(p d = 11.08, S d = 0.8828,C d = 0.2240 x 10⁻⁶/psi (35b)
J (t,t') = (0.3644 + 0.2240) x 10-6= 0.5884 x 10- 6/psi (35c)
For t = 18263, t' = t - 1:
J b (t,t') = 0.1369 x 10⁻⁶/psi (36a)Bp d = 8.512, S d = 0.04363,C d = 0.00445 x 10⁻⁶/psi (36b)
J(t,t') = (0.1369 + 0.00445) x 10-s= 0.1414 x 10⁻⁶/psi (36c)
Fort = 90,t' = t - 1:
Jb (t,t') = 0.1841 X 10⁻⁶/psi (37a)cpd = 11.12, S d = 0.04363,Cd = 0.01318 x 10⁻⁶/psi (37b)
J(t,t') = (0.1841 + 0.01318) x 10-6= 0.1973 x 10⁻⁶/psi (37c)
Fort= 270, t' t - 1:
J,(t,t') = 0.1672 x 10⁻⁶/psi (38a)'Rd = 11.08, S d = 0.04363,
C d = 0.0111 X 10⁻⁶/psi (38b)J (t,t') = (0.1672+ 0.0111) x 10-6
= 0.1783 x 10⁻⁶ /psi (38c)
Now, from Eq. (29):
R (18263,270) = (0.992/0.5884) -(0.115/0.1414) x[ (0.5449/0.3243) - 1]
= 1.133 x 10⁶/psi (39a)R(18083,90)= ... = 0.5813 x 10⁶/
psi (39b)E Q' = E" (18263,270)
= (5.982 - 1.133) x 106/2.52= 1.924 x 10⁶/psi (39c)
E' = E" (18083,90)= 1.704 x 10⁶ /psi (39d)

Note that the corresponding agingcoefficients, which are used in Refer-ences 9, 38, and 39 but are not neededhere, are (E – E")/E" 0 or 0.849 and0.770.
After joining the cantilevers atmidspan, there are two statically in-determinate forces at midspan: shearforce X 1 and bending moment XE.
Note that for a hinge connection,Xz = 0; see Fig. 12. Using the princi-ple of virtual work and evaluating theintegrals by Simpson's rule, we obtainthe following elastic flexibilities:
S i lo =84 = I E'M' dx= Lx 0+
4 + 2122 242 +4 362 +4.27 10.9 28.3
48264.2)
= l 9 r 1 l(40a)
– S 12 = S 12 = f MEME dx = 3E 1 0 +
4 12 + 2 24 + 4 36 +4.27 10.9 28.3
48 )64.2J
= 85.92[ m 1(40b)
2J
S22 6 2
(0+_-i.+ 3E
2 + 4 + 110.9 28.3 64.2
= 5•'°9
I m I (40c)L 3J
Si=-6L'= frcI1ML
dx =q OxEI 3E
0+412x 72 +2
24x 288 +4.27 10.9
4 36x 648 + 48 x 1152)28.3 64.2
= 24950E (40d)
2= E =-q Ox/ 72S S 3E1 0+ 44.27+
2-- 288 + 4 648 + 1152 110.9 28.3 64.2)
= 919.3--1 1 (40e)
In the above equations, the indicesa, b refer to the left and right cantilev-ers; E = elastic modulus; M l , M2bending moments due to X, = 1 at XE
=0, and to X 2, = 1 at X, = 0; M L =
bending moments due to load q for X 1
= X 2 =0; Si, SQ = deflections due toload q in the direction ofX, and X2.
Note that here, similar to treatingcreep, we neglect the effect of rein-forcement which is relatively small.To account for it one would have tocalculate the transformed sectionproperties for various moduli E" (t,t' )and E (t') for concrete.
We must now write the conditionsthat the deformation increments in thedirection ofX I and X 2 from the time ofjoining to 50 years must be zero. Ac-cording to the age-adjusted effectivemodulus method they read:38
(aaE/ "+S EIE")X 1 +
(S a E/Ea' + a I E/Eb')X 2 +(Si Zcp a + S; dpb )E/E(60)= 0 (41a)(8 E/Ed' + SE1 E/E 1flX 1 +(SE2 E /E Q' + 822 E /E a') X 2 +(ss ^^Pa + sz O(P8) E/E (60) = 0 (41b)
PCI JOURNAUMay-June 1980 113

Since '(p a = (p(18263,60) –(p (270,60)
= 2.975 – 1.003= 1.972 (42a)
O(p b = (p(18083,60) – (p(90,60)= 2.98 – 0.528 = 2.452
(42b)
We now have:
10-6[ (1.924- 1 + 1.704- 1 )1839 X,/m +(-1.924-' + 1.704 1 )85.92X2/m 2 +(1.972 – 2.452)24950 q/5.216] = 0
(43a)10-s[ (- 1.924-1 + 1.704-1 )85.92 Xt/m+(1.924- 1 + 1.704 1 )5.109X Q/m 2 -(1.972 + 2.452)919.3 q/5.216] = 0
(43b)or2035X, + 5.766 X 2 = 2296[m2 I q (44a)5.766X 1 + 5.654X 2 = 780.0[m2]q
(44b)
From the above, we can solve forthe desired force and moment:
X, = 0.740q[m ] = 103.6 kN (45a)X 2 = 137.2q[m] = 19208 kNm (45b)
It is interesting to note that, relativeto the end moment due to self weightfor the case of no connection atmidspan, the moment ± (48m )X 1 dueto X 1 represents ±3.1 percent and X2represents 11.9 percent, causing themaximum change of the fixed-endmoment to be 15.0 percent from join-ing to 50 years. A creep effect of thismagnitude is certainly significant.
For an elastic structure upon whichthe load is applied after the final stat-ical system (i.e., a system with a con-nection at midspan) is established, wewould find X 1 = 0, X 2 = 179.9q[m2].We should note that the value of themidspan momentX2 due to creep is 76percent of this elastic value ofX2.
The deflection of the older can-tilever at midspan at time of joining is:
A, = 81 (p(270,60) where S; is based
on E = E (60 days). Consequent-ly:
A l = (24950/5.216 X 106 psi) X 1.003= 0.0006957q[m 2/kN] = 0.0974 m
(46)
The deflection from the instant ofjoining to 50 years may be calculatedas:
A2 = (6 ,,X , + 6 isX2) E/EQ' +Si A( E/E (60)
= (1839 x 0.740 – 85.92 x137.2q )/(1.924 X 106 ) psi +24945q X 1.972/(5.216 X 10)
= 0.000582q/kN = 0.0814 m (47)
This value gives the total deflectiondue to self weight:
Al+A2=0.0974+0.081=0.178m
Furthermore, one would have tocalculate in a similar manner the val-ues X,, X Q and deflections due tocreep produced by the prestress.These tend to offset the above valuesand one may even obtain a designwhere they almost cancel each other.However, because of the statisticalvariability of each effect, it would beimprudent to rely in design on such"almost canceled values," as has oftenbeen done.
For comparison, if there were ahinge rather than a continuous con-nection at midspan, we would have:
X Q = 0 and 2035X, – 2296q[m 2 ] = 0or
X, = 1.128q[m] = 158.0 kN
The corresponding moment(48m)X 1 represents as much as 4.7percent of the fixed-end moment forno connection at midspan, i.e., almost1½-times as much as the 3.1 percentvalue found before, but about 3-timesless than the total maximum change of15.0 percent computed previously.
Also for comparison, if there were a
114

hinge at midspan the deflection fromjoining to 50 years would be
A2 = 6 i X,E /Ea' + Otp a8 E/E(60)_ (1839 x 1.128)/1.924 x 106 psi +
(24945 x 1.972)/5.216 x 106 psi= 0.00152q/kN = 0.21 m (48)
This deflection is 2.58-times largerthan that for a continuous connectionat midspan. The change of slope inthe younger cantilever at the midspanhinge from the moment of joining to50 years would be:
0 2 = S QX I E /Eb' + b82 E/E(60)= (85.92 x 1.128q .)/1.704 X 106 psi
+ (919.3 x 2.452)/5.216 x 10 6 psi= 0.0099 radians = 0.57 deg (49)
A somewhat smaller but oppositerotation occurs at the hinge in theolder cantilever, causing relative rota-tion of more than 1 deg due to deadload. This rotation is reduced by creepcaused by the prestress. Nevertheless,it is probable that a fast passage of aheavy truck at this change of slopemay cause non-negligible vibrations.For this reason, and even more so be-cause of the much larger deflections,it is imprudent to design the segmen-tal bridge with hinges at midspan.Rather, one should always use con-tinuous connections, even though onemust then provide extra reinforcementor prestress to resist the positivemidspan moment X 2 . The reasons foravoiding the hinge become compel-ling if one considers the statisticalvariability of creep effects, currentlyignored in codes and design practice;and we should now add some com-ments on this problem.
Although this is not done in prac-tice, the designer should also calcu-late the 95 percent confidence limitson the foregoing creep effects. Basedon the information supplied in thispaper and Reference 4, this can bedone for the overall statistical varia-bility of concrete properties in thebridge.
To obtain these limits we considerall the preceding J-values to be 29percent higher (see Table 1) and re-peat all the calculations obtainingupper confidence limits onX ; ,X Q , anddeflections. Then we assume them tobe 29 percent lower and repeat allcalculations, obtaining the lower con-fidence limits. The effects of creepdue to the prestressing forces (plusthe effects of shrinkage) can be calcu-lated in a similar manner, and theirupper and lower confidence limitsshould be also established.
We must be aware, however, thatwe do not currently have a firm un-derstanding on the statistical differ-ences in creep between the upper andlower fibers of the cross section andbetween the left and right cantilevers.These statistical variations, which un-doubtedly represent important causesof excessive deflections observed inconcrete structures, are not mutuallyindependent, and therefore the confi-dence limits for their differences mustbe less than those deduced on thebasis of Table 1. Thus, one needs toobtain information on joint probabilitydistributions within the cross sectionof the errors of creep in the upper andlower fibers of the section. Further re-search in this area is needed here.
Errors in the prediction of prestressloss are likewise very important. Forexample, we may have, as the meanprediction, a downward deflection of20 cm due to self weight, and an up-ward deflection of 18 cm due to pre-stress, giving a net mean deflection of2 cm. But if there is a 10 percent errorin prestress, we have a downward de-flection of 20 – 18(1 – 0.1) = 4 cm.Hence, we see that a 10 percent errorin prestress loss causes a 100 percenterror in the net deflection. It is wellknown that a small difference of twolarge numbers is much more inaccu-rate than the numbers themselves,and the designer must be carefulabout this potential error.
PCI JOURNAUMay-June 1980 115

Conclusions
1. Compared to the previous BPmodel,' the proposed model repre-sents a simplified method for pre-dicting creep characteristics whichuses more limited material propertiesbut fits test data less closely.
2. In terms of test data fits, the pro-posed model is the best one availablefor predicting the basic creep solelyon the basis of concrete strength. Thisis useful when the designer has noidea of the concrete mix to be used.
3. Shrinkage cannot be satisfactor-ily predicted without using somecomposition parameters, and the de-signer must make at least a rough es-timate of the composition to be used.
4. Because drying creep is alwaysaccompanied by shrinkage, it is betternot to use a simpler (and a less accu-rate) formula for predicting it solelyon the basis of strength.
5. If we measure one short-timeshrinkage value (an average from sev-eral specimens), we can, however,generally predict shrinkage withoutusing composition parameters, andwith much better accuracy.
6. If we measure the value of theelastic modulus we can greatly im-prove the prediction of creep. Thesame is true if we measure one short-time creep value (average).
7. If we measure one short-timevalue of drying creep (average), wecan generally predict drying creepwithout using composition parame-ters, and more accurately.
8. Explicit formulas for improvedprediction based on two measuredshort-time values (average) are possi-ble with the proposed model (includ-ing also the ACI model). However,models defined by graphs (e.g., theCEB-FIP method) are unsuitable forthis purpose, and inconvenient forcomputer programs.
9. The proposed model compares
distinctly better with test data thanthe ACI model as well as .the newCEB-FIP Model Code (Table 1). Itrepresents more of a compromise andnever exhibits the very large devia-tions from some data as seen with theother two models. Moreover, thescope of the model is much broader.The improvement is greatest forlong-time creep and higher ages atloading.
10. The earlier BP model, whichfits the test data far better than theACI model and the CEB-FIP model,is preferable to the present modelwhen the composition of concrete isknown.
11. The order of decreasingsimplicity appears to be (a) Branson's(ACI 209) model;2.3 (b) the proposedmodel, and the CEB -FIP ModelCode,' and (c) earlier BP model.4Branson's (ACI 209) model, whensuggested about a decade ago, repre-sented the best possible model at thattime, and it still remains nearly thebest that can be done with the samedegree of simplicity and under theconstraint of using the same timeshape for both basic and drying creepcurves. Nevertheless, this simplicity isnot worth the error in view of thegreat improvement achieved by theproposed model and especially theearlier BP model.
12. The CEB model fits shrinkagedata less well than the ACI model butin fits of creep data it is somewhatbetter (Table 1), even though the cur-rent German Code DIN on which it isbased is poorer. This was achieved bythe adoption of a modification 36 inwhich a corrective initial term wasdetermined by computer optimization.
13. The CEB-FIP and ACI modelsshow much larger, and often unac-ceptable, errors, especially in cases ofshrinkage, and the effects of humidity,size and curing period on shrinkage orcreep. This is mainly because thesephenomena are not modeled on the
116

basis of diffusion theory but are de-rived empirically.
14. The general trend and shape ofthe creep and shrinkage curves in theproposed model, as well as the effectof loading age, are much more realis-tic than in the ACI or CEB-FIP mod-els. This is important especially forextrapolations beyond the range ofavailable test data.
15. The preceding point is corrobo-rated by the fact that the error im-provement for the proposed model,compared to the ACI and CEB mod-els, is much more marked when testdata for one particular concrete arefitted independently. The proposedmodel achieves much more improve-ment in the form of creep and shrink-age laws than it does in predictingmaterial parameters from strength andcomposition of concrete. However,a possibility of further improvementin this area exists.
16. For experimental verification ofa creep prediction model it is ex-tremely important to avoid any sub-jective element in choosing the testdata. By omitting four worst data setsamong twelve, the coefficient of vari-ation may drop to as low as one quar-ter.
17. The coefficients of variation and95 percent confidence limits estab-lished here (Tables 1 and 2) enablethe designer to determine the statisti-cal parameters of the distribution ofdeflections, shrinkage stresses andstrain redistributions in the structuredue to creep, prestress losses, andother causes. The statistical variationof these effects is neglected in currentpractice but is actually much largerthan the statistical variation ofstrength for which the current codesroutinely account.
18. None of the creep predictionmodels proposed so far are too com-plicated for a creep-sensitive structureif one compares the analyst's timeneeded to calculate creep coefficients
to that he routinely spends on struc-tural analysis and considers the errororiginating from these two tasks.
19. The proposed model BP2 is ad-vocated for consideration by code-preparing bodies as a basis for an im-proved practical prediction method tobe used for creep-sensitive structureswith normal concretes of strength3000 to 6000 psi when a good estimateof concrete composition is not avail-able. The earlier BP model4 should beused, however, for all structures ofhigh creep sensitivity, and generallywhenever the concrete compositionused is already known, because thegain in accuracy outweighs the in-crease in complexity. That model isalso valid over a broader range ofstrengths and times.
PCI JOURNAL/May-June 1980 117

REFERENCES1. CEB-FIP Model Code for Concrete guthai, W., "Practical Formulation of
Structures, Commite Eurointerna- Shrinkage and Creep of Concrete,"tional du Beton—Federation Inter- Materials and Structures (RILEM,nationale de la Precontrainte, CEB Paris), V. 9, No. 54, 1976, pp. 395-406.Bulletin No. 124/125-E, Paris 1978. 12. Balant, Z. P., and Najjar, L. J., "Non-
2. ACI Committee 209/II (chaired by Linear Water Diffusion in Non-satu-D. E. Branson, "Prediction of Creep, rated Concrete," Materials andShrinkage and Temperature Effects in Structures (RILEM, Paris), V. 5, 1972,Concrete structures," ACI-SP27, De- pp. 3-20.signing for Effects of Creep, Shrink- 13. Hansen, T. C., and Mattock, A. H.,age and Temperature, American Con- "Influence of Size and Shape ofcrete Institute, Detroit, 1971, pp. Member on the Shrinkage and Creep51-93. of Concrete," ACI Journal, Proceed-
3. ACI Committee 209/II (chaired by ings V. 63,1966, pp. 267-290.D. Carreira), Revised Edition of Refer- 14. L'Hermite, R., and Mamillan, M.,ence 2, 1978 (to be published). "Retrait et fluages des betons," Annales
4. Balant, Z. P., and Panula, L., "Practi- de l'Institut Technique du Bdtiment etcal Prediction of Time-Dependent des Travaux Publics (Supplement), V.Deformations of Concrete," Materials 21, No. 249, 1968, p. 1334; "Nouveauxand Structures, Parts I and II: V. 11, resultats et recentes i6tudes sur leNo. 65, 1978, pp. 307-328, Parts III and fluage du beton," Materials andIV: V. 11, No. 66, 1978, pp. 415-434, Structures, V. 2, 1969, pp. 35-41;Parts V and VI: V. 12, No. 69, 1979, pp. Mamillan, M., Bouineau, A., "Influ-169-183. ence de la dimension des cprouvettes
5. Balant, Z. P., and Osman, E., "On the sur le retrait," Annales InstitutChoice of Creep Function for Standard Technique du Bdtiment et desRecommendations on Practical Travaux Publics (Supplement), V. 23,Analysis of Structures," Cement and No. 270, 1970, pp. 5-6.Concrete Research, V. 5, 1975, pp. 15. Troxell, G. E., Raphael, J. M., and129-138, 631-641; V. 6, pp. 149-153; V. Davis, R. W., "Long-Time Creep and7, pp. 119-130; V. 8, pp. 129-130. Shrinkage Tests of Plain and Rein-
6. Balant, Z. P., and Thonguthai, W., forced Concrete," Proceedings, ASTM"Optimization Check of Certain Re- V. 58, 1958, pp. 1101-1120.cent Practical Formulations for Con- 16. Keeton, J. R., "Study of Creep in Con-crete Creep," Materials and Struc- crete," Technical Reports R333-I,tures (RILEM, Paris), V. 9, 1976, pp. R333-II, R333-III, 1965, U.S. Naval91-96. Civil Engineering Laboratory, Port
7. Balant, Z. P., and Kim, S. S., "Can the Hueneme, California.Creep Curves for Different Loading 17. L'Hermite, R. G., Mamillan, M., andAges Diverge?" Cement and Concrete Lefevre, C., "Nouveaux r6sultats deResearch, V. 8, September 1978, pp. recherches sur la defofmation et la601-611. rupture du beton," Annales de l'In-
8. Balant, Z. P., and Panula, L., "A Note stitut Technique du Bdtiment et deson Limitations of a Certain Creep Travaux Publics, V. 18, No. 207-208,Function Used in Practice," Materials 1965, pp. 323-360. See also Interna-and Structures, V. 12, No. 67, 1979, tional Conference on the Structure ofpp. 29-31. Concrete, Cement and Concrete As-
9. Balant, Z. P., "Theory of Creep and sociation, London, 1968, pp. 423-433.Shrinkage in Concrete Structures: A 18. Hanson, J. A., "A Ten-Year Study ofPrecis of Recent Developments," Me- Creep Properties of Concrete," Con-chanics Today, Pergamon Press, V. 2, crete Laboratory Report No. SP-38,1975, pp. 1-93. U.S. Department of the Interior,
10. Balant, Z. P., and Osman, E., "Double Bureau of Reclamation, Denver, Col-Power Law for Basic Creep of Con- orado, July 1953.crete," Materials and Structures 19. Harboe, E. M., et al., "A Comparison(RILEM, Paris), V. 9, No. 49, 1976, pp. of the Instantaneous and the Sustained3-11. Modulus of Elasticity of Concrete,".
11. Balant, Z. P., Osman, E., and Thou- Concrete Laboratory Report No.
118

C-854, Division of EngineeringLaboratories, U.S. Department of theInterior, Bureau of Reclamation, Den-ver, Colorado, March 1958.
20. Pirtz, D., "Creep Characteristics ofMass Concrete for Dworshak Dam,"Report No. 65-2, Structural Engineer-ing Laboratory, University of Califor-nia, Berkeley, October 1968.
21. Browne, R. D., and Blundell, R., "TheInfluence of Loading Age and Tem-perature on the Long Term Creep Be-haviour of Concrete in a Sealed,Moisture Stable State," Materials andStructures (RILEM, Paris), V. 2, 1969,pp. 133-143.
22. Browne, R. D., and Burrow, R. E. D.,"Utilization of the Complex Multi-phase Material Behavior in EngineeringDesign," In Structure, Solid Mechan-ics and Engineering Design, Civil En-gineering Materials Conference heldin Southampton, England, 1969,Edited by M. Te'eni, Wiley Intersci-ence, 1971, pp. 1343-1378.
23. Browne, R. D., and Bamforth, P. P.,"The Long Term Creep of the WylfaP.V. Concrete for Loading Ages up to12% Years," 3rd International Confer-ence on Structural Mechanics inReactor Technology, Paper H 1/8,London, September 1975.
24. Rostasy, F. S., Teichen, K.-Th., andEngelke, H., "Beitrag zur Klarung desZusammenhanges von Kriechen andRelaxation bei Normal-beton," Amt-liche Forschungs-und Material-prufungsanstalt fur das Bauwesen.Otto-Graf-Institut, Universitat Stutt-gart, Strassenbau and Strassenverkehr-stechnik, Heft 139, 1972.
25. McDonald, J. E., "Time-DependentDeformation of Concrete Under Mul-tiaxial Stress Conditions," TechnicalReport C-75-4, U.S. Army EngineerWaterways Experiment Station, Vicks-burg, Mississippi, October 1975 toOak Ridge National Laboratory, OakRidge, Tennessee 37830, Operated byUnion Carbide Corporation for theU.S. Energy Research and Develop-ment Administration.
26. York, G. P., Kennedy, T. W., and Perry,E. S., "Experimental Investigation ofCreep in Concrete Subjected to Multi-axial Compressive Stresses and Ele-vated Temperatures," Research Report2864-2 to Oak Ridge National Labora-tory operated by Union Carbide Cor-poration for U.S. Atomic Energy
Commission, Department of Civil En-gineering, the University of Texas atAustin, June 1970.
27. Lambotte, H., and Mommens, A.,"L'Evolution du fluage du beton enfonction de sa composition, du taut etde 1'age," Groupe de travail GT22,Centre National de Recherches Scien-tifiques et Techniques pour L'Indus-trie Cimentiere, Bruxelles, July 1976.
28. Maity, K., and Meyers, B. L., "TheEffect of Loading History on theCreep and Creep Recovery of Sealedand Unsealed Plain Concrete Speci-mens," Report No. 70-7 preparedunder National Science FoundationGrant GK-3066, Department of CivilEngineering, University of Iowa, IowaCity, September 1970.
29. Hummel, A., Wesche, K., and Brand,W., "Der Einfluss der Zementart, desWasser-Zement-Verhaltnisses and desBelastungsalters auf das Kriechen vonBeton," Deutscher Ausschuss furStahlbeton, Heft 146, Berlin 1962.Vertrieb durch VerIag von WilhelmErnst and Sohn.
30. Branson, D. E., Meyers, B. L., andKripanarayanan, K. M., "Time-Depen-dent Deformation on Non-compositeand Composite Prestressed ConcreteStructures," Highway Research Rec-ord No. 324, 1970, pp. 15-33.
31. Branson, D. E., and Christiason, M. L.,"Time-Dependent Concrete Prop-erties Related to Design Strength andElastic Properties, Creep and Shrink-age," SP-27, Designing for Creep,Shrinkage and Temperature, AmericanConcrete Institute, Detroit 1971, pp.257-277.
32. Branson, D. E., Deformations of Con-crete Structures, McGraw Hill, NewYork, 1977.
33. Rusch, H., Jungwirth, D., and HilsdorfH., "Kritische Sichtung der Verfahrenzur Beriicksichtigung der Einflussevon Kriechen," Beton-undStahlbetonbau V. 68, 1973, pp. 49-60,76-86, 152-158.
34. Rusch, H., and Jungwirth, D., "Be-rncksichtigung der Einfliisse vonKriechen and Schwinden auf das Ver-halten der Tragwerke," Werner-Ver-lag, Dusseldorf 1976.
35. CEB (Comite Europeen du Beton), 3rdDraft of Model Code for ConcreteStructures, Bulletin d'Information No.117-F, Paris, Dec. 1976.
PCI JOURNAL/May-June 1980 119

36. Ba2ant, Z. P., Panula, L., "A Note onAmelioration of the Creep Function forImproved Dischinger Method," Ce-ment and Concrete Research, V. 8, No.3, 1978, pp. 381-386.
37. Ba2ant, Z. P., "Prediction of ConcreteCreep Effects Using Age-AdjustedEffective Modulus Method," ACIJournal, V. 69, 1972, pp. 212-217.
38. Bacant, Z. P., and Najjar, L. J., "Com-parison of Approximate LinearMethods for Concrete Creep," Journalof the Structural Division, Proc. ASCE,
V. 99, No. ST9, September 1973, pp.1851-1874.
39. Balant, Z. P., Carreira, D. J., andWalser, A., "Creep and Shrinkage inReactor Containment Shells," Journalof the Structural Division, Proceed-ings, ASCE, V. 101, No. ST10, October1975, pp. 2118-2131.
40. Bazant, Z. P., and Kim, S. S, "Ap-proximate Relaxation Function forConcrete," Journal of the StructuralDivision, Proceedings, ASCE, V. 105,1979, pp. 2695-2705.
APPENDIX A-CALCULATION OF CURVES FORACI AND CEB-FIP MODELS
ACI Model2,3
e .h(t,t° ) = 0.00078- CF' = cic2csc,cg, (50)55+t
forh 0.4:c2'=1;forh '0.8:c2'=3– 3h;for0.4<h<0.8:c2' = 1.4 – h (51)
cs = 1.2 e- °•°473"1', c; = 0.75 + 0.00061 c (52)
cs = 0.3 – 1.4 Q for a -_ 0.5, else cs = 0.9 – 0.2 a (53)
J(t,t') = 1 + C^ , E (t') = 33 p3f,' t' , ff (t') = ff 2g t , t' 7 days (54)E(t') 4+ 0.85t
C,,, C. = 2.35 CF, CF = c 1c2c3c4 (55)10 + (t – t' )°•6
c, = 1.25 t' -0•ns ; c2 = 1.27 – 0.67 h for h > 0.4, else c Q = 1.00; (56)
c3 = 2 (1 + 1.13 e_02'2') c4 = 0.88 + 0.0024 S (57)3 a
Note that c; is a function of initial moist curing defined by Table 2.8 in Reference 3.Here p = unit mass of concrete in lb/fis ; CF, CF' = correction factors, c = cement contentin kg/m3 , v/s = volume to surface ratio in cm, s/a = ratio of the fine aggregate (sand)content to the total aggregate content (by weight). The slump and air content influences'were not considered for the data in the figures because their values were not reported formost data considered.
120

41. Bacant, Z. P., "Thermodynamics ofSolidifying or Melting ViscoelasticMaterial," Journal of the EngineeringMechanics Division, Proceedings,ASCE, V. 105, 1979, pp. 933-952.
42. Bacant, Z. P., and Panula, L., "NewModel for Practical Prediction ofCreep and Shrinkage," A. Pauw Sym-posium on Designing for Creep andShrinkage, held in Houston,November 1978, ACI Special Publica-tion. (To be published by AmericanConcrete Institute.)
AcknowledgmentSupport by the U.S. National Science
Foundation under Grant No. ENG77-06767 to Northwestern University isgratefully acknowledged.
The theoretical foundations underlyingthe proposed model were developed partlyunder a Guggenheim Fellowship awardedto the first author. The second author alsoreceived a fellowship of The Alumnae ofNorthwestern University.
CEB-FIP Model Code'
E sh = E,,[,6e(t) — - Is(t°)], E,, = € 31€,H 0 _ XU(58)
The strain e, is defined by Table 0.1, Column 4 in Reference 1 as a function ofhumidity h; E,zl is defined by a graph in Fig. e.4 as a function ofH ° ; Ar/U = ratio ofcross-sectional area to exposed surface; A is a function of h defined by Table e.1; f3 8 (t) _
function of age t defined by six graphs in Fig. e.6 for various values of effective thicknessH ° . Age t was not corrected for temperature (Section e.5 of Reference 1) because the testtemperatures did not differ appreciably from 20C.
1 + ^a(t') + i, I3 (tt^) (pRNf(t) — /3,(t't' )lJ(t,t')= E,(t') E28 + Ec (59)
za za za
Ra(t') = o.8(1_ f^^ ) J, (P a = 0.4, S°f = cofl cpfz (60)
E 0 (t')= 1.25E °m (t'),E cm (t')=9500 3Vfc m (t'),E °28 = 9500 3V (61)
where f, E ° and E are in N/mmz . The strength f f is given by a graph in Fig. e.1 ofReferenced as a function of t' ; (pf is given in Table e.1 of Reference 1 as a function ofhumidity h; (p f2 is given by a graph in Fig. e.2 of Reference 1 as a function of effectivethickness H o ; /a is defined by a graph in Fig. e.3 of Reference 1 as a function of loadduration t — t' , f3, is given by six graphs in Fig. e.4 for various effective thicknesses H°(Table 2.3 of Reference 1) as a function of age t, which does not have to be here correctedfor temperature as already noted.
Compared to German Code DIN33-34 and the preliminary version from Reference 35,the modification proposed in Reference 36 and embodied in the above equations consistsof replacing the actual elastic deformation 1/E ° (t') with the term 1/E,,(t') = 0.46(1 + 3.22t1-0_4 )/E ° a where E j,(t') was called "initial creep modulus."29 In the Model Code theproposed change from 1/E ° (t') to 1/E 1 (t') is hidden within the term /3 a (t' )/E o, which iscalled "irreversible initial deformation" and is given as 0.8[ 1 — f f (t' )/f] where f f (t') isgiven by a graph such that this term is equivalent to the originally proposed36 function1/E , (t') minus 1/E, (t' ), i.e., f f (t' )lf f . — 1 — [ 1/E (t') — 1/E k2s ] /0.8.
PCI JOURNAL/May-June 1'980 121

APPENDIX B-NOTATION
a/c = aggregate-cement ratio (by weight)Co(t,t') = unit basic creep strain (in excess
of 1/E 0 , not 1/E )C 1 (ta) = drying diffusivity of nearly
saturated concrete at referencetemperature T 0 at age t
C d (t,t',t o ) = increase of creep duringdrying
D = effective cross-section thicknessE = Young's modulus of concreteE 28 = E at t' = 28 daysE. = asymptotic modulus of concretef,' = 28-day cylinder strength of concreteg/s = gravel-sand ratio (by weight)h = relative humidity of the environment
(0 h_- 1)J (t,t') = strain at time t caused by a unit
sustained uniaxial stress actingsince time t'
ka = humidity coefficientkh' = humidity coefficientks = shape factorm = material parametern = material parameterr = parameter
RH = relative humidity (in percent)s/a = sand-aggregate ratio (by weight)s/c = sand-cement ratio (by weight)S (t) = function giving shape of shrinkage
curveS d (t,t') = shrinkage-like time shape
function for increase of creepdue to drying
t = time in days representing the age ofconcrete
t' = age of concrete at loading in daysto = age of concrete when drying beginst = duration of dryingv/s = volume-to-surface ratiowlc = water-cement ratioy = parameterz = parametera = material parameter€ Sh (t,t o ) = shrinkage strainEst = ultimate shrinkage (at zero
humidity),r8h = shrinkage square halftimerp, = material parameterPa = material parameterrp = coefficient characterizing the increase
due to drying
Discussion of this paper is invited.Please submit your comments toPCI Headquarters by January 1, 1981.
122