credit suisse 2020 global steel & mining conference
TRANSCRIPT

Credit Suisse 2020 Global Steel & Mining ConferenceSeptember 10th & 11th, 2020
TSX: LUN Nasdaq Stockholm: LUMI Candelaria, Atacama Region, Chile

Cautionary Statements
2
Caution Regarding Forward-Looking Information and Non-GAAP Performance Measures
This document contains “forward-looking information” within the meaning of Canadian securities laws. All statements other than statements of historical facts constitute forward-lookinginformation, including but not limited to statements regarding plans, prospects and business strategies; timing and amount of future production; expectations regarding the results of operationsand costs; permitting requirements and timelines; timing and possible outcome of pending litigation; the results of economic studies or Mineral Resource and Mineral Reserve estimations, life ofmine estimates, and mine and mine closure plans; market prices of metals, currency exchange rates, and interest rates; the ability to comply with permitting or other regulatory requirements;anticipated exploration and development activities; and the integration and benefits of acquisitions. Words such as “believe”, “expect”, “anticipate”, “contemplate”, “target”, “plan”, “goal”, “aim”,“intend”, “continue”, “budget”, “estimate”, “may”, “will”, “can”, “could”, “should”, “schedule” and similar expressions identify forward-looking statements. Forward-looking information is necessarilybased upon various assumptions including, without limitation, the expectations and beliefs of management, including that the Company can access financing, equipment and labour; assumedand future price of metals; anticipated costs; ability to achieve goals; the effective integration of acquisitions; the political environment supporting mining projects; and assumptions related to thefactors set forth below. While these factors and assumptions are considered reasonable by Lundin Mining as at the date of this document in light of management’s experience and perception ofcurrent conditions and expected developments, these statements are inherently subject to significant business, economic and competitive uncertainties and contingencies. Known and unknownfactors could cause actual results to differ materially from those projected. Such factors include, but are not limited to: volatility in commodity prices; global financial conditions; risks inherent inmining including but not limited to the environment, industrial accidents, catastrophic equipment failures, unexpected geological formations or unstable ground conditions, and naturalphenomena; uninsurable risks; equity markets volatility; outbreaks of viruses and infectious diseases (such as COVID-19); negative publicity and reputation risks; reliance on a single asset; fraudand corruption risks; actual ore mined and/or recoveries varying from estimates; risks associated with the estimation of Mineral Resources and Mineral Reserves and the geology, grade andcontinuity of mineral deposits; ore processing efficiency; foreign country and emerging markets risks; security; taxation regimes; health and safety risks; exploration, development or miningresults not being consistent with expectations; infrastructure risks; counterparty and credit risks and customer concentration; environmental regulation risks; exchange rate fluctuations;stakeholder opposition; civil disruption; labour disputes or difficulties; interruptions in production; uncertain political and economic environments; litigation; regulatory investigations,enforcement and/or sanctions; structural stability of waste rock dumps or tailings storage facilities risks; changes in laws or policies; climate change; cybersecurity risks; estimates of futureproduction, operations, capital and operating cash and all-in sustaining costs; permitting risks; compliance with laws; mine closure risks; challenges to title; the price/availability of supplies orservices; liquidity risks and limited financial resources; the estimation of asset carrying values; risks relating to dividends; and other risks and uncertainties, including but not limited to thosedescribed in the “Risk and Uncertainties” section of the Annual Information Form and the “Managing Risks” section of the Company’s MD&A for the year ended December 31, 2019, which areavailable on SEDAR at www.sedar.com under the Company’s profile. All of the forward-looking statements made in this document are qualified by these cautionary statements. Although theCompany has attempted to identify important factors that could cause actual results to differ materially from those contained in forward-looking information, there may be other factors thatcause results not to be as anticipated, estimated, forecast or intended and readers are cautioned that the foregoing list is not exhaustive of all factors and assumptions which may have beenused. Should one or more of these risks and uncertainties materialize, or should underlying assumptions prove incorrect, actual results may vary materially from those described in forward-looking information. Accordingly, there can be no assurance that forward-looking information will prove to be accurate and forward-looking information is not a guarantee of future performance.Readers are advised not to place undue reliance on forward-looking information. The forward-looking information contained herein speaks only as of the date of this document. The Companydisclaims any intention or obligation to update or revise forward‐looking information or to explain any material difference between such and subsequent actual events, except as required byapplicable law.
This presentation may contains certain financial measures such as adjusted earnings, adjusted loss, EBITDA, net cash, net debt, adjusted operating cash flow per share, co-product cash costs andcash costs which have no standardized meaning within generally accepted accounting principles under IFRS and therefore amounts presented may not be comparable to similar data presentedby other mining companies. This data is intended to provide additional information and should not be considered in isolation or as a substitute for measures or performance prepared inaccordance with IFRS.
Note: All dollar amounts are in US dollars unless otherwise denoted.

Lundin Mining
3
Our Strategy
Operate, upgrade and grow a base metals portfolio that provides leading returns for our shareholders throughout the cycle
Candelaria1
Copper-Gold-Silver in Chile ChapadaCopper-Gold in Brazil
EagleNickel-Copper-PGMs in U.S.A.
Neves-CorvoCopper-Zinc-Lead in Portugal
ZinkgruvanZinc-Lead-Copper in Sweden
1. Lundin Mining holds an 80% interest in Candelaria
• copper dominant
• competitive cost position
• low-risk mining jurisdictions, leverage current geographies
• pipeline of development and exploration projects
• maintain low leverage and flexible balance sheet while increasing direct shareholder returns

Responsible Mining
4
• we recognize the important role of the metals we produce and are committed to mining these metals responsibly
• we demonstrate this commitment through living our core values of Safety, Respect, Integrity and Excellence in all aspects of our decision-making
• Lundin Mining has been reporting on our sustainability performance in a comprehensive, standalone document since 2011
https://www.lundinmining.com/responsible-mining/sustainability-reports/
• across Lundin Mining we continue to identify and implement measures to protect our workforce and communities and ensure their needs are being addressed
• providing proactive assistance and resources to our local communities to best address needs as the pandemic continues to evolve differently in each region
• contributed approximately US$3.0 million through Q2/20 in direct relief efforts, including education, healthcare support, local business development and humanitarian aid
COVID-19 Readiness & Response
2019 Sustainability Report

142
165 - 180
180 - 190
2019A 2020 2021
235
251 - 274
294 - 318
2019A 2020 2021
Increasing Production Profile1 (kt)
1. Production profile based on certain estimates and assumptions, including but not limited to; Mineral Resource and Mineral Reserve estimates geological formations, grade and continuity of deposits and metallurgical characteristics. The 2020-2021 guidance was announced by news release on November 26, 2019, with 2020 guidance and most recently revised by news release on July 29, 2020. The 2019 production results were announced in the press release dated January 22, 2020 and/or the February 20, 2020 release. Copper production for 2019 reflects attributable production for the Chapada Mine under Lundin Mining ownership.
2. Gold production guidance for Candelaria is 80-90 koz in 2020 and 110-115 koz in 2021, on a 100% basis. Currently, 68% of Candelaria’s total gold and silver production are subject to a streaming agreement. Gold production guidance for Chapada is 85-90 koz in 2020 and 70-75 koz in 2021. Chapada’ s gold production is unencumbered.
Copper NickelGold
13
15 - 18 15 - 18
2019A 2020 2021
5
+30%

Copper
68%
Gold
14%
Zinc
7%
Nickel
6%
Lead
2%
Other
3%
H1/20 Summary Results
Production
127,452 t of copper
68,529 t of zinc
83,000 oz of gold
6,955 t of nickel
14,839 t of lead
Payable Sales
125,548 t of copper
55,709 t of zinc
81,000 oz of gold
5,228 t of nickel
14,336 t of lead
$911M in Sales
6
Ediney Drummond, Managing Director presenting during celebrations of Chapada’s first year anniversary as a Lundin Mining operation on July 5, 2020
By Metal By Jurisdiction
Chile
47%
Brazil
22%
Portugal
14%
USA
11%
Sweden
6%

Candelaria
• H1/20 production of 71,357 t of copper and approximately 42,000 oz of gold at cash cost of $1.33/lb of copper
• CMOP replacement of fourth and final ball mill motor planned for scheduled maintenance downtime in January 2021
• 2020 copper production guidance of 145,000 to 155,000 t, increasing over 25% in 2021 to 185,000 to 195,000 t
• full year cash cost guidance of $1.35/lb of copper
Resilient Operations in Face of COVID-19 Challenges
1. Currently, 68% of Candelaria’s total gold and silver production are subject to a streaming agreement and as such C1 cash costs guidance is based on receipt of $412/oz and $4.12/oz, respectively, in 2020 on the streamed portion of gold and silver sales.
2. Average 2022-2025 production is based on the NI 43-101 Technical Reports dated November 28, 2018 which is available on SEDAR under the Company’s profile page. Current copper production guidance for 2022 is 180,000 – 190,000 t on a 100% basis. See also slide 25.
7
146145-155
185-195 Avg. +190
88 80-90
110-115Avg. +110
$1.54 $1.35
2019A 2020 2021 2022-2025
Copper Gold
2
Copper, Gold Production & Cash Cost1 Outlook(100% basis; kt Cu, koz Au & $/lb Cu, net of by-product credits)
Sustaining Capital & Exploration Expenditures
• 2020 sustaining capital expenditure guidance of $230M
• H1/20 expenditures of $130M
• over 50,000 m drilling planned as part of $15M exploration program
• 29,805 m of drilling completed in H1/20 with five rigs
Delivery of medical equipment and supplies as part of a two billion peso Candelaria and Atacama Health Service agreement signed in May to help the region face the COVID-19 pandemic

Candelaria Copper Production Profile1 (kt)
Contained copper in the Mineral Reserve estimate2 has increased by approximately 130%3 and the production profile significantly improved since acquisition
1. Production shown on 100% basis and is based on the NI 43-101 Technical Reports dated November 28, 2018, November 30, 2017, and October 6, 2014 copies of which is are available on SEDAR under the Company’s profile page. See also slide 25.2. Refer to Press Release “Lundin Mining Announces 2020 Mineral Resource and Reserve Estimates” dated September 8, 2020. See also slide 25.3. Mine depletion included.4. Bar graph presents NI 43-101 Technical Report dated November 28, 2018 copper production forecast for 2020 through end of operational life. Current copper production guidance on a 100% basis is for 145,000 – 155,000 t in 2020, 185,000 – 195,000 t in 2021 and 180,000 – 190,000 t in 2022.
8
167
184
135146
175185 190 190 192 194
175 171
156 152160
136146
175
151
114
9684
69
45
10
2016A 2017A 2018A 2019A 2020 2021 2022 2023 2024 2025 2026 2027 2028 2029 2030 2031 2032 2033 2034 2035 2036 2037 2038 2039 2040
December 2018 Technical Report December 2017 Technical Report At Purchase - October 2014 Techncial Report
4 4 4

Chapada
Chapada geologist, Tais Bischof Pian, examining drill core from current drilling campaign
• Q2/20 copper production increased 16% and gold production approximately 28% over Q1/20, driven by improving grades and recoveries for both metals
• H1/20 production of 25,680 t of copper and approximately 41,000 oz of gold
• copper cash cost of $0.54/lb in H1/20 and $0.21/lb for Q2/20 benefiting from a favourable FX rate and gold price3
• full year cash cost guidance further improved to $0.65/lb of copper, from $0.85/lb. On-track to achieve full year copper and gold production guidance
Improved Grades & Recoveries
9
Copper, Gold Production & Cash Cost1 Outlook(100% basis; kt Cu, koz Au & $/lb Cu, net of by-product credits)
1. Chapada cash costs are calculated on a by-product basis and do not include the effects of its copper stream agreements. Effects of the copper stream agreements are reflected in copper revenue and will impact realized price per pound.
2. 2019 production based on period of Lundin Mining’s ownership post closing of acquisition on July 5, 2019 (approximately half year).3. Q2/20 average market price of USD/BRL: 5.37 and $1,727/oz gold compared to assumptions of 4.75 and $1,500/oz, respectively, in
previous guidance. Assumptions revised to USD/BRL: 5.00 and $1,600/oz gold in guidance announced by news release on July 29, 2020.
31
51-56 51-56 51-5654
85-90
70-7575-80
$0.58 $0.65
2019A 2020 2021 2022
Copper Gold
2
Ramp Up of Exploration Drilling
• 9,810 m of drilling competed in H1/20
• targeting over 40,000 m of drilling for the year as part of $7M exploration program
• five drill rigs now on site and planning a 60,000 m drilling campaign for 2021
• focus remains primarily on near mine targets with some regional drilling
• study work evaluating mine and plant expansion advancing
• full year sustaining capital expenditure guidance of $40M is unchanged

Chapada Production Profile1,2
1. Production shown is based on the NI 43-101 Technical Report dated October 10, 2019, available on the Company’s website and SEDAR under the Company’s profile page. See also slide 25.2. 2019 production based on period of Lundin Mining’s ownership post closing of acquisition on July 5, 2019 (approximately half year).3. Bar graph presents NI 43-101 Technical Report dated October 10, 2019 copper and gold production forecasts for 2020 through end of operational life. Current copper production guidance is for 51,000 – 56,000 t in 2020, 2021 and 2022. Current gold production guidance is for 85,000 – 90,000 oz in 2020 and
70,000 – 75,000 oz in 2021 and 2022.
10
0
20
40
60
80
100
1202
01
9A
20
20
20
21
20
22
20
23
20
24
20
25
20
26
20
27
20
28
20
29
20
30
20
31
20
32
20
33
20
34
20
35
20
36
20
37
20
38
20
39
20
40
20
41
20
42
20
43
20
44
20
45
20
46
20
47
20
48
20
49
20
50
Me
tal
Pro
du
ctio
n
Copper (kt) Gold (koz)
3 3 3

Copper, Zinc Production & Cash Cost Outlook(kt & $/lb Cu, net of by-product credits)
Neves-Corvo
• H1/20 production of 19,634 t of copper, 36,934 t of zinc and 3,027 t of lead
• new throughput record set in Q2/20 with over one million tonnes milled in the quarter
• cash cost of $1.76/lb of copper in H1/20
• per tonne operating costs benefiting from lower contractor costs and increased throughput
• positioned to achieve production and cash cost guidance
New Mill Throughput Record Set
11
41 35-4041-46 41-46
73 70-75
$1.59$2.10
2019A 2020 2021 2022
Copper Zinc
ZEP Zinc Production Being Reviewed
Zinc Expansion Project Restart Plans in Review
Managing Director, Kenneth Norris, and Neves-Corvo CFO, Rodrigo Rosa, meeting with Portuguese President Marcelo Rebelo de Sousa to discuss
impact of COVID-19 pandemic on economy and mining sector
• major ZEP construction and commissioning activities remain temporarily suspended to reduce COVID-19 related risks to workforce and local communities
• minor works to continue in H2/20 to facilitate efficient ramp-up of construction and commissioning
• 2020 ZEP capital expenditure guidance increased to $65M, from $55M. Total pre-production expenditure remains unchanged at €360M
• phased commissioning and production ramp-up being reviewed considering COVID-19 measures and protocols

Zinc Production & Cash Cost Outlook(kt & $/lb Zn, net of by-product credits)
Zinkgruvan
• H1/20 production of 31,595 t of zinc, 11,812 t of lead and 2,301 t of copper at cash cost of $0.53/lb of zinc
• mine plan calls for return to high grade stopes in H2/20 driving increased zinc production in second half
• on-track to achieve full year production and cash cost guidance
• sustaining capital expenditure guidance of $45M unchanged
On-Track to Achieve Full-Year Guidance
78 72-77 72-77
69-74
$0.39
$0.60
2019A 2020 2021 2022
12
Women comprise half of this year’s summer hire program, including Emma Johansson working on the production loading team
• exploration expenditure guidance of $6M with approximately 17,000 m drilling planned
• 11,186 m of exploration drilling and 195 m of drifting completed in H1/20
• exploration continues on Dalby in support of mine design and study work for future conversion to Mineral Reserves1
• drilling has also added Inferred and Indicated Mineral Resource1
in the extensions of known mineralization
Underground Exploration Advancing
1. Refer to Press Release “Lundin Mining Announces 2020 Mineral Resource and Reserve Estimates” dated September 8, 2020. See also slide 25.

Nickel, Copper Production & Cash Cost Outlook(kt & $/lb Ni, net of by-product credits)
Eagle
• H1/20 production of 6,955 t of nickel and 8,480 t of copper at cash cost of $1.29/lb nickel
• set a new record over 180 days without a recordable injury on May 2 and continues with zero recordables now for over 300 days
• positioned for a stronger H2/20 as mine sequencing calls for increasing nickel and copper ore grades from Eagle East
• full year copper production guidance increased to 17,000 to 19,000 t and nickel production guidance reiterated at 16,000 to 18,000 t
• cash cost guidance improved to $0.85/lb of nickel, from $1.00/lb, primarily on by-product copper production and price assumption
Improved Copper Production & Nickel Cash Cost Guidance
13
16-18 15-18 15-18
14
17-19
14-17
17-20
$2.84
$0.85
2019A 2020 2021 2022
Nickel Copper
13Meagen Morrison, Social Responsibility Advisor at Eagle Mine, displaying gift card distributed to employees to support Rockin’ Local campaign
• 2020 sustaining capital expenditure guidance of $15M unchanged
• $7.6M of sustaining capital expenditures in H1/20
Generating Meaningful Free Cash Flow

Lundin Mining
Meaningful Scale Growth Oriented Financial StrengthHigh Quality
Competitive Mines
• demonstrated operational excellence and culture of continuous improvement
• low-risk mining jurisdictions
• materially increasing copper and zinc production profile
• exploration upside and high-value expansion projects underway
• proven track record for rigorous investment approach, focused on value creation
• strong balance sheet with low leverage
14
www.lundinmining.com | TSX: LUN | Nasdaq Stockholm: LUMI

Appendices
16

2020 Guidance Summary1
1. Guidance as outlined in the Management's Discussion and Analysis for the quarter ended June 30, 2020 and as announced by news release on July 29, 2020.2. Cash costs are based on various assumptions and estimates, including but not limited to: production volumes, as noted above, commodity prices (Cu: $2.35/lb, Zn: $0.85/lb, Ni: $5.25/lb, Pb: $0.75/lb, Au: $1,600/oz), foreign exchange rates (€/USD:1.15, USD/SEK:9.25,
USD/CLP:800, USD/BRL:5.00) and operating costs.3. 68% of Candelaria's total gold and silver production are subject to a streaming agreement and as such cash costs are calculated based on receipt of $412/oz and $4.12/oz respectively, on gold and silver sales in the year. Silver production at Zinkgruvan and Neves-Corvo are
also subject to streaming agreements, and cash costs are calculated based on approximately $4.40/oz and $4.30/oz.4. Chapada cash costs are calculated on a by-product basis and do not include the effects of its copper stream agreements. Effects of the copper stream agreements are reflected in copper revenue and will impact realized revenue per pound.
17
Copper (t) Candelaria (100%) 145,000 - 155,000 $1.353
Chapada 51,000 - 56,000 $0.654
Eagle 17,000 - 19,000
Neves-Corvo 35,000 - 40,000 $2.103
Zinkgruvan 3,000 - 4,000
Total 251,000 - 274,000
Zinc (t) Neves-Corvo 70,000 - 75,000
Zinkgruvan 72,000 - 77,000 $0.603
Total 142,000 - 152,000
Gold (oz) Candelaria (100%) 80,000 - 90,000
Chapada 85,000 - 90,000
Total 165,000 - 180,000
Nickel (t) Eagle 15,000 - 18,000 $0.85
Total 15,000 - 18,000
(contained metal in concentrate)
Production C1 Cash
Cost2
Sustaining Capital
Candelaria (100% basis) 230
Chapada 40
Eagle 15
Neves-Corvo 55
Zinkgruvan 45
Total Sustaining 385
ZEP (Neves-Corvo) 65
Total Capital Expenditures1,2 $450M
• 2020 exploration guidance of $35M
• over 110,000 m of drilling planned with focus on in and near-mine targets

Candelaria Complex – Mineral Resources and Mineral Reserves1
1. For more information please refer to the Company’s Technical Report for the Candelaria Copper Mining Complex, November 28, 2018 and the Company’s news release dated September 8, 2020 entitled “Lundin Mining Announces 2020 Mineral Resource and Reserve Estimates” on the Company’s website (www.lundinmining.com). See also slide 25.
Candelaria Copper Mining Complex 18
Ownership 80%
Location Region III, Chile
Mine life +20 years
2020 exploration budget $15M
P&P Copper Mineral Reserves 3,656 kt contained (684,445 kt at 0.5%)
M&I Copper Mineral Resources 7,574 kt contained (1,179,253 kt at 0.6%)
Inferred Copper Mineral Resources 540 kt contained (77,618 kt at 0.7%)
P&P Gold Mineral Reserves 2.8 Moz contained (684,445 kt at 0.1 g/t)
M&I Gold Mineral Resources 5.6 Moz contained (1,179,253 kt at 0.1 g/t)
Inferred Gold Mineral Resources 0.3 Moz contained (77,618 kt at 0.1 g/t)
P&P Silver Mineral Reserves 39 Moz contained (684,445 kt at 2 g/t)
M&I Silver Mineral Resources 77 Moz contained (1,179,253 kt at 2 g/t)
Inferred Silver Mineral Resources 3.8 Moz contained (77,618 kt at 2 g/t)

Candelaria Reinvestments
19
• significantly increased production profile and extended mine life on exploration success. Mineral Reserve estimate now supports mine life to beyond 2040
• new equipment increases haulage efficiency. 38 new latest generation CAT 793F trucks which are faster, have larger capacity and lower operating costs. Change to hydraulic shovels in backhoe configuration
• high-return investment; in excess of 20% IRR expected. $220M total investment essentially complete
Mine Fleet Reinvestment
First New Candelaria Haul Truck
• low-risk investments to increase metal production, reduce costs and improve safety
• primary crusher motor upgrade, ball mill re-powering, pebble circuit upgrade, cyclone and feed pump upgrades, flotation circuit upgrades, front-end desalination plant and pipeline improvements
• throughput capacity forecast to increase ~4 ktpd and copper recovery by ~1.7%
• high-return initiatives. In excess of 20% IRR expected. $80M total investment
Candelaria Mill Optimization Project (CMOP)
• significant underground exploration success under Lundin Mining ownership
• total estimated Candelaria underground Mineral Reserves1 now 160.2 Mt at 0.83% copper. Candelaria North and South Sectors continues to show significant exploration potential
• Candelaria South Sector successfully transitioned to operations team in Q3/19. Aim to operate Candelaria North and South Sector mines to maximum combined permit-limited 14,000 tpd
Underground Mine Expansions
Candelaria Mill
1. Refer to Press Release “Lundin Mining Announces 2020 Mineral Resource and Reserve Estimates” dated September 8, 2020. See also slide 25.

Chapada – General Overview
20
• located in northern Goiás State
• 270 km northwest of national capital of Brasilia and 320 km north of state capital of Goiânia
• supported by road access with good connections to the local and national road network
• average elevation of approximately 300 masl
• low rolling hills with large contiguous flat areas
• tropical climate with two well defined seasons:
− rainy season from November to March
− dry season from April to October
• Alto Horizonte, the closest town, has a population of roughly 5,800 people
• local economic activity is mainly agropastoral. Some small scale gold and clay mining activities in area
• ± 750 employees and 1,300 contractors
• 10% of the workforce is female
• majority of the workforce is between 26 to 35 years old (42%) and 36 to 45 years old (32%)
Source: Google Earth
Alto Horizonte
Chapada

Chapada – Mineral Resources and Mineral Reserves1
1. For more information please refer to the Company’s news release dated September 8, 2020 entitled “Lundin Mining Announces 2020 Mineral Resource and Reserve Estimates” on the Company’s website (www.lundinmining.com). Mineral Resources are based on the summation of Chapada and Suruca gold only. See also slide 25.
Chapada deposits and near-mine exploration targets
21
Ownership 100%
Location Goiás State, Brazil
Mine life +30 years
2020 exploration budget $7M
P&P Copper Mineral Reserves 1,759 kt contained (759,652 kt at 0.23%)
M&I Copper Mineral Resources 2,639 kt contained (1,132,198 kt at 0.23%)
Inferred Copper Mineral Resources 372kt contained (171,048 kt at 0.22%)
P&P Gold Mineral Reserves 4.6 Moz contained (824,847 kt at 0.18g/t)
M&I Gold Mineral Resources 7.8 Moz contained (1,279,716 kt at 0.19 g/t)
Inferred Gold Mineral Resources 0.6 Moz contained (183,613 kt at 0.10 g/t)

Eagle Mine – Mineral Resources and Mineral Reserves1
1. For more information please refer to the Company’s Technical Report on the Eagle Mine dated April 26, 2017 and the Company’s news release dated September 8, 2020 entitled “Lundin Mining Announces 2020 Mineral Resource and Reserve Estimates” on the Company’s website (www.lundinmining.com). See also slide 25.
Eagle Mine
22
Ownership 100%
Location Michigan, USA
Mine life 5 years
P&P Nickel Mineral Reserves 100 kt contained (3,909 kt at 2.6%)
M&I Nickel Mineral Resources 113 kt contained (3,807 kt at 3.0%)
P&P Copper Mineral Reserves 84 kt contained (3,909 kt at 2.1%)
M&I Copper Mineral Resources 95 kt contained (3,807 kt at 2.5%)
Inferred Nickel Mineral Resources - kt contained (21 kt at 0.9%)
Inferred Copper Mineral Resources - kt contained (21 kt at 1.0%)
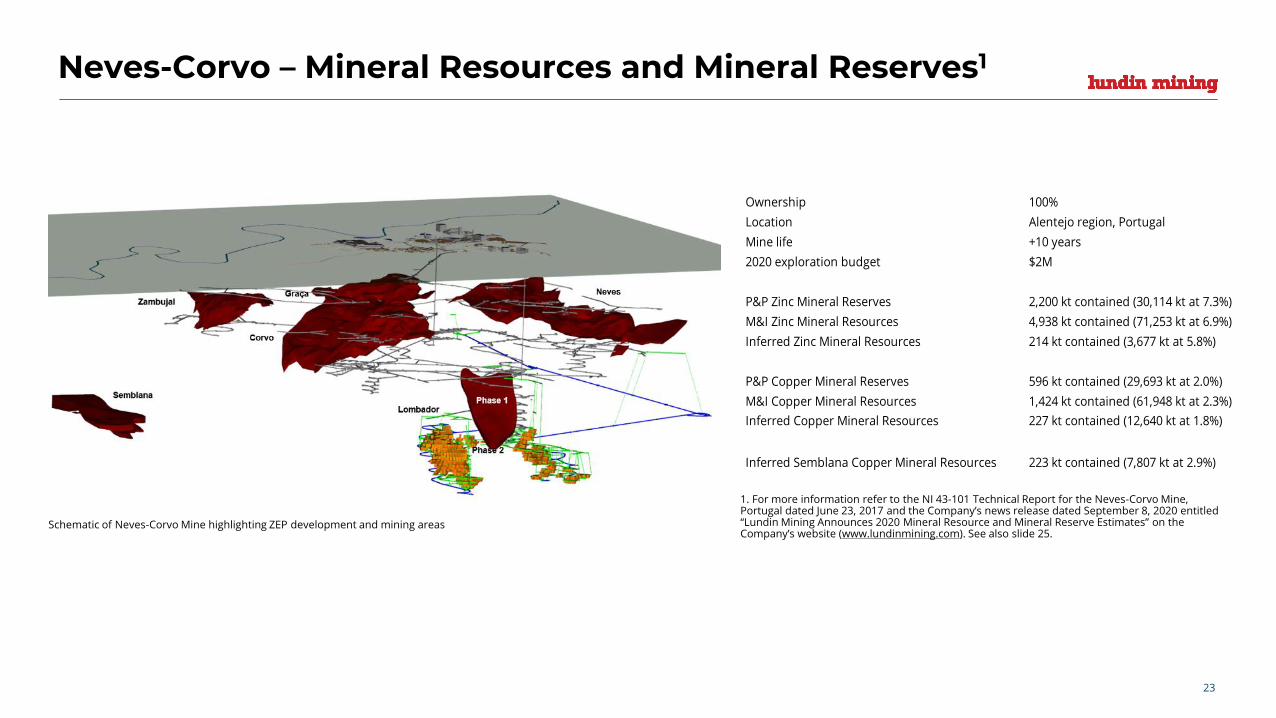
Neves-Corvo – Mineral Resources and Mineral Reserves1
1. For more information refer to the NI 43-101 Technical Report for the Neves-Corvo Mine, Portugal dated June 23, 2017 and the Company’s news release dated September 8, 2020 entitled “Lundin Mining Announces 2020 Mineral Resource and Mineral Reserve Estimates” on the Company’s website (www.lundinmining.com). See also slide 25.
Schematic of Neves-Corvo Mine highlighting ZEP development and mining areas
23
Ownership 100%
Location Alentejo region, Portugal
Mine life +10 years
2020 exploration budget $2M
P&P Zinc Mineral Reserves 2,200 kt contained (30,114 kt at 7.3%)
M&I Zinc Mineral Resources 4,938 kt contained (71,253 kt at 6.9%)
Inferred Zinc Mineral Resources 214 kt contained (3,677 kt at 5.8%)
P&P Copper Mineral Reserves 596 kt contained (29,693 kt at 2.0%)
M&I Copper Mineral Resources 1,424 kt contained (61,948 kt at 2.3%)
Inferred Copper Mineral Resources 227 kt contained (12,640 kt at 1.8%)
Inferred Semblana Copper Mineral Resources 223 kt contained (7,807 kt at 2.9%)

Zinkgruvan – Mineral Resources and Mineral Reserves1
1. For more information please refer to the Company’s Technical Report entitled NI 43-101 Technical Report for the Zinkgruvan Mine, Central Sweden dated November 30, 2017 and the Company’s news release dated September 8, 2020 entitled “Lundin Mining Announces 2020 Mineral Resource and Reserve Estimates” on the Company’s website (www.lundinmining.com). See also slide 25.
Zinkgruvan Mine
24
Ownership 100%
Location Askersund, Sweden
Mine life +10 years
2020 exploration budget $7M
P&P Zinc Mineral Reserves 690 kt contained (8,786 kt at 7.9%)
M&I Zinc Mineral Resources 1,955 kt contained (22,596 kt at 8.6%)
Inferred Zinc Mineral Resources 1,439 kt contained (18,981 kt at 7.6%)
P&P Copper Mineral Reserves 58 kt contained (3,099 kt at 1.9%)
M&I Copper Mineral Resources 92 kt contained (4,095 kt at 2.2%)
Inferred Copper Mineral Resources 5 kt contained (241 kt at 2.0%)

NI 43-101 Compliance
25
Unless otherwise indicated, Lundin Mining Corporation (the “Company”) has prepared the technical information in this presentation including Mineral Reserve and Mineral Resource estimates (“TechnicalInformation”) based on information contained in the technical reports and news releases (collectively the “Disclosure Documents”) available under the Company’s profile on SEDAR at www.sedar.com. EachDisclosure Document was prepared by or under the supervision of a qualified person (“Qualified Person”) as defined in National Instrument 43-101 – Standards of Disclosure for Mineral Projects of the CanadianSecurities Administrators (“NI 43-101”). For readers to fully understand the information in this presentation, they should read the technical reports identified below in their entirety, including all qualifications,assumptions and exclusions that relate to the information set out in this presentation which qualifies the Technical Information. Readers are advised that Mineral Resource estimates that are not Mineral Reservesdo not have demonstrated economic viability. The Disclosure Documents are each intended to be read as a whole, and sections should not be read or relied upon out of context. The Technical Information is subjectto the assumptions and qualifications contained in the Disclosure Documents.
The Technical Information in this presentation has been prepared in accordance NI 43-101 and has been reviewed and approved by Stephen Gatley, BSc (Eng), CENG MIMMM, Vice President - Technical Services ofthe Company, a "Qualified Person" under NI 43-101. Mr. Gatley has verified the data disclosed in this presentation and no limitations were imposed on his verification process.
Mineral Resource and Mineral Reserve estimates of the Company are shown on a 100 percent basis for each mine. The Measured and Indicated Mineral Resource estimates are inclusive of those Mineral Resourceestimates modified to produce the Mineral Reserve estimates. All estimates of the Company are prepared as at June 30, 2020. Estimates for all operations are prepared by or under the supervision of a QualifiedPerson as defined in NI 43-101 or have been audited by independent Qualified Persons on behalf of the Company.
Mineral Reserves for all active mines have been estimated using metal prices of US$3.00/lb copper, US$1.00/lb zinc, US$0.95/lb lead, US$6.50/lb nickel and US$1,300/oz gold. Exchange rates used were EUR/USD1.25, USD/SEK 7.00, USD/CLP 600 and USD/BRL 4.00. For the Suruca gold deposit Mineral Reserve, the metal prices used were US$3.00/lb copper and US$1,250/oz gold and an exchange rate of USD/BRL 3.95.
Candelaria and La Española open pit Mineral Resource estimates are reported within a conceptual pit shell based on metal prices of US$3.45/lb copper and US$1,300/oz gold with cut-off grades of 0.15% and 0.17%copper, respectively. Candelaria underground Mineral Resources are estimated at a cut-off grade of 0.45% copper within confining grades shells of 0.4% copper. Mineral Reserves for the Candelaria open pit,Española open pit and underground for the Candelaria property are estimated at cut-off grades of 0.16%, 0.19% and 0.50% copper, respectively. Underground Mineral Reserves for the Ojos del Salado property,Santos and Alcaparrosa mines, are estimated at cut-off grades of 0.55% copper and 0.60% copper respectively. Chapada and Suruca SW copper-gold Mineral Resource estimates are reported within a conceptual pitshell based on metal prices of US$3.45/lb copper and US$1,495/oz gold and at a variable Net Smelter Return (NSR) marginal cut-off averaging US$4.08 per tonne. For the Suruca gold only Mineral Resource estimates,cut-off grades of 0.16g/t gold for oxides and 0.23g/t for sulphides were used. Mineral Reserves for the Chapada open pit are estimated at a NSR cut-off of US$4.73 per tonne. For the Suruca gold only Mineral Reserveestimates cutoff grades of 0.19g/t gold for oxides and 0.30g/t for sulphides are used. Eagle Mineral Resources and Reserves are reported above a fixed NSR cut-off of US$108/t. The Eagle East Mineral Resources arereported above a fixed NSR cut-off of US$142/t and the Mineral Reserves are reported above US$142/t for long-hole stopes and US$150/t for cut-and-fill stopes. The NSR is calculated on a recovered payable basisconsidering nickel, copper, cobalt, gold and PGM grades, metallurgical recoveries, prices and realization costs. The Neves-Corvo Mineral Resources are estimated above cut-off grades of 1.0% for copper and 4.5% forzinc. The Neves-Corvo copper and zinc Mineral Reserve estimates have been calculated using variable NSR values based on area and mining method. The NSR is calculated on a recovered payable basis consideringcopper, lead, zinc and silver grades, metallurgical recoveries, prices and realization costs. The Neves-Corvo copper Mineral Reserves are estimated above a site average cut‐off of EUR 42.0/t (grade equivalent to1.34% copper). For Neves-Corvo zinc Mineral Reserve estimates a site average cut‐off of EUR 46.6/t (grade equivalent to 5.34% zinc) is used. The Mineral Resources at Semblana are estimated above a cut-off grade of1.0% copper. The Zinkgruvan zinc Mineral Resources are estimates within geological volumes based at a nominal NSR cut-off of SEK 350/t (equivalent to 4.5% zinc) and a minimum mining width of 5 m. TheZinkgruvan copper Mineral Resource is estimated above a cut-off grade of 1.0% Cu. The Zinkgruvan zinc and copper Mineral Reserves are estimated above a site average NSR cutoff grade of SEK 500/t (equivalent to6.1% zinc and 1.4% copper respectively). The NSR is calculated on a recovered payable basis considering copper, lead, zinc and silver grades, metallurgical recoveries, prices and realization costs. Refer to theCompany’s news release dated September 8, 2020 entitled “Lundin Mining Announces 2020 Mineral Resource and Reserve Estimates” on the Company’s website at www.lundinmining.com.
For further Technical Information on the Company’s material properties, refer to the following technical reports, each of which is available on the Company’s SEDAR profile at www.sedar.com:
Candelaria: technical report entitled Technical Report for the Candelaria Copper Mining Complex, Atacama Region, Region III, Chile dated November 28, 2018. Chapada: technical report entitled Technical Report on the Chapada Mine, Goiás State, Brazil dated October 10, 2019Neves-Corvo: technical report entitled NI 43-101 Technical Report for the Neves-Corvo Mine, Portugal dated June 23, 2017.Zinkgruvan: technical report entitled NI 43-101 Technical Report for the Zinkgruvan Mine, Central Sweden dated November 30, 2017.Eagle Mine: technical report entitled Technical Report on the Eagle Mine, Michigan, U.S.A. dated April 26, 2017.

www.lundinmining.com | TSX: LUN | Nasdaq Stockholm: LUMI