credit risk of property catastrophe reinsurers risk of property catastrophe reinsurers summer 2012...
TRANSCRIPT

Credit Risk of Property Catastrophe ReinsurersSummer 2012
Empower Results™

Contents
3 Introduction
4 Rating Agencies Drive Capital Requirements for Property Catastrophe Reinsurers
6 Reinsurer Management of Property Catastrophe Exposures
9 Industry Analysis of U.S. Gross, Ceded & Net Property Catastrophe Risk
11 Market Perceptions of Insurer and Reinsurer Credit Risk
12 Reinsurer Performance: 2005 vs. 2011 Catastrophes
13 Reinsurer Impairments Due to Catastrophe Events
15 Impaired Reinsurer Payment Analysis
16 Conclusion
17 Appendix 1: A.M. Best Negative Rating Actions January 1, 2011 through June 25, 2012
20 Appendix 2: Reinsurer Catastrophe Risk Tolerance Detailed Disclosures

3
Aon Benfield
Introduction
Catastrophe reinsurance provides very high credit quality protection to insurers: simply put, reinsurers pay their catastrophe claims. Since 2000 the reinsurance industry has paid more than USD150 billion in catastrophe claims. Over the same time horizon only eight reinsurers have gone insolvent due to catastrophe losses, and those eight represented less than 1 percent of global reinsurer capital. Further, the insolvent companies have settled more than 99 percent of their claims. As a result realized credit losses have been less than 10 basis points, a rate consistent with ‘AA’ corporate bond default rates.
The last twelve years have tested reinsurance capacity. Most recently, 2011 was a record year for natural catastrophe losses with economic losses of USD435 billion and insured losses of USD107 billion generated by 253 separate events. The reinsured portion of losses in 2011 was far higher than in 2005, the other record year. Despite the losses, reinsurance capital ended 2011 essentially unchanged from 2010, at USD455 billion. The majority of reinsurers incurred catastrophe losses less than 25 percent of shareholder funds. Only four of thirty seven major groups tracked by Aon Benfield had losses above 25 percent, with the highest loss still less than 50 percent. Consistent with the aggregate capital numbers, most reinsurers absorbed the losses within earnings or experienced only a slight loss of capital.
The 2011 catastrophes led A.M. Best and Standard & Poor’s (S&P) to assign a negative outlook to a small number of reinsurers; however, only four reinsurers were downgraded by S&P and no reinsurers were downgraded by A.M. Best. Further, three of the four downgraded companies continue to have ratings in the ‘A’ range. (The appendix contains a list of all companies that were downgraded, assigned a negative outlook or placed Under Review or on CreditWatch with negative implications by A.M. Best or S&P from January 2011 through June 2012.) The limited rating actions reflect reinsurers’ effective catastrophe risk management as well as a significant cushion for catastrophe losses built into rating agency capital requirements.
The remaining pages highlight the reinsurers’ payment track record and explain the structural, rating agency, market disclosure, and management processes in place that ensure cedents can have a very high level of confidence that their future claims will be paid.
4
Credit Risk of Property Catastrophe Reinsurers
Rating Agencies Drive Capital Requirements for Property Catastrophe Reinsurers
Property catastrophe reinsurers are subject to high capital requirements from rating agencies due to the inherent volatility in their book of business. Capital requirements have evolved over time, reflecting heightened concern over potential severity and frequency of events, most notably influenced by the World Trade Center attacks in 2001 and U.S. hurricane activity in 2004 and 2005. In response, rating agencies increased capital requirements, placed greater scrutiny on data quality, and emphasized the importance on enterprise risk management (ERM) and a clear risk tolerance.
A.M. Best requires insurers and reinsurers to maintain ample capital to absorb the impact of multiple catastrophe losses in a given year. Specifically, A.M. Best’s catastrophe stress deducts the impact of two separate events (net of reinsurance) from capital, while also increasing credit risk and reserve risk related to recoveries and net losses.
• 1st Event = greater of 100-year wind event, 250-year earthquake event or actual loss
• 2nd Event = greater of 100-year wind event, 100-year earthquake event or actual loss
S&P’s catastrophe risk charge is based upon a company’s 250-year All Perils net PML on an aggregate basis less catastrophe load from related property premiums. This selected return period is the same for all rating levels and reflects a one-year probability of default in-line with ‘AAA’ standards.
The current capital requirements noted above have been in place for all insurers since 2005 and reflect the rating agencies’ increased concern over catastrophe risk. Before 2005, A.M. Best included a catastrophe risk charge within their capital model, but did not employ a second event catastrophe stress test. Therefore, the introduction of the stress test alone increased property catastrophe reinsurer capital requirements significantly. Therefore, the 2005 Bermuda class required more capital to attain an initial ‘A-’ rating than previous start-ups all else being equal. Likewise, following the 2004 hurricane activity, S&P changed its catastrophe PML charge from 250-year occurrence PML to an aggregate PML, effectively incorporating concern over increased frequency. Further, S&P expanded this catastrophe risk charge to primary companies in 2005 (prior to Katrina).
Exhibit 1 shows a chart S&P published in their 2011 Global Reinsurer Highlights report presenting the relative redundancy for hybrid reinsurers compared to property catastrophe/short-term reinsurers compared to the large global composite insurers. At all rating levels, reinsurers hold a much greater redundancy than the primary insurers.
At the same time, catastrophe model results have gone through significant changes since 2005, which have also fed into higher capital requirements. The rating agencies provide a standard approach regarding catastrophe model assumptions to be used within the PML analysis, all which effectively increased the model results. The main assumptions are:
• Use of most current model versions
• Use of near-term model results
• Inclusion of demand surge/loss amplification and storm surge
• Analysis based upon worldwide exposures
Deviations from the above prescribed model assumptions are subject to heightened scrutiny and require additional support. A.M. Best and S&P may increase the catastrophe PML charge applied within their respective capital models if they feel the company’s model results are too aggressive.
In addition to the catastrophe risk charge incorporated in their respective capital models, rating agencies also perform supplemental analysis on a reinsurer’s catastrophe exposure and concentrations, such as:
• Review of gross and net PMLs and aggregates by zone to identify concentrations
• Analysis of historical impact of catastrophe events on the loss ratio
• Evaluation of deterministic events including Lloyds’ Realistic Disaster Scenarios (RDS)
• Analyze tail value at risk (TVaR) PML results
• Review terror model results and apply scenario tests

5
Aon Benfield
The analyses are also compared against a reinsurer’s historical exposures to recognize developing trends and to identify potential peer companies as outliers. In addition to these sensitivity analyses, rating agencies review the underlying data quality of exposures and analyze the robustness and credit quality of reinsurance protection.
For many reinsurers, management of catastrophe risk is the driving factor of their financial strength rating highly influencing the rating agencies’ view of capital adequacy, operating performance, ERM, and overall competitive position.
Reinsurer resilience to global catastrophes of 2011 has provided early evidence that the increased scrutiny applied by rating agencies has lifted the overall credit quality of property catastrophe reinsurers.
Exhibit 1: S&P Estimates of Capital Redundancies
Source: S&P
0
10
20
30
40
50
Large Global Composite InsurersProperty Cat/Short-term ReinsurersHybrid Reinsurers
BBBAAAAAA

6
Credit Risk of Property Catastrophe Reinsurers
Reinsurer Management of Property Catastrophe Exposures
Overall, there is increased scrutiny on the public information released by reinsurers. Investors and other stakeholders expect the companies to actively manage the potential downside risk of catastrophes. Thus, ERM and other risk management initiatives have increased in importance as they represent the management team’s ability to execute its strategies and manage risk within its tolerances. As a result, information about ERM and a reinsurer’s risk tolerances is becoming increasingly available to stakeholders.
In 2007, Aon Benfield Analytics initiated an annual review of publicly disclosed risk tolerances. The percentage of companies reporting catastrophe risk tolerances has increased every year since Aon Benfield began analyzing the risk tolerance disclosures.
Exhibit 2: Percentage of Publicly Traded Insurers Reporting Catastrophe Risk Tolerances
Year Percentage Reporting
2011 87%
2010 82%
2009 80%
2008 76%
2007 66%
Source: Aon Benfield Analytics
Aon Benfield Analytics has collected the property catastrophe risk tolerances from the largest reinsurers that publicly disclose this information. Reinsurers may disclose more than one risk tolerance representing different return periods or different perils, and these tolerances may be stated on a per occurrence basis or in the aggregate. This study displays the publicly disclosed risk tolerance for each of the reinsurers at the 100-year, 250-year and 500-year event levels, to the extent available. In addition, the study discloses any other commentary companies made related to their catastrophe exposures and mitigation strategies, which is included in Appendix 2. All amounts are as disclosed, so differences in pre-tax versus post-tax amounts may exist.
Many reinsurers limit their risk tolerance for their single largest property catastrophe event to 25 percent or less of their current capital or equity, which implies that in elevated catastrophe years, 75 percent of their capital is available to fund losses above their stated risk tolerance and all other losses from other catastrophe losses or lines of business.
If the actual insured catastrophe losses of reinsurers (even sizeable losses) are within their risk tolerances, then stakeholders may have greater confidence in the reinsurer’s management team and their risk management practices. Furthermore, rating agencies may reward companies when losses from catastrophes fall within their public risk tolerances. For example, despite significant catastrophe losses in 2011, A.M. Best upgraded Validus to A (from A-) and Montpelier (currently rated A-) was assigned a positive outlook. Conversely, there is rating pressure when companies experience loss results outside of their risk tolerances or experience significant movements in their catastrophe loss estimates. For example, in October 2011 Platinum was downgraded by S&P primarily due to the significant deterioration of operating results following the company’s announcement of their 2011 catastrophe losses.
The losses incurred related to catastrophe events also have the potential to impact reinsurance companies stock price. Aon Benfield Analytics conducted a study on the impact of the 2005 catastrophes to a company’s stock price. The study attempted to ascertain the proportion of earnings and/or GAAP equity that could be lost without an adverse stock price reaction. The study revealed that the post-event share price could be best predicted after a single large event (Katrina) rather than an aggregation of events.

7
Aon Benfield
Exhibit 3: Reinsurer Publicly Disclosed Risk Tolerances
Return Period (Pre-Tax Net PML/Shareholder Equity)
Company 1:100 1:250 1:500 Source
ACE Limited 7.0% 10.0% N/D 10K
Allied World Assurance Company N/D 20.0% N/D 10K
Alterra N/D 25.0% N/D Annual Report
ARCH Capital Group, Ltd. N/D 25.0% N/D 10K
Argo Group N/D N/D N/D n/a
Aspen Insurance Holdings 15.5% 20.2% N/D Annual Report
Axis Capital Holdings 12.7% 18.0% N/D 10K
Berkshire Hathaway N/D N/D N/D n/a
Endurance Specialty Holdings, Inc. 25.0% N/D N/D 10K
Everest Re Group 10.0% N/D N/D 10K
Flagstone N/D N/D N/D Investor
Hannover Ruckversicherung AG N/D N/D N/D Annual Report
Montpelier Re Holdings 16.0% 19.0% N/D Annual Report
Muenchener Ruckversicherung AG N/D N/D N/D Annual Report
Partner Re N/D N/D N/D 10K
Platinum Underwriters N/D 11.3% N/D 10K
Renaissance Re Holdings N/D N/D N/D n/a
SCOR Reinsurance Company N/D N/D N/D A.M. Best Report
Swiss Reinsurance Company N/D N/D N/D Annual Report
Transatlantic Holdings 14.2% 23.4% N/D 10K
Validus Holdings Ltd. 25.8% N/D N/D Investor
White Mountains N/D 19.0% N/D 10K
XL 15.0% N/D N/D Annual Report
Source: Aon Benfield Analytics and Company Reports

8
Credit Risk of Property Catastrophe Reinsurers
Exhibit 4: Katrina Loss Ranges for Insurers and Reinsurers Losing Less Than 10 Percent Shareholder Value
Katrina Study Loss Percent Ranges* YE 1:100 PML Disclosure Mean as a Percent of Equity*
Sector As % of EquityAs % of Prospective Consensus Earnings
2008 2009 2010
Primary Insurers 3% to 6% 21% to 34% 6% 5% 4%
Reinsurers 12% to 19% 107% to 110% 19% 15% 17%
*Note: Means are displayed on a net after-tax basis Source: Aon Benfield Analytics
In order to ensure that losses from catastrophes are within risk tolerances, reinsurers must actively monitor their accumulations. Therefore, most property catastrophe reinsurers model their aggregate property exposures by peril and geographic regions. This is done either before the reinsurance contract is bound or in some cases immediately after, so that the reinsurer can ensure the overall exposure is within tolerances.
Reinsurers are in a better position to manage their exposure to catastrophe losses than primary insurers because their exposure is effectively capped by the limits of the reinsurance contract. Primary insurers are able to effectively manage their exposure to a predetermined limit (e.g., the 100-year or 250-year event level). However, if losses exceed the predetermined limit, the primary insurer must absorb the excess losses. Reinsurers, on the other hand, have a stated limit of liability for each catastrophe contract so their total exposure is known, capped and managed accordingly.
Exhibit 5: Sample Ceding Insurer Catastrophe Reinsurance Structure
Source: Aon Benfield Analytics
Insurer’sCo-Participation
Insurer’s Additional Exposure
Second Catastrophe Layer
First Catastrophe Layer
Insurer’s Retention
Reinsurerparticipations
are capped
250-YearPML
100-YearPML

9
Aon Benfield
Industry Analysis of U.S. Gross, Ceded & Net Property Catastrophe Risk
Over the past few years, Aon Benfield Analytics has developed a methodology and model that approximates the gross, ceded and net impact of property catastrophe reinsurance in the U.S. The goal of this analysis is to provide ceding companies with industry benchmarks, i.e., net PMLs to surplus at different return periods both on an occurrence and aggregate basis. By examining the data from this analysis, we draw some conclusions regarding credit risk of both insurers and reinsurers from U.S. property catastrophe events.
The approach employed by Aon Benfield Analytics is to aggregate and gross up the 2010 catastrophe modeling data from our clients to produce industry PML curves on a gross, ceded and net basis. Consistent modeling approaches are employed (e.g., with loss amplification/demand surge, but excluding storm surge). Modeled perils include wind, earthquake and severe convective storms, but exclude winter storms. The analysis only includes the reinsurance structure of property catastrophe reinsurance contracts, so per risk and quota share protections were excluded. Also, any reinstatement premium paid reduces the net recoveries.
Exhibit 6: Estimated Industry Losses on an Occurrence and Aggregate Basis
All Regions Hurricane All Regions Earthquake
Estimated Industry Loss - HU Estimated Industry Loss - EQ
Probability of Non-Exceedance
Return Period (Year)
Ceded % of Gross
FHCF Recoveries % of Gross
Ceded % of Gross
Net % of Gross
Probability of Non-Exceedance
Return Period (Year)
Ceded % of Gross
Net % of Gross
Occurrence Loss Occurrence Loss
99.90% 1,000 19.6% 6.7% 26.2% 71.8% 99.90% 1,000 25.7% 71.9%
99.80% 500 22.0% 8.5% 30.6% 67.3% 99.80% 500 27.8% 69.6%
99.60% 250 23.8% 10.5% 34.3% 63.3% 99.60% 250 29.7% 67.6%
99.50% 200 24.2% 11.6% 35.7% 61.7% 99.50% 200 30.1% 67.2%
99.00% 100 25.3% 14.1% 39.4% 58.1% 99.00% 100 28.3% 69.1%
98.00% 50 26.7% 17.9% 44.6% 53.1% 98.00% 50 22.9% 74.8%
96.00% 25 25.7% 18.7% 44.4% 53.5% 96.00% 25 14.7% 83.4%
90.00% 10 25.1% 13.1% 38.2% 59.3% 90.00% 10 9.4% 89.4%
Average Annual Loss 25.3% 9.3% 34.6% 65.4% Average Annual Loss 20.6% 79.4%
Aggregate Loss Aggregate Loss
99.90% 1,000 21.8% 6.5% 28.3% 71.7% 99.90% 1,000 28.0% 72.0%
99.80% 500 24.4% 8.2% 32.6% 67.4% 99.80% 500 30.2% 69.8%
99.60% 250 26.3% 10.1% 36.4% 63.6% 99.60% 250 32.1% 67.9%
99.50% 200 26.7% 11.0% 37.7% 62.3% 99.50% 200 32.3% 67.7%
99.00% 100 27.8% 13.2% 41.0% 59.0% 99.00% 100 30.1% 69.9%
98.00% 50 28.9% 16.1% 45.1% 54.9% 98.00% 50 24.7% 75.3%
96.00% 25 28.0% 16.3% 44.3% 55.7% 96.00% 25 16.2% 83.8%
90.00% 10 26.8% 11.1% 37.9% 62.1% 90.00% 10 10.3% 89.7%
Source: Aon Benfield Analytics

10
Credit Risk of Property Catastrophe Reinsurers
A few observations can be made by examining the data in Exhibit 6:
• At all return periods, the reinsurer’s portion of the loss is 30 percent or less of the total industry gross losses. This does not mean that only 30 percent of a 100-year loss will be reinsured for each individual company. In a 100-year industry event some companies will be severely affected—and may have a loss above their 100-year PML—and they will make substantial recoveries from their programs. At the same time, other companies will have losses within their retentions and will not recover. In the average the recovery will be 30 percent.
• The percentage of loss borne by the reinsurers declines for the larger events (after the 50 year return period for hurricanes and the 200 year return period for earthquakes) because reinsurance programs have explicit limits. This reflects the average return periods purchased by ceding insurers.
We recognize that per risk and quota share reinsurance not captured in this analysis will reduce the net loss to insurers and increase the ceded losses to some extent. However, if the recoverables from these other reinsurance contracts were included ceded losses would still be very manageable for reinsurers (per risk and quota share losses must be counted in rating agency calculations). Similar results are observed when examining the catastrophe losses by region.
Exhibit 7: Estimated Regional Losses on an Occurrence Basis
Ceded Percent of Gross Loss Net Percent of Gross Loss
Region 1 in 100 1 in 250 1 in 100 1 in 250
Florida 26.40% 24.44% 73.60% 75.56%
Gulf 22.04% 23.77% 77.96% 76.23%
Northeast 29.00% 28.71% 71.00% 71.29%
Mid-Atlantic 22.21% 28.33% 77.79% 71.67%
Hawaii 8.82% 19.12% 91.18% 80.88%
California 25.62% 31.28% 74.38% 68.72%
Pacific Northwest 6.82% 13.58% 93.18% 86.42%
New Madrid 1.90% 9.86% 98.10% 90.14%
New England 1.10% 16.62% 98.90% 92.45%
Severe Convective Storm 22.89% 27.88% 77.11% 72.12%
Source: Aon Benfield Analytics
11
Aon Benfield
Market Perceptions of Insurer and Reinsurer Credit Risk
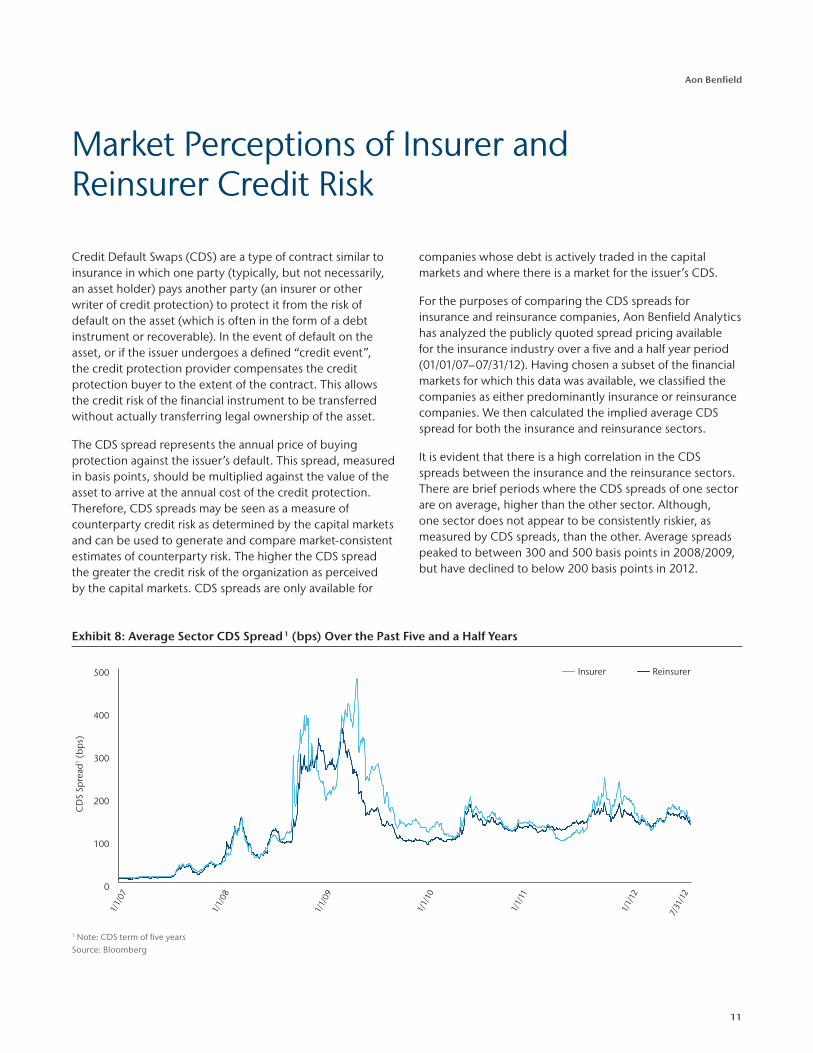
Credit Default Swaps (CDS) are a type of contract similar to insurance in which one party (typically, but not necessarily, an asset holder) pays another party (an insurer or other writer of credit protection) to protect it from the risk of default on the asset (which is often in the form of a debt instrument or recoverable). In the event of default on the asset, or if the issuer undergoes a defined “credit event”, the credit protection provider compensates the credit protection buyer to the extent of the contract. This allows the credit risk of the financial instrument to be transferred without actually transferring legal ownership of the asset.
The CDS spread represents the annual price of buying protection against the issuer’s default. This spread, measured in basis points, should be multiplied against the value of the asset to arrive at the annual cost of the credit protection. Therefore, CDS spreads may be seen as a measure of counterparty credit risk as determined by the capital markets and can be used to generate and compare market-consistent estimates of counterparty risk. The higher the CDS spread the greater the credit risk of the organization as perceived by the capital markets. CDS spreads are only available for
companies whose debt is actively traded in the capital markets and where there is a market for the issuer’s CDS.
For the purposes of comparing the CDS spreads for insurance and reinsurance companies, Aon Benfield Analytics has analyzed the publicly quoted spread pricing available for the insurance industry over a five and a half year period (01/01/07–07/31/12). Having chosen a subset of the financial markets for which this data was available, we classified the companies as either predominantly insurance or reinsurance companies. We then calculated the implied average CDS spread for both the insurance and reinsurance sectors.
It is evident that there is a high correlation in the CDS spreads between the insurance and the reinsurance sectors. There are brief periods where the CDS spreads of one sector are on average, higher than the other sector. Although, one sector does not appear to be consistently riskier, as measured by CDS spreads, than the other. Average spreads peaked to between 300 and 500 basis points in 2008/2009, but have declined to below 200 basis points in 2012.
Exhibit 8: Average Sector CDS Spread 1 (bps) Over the Past Five and a Half Years
1 Note: CDS term of five years Source: Bloomberg
0
100
200
300
400
500
CD
S Sp
read
1 (bp
s)
ReinsurerInsurer
1/1/
12
1/1/
10
1/1/
09
1/1/
08
1/1/
07
1/1/
11
7/31
/12

12
Credit Risk of Property Catastrophe Reinsurers
Reinsurer Performance: 2005 vs. 2011 Catastrophes
A common way to measure the relative performance of catastrophe reinsurers is to compare a catastrophe event or several catastrophe events against a company’s prior year equity. In this way, we can measure how much of a company’s capital is consumed by catastrophe events. Aon Benfield Analytics conducted a study on a number of catastrophe reinsurers in the following two catastrophe prone years:
• 2005: Significant catastrophe losses were driven by Hurricanes Katrina, Rita and Wilma (KRW)
• 2011: Significant catastrophe losses were driven by Australian floods, New Zealand earthquakes, the Tōhoku (Japanese) earthquake and tsunami, U.S. tornadoes and Thai floods
The purpose of the study was to determine any pattern in the amount of capital that was consumed by catastrophe events in two elevated catastrophe years. Exhibit 9 shows the percentage of catastrophe losses for both KRW and the 2011 catastrophes as a percentage of prior-year equity.
Of the 13 reinsurers included in the study, only four (Everest, Partner Re, Transatlantic, and White Mountains) had larger losses as a percentage of prior–year surplus that were higher in 2011 than 2005. Also it is notable that in 2005, five reinsurers had losses at or greater than 30 percent of their prior-year capital and none of the reinsurers included in the study experienced losses in excess of 30 percent of their prior-year capital in 2011.
Exhibit 10 is the same chart for the class of 2005 reinsurers, noting only Flagstone had a loss greater than 30 percent of capital.
Exhibit 9: Reinsurers’ Catastrophe Losses as Percent of Prior Year-end Capital
Source: Aon Benfield Analytics and Company Reports
Exhibit 10: Reinsurers’ Catastrophe Losses as Percent of Prior Year-end Capital
Source: Aon Benfield Analytics and Company Reports
0%
10%
20%
30%
40%
50%
60%
70%
80% 2011 Cat Losses2005 KRW
XL
Whi
te M
ount
ains
Tran
satla
ntic
Rena
issan
ce
Plat
inum
Part
nerR
e
Mon
tpel
ier
Ever
est
Endu
ranc
e
AXIS
Aspe
n
ArchAce
0%
10%
20%
30%
40%
ValidusLancashireHiscoxFlagstoneArielAmlin
2011 Cat Losses

13
Aon Benfield
Reinsurer Impairments Due to Catastrophe Events
A.M. Best releases an annual report outlining the primary drivers behind U.S. insurer insolvencies. The study covers years 1969-2010. Notably, the largest single driver of insurer insolvencies over this time horizon is deficient loss reserves or inadequate pricing, representing 40 percent of all insolvencies. Catastrophe losses have only represented a relatively small 7 percent of insurer insolvencies over the same time period.
Aon Benfield Analytics conducted a review of property and casualty reinsurer impairments since 2000 in order to determine the number of impairments directly related to property catastrophe events. We defined impairments by the following situations:
• Reinsurer is insolvent or liquidated
• Reinsurer is placed into rehabilitation or enters rehabilitation voluntarily
• Reinsurer is placed into run-off
This list represents legal entities that went insolvent, noting that two of the legal entities were subsidiaries of larger insurance groups that today remain ongoing, highly rated entities.
Our goal was to identify reinsurers that due to a catastrophe event may not be in position to meet their reinsurance obligations. We defined the reinsurers broadly—in some cases including companies that wrote more primary business than reinsurance (e.g., Reliance).
Using these definitions, we identified a total of eight reinsurers who became impaired over the 11-year period (from 2000–2011) that were triggered by natural and man-made catastrophe losses. Total capital of these companies at the year-end prior to the insolvency represented less than 1 percent of global reinsurance capital.
Exhibit 11: 1969-2010 A.M. Best Impairment Drivers
Source: A.M. Best 1969-2010 P/C Impairment Review, May 2, 2011
40.3%
13.6%7.8%
7.3%
8.6%
4.0%
7.8%
7.1%3.6%
Deficient Loss Reserves/Inadequate Pricing
Rapid Growth
Alleged Fraud
Investment Problems/Overstated Assets
Miscellaneous
Significant Changein Business
Reinsurance Failure
Catastrophe Losses
A�liate Problems

14
Credit Risk of Property Catastrophe Reinsurers
Exhibit 12: Legal Entity Impairments Due to Natural and Man-Made Catastrophe Events
Name/GroupYear of
Impairment Domicile
A.M. Best Rating Prior to Impairment*
S&P Rating Prior to
Impairment*Financial Impairment Catalyst (Current Status)
AXA Corporate Solutions Re. Co. 2003 U.S.A+ g
(stable)AA
(stable)Group reorganization influenced by WTC (Run-off)
Copenhagen Re. Co. Ltd. 2001 DenmarkA g
(stable)A
(stable)Excessive catastrophe losses – WTC (Run-off)
Gerling Global 2002 U.S.A g
(stable)AA-
(Watch Neg)Excessive catastrophe losses – WTC (Run-off)
Olympus Reinsurance Co. Ltd. 2005 BermudaA-
(stable)NR
Excessive catastrophe losses – 2005 (Run-off)
PXRE Reinsurance Ltd. 2006 U.S.A g
(stable)A
(stable)Excessive catastrophe losses – 2005 (Run-off)
Quanta Reinsurance Ltd. 2006 BermudaA- g
(stable)NR
Excessive catastrophe losses – 2004 & 2005 (Run-off)
Rosemont Re Ltd. 2005 BermudaA-
(stable)NR
Excessive catastrophe losses – 2004 & 2005 (Run-off)
Taisei Marine & Fire Ins. Co. 2001 Japan NR BBBpiExcessive catastrophe losses – WTC (Rehabilitation/Acquired)
*Rating prior to impairment = within 12 months of impairment news Note: WTC = World Trade Center catastrophe event of September 11, 2001. Source: Aon Benfield Analytics

15
Aon Benfield
Impaired Reinsurer Payment Analysis
Aon Benfield conducted a comprehensive study of claim payment performance on this list of reinsurers. Neither Axa Corporate Solutions nor Olympus Re was included as the parent organizations (AXA S.A. and White Mountains) continue to exist, and as such, non-payment is not a concern.
Aon Benfield examined the payment performance of these reinsurers on catastrophe claims from 1998 through 2011. The study revealed:
• Despite the impairment or run-off status of the reinsurer, over 99 percent of the catastrophe loss balances have been paid or in some cases commuted
• Impaired reinsurers continued to pay claims (and/or engage in commutations) for several years after the initial year of impairment
• The average payment turnaround time (measured in business days) increased for most of the impaired reinsurers post-impairment
The study provided evidence that most impaired reinsurers are able to continue paying claims for several years after impairment.
Aon Benfield’s Client Services team provided some additional information on the payment patterns of impaired reinsurers. While impairment can lead to an immediate stoppage in new risks being underwritten, the organization typically is able to continue to make claim payments. Ultimately, the payments are made on a more limited schedule (monthly or quarterly) to conserve resources and cash. The payment scheduling allows for a more orderly sale of the organization’s assets. In addition, impaired reinsurers often seek to commute their obligations as a means to expedite the winding down of the organization.

16
Credit Risk of Property Catastrophe Reinsurers
Conclusion
Catastrophe risk is one of the key drivers, both quantitatively and qualitatively, in the ratings process. Reinsurers have focused on effectively managing their catastrophe exposure and on setting strict limits for aggregate exposures. In 2005, A.M. Best added a catastrophe stress test to their BCAR analysis, which requires reinsurers to hold capital equal to two events instead of just one. Reinsurance exposure is generally capped by event, ensuring that reinsurers can limit their total exposure quite effectively. Evidence also shows that shareholders will penalize reinsurers for losses beyond reasonable levels, further incentivizing management to actively limit their catastrophe exposure to ensure losses stay within the acceptable levels. As a result, 2011 reinsurer losses as a percentage of prior-year capital were generally less than in 2005, despite higher ceded losses.
Since 2000, eight reinsurers went insolvent due to catastrophe losses, representing less than 1 percent of global reinsurance capital despite paying estimated catastrophe claims over USD150 billion. And in the instances of insolvency, 99 percent of claims were settled. Credit losses have been less than 10 basis points, consistent with ‘AA’ corporate bond default rates. The high capital requirements necessary to write catastrophe reinsurance and the industry’s overall focus on risk management will ensure that reinsurance continues to provide very high credit quality protection to insurers in the coming years.
17
Aon Benfield
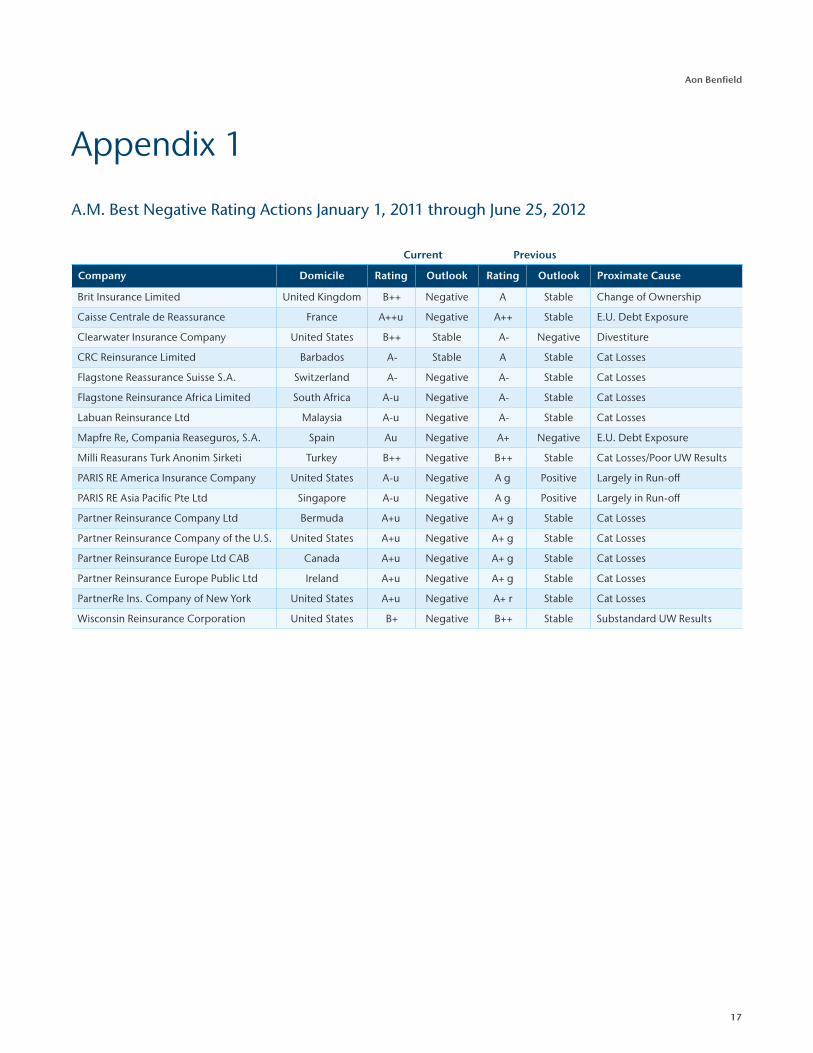
Appendix 1
A.M. Best Negative Rating Actions January 1, 2011 through June 25, 2012
Current Previous
Company Domicile Rating Outlook Rating Outlook Proximate Cause
Brit Insurance Limited United Kingdom B++ Negative A Stable Change of Ownership
Caisse Centrale de Reassurance France A++u Negative A++ Stable E.U. Debt Exposure
Clearwater Insurance Company United States B++ Stable A- Negative Divestiture
CRC Reinsurance Limited Barbados A- Stable A Stable Cat Losses
Flagstone Reassurance Suisse S.A. Switzerland A- Negative A- Stable Cat Losses
Flagstone Reinsurance Africa Limited South Africa A-u Negative A- Stable Cat Losses
Labuan Reinsurance Ltd Malaysia A-u Negative A- Stable Cat Losses
Mapfre Re, Compania Reaseguros, S.A. Spain Au Negative A+ Negative E.U. Debt Exposure
Milli Reasurans Turk Anonim Sirketi Turkey B++ Negative B++ Stable Cat Losses/Poor UW Results
PARIS RE America Insurance Company United States A-u Negative A g Positive Largely in Run-off
PARIS RE Asia Pacific Pte Ltd Singapore A-u Negative A g Positive Largely in Run-off
Partner Reinsurance Company Ltd Bermuda A+u Negative A+ g Stable Cat Losses
Partner Reinsurance Company of the U.S. United States A+u Negative A+ g Stable Cat Losses
Partner Reinsurance Europe Ltd CAB Canada A+u Negative A+ g Stable Cat Losses
Partner Reinsurance Europe Public Ltd Ireland A+u Negative A+ g Stable Cat Losses
PartnerRe Ins. Company of New York United States A+u Negative A+ r Stable Cat Losses
Wisconsin Reinsurance Corporation United States B+ Negative B++ Stable Substandard UW Results

18
Credit Risk of Property Catastrophe Reinsurers
S&P Negative Rating Actions from January 1, 2011 through June 25, 2012
Current Previous
Company Domicile Rating Outlook Rating Outlook Proximate Cause
Allianz Risk Transfer (Bermuda) Ltd. Bermuda AA- Negative AA- Stable E.U. Debt Exposure
Allianz Risk Transfer AG Switzerland AA- Negative AA- Stable E.U. Debt Exposure
Allianz Risk Transfer N.V. Netherlands AA- Negative AA- Stable E.U. Debt Exposure
Algemene Levensherverzekering Maatschappij N.V.
Netherlands A- Stable AA- Stable Loss of Business
Asia Capital Reinsurance Group Pte Ltd. Singapore A- Negative A- Stable Cat Losses
Assured Guaranty Re Ltd. Bermuda AA- Stable AA Stable Rating Criteria Change
Assured Guaranty Re Overseas Ltd. Bermuda AA- Stable AA Stable Rating Criteria Change
Ariel Reinsurance Co. Ltd. Bermuda NR – BBB Stable Majority of Business Sold
Caisse Centrale de Reassurance France AA+ Negative AAA Stable E.U. Debt Exposure
Faraday Reinsurance Co. Ltd. United Kingdom AA+ Negative AA+ Stable Sovereign Rating
General Re Life Corp. United States AA+ Negative AA+ Stable Sovereign Rating
General Reinsurance Africa Ltd. South Africa AA+ Negative AA+ Stable Sovereign Rating
General Reinsurance AG Germany AA+ Negative AA+ Stable Sovereign Rating
General Reinsurance Australia Ltd. Australia AA+ Negative AA+ Stable Sovereign Rating
General Reinsurance Corp. United States AA+ Negative AA+ Stable Sovereign Rating
General Reinsurance Life Australia Ltd. Australia AA+ Negative AA+ Stable Sovereign Rating
Generali Rueckversicherung AG Austria BBB+ Stable AA- Stable E.U. Debt Exposure
Generali USA Life Reassurance Co. United States A Stable A+ Stable E.U. Debt Exposure
Hannover Reinsurance Africa Ltd. South Africa A Negative A Stable Sovereign Rating
Hartford International Life Reassurance Corp.
United States A- Stable A Negative Change in Company Strategy
Investors Insurance Corp. United States – – A Positive Acquisition
Kot Insurance Company A.G. Switzerland A- Stable A Stable Sovereign Rating
Mapfre Re, Compania de Reaseguros, S.A. Spain A- Negative AA Negative E.U. Debt Exposure
Mitsui Sumitomo Reinsurance Ltd. Ireland A+ Stable AA- Stable Cat Losses
MS Frontier Reinsurance Ltd. Bermuda A+ Stable AA- Stable Cat Losses
Munich Mauritius Reinsurance Co. Ltd. South Africa A Negative A+ Negative Sovereign Rating
Munich Reinsurance Co. of Africa Ltd. South Africa A Negative A+ Negative Sovereign Rating
Nacional de Reaseguros S.A. Spain BBB+ Negative A+ Stable E.U. Debt Exposure
National Indemnity Co. United States AA+ Negative AA+ Stable Sovereign Rating
National Reinsurance Corp. United States AA+ Negative AA+ Stable Sovereign Rating

19
Aon Benfield
Current Previous
Company Domicile Rating Outlook Rating Outlook Proximate Cause
Omnium Insurance and Reinsurance Co. Ltd.
France AA- Stable AA Negative Unfavorable Market
Pacific Life Re Ltd. United Kingdom A+ Negative A+ Stable Unfavorable Market
PARIS RE America Insurance Co. United States A+ Stable AA- Negative Largely in Run-off
PARIS RE Asia-Pacific Pte. Ltd. Singapore A+ Stable AA- Negative Largely in Run-off
PARIS RE RISC Ltd. Bermuda A+ Stable AA- Negative Largely in Run-off
PARIS RE S.A. France – – AA- Negative Largely in Run-off
PARIS RE Switzerland Ltd. Switzerland A+ Stable AA- Negative Largely in Run-off
Partner Re Ireland Insurance Ltd. Ireland A+ Stable AA- Negative Cat Losses
Partner Reinsurance Co. Ltd. Bermuda A+ Stable AA- Negative Cat Losses
Partner Reinsurance Co. of U.S. United States A+ Stable AA- Negative Cat Losses
Partner Reinsurance Europe Ltd. Ireland A+ Stable AA- Negative Cat Losses
Platinum Underwriters Reinsurance Inc. United States A- Stable A Stable Cat Losses
Pozavarovalnica Sava, d.d. Slovenia A- Negative A- Stable Sovereign Rating
Royal Bank of Canada Insurance Co. Ltd. Barbados AA- Stable AA- Positive Unfavorable Market
SCOR Ruekversicherung (Deutschland) AG
Germany – – A Positive Acquisition
Societe Centrale de Reassurance Morocco BBB Stable BBB+ Stable E.U. Debt Exposure
Thai Reinsurance Public Co. Ltd. Thailand BBB+ Negative A- Stable Cat Losses
Tokio Marine Global Ltd. United Kingdom AA- Negative AA Negative Sovereign Rating
Tokio Marine Global Re Ltd. Ireland AA- Negative AA Negative Sovereign Rating
Tokio Marine Retakaful Pte. Ltd. Singapore AA- Negative AA Negative Sovereign Rating
Tokio Millennium Re Ltd. Japan AA- Negative AA Negative Sovereign Rating
Transamerica International Reinsurance Ireland Ltd.
Ireland A Positive AA- Negative Acquisition
Triglav Re, Reinsurance Co. Ltd. Slovenia A Negative A Stable E.U. Debt Exposure
UNIQA Re AG Switzerland A- Stable A Negative E.U. Debt Exposure
20
Credit Risk of Property Catastrophe Reinsurers
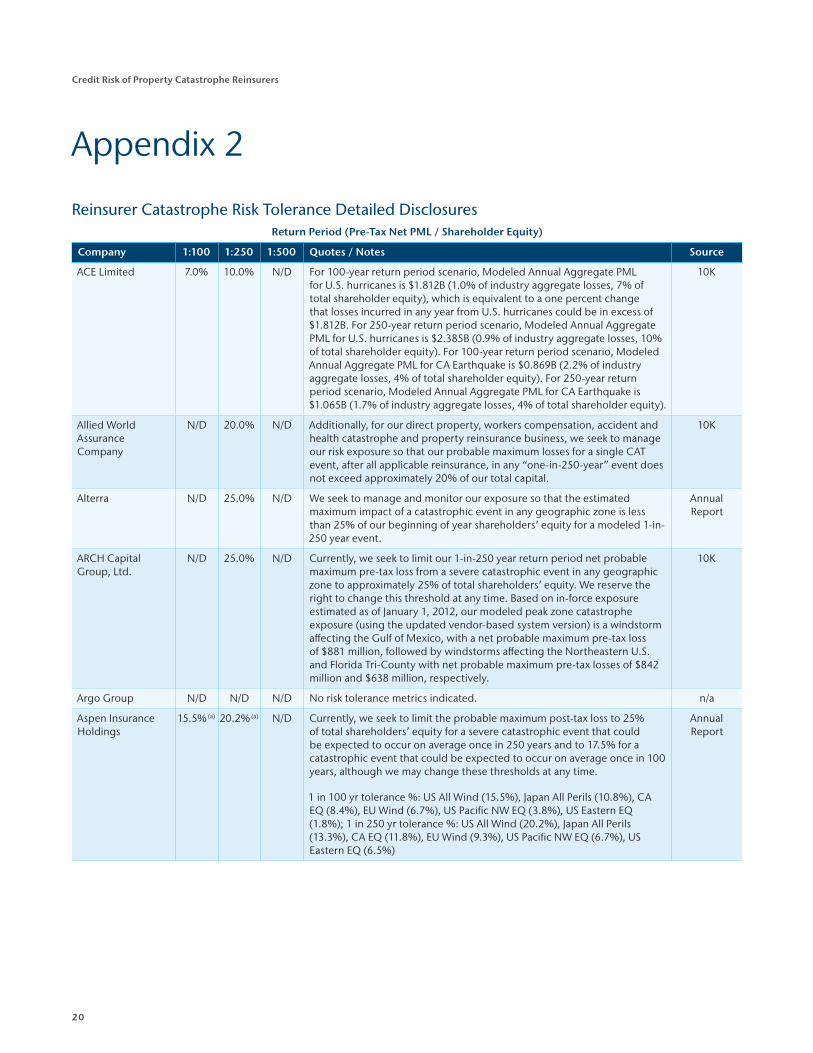
Appendix 2
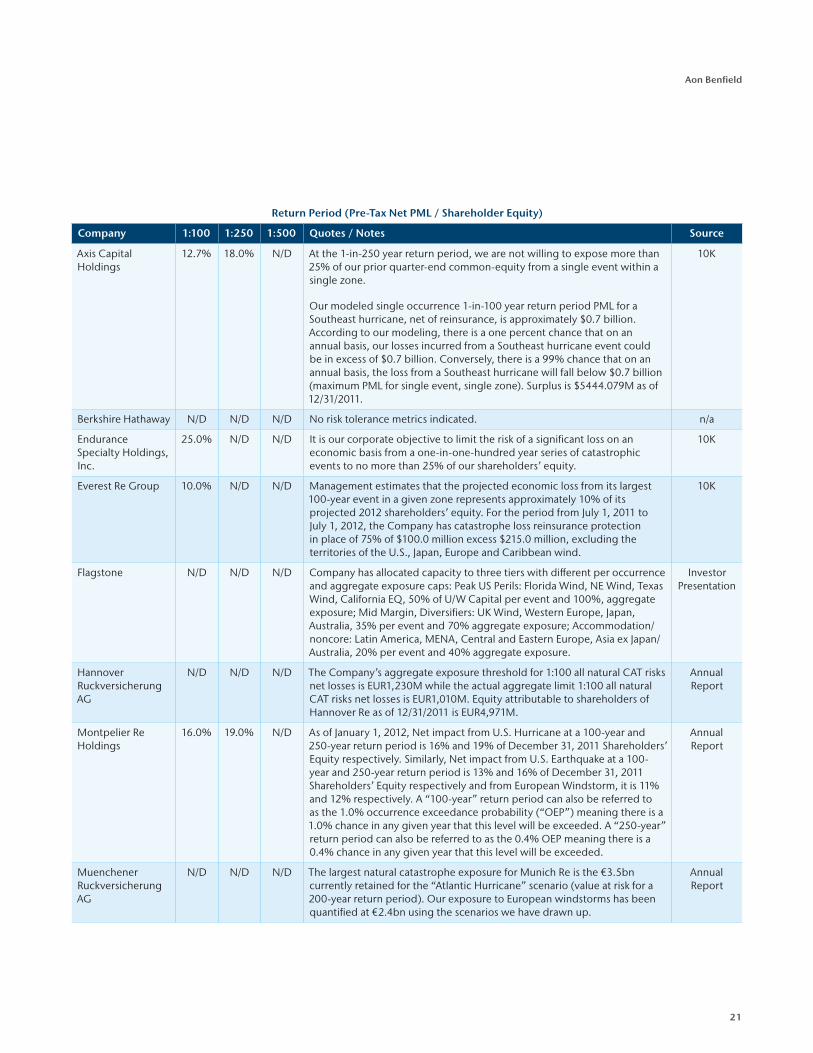
Reinsurer Catastrophe Risk Tolerance Detailed DisclosuresReturn Period (Pre-Tax Net PML / Shareholder Equity)
Company 1:100 1:250 1:500 Quotes / Notes Source
ACE Limited 7.0% 10.0% N/D For 100-year return period scenario, Modeled Annual Aggregate PML for U.S. hurricanes is $1.812B (1.0% of industry aggregate losses, 7% of total shareholder equity), which is equivalent to a one percent change that losses incurred in any year from U.S. hurricanes could be in excess of $1.812B. For 250-year return period scenario, Modeled Annual Aggregate PML for U.S. hurricanes is $2.385B (0.9% of industry aggregate losses, 10% of total shareholder equity). For 100-year return period scenario, Modeled Annual Aggregate PML for CA Earthquake is $0.869B (2.2% of industry aggregate losses, 4% of total shareholder equity). For 250-year return period scenario, Modeled Annual Aggregate PML for CA Earthquake is $1.065B (1.7% of industry aggregate losses, 4% of total shareholder equity).
10K
Allied World Assurance Company
N/D 20.0% N/D Additionally, for our direct property, workers compensation, accident and health catastrophe and property reinsurance business, we seek to manage our risk exposure so that our probable maximum losses for a single CAT event, after all applicable reinsurance, in any “one-in-250-year” event does not exceed approximately 20% of our total capital.
10K
Alterra N/D 25.0% N/D We seek to manage and monitor our exposure so that the estimated maximum impact of a catastrophic event in any geographic zone is less than 25% of our beginning of year shareholders’ equity for a modeled 1-in-250 year event.
Annual Report
ARCH Capital Group, Ltd.
N/D 25.0% N/D Currently, we seek to limit our 1-in-250 year return period net probable maximum pre-tax loss from a severe catastrophic event in any geographic zone to approximately 25% of total shareholders’ equity. We reserve the right to change this threshold at any time. Based on in-force exposure estimated as of January 1, 2012, our modeled peak zone catastrophe exposure (using the updated vendor-based system version) is a windstorm affecting the Gulf of Mexico, with a net probable maximum pre-tax loss of $881 million, followed by windstorms affecting the Northeastern U.S. and Florida Tri-County with net probable maximum pre-tax losses of $842 million and $638 million, respectively.
10K
Argo Group N/D N/D N/D No risk tolerance metrics indicated. n/a
Aspen Insurance Holdings
15.5% (a) 20.2% (a) N/D Currently, we seek to limit the probable maximum post-tax loss to 25% of total shareholders’ equity for a severe catastrophic event that could be expected to occur on average once in 250 years and to 17.5% for a catastrophic event that could be expected to occur on average once in 100 years, although we may change these thresholds at any time.
1 in 100 yr tolerance %: US All Wind (15.5%), Japan All Perils (10.8%), CA EQ (8.4%), EU Wind (6.7%), US Pacific NW EQ (3.8%), US Eastern EQ (1.8%); 1 in 250 yr tolerance %: US All Wind (20.2%), Japan All Perils (13.3%), CA EQ (11.8%), EU Wind (9.3%), US Pacific NW EQ (6.7%), US Eastern EQ (6.5%)
Annual Report
21
Aon Benfield
Return Period (Pre-Tax Net PML / Shareholder Equity)
Company 1:100 1:250 1:500 Quotes / Notes Source
Axis Capital Holdings
12.7% 18.0% N/D At the 1-in-250 year return period, we are not willing to expose more than 25% of our prior quarter-end common-equity from a single event within a single zone.
Our modeled single occurrence 1-in-100 year return period PML for a Southeast hurricane, net of reinsurance, is approximately $0.7 billion. According to our modeling, there is a one percent chance that on an annual basis, our losses incurred from a Southeast hurricane event could be in excess of $0.7 billion. Conversely, there is a 99% chance that on an annual basis, the loss from a Southeast hurricane will fall below $0.7 billion (maximum PML for single event, single zone). Surplus is $5444.079M as of 12/31/2011.
10K
Berkshire Hathaway N/D N/D N/D No risk tolerance metrics indicated. n/a
Endurance Specialty Holdings, Inc.
25.0% N/D N/D It is our corporate objective to limit the risk of a significant loss on an economic basis from a one-in-one-hundred year series of catastrophic events to no more than 25% of our shareholders’ equity.
10K
Everest Re Group 10.0% N/D N/D Management estimates that the projected economic loss from its largest 100-year event in a given zone represents approximately 10% of its projected 2012 shareholders’ equity. For the period from July 1, 2011 to July 1, 2012, the Company has catastrophe loss reinsurance protection in place of 75% of $100.0 million excess $215.0 million, excluding the territories of the U.S., Japan, Europe and Caribbean wind.
10K
Flagstone N/D N/D N/D Company has allocated capacity to three tiers with different per occurrence and aggregate exposure caps: Peak US Perils: Florida Wind, NE Wind, Texas Wind, California EQ, 50% of U/W Capital per event and 100%, aggregate exposure; Mid Margin, Diversifiers: UK Wind, Western Europe, Japan, Australia, 35% per event and 70% aggregate exposure; Accommodation/noncore: Latin America, MENA, Central and Eastern Europe, Asia ex Japan/Australia, 20% per event and 40% aggregate exposure.
Investor Presentation
Hannover Ruckversicherung AG
N/D N/D N/D The Company’s aggregate exposure threshold for 1:100 all natural CAT risks net losses is EUR1,230M while the actual aggregate limit 1:100 all natural CAT risks net losses is EUR1,010M. Equity attributable to shareholders of Hannover Re as of 12/31/2011 is EUR4,971M.
Annual Report
Montpelier Re Holdings
16.0% 19.0% N/D As of January 1, 2012, Net impact from U.S. Hurricane at a 100-year and 250-year return period is 16% and 19% of December 31, 2011 Shareholders’ Equity respectively. Similarly, Net impact from U.S. Earthquake at a 100-year and 250-year return period is 13% and 16% of December 31, 2011 Shareholders’ Equity respectively and from European Windstorm, it is 11% and 12% respectively. A “100-year” return period can also be referred to as the 1.0% occurrence exceedance probability (“OEP”) meaning there is a 1.0% chance in any given year that this level will be exceeded. A “250-year” return period can also be referred to as the 0.4% OEP meaning there is a 0.4% chance in any given year that this level will be exceeded.
Annual Report
Muenchener Ruckversicherung AG
N/D N/D N/D The largest natural catastrophe exposure for Munich Re is the €3.5bn currently retained for the “Atlantic Hurricane” scenario (value at risk for a 200-year return period). Our exposure to European windstorms has been quantified at €2.4bn using the scenarios we have drawn up.
Annual Report
22
Credit Risk of Property Catastrophe Reinsurers
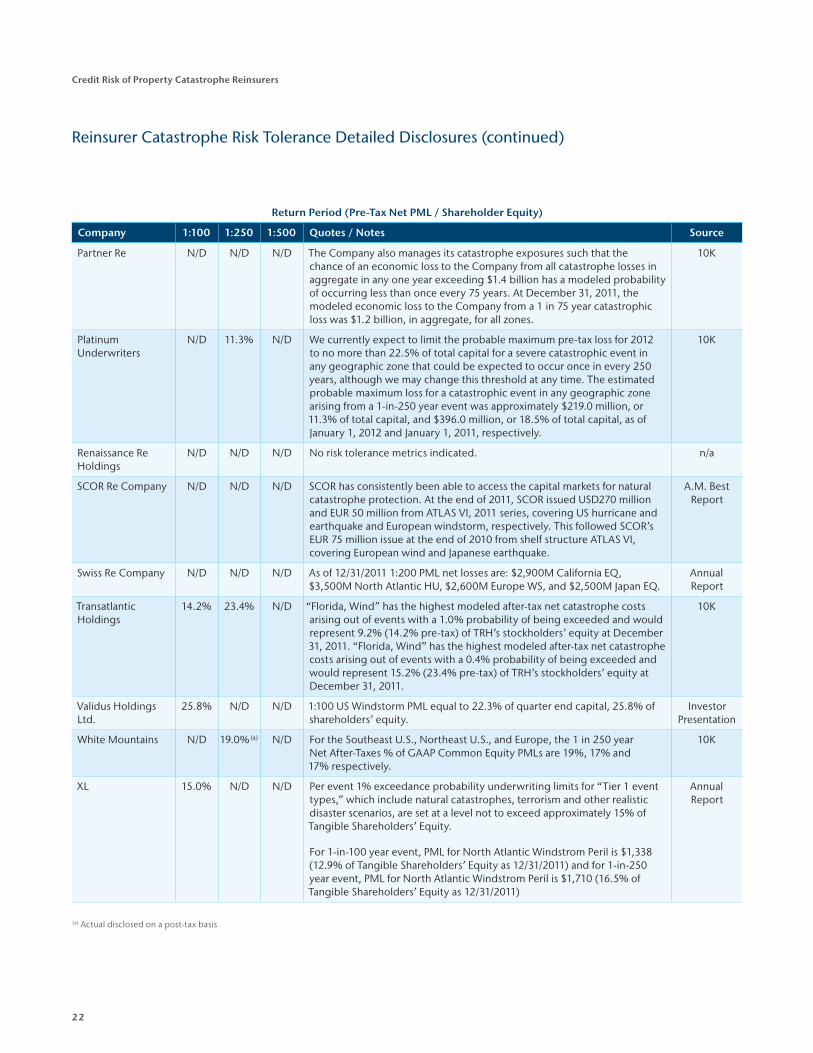
Return Period (Pre-Tax Net PML / Shareholder Equity)
Company 1:100 1:250 1:500 Quotes / Notes Source
Partner Re N/D N/D N/D The Company also manages its catastrophe exposures such that the chance of an economic loss to the Company from all catastrophe losses in aggregate in any one year exceeding $1.4 billion has a modeled probability of occurring less than once every 75 years. At December 31, 2011, the modeled economic loss to the Company from a 1 in 75 year catastrophic loss was $1.2 billion, in aggregate, for all zones.
10K
Platinum Underwriters
N/D 11.3% N/D We currently expect to limit the probable maximum pre-tax loss for 2012 to no more than 22.5% of total capital for a severe catastrophic event in any geographic zone that could be expected to occur once in every 250 years, although we may change this threshold at any time. The estimated probable maximum loss for a catastrophic event in any geographic zone arising from a 1-in-250 year event was approximately $219.0 million, or 11.3% of total capital, and $396.0 million, or 18.5% of total capital, as of January 1, 2012 and January 1, 2011, respectively.
10K
Renaissance Re Holdings
N/D N/D N/D No risk tolerance metrics indicated. n/a
SCOR Re Company N/D N/D N/D SCOR has consistently been able to access the capital markets for natural catastrophe protection. At the end of 2011, SCOR issued USD270 million and EUR 50 million from ATLAS VI, 2011 series, covering US hurricane and earthquake and European windstorm, respectively. This followed SCOR’s EUR 75 million issue at the end of 2010 from shelf structure ATLAS VI, covering European wind and Japanese earthquake.
A.M. Best Report
Swiss Re Company N/D N/D N/D As of 12/31/2011 1:200 PML net losses are: $2,900M California EQ, $3,500M North Atlantic HU, $2,600M Europe WS, and $2,500M Japan EQ.
Annual Report
Transatlantic Holdings
14.2% 23.4% N/D “Florida, Wind” has the highest modeled after-tax net catastrophe costs arising out of events with a 1.0% probability of being exceeded and would represent 9.2% (14.2% pre-tax) of TRH’s stockholders’ equity at December 31, 2011. “Florida, Wind” has the highest modeled after-tax net catastrophe costs arising out of events with a 0.4% probability of being exceeded and would represent 15.2% (23.4% pre-tax) of TRH’s stockholders’ equity at December 31, 2011.
10K
Validus Holdings Ltd.
25.8% N/D N/D 1:100 US Windstorm PML equal to 22.3% of quarter end capital, 25.8% of shareholders’ equity.
Investor Presentation
White Mountains N/D 19.0% (a) N/D For the Southeast U.S., Northeast U.S., and Europe, the 1 in 250 year Net After-Taxes % of GAAP Common Equity PMLs are 19%, 17% and 17% respectively.
10K
XL 15.0% N/D N/D Per event 1% exceedance probability underwriting limits for “Tier 1 event types,” which include natural catastrophes, terrorism and other realistic disaster scenarios, are set at a level not to exceed approximately 15% of Tangible Shareholders’ Equity.
For 1-in-100 year event, PML for North Atlantic Windstrom Peril is $1,338 (12.9% of Tangible Shareholders’ Equity as 12/31/2011) and for 1-in-250 year event, PML for North Atlantic Windstrom Peril is $1,710 (16.5% of Tangible Shareholders’ Equity as 12/31/2011)
Annual Report
(a) Actual disclosed on a post-tax basis
Reinsurer Catastrophe Risk Tolerance Detailed Disclosures (continued)

About Aon BenfieldAon Benfield, a division of Aon plc (NYSE: AON), is the world‘s leading reinsurance intermediary and full-service capital advisor. We empower our clients to better understand, manage and transfer risk through innovative solutions and personalized access to all forms of global reinsurance capital across treaty, facultative and capital markets. As a trusted advocate, we deliver local reach to the world‘s markets, an unparalleled investment in innovative analytics, including catastrophe management, actuarial and rating agency advisory. Through our professionals’ expertise and experience, we advise clients in making optimal capital choices that will empower results and improve operational effectiveness for their business. With more than 80 offices in 50 countries, our worldwide client base has access to the broadest portfolio of integrated capital solutions and services. To learn how Aon Benfield helps empower results, please visit aonbenfield.com.
© Aon Benfield Inc. 2012.
All rights reserved. This document is intended for general information purposes only and should not be construed as advice or opinions on any specific facts or circumstances. This analysis is based upon information from sources we consider to be reliable, however Aon Benfield Inc. does not warrant the accuracy of the data or calculations herein. The content of this document is made available on an “as is” basis, without warranty of any kind. Aon Benfield Inc. disclaims any legal liability to any person or organization for loss or damage caused by or resulting from any reliance placed on that content. Members of Aon Benfield Analytics will be pleased to consult on any specific situations and to provide further information regarding the matters.
Scan here to access Aon Benfield’s latest reports.
Kelly SuperczynskiHead of Global Rating Agency Advisory 1.312.381.5351 [email protected]
Stephen MildenhallCEO, Aon Benfield Analytics +1.312.381.5880 [email protected]
Parr SchoolmanHead of Global Risk & Capital Strategy +1.312.381.5330 [email protected]
For additional information on this analysis or our analytical capabilities, please contact your local Aon Benfield Broker or a member of the Aon Benfield Analytics team, including:
Contact Information

200 E. Randolph Street, Chicago, Illinois 60601 t: +1 312 381 5300 | f: +1 312 381 0160 | aonbenfield.com
Copyright Aon Benfield Inc. 2012 | #10027 – 08/2012