credit rating adjustments prior to default and recovery rates · are qualitative in nature and...
TRANSCRIPT

Credit Rating Adjustments Prior to Default andRecovery Rates∗
Samuel B. Bonsall, IV†, Kevin Koharki‡, Karl A. Muller, III§, and AnywhereSikochi¶
This version: March 7, 2017
First version: September 1, 2016
∗The authors thank Lauren Cohen, Monica Neamtiu, and workshop participants at Harvard Universityfor helpful comments and Moody’s Investors Service for assistance with their Default and Recovery Database.Bonsall would like to thank The Fisher College of Business for financial support. Koharki would like to thankthe Olin Business School for financial support. Muller would like to thank the Smeal College of Businessand the Poole Faculty Fellowship for financial support. Sikochi would like to thank Harvard Business Schoolfor financial support.†Associate Professor of Accounting, The Ohio State University, Fisher College of Business, 432 Fisher
Hall, Columbus, OH, 43210, USA phone: 614-688-1329, email: [email protected]‡Corresponding Author: Assistant Professor of Accounting, Washington University in St. Louis, Olin
Business School, One Brookings Drive, 238 Simon Hall, St. Louis, MO, 63130, USA phone: 314-449-1466,email: [email protected]§Associate Professor of Accounting, The Pennsylvania State University, Smeal College of Business, 384
Business Building, University Park, PA, 16802, USA phone: 814-865-0202, email: [email protected]¶Assistant Professor of Business Administration, Harvard University, Harvard Business School, 389 Mor-
gan Hall, Boston, MA, 02163, USA phone: 617-496-3756, email: [email protected]

Credit Rating Adjustments Prior to Default and
Recovery Rates
Abstract
This study investigates whether rating agencies apply more stringent rating adjust-ments leading up to issuer defaults and whether the adjustments predict lender recov-eries following default. Over the two years preceding default, we find that assignedratings grow increasingly pessimistic relative to a standard benchmark rating modelprediction, suggesting that rating agencies attempt to limit their reputational risk fordefaulting issuers. In addition, we find that lender recovery rates are associated withboth model-based predicted ratings and rating adjustments. Further, consistent withrating agencies making adjustments strategically, we find that rating adjustments arerelatively more optimistic and less accurate measures of recovery rates when there isheightened competition from Fitch Ratings.
Keywords: credit rating agencies; rating stringency; loss given default; expected rat-ings
JEL Classifications: K00, G24, M40

1 Introduction
The major credit rating agencies are commonly criticized for assigning credit ratings that
are untimely or that fail to accurately highlight borrowers’ credit risk (Beaver et al., 2006;
Cheng and Neamtiu, 2009; Cornaggia and Cornaggia, 2013). The concern is typically cen-
tered around the issuer-pay model employed by the “Big Three” credit rating agencies (Stan-
dard and Poor’s (S&P), Moody’s Investors Service (Moody’s), and Fitch Ratings (Fitch)),
which can lead the credit rating agencies to issue inflated ratings for borrowers and delay
downgrading issuers with declining credit quality. The concern is further exacerbated by the
potential that the rating agencies’ reputational costs of poor rating performance are insignif-
icant because of heavy regulatory reliance on published credit ratings and the oligopolistic
structure of the credit rating agency industry (Partnoy, 1999, 2010), coupled with rating
agencies’ success in avoiding significant penalties for failing to provide accurate credit rat-
ings. If reputational concerns fail to discipline the major credit rating agencies, then reliance
on firms’ assigned credit ratings can potentially harm borrowers, creditors, and investors.
Recent empirical evidence supports these concerns (e.g., Cornaggia and Cornaggia, 2013).
The rating agencies, in contrast, argue that potential reputational costs are sufficient to
offset the incentives created by the issuer-pay model (Covitz and Harrison, 2003; Securities
and Commission, 2003; Senate, 2002). Academic research supports this claim. For instance,
Bolton et al. (2012) demonstrates analytically that investor discovery of inflated ratings will
lead investors to punish a rating agency through lower reliance on their ratings. This can
reduce future demand for their services, and thus future economic rents. Recent empirical
evidence furthers this notion as deHaan (2016) shows that market participants reduced their
reliance on corporate credit ratings after the 2008 financial crisis, even though corporate
rating quality did not suffer in the pre-period.1 However, Bolton et al. (2012) also shows
that ratings inflation is expected to be more common when the risk of detection is lower.
1The Big Three have also suffered from a more stringent regulatory framework as The Dodd-Frank WallStreet Reform and Consumer Protection Act calls for a reduction in regulatory reliance on firms’ assignedcredit ratings.
1

Prior empirical evidence provides support for the effect of reputational costs on credit rating
properties in the settings of mortgage-backed securities ratings prior to the collapse of the
market (Ashcraft et al., 2011), of ratings-based contracts (Kraft, 2015a), of widely-covered
issuers (Bonsall et al., 2016a), and of bank securitization (Bonsall et al., 2015b).
In this study, we examine the impact of issuer default on credit rating agencies’ strate-
gic use of ratings adjustments. Certain rating agencies (i.e., Moody’s and Fitch) rely on
both quantitative and qualitative analyses to forecast both the incidence of default and loss
given default.2 As Moody’s discusses, “quantification is integral to Moody’s rating analysis,
partially since it provides an objective and factual starting point for each rating commit-
tee’s analytical discussion [...] However, Moody’s ratings are not based on a defined set
of financial ratios or rigid computer models. Rather, they are a product of comprehensive
analysis of each individual issue and issuer by experienced, well-informed, impartial credit
analysts” (Moody’s Investors Service, 2016a). We examine whether these subjective rating
adjustments are applied strategically to limit potential reputational harm from being opti-
mistic at the time of issuer default. That is, we investigate whether rating adjustments are
increasingly pessimistic (i.e., stringent) as default approaches, consistent with the adjust-
ments being strategically biased. In addition, we examine if rating adjustments are useful in
explaining default recoveries. Further, we examine whether these actions are less pronounced
when rating agencies face weaker incentives to protect their reputations.
We measure rating adjustments as the difference between the actual rating and the pre-
dicted, or expected, rating from a benchmark rating model adapted from Baghai et al.
(2014). We define the adjustments as optimistic (pessimistic) when the actual rating is more
(less) favorable than the predicted rating from the benchmark model estimated for that
year. These rating adjustments are comprised of both hard and soft adjustments. Hard
adjustments are quantitative-based and typically made to recast financial ratios based on
reported GAAP numbers to amounts more appropriate for judging credit risk, such as the
2While S&P also relies on both quantitative and qualitative analysis, S&P’s assigned ratings do notincorporate loss given default. Given this, Moody’s ratings are the focus of our study.
2

capitalization of operating leases to assess an issuer’s leverage. Conversely, soft adjustments
are qualitative in nature and typically include items that require greater judgement, such as
managerial ability (Bonsall et al., 2015a), governance, and internal controls, among others.
As discussed in prior research (Bonsall, 2014; Bonsall et al., 2016b; Griffin and Sanvi-
cente, 1982; Jorion et al., 2005; Kliger and Sarig, 2000; Walker, 2010), the issuer-pay model
can lead to rating adjustments that incorporate issuers’ private information. Specifically,
privileged internal data (e.g., budgetary information or management forecasts) can be given
to rating agencies without fear that the specific information will be revealed through the
public release of credit ratings. While certain private information may be more quantitative
in nature, private information can also be qualitative. For instance, access to management
can allow credit rating agencies to more adequately assess management characteristics like
ability and integrity and firm characteristics like competitiveness within an industry or busi-
ness segment and corporate culture, among others.3 Therefore, these adjustments can be
warranted because alterations to GAAP-based financial ratios and qualitative information
about attributes like management quality can plausibly provide incremental information re-
garding firms’ ability to meet debt service obligations beyond that provided by a financial
ratio-based model. However, these adjustments can also provide a means for inflating ratings
because of the inherently subjective nature of evaluating qualitative information.
Using Moody’s Default and Recovery Database for default dates and losses and Moody’s
ratings from 1992–2015, we find that qualitative adjustments become increasingly pessimistic
leading up to events of default. The increase in pessimism is economically meaningful—in
the two years preceding default the average rating adjustment results in approximately a
one notch reduction in the actual rating (e.g., one rating notch equates to the numerical
difference between A2 and A3 on Moody’s rating scale). We also examine a matched sample
of issuers from the same industry and year but do not default within the next five years.
3While firm-provided nonpublic information could assist rating agencies in conducting qualitative analysis,it is not a necessity. For instance, sell-side equity analysts conduct qualitative analysis despite RegulationFair Disclosure eliminating their access to material nonpublic information (Bradley et al., 2016; Brown et al.,2015; Cheng et al., 2016).
3

These non-defaulting issuers allow us to control for any potential industry and year effects
that could influence our findings. While we find evidence of ratings pessimism with non-
defaulting firms, the magnitude is much smaller and does not appear to follow the time
trend observed for defaulting issuers over the same two-year period of time. The difference
in rating adjustments for default and non-default firms continues to provide evidence of
increasing pessimism for default firms of similar magnitude.
The importance of rating accuracy also extends to creditor recovery rates. Recovery rates
are important for rating users because they assist investors in determining how much collat-
eral will be recovered during liquidation. This is particularly difficult as it requires extensive
judgement about the interplay among capital structure, creditor rights, jurisdiction, state
law, and other forces in determining liquidation payouts. Therefore, inaccurate assessments
of creditor recovery rates could significantly reduce the informativeness of Moody’s assigned
credit ratings. We posit that reputational concerns extend to Moody’s estimation of creditor
recovery rates; thus we predict a positive relation between rating agency adjustments and
creditor recovery rates. We find that rating adjustments for defaulting issuers are predictive
of recovery rates—i.e., optimistic adjustments predict lower losses given default.
Our findings suggest that Moody’s cares more about its reputation as firms’ default risk
increases and that Moody’s assigns less optimistically biased credit ratings for firms that
eventually default. However, the possibility exists that firms approaching default either
voluntarily or at the rating agencies’ requests provide credit rating agencies with more infor-
mation to accurately assess credit risk. Issuers may do so for several reasons: 1) restructuring
and turnaround plans are typically put in place prior to the event of default; thus more infor-
mation is typically available to be shared with credit rating agencies ex ante; 2) issuers may
wish to reduce the likelihood of “surprise” default events because these can potentially cause
panic among market participants, and thus reduce recoveries in the liquidation process; and
3) greater information sharing pre-default cannot only help determine the specific timing
of default but also provide greater insight into the remaining entity’s characteristics and
4

competitiveness upon exiting the bankruptcy process. If true, our primary findings could be
the result of greater information sharing by issuers prior to default rather than credit rating
agencies’ reputational concerns.
To better assess the role that reputational concerns play in the rating process, we ex-
amine whether increased competition from other credit rating agencies impacts the quality
of incumbents’ assigned credit ratings. Specifically, we examine whether Moody’s rating
adjustments are more optimistic leading up to default and less predictive of creditor re-
covery rates when Fitch has greater market share in a given industry. Variation in rating
agency competition provides a potentially powerful setting to examine reputational concerns
as Becker and Milbourn (2011) show that the dominant credit rating agencies (i.e., Moody’s
and S&P) provide lower quality ratings when competition via Fitch’s coverage of new issuers
in an industry is greater. Such behavior by the incumbent rating agencies is consistent with
trading off reputation against lower future economic rents. Consequently, we posit that if
reputational concerns are the main driver of our primary findings, then heightened compe-
tition among credit rating agencies may reduce incumbent rating agencies’ willingness to
assign less optimistic and more accurate ratings. Conversely, we would not expect a similar
effect if our primary findings were the result of greater information sharing by firms that
eventually default. We find results consistent with the former; thus our primary findings do
not appear to be influenced by greater information pre-default.
Prior research suggests that rating agencies have increased the stringency of their rating
parameters over time, which has affected market-wide recovery rates (Alp, 2013). We control
for the influence that increased stringency can have on our findings by estimating year-
specific credit rating models throughout our analyses. In addition, Donovan et al. (2015)
suggests accounting conservatism impacts creditor recovery rates. In supplemental analysis,
we control for accounting conservatism and find that our inferences related to recovery rates
are unchanged.
Our setting allows us to extend various streams of prior research. For instance, because
5

default events are relatively rare, firms approaching default are likely monitored by various
market participants such as investors, competitors, regulators, media, among others. This
suggests that the reputational penalties for failing to provide accurate and reliable credit
ratings for firms approaching default could be particularly severe. However, prior research
highlights multiple instances where credit rating agencies use credit rating adjustments op-
portunistically and thus fail to accurately assess issuers’ overall credit risk. These instances
include ratings for collateralized debt obligations (Griffin and Tang, 2012), when loan con-
tracts contain performance-pricing provisions (Kraft, 2015a), among others. We extend prior
research by documenting that catering incentives under the issuer-pay compensation model
can be mitigated when the tension between rating users and issuers for accurate versus in-
flated ratings, respectively, is arguably the greatest (i.e.,when firms approach default); thus,
we highlight when rating adjustments are used defensively by rating agencies.
Our study also has implications for the scant literature that addresses rating agency
monitoring, as well as the literature that examines the role of heightened competition on
the actions of rating agencies. For instance, Bonsall et al. (2015b) suggest that credit rating
agencies engage in lax borrower monitoring post-issuance as the attention of various par-
ticipants engaged before and during a bond’s offering (i.e., underwriters, regulators, legal
representatives) subsides over time. Our findings extend this line of research by highlighting
that heightened competition can result in less effective rating agency monitoring even during
periods when heightened market participant awareness is likely significant.
In the same vein, prior research suggests that heightened competition can cause credit
rating agencies to reduce the quality of their ratings across various asset classes (Becker and
Milbourn, 2011; Bolton et al., 2012; Bonsall et al., 2016a; Griffin et al., 2013).4 Conversely,
Xia (2014) suggests that initiation of rating coverage by Egan Jones Ratings Company results
in improved rating quality by S&P. Because default prediction is one of the most important
4In addition, while certain studies examine the impact of Fitch’s market share on incumbent ratingagencies’ ratings quality (Becker and Milbourn, 2011; Bonsall et al., 2016a), Kraft (2015a) examines thepresence of Fitch rather than the market share of Fitch.
6

qualities of issuers’ assigned credit ratings, our results extend prior research by highlighting
that heightened competition causes credit rating agencies to allow their reputations to wane
even in instances where inaccurate credit risk assessments may harm them the most. In
addition, while prior research offers mixed evidence as to whether documented rating agency
stringency over time impacts creditor recovery rates (Alp, 2013; Baghai et al., 2014), our
study suggests that heightened rating agency competition reduces the impact that increased
rating agency stringency can have on creditor recovery rates. In this regard, our findings
suggest that market participants should use caution when employing creditor recovery rates
in their analysis.
Finally, we contribute to the empirical literature examining the determinants of creditor
recovery rates. Several studies suggest that industry affiliation and the economic health
of an industry (Acharya et al., 2007; Altman and Kishore, 1996; Hanson and Schuermann,
2004; Shleifer and Vishny, 1992), default event type (Altman and Karlin, 2009), propensity
for conservative accounting (Donovan et al., 2015), and a broad set of bond, firm, macroe-
conomic and liquidity characteristics (Jankowitsch et al., 2014) are important determinants
of recovery rates. Our findings extend prior literature by providing evidence that subjective
adjustments to model-based ratings are informative about recovery rates in default, and thus
furthers our understanding of the importance of soft information during the rating process.
2 Background and research hypotheses
The reliance of the major rating agencies on issuer fees, rather than investor fees, has led
to concerns that reported ratings are influenced by the interests of issuers. In particular,
the issuer-pay model is often attributed to providing incentives for inflated ratings and
delayed incorporation of unfavorable information into ratings about issuers’ creditworthiness
(e.g., White, 2010). Prior accounting and finance studies provide evidence consistent with
such concerns. For instance, Jiang et al. (2012) shows that S&P assigned more favorable
7

ratings after adopting issuer-pay, particularly for issuers that offered expected fees and were
rated higher by Moody’s, whom had previously adopted the issuer-pay model. Xia (2014)
finds that the quality of S&P’s ratings for an issuer improves when the Egan-Jones Rating
Company, an investor-pay rating agency, initiates coverage. Cornaggia and Cornaggia (2013)
provides evidence that Moody’s ratings are more stable and have lower false positives and
negatives but lack timeliness relative to RapidRatings, another investor-pay rating agency.
These tendencies by S&P and Moody’s to have lower quality corporate ratings relative to
investor-paid rating agencies are consistent with conflicts created by the issuer-pay model.
Additional evidence of issuer-pay conflicts is provided by Baghai and Becker (2016) who
suggest a positive relation exists between non-rating fee revenue and assigned credit ratings,
and by Efing and Hau (2015) who document that ratings are inflated for issuers that provide
rating agencies with more securitization business. Lastly, Griffin and Tang (2012) suggest
that rating agencies made unjustified adjustments to their rating models to assign more
favorable credit ratings to collateralized debt obligations.
The major rating agencies indicate that the reputational harm that can arise from un-
timely or inaccurate ratings is sufficient to mitigate concerns over possible conflicts under
the issuer-pay model (Moody’s Investors Service, 2015; Standard & Poor’s, 2015). The agen-
cies also claim that their role as Nationally Recognized Statistical Ratings Organizations,
or NRSROs, leads them to favor stable ratings over timely and accurate ratings, as rating
reversals are costly to investors and other users of ratings. Prior research provides evidence
that supports these claims. Bolton et al. (2012) demonstrates how the quality of ratings
should vary with costs arising from reputational harm—e.g., ratings inflation should be less
common when detection is more likely and lost profits arising from detection are higher. In
addition, Bar-Isaac and Shapiro (2013) show that reputational harm concerns are more (less)
likely to discipline the actions of credit rating agencies during economic busts (booms), as
fee income is low (high) and expected defaults are high (low).
Because of the magnitude of losses that can occur from issuer default, bond issuers pay
8

close attention to ratings both before and after default. This is done in an effort to assess the
likelihood of default and expected losses ex ante, and to assess the accuracy of ratings issued
by the major rating agencies ex post, respectively. For example, the annual default rate from
1983–2015 averaged 1.6 percent. In addition, average recovery rates ranged from 80.4 percent
for loans to only 28.2 percent for subordinated bonds (Moody’s Investors Service, 2016b).
These amounts, however, can vary considerably over the business cycle, with defaults being
more common and default recoveries being lower during periods of economic decline.
Given the importance of issuer defaults to investors, the major rating agencies proactively
promote the accuracy of their ratings prior to default. Moody’s publishes statistics annu-
ally regarding the discriminatory power of its ratings (Moody’s Investors Service, 2016b).
Commonly cited metrics by Moody’s include the average letter ratings prior to default and
the average default position (e.g., the percentage of issuers with higher or equal ratings as
defaulting issuers). Likewise, Standard & Poor’s reports annually the number of defaults
separately by investment-grade and speculative-grade ratings, with the ratings being those
in place as of January 1 in the year of default (Vazza and Kraemer, 2016). Based on Moody’s
statistics (Moody’s Investors Service, 2016b), the average discriminatory power of ratings for
default is relatively short-term (e.g., the last year or two) with limited, albeit some, warning
over the long-term (e.g., over five years prior to default).
At issuance, it is difficult for investors to assess the quality of firms’ assigned credit
ratings with respect to ultimate default prediction as the risk of default over the long-
term at this point in time is low. However, as both the risk of default grows and the risk
of investors learning of inflated ratings looms larger over time, credit rating agencies may
adjust their ratings accordingly. This is particularly relevant when one considers that credit
rating agencies may become concerned over potential reduced demand for their ratings if
users believe firms’ assigned credit ratings are inaccurate. If credit rating agencies respond
to these concerns, they may increasingly rely on their knowledge of issuers’ creditworthiness
by going beyond information conveyed by standard financial ratios. As discussed extensively
9

in Kraft (2015b), the credit rating agencies commonly make hard and soft adjustments to
arrive at their actual ratings. Hard adjustments are typically quantitative-based adjustments
to reported GAAP numbers (e.g., for off-balance-sheet debt) used to calculate standard
financial ratios. Conversely, soft adjustments account for certain qualitative aspects of firms
such as the strength of the issuer management, governance, controls, and other internal and
external factors that could affect the creditworthiness of the issuer.
Rating adjustments can be used opportunistically to inflate ratings (e.g., Kraft, 2015a)
or to convey new information to financial markets (e.g., Jorion et al., 2005). We consider the
difference between the actual rating and the predicted rating from a standard rating model
to be comprised of both hard and soft adjustments. Given the increased reputational costs
from overrating an issuer prior to default and the increased ability for investors to ex post
assess the bias of credit ratings, we predict that rating agencies will go beyond standard
rating models to issue ratings that are more pessimistic prior to default. Formally, we state
this prediction as our first research hypothesis (in alternative form):
Hypothesis 1 (H1): Credit rating agencies make rating adjustmentsto reduce rating optimism prior to issuer default.
The credit rating agencies are judged not only on the bias in their ratings but also on their
accuracy. In the context of issuer default, investors will judge whether certain rating agencies’
assigned credit ratings provide information to predict loan recovery rates. With rating
adjustments, more accurate ratings are those that allow market participants to discriminate
across issuers regarding the magnitude of actual default amounts. Given the large differences
in creditor recovery rates, this information should be of primary importance to investors.
Similar to potential forgone future fees for rating agencies with inflated ratings prior to
default, we expect that reputation costs will be higher for rating agencies with less accurate
ratings of default recoveries. This prediction leads to our second research hypothesis:
Hypothesis 2 (H2): Credit rating agencies’ adjustments predict is-suer default recovery rates.
10

Critics of the major rating agencies suggest that credit ratings agencies are influenced by
incentives inherent to the issuer-pay compensation model to provide issuers with more favor-
able credit ratings (Partnoy, 1999, 2006). Prior research supports this contention and shows
that rating agencies offer favorable credit ratings to issuers in various instances (Baghai and
Becker, 2016; Becker and Milbourn, 2011; Griffin and Tang, 2012; Kraft, 2015a). Defaulting
issuers in our sample may face the greatest pressure to maintain favorable credit ratings from
rating agencies. This could limit our ability to find results consistent with our hypotheses.
3 Sample and descriptives
3.1 Sample
To calculate our measure of credit rating adjustments, we require firm-year data from Com-
pustat to calculate the financial variables included in our rating model. We gather Compustat
data from 1990–2015 and merge the data with credit rating data from Moody’s Default and
Recovery Database (DRD) available by subscription from Moody’s Analytics. Across this
time period, we obtain 21,357 observations representing 2,616 unique firms.
We obtain data on default events from the DRD, derived from Moody’s own proprietary
database of issuer, default, and recovery information. We use the default data, which provides
the dates of default, the price at default (i.e., creditor recovery rates), and several charac-
teristics of the defaulted debt instruments, such as default type, default event description,
default history, debt seniority, debt type, and coupon rate. To identify firms in default, we
start with the master default table (MAST DFLT) consisting of 7,168 default events associ-
ated with 22,747 individual issues outstanding at the time of default (DFLT ISSU) for global
sovereign and corporate entities across all industries.5 We limit our analyses to default events
for U.S. publicly traded industrial firms and default types identified as distressed exchanges,
5The statistics are based on a data pull from DRD on August 8, 2015; The database is updated monthly.
11
Chapter 11 (re-organization) bankruptcy, and missed payments on interest or principal.
We match the default data with accounting data in the Compustat annual files using 6-
digit CUSIP. To ensure reliable matches, we manually check all matches. In addition, default
events not having a match based on CUSIP are matched by hand through a combination
of manual review of firm names and year in Compustat point-in-time files as well as Capi-
talIQ firm identifier lookup. This process yields our base sample matched to a GVKEY in
Compustat, before eliminating firm-years with missing values for controls, with 1,010 (1,156)
default events associated with 2,976 (4,937) individual issues for 873 (949) firms during the
period covering 1992 to 2015, representing individual issues with (without) default prices in
the DRD.6
The final step in our sample selection process is to match the default data with predicted
rating and rating optimism data generated from the estimation of our rating model based
on the non-market inputs used in Baghai et al. (2014). We gather all inputs to the rating
model from Compustat and estimate the rating model cross-sectionally by year. Matching
the predicted ratings and rating optimism data, along with control variables, reduces our
baseline recovery rate sample to 1,126 observations.
3.2 Descriptives
Panel A of Table 1 presents descriptive statistics for the 26,758 firm-year observations used
to estimate our rating model. The average credit rating in this sample is 11.4, placing
the average firm at the top end of the speculative range (Ba1). Firms in this sample can,
on average, cover their interest expense over ten times with earnings before interest, taxes,
depreciation, and amortization (EBITDA). EBITDA averages over 18 percent of revenues for
sample firms. Debt represents, on average, roughly 40 percent of total assets. The average
firm has total assets of $3.9 billion. Total debt is, on average, 3.7 times firms’ EBITDA
with more than three percent of firms having negative EBITDA. The standard deviation of
6Default dates for issues without default prices can still be used in the analyses to examine changes inratings as default approaches.
12

operating income over the most recent five years averages over twelve percent of revenues.
Cash and short-term marketable securities average seven percent of total assets. Convertible
debt represents slightly over one percent of total assets. Rent expense averages between one
and two percent of total assets. Firms’ net property, plant, and equipment is, on average,
38 percent of total assets. Firms’ capital expenditures average nearly six percent of total
assets.
Panel B of Table 1 presents descriptive statistics for the defaulted instruments and firm
characteristics of the firms in our default sample during the period covering 1992–2015.
The mean (median) creditor recovery rate (i.e., default price) in the sample is 41.04 (34.75)
percent. The first quartile creditor recovery rate is 21.25 percent and the third quartile is
61.88 percent. These statistics indicate that creditor losses are very significant at borrower
default, with losses of nearly 80 percent of the value of the outstanding debt claims at
the 25th percentile. Turning to the ratings measures, the mean rating optimism in the
sample is -2.51 and the mean expected ratings is 8.47. The mean optimism of -2.51 indicates
that rating adjustments in the year prior to default are generally pessimistic relative to the
quantitatively modeled rating during our sample period.7 Senior secured debt instruments
account for 7.3 percent and subordinated debt accounts for 6.6 percent of all debt instruments
in the sample. Nearly half of the defaults events (49.3 percent) are Chapter 11 bankruptcy
filings, 21.0 percent are a result of distressed exchanges, and the remainder are missed
payments on interest or principal or both. Firms in the sample are fairly large with an
average market capitalization in excess of $2.6 billion and mean total assets in excess of $3.2
billion in the year prior to default. The average ratio of long-term debt to total debt is 82.2
percent, suggesting that defaulting firms have relatively high long-term indebtedness, which
is usually an indicator of stability.
Table 2 presents correlations for the variables in the sample. Rating optimism is pos-
itively correlated with default price, providing some initial evidence that rating optimism
7This mean optimism relates to the reduced sample used in the default recovery analysis and differs fromthe mean optimism of -1.002 in the average rating optimism prior to default analysis.
13

is informative of creditor recovery rates. Consistent with existing evidence, senior secured
debt is positively correlated with default price (0.23). Similarly, distressed exchanges are
positively correlated (0.33) whereas Chapter 11 bankruptcy is negatively correlated (-0.26)
with default price. This evidence supports the notion that debt seniority and default event
type are important determinants of creditor recovery rates; we control for these and other
factors in the regression based analyses of creditor recovery rates.
4 Empirical results
4.1 Rating adjustments pre-default
To examine our first hypothesis we first estimate issuers’ predicted credit ratings and the
level of optimism rating agencies apply during the rating process. Our measure of the
optimism in Moody’s reported ratings is Optimism = Rating− ̂Rating, where ̂Rating is the
predicted rating (i.e., PredictedRating). Optimism takes on positive values when actual
ratings are higher than predicted ratings and negative values when actual ratings are lower
than predicted ratings. We estimate predicted credit ratings using the non-market-based
variables from Baghai et al. (2014). The determinants of ratings include interest coverage,
profitability, book leverage, firm size, debt-to-profitability, negative debt-to-profitability;
volatility of profitability, liquidity, convertible debt, off-balance sheet borrowing through
operating leases, tangibility of assets, and capital expenditure. These factors lead to the
following ordered probit model:
Ratingit = α0 + α1IntCovit + α2Profitit + α3Book Levit + α4Sizeit + α5Debt/EBITDAit
+ α6Neg.Debt/EBITDAit + α7V olit + α8Cash/Assetsit + α9ConvDe/Assetsit
+ α10Rent/Assetsit + α11PPE/Assetsit + α12CAPEX/Assetsit
+∑j
δjIndustryj + uit (1)
14

where Rating is coded from 1 (C) to 21 (Aaa);8 IntCov is earnings before interest, taxes,
depreciation, and amortization divided by interest expense; Profit is earnings before inter-
est, taxes, depreciation, and amortization divided by sales; Book Lev is the sum of long-
and short-term debt divided by total assets; Size is the natural logarithm of total assets;
Debt/EBITDA is the sum of long- and short-term debt divided by earnings before inter-
est, taxes, depreciation, and amortization, and is set equal to zero if Debt/EBITDA < 0;
Neg.Debt/EBITDA is an indicator variable equal to one if Debt/EBITDA < 0, and zero
otherwise; V ol is the standard deviation of Profit over the prior five fiscal years with a
minimum of two years to be included in the sample; Cash/Assets is cash and short-term
investments divided by total assets; ConvDe/Assets is convertible debt divided by total
assets; Rent/Assets is rent expense divided by total assets; PPE/Assets is net property,
plant, and equipment divided by total assets; and CAPEX/Assets is capital expenditures
divided by total assets. For purposes of our rating stringency analysis, we estimate equation
(1) cross-sectionally by year to allow credit rating standards to vary through time. We also
include industry fixed effects.
Table 3 presents the pooled regression estimates for equation (1). In this pooled esti-
mation, we use robust standard errors clustered by firm. Firms that have higher interest
coverage, lower book leverage, are larger, have lower debt relative to profitability, are prof-
itable, have less cash, less convertible debt, lower rent payments, more tangible assets, and
engage in more capital spending receive more favorable credit ratings, on average. This is as
expected as firms that are larger, more profitable, have more tangible assets, and less debt
are typically considered more creditworthy.
4.1.1 Within-firm tests
Credit rating agencies state that their reputations are their most valuable asset (Covitz
and Harrison, 2003). While prior research suggests that incentives related to the issuer-pay
8The coding is the opposite of Jankowitsch et al. (2014); hence the opposite prediction for ratings (i.e.,positive rather than negative).
15

model or regulatory reliance on ratings may reduce the strength of reputational concerns in
regulating rating agencies’ behavior, failing to detect default is likely to impose the most
reputational harm on the rating agencies. In light of this, our first hypothesis predicts that
catering related rating optimism should decline as default nears. To test this prediction, we
estimate the following OLS model:
Optimismit = φ1Defaultt−3mo + φ2Defaultt−6mo + φ3Defaultt−9mo
+ φ4Defaultt−12mo + φ5Defaultt−15mo + φ6Defaultt−18mo
+ φ7Defaultt−21mo + φ8Defaultt−24mo + ςit (2)
The intercept is omitted in equation (2) to allow the inclusion of indicator variables, Default,
for the eight three-month time periods prior to default. We use robust standard errors
clustered by firm in the estimation of equation (2). H1 advances that rating optimism will
decline as default approaches. We test this over the one and two years prior to default—i.e.,
φ1—φ4<0 and φ1—φ8<0, respectively.
Panel A of Table 4 presents the results from the estimation of equation (2). We find
that the average value for Optimism 24 months prior to default is -0.83 notches, providing
evidence that the adjustments by Moody’s are not optimistic but rather are pessimistic
relative to the predicted rating provided by the estimation of equation (1). In addition,
while rating optimism declines as the default date approaches as predicted by H1, we note
that the largest magnitude changes in rating optimism occur in the one-year period prior to
default. In fact, while the amount of rating pessimism increases by roughly 102 percent, or
approximately 0.84 rating notches, from month t− 24 through t− 3, roughly 77 percent of
this increase occurs in the one-year period leading up to default. As shown at the bottom of
Table 4, these differences are statistically significant. Collectively, the evidence in Panel A of
Table 4 suggests that in the two years prior to default, reputational concerns lead Moody’s
to reduce (increase) its rating optimism (pessimism) for future defaulting debt obligations,
and that they do so early enough to signal to rating users that certain firms are approaching
16

default.
4.1.2 Across-firm tests
To investigate whether the results presented in Panel A of Table 4 for equation (2) are
indicative of a response to increasing reputational concerns in advance of default events or
are merely symptomatic of industry or time trends, we create a control group of comparison
firms that are in the same two-digit North American Industry Classification System (NAICS)
industry and that have outstanding debt two years prior to the sample firm’s default event
but do not default within the following five years after the sample firm’s default event date.
This matching controls for industry and time-period differences in rating levels. We modify
equation (2) to separate coefficients for Default for default and non-default firms. We then
take the difference between the coefficients for Default for the two subgroups. The equation
is estimated by omitting the intercept.
Panel B of Table 4 presents the results from estimating the modified version of equation
(2). Because the sample is the same for the default firms the coefficient estimates in column
(1) of Panel B mirror those in Panel A. For the matched non-default firms, we find in column
(2) that their rating adjustments are also pessimistic at months t− 24 through t− 3. This
suggests that either the years or industries of our sample firms lead to rating adjustments
that are pessimistic. We find, however, that the pessimism in the rating adjustments is
relatively unchanged over time. For instance, as displayed at the bottom of column (2),
the changes in rating adjustments from month t− 12 through t− 3 and from month t− 24
through t−3 are insignificant, respectively. In contrast, the changes in the differenced rating
adjustments in column (3) grow increasing pessimistic leading up to default. Tests of the
differences, shown at the bottom of the column, are statistically significant. These findings
corroborate the evidence presented in Panel A that Moody’s rating adjustments appear to
respond to reputational concerns as defaults approach.
17

4.2 Rating adjustments and default recoveries
Over time credit rating agencies have faced scrutiny for failing to provide accurate assess-
ments of credit risk. While prior research typically examines whether assigned credit ratings
adequately reflect default risk at a point in time, rating users are also concerned with whether
assigned ratings adequately reflect amounts to be recovered upon default. We examine recov-
ery rates for specific default events as identified by the Moody’s DRD: Chapter 11 liquidation
and restructuring, distressed exchanges, and payment defaults.9 For each event, we examine
whether optimistic ratings, judged by the difference between the actual and expected rating
six months prior to the default event, leads to greater creditor recovery. Similar to Jankow-
itsch et al. (2014), we examine the recovery rate for the default events using the following
OLS regression model:
DefaultPriceit = δ0 + δ1PredictedRating + δ2Optimismit +∑
λjControlj,it + εit (3)
whereDefaultPrice is defined as the default price, measured as the trading price of defaulted
debt, expressed as a percentage of par, as of the default date for distressed exchanges,
or 30 days after default for all other types of default. We expect that lower predicted
credit ratings estimated prior to default events (i.e., indicative of worse issuer credit quality)
are associated with lower recovery rates. Therefore, we expect that δ1 > 0. If rating
adjustments provide information about loss recovery prior to default, then we predict δ2 > 0.
However, if rating adjustments provide less of a warning about recovery amounts relative to
predicted ratings, then we predict δ2 < δ1. We use robust standard errors in the estimation
of equation (3). Control variables include the initial annual payment for a bond expressed
as a percentage of the face amount (Coupon), an indicator variable equal to one if the debt
instrument is senior and secured, and zero otherwise (SeniorSecured), an indicator variable
equal to one if the debt instrument is subordinated, and zero otherwise (Subordinated), an
9Because the types of default events are all-inclusive, we exclude an indicator variable for missed paymentsin our regressions.
18

indicator variable equal to one if the default type is distressed exchange, and zero otherwise
(DistressedExchange), an indicator variable equal to one if the default type is Chapter
11 bankruptcy, and zero otherwise (Chapter11), the market value of equity divided by
total assets (Equity), an assessment of distance to default, measured as short-term debt
plus one half long-term debt scaled by total assets (DefaultBarrier), the ratio of long-
term debt to total debt (LTDIssuance), earnings before interest, taxes, depreciation, and
amortization scaled by lagged total assets (Profitability), intangible assets divided by total
assets (Intangibility), total receivables divided by total assets (Receivables), the natural
logarithm of total assets (Log(TotalAssets)), and the natural logarithm of the number of
firm employees (Log(Employees)).
Table 5 presents the results from estimating equation (3). Column (1) uses credit rating
information at year t − 1 relative to default and column (2) uses credit rating information
at year t − 2. In both columns, the coefficients on PredictedRating (δ̂1) are positive and
statistically significant at the 0.01 level (t = 3.57 and t = 3.61, respectively), consistent with
more favorable predicted credit ratings leading to higher lender recoveries in bankruptcy. We
also find that the coefficients on Optimism (δ̂2) are positive and statistically significant at the
0.01 level (t = 3.51 and t = 3.15, respectively), consistent with rating adjustments providing
incremental information about future recoveries from defaulted issuers. In terms of whether
Optimism is less effective at predicting recoveries relative to PredictedRating, we report an
F -test of δ1 = δ2 at the bottom of Table 5. The null hypothesis is not rejected at the 0.05
level (two-sided) in both columns, suggesting that rating adjustments do not provide less
information about default recoveries than predicted credit rating based on quantitive data
for adjustments existing one and two years prior to default. This is somewhat surprising
as rating adjustments are often viewed as the vehicle for rating agencies to build bias into
their final ratings, which could diminish the ability of such adjustments to predict recovery
given default. Overall, the results in Table 5 provide evidence consistent with H2 that rating
agencies’ adjustments predict default recoveries by creditors.
19
4.3 The effect of rating competition from Fitch
While our primary findings suggest that reputational concerns from failing to provide ac-
curate ratings results in reduced rating optimism and greater recovery rate estimation, the
possibility exists that default issuers provide rating agencies with greater information during
the rating process. Specifically, firms that eventually default could either voluntarily or at
the request of credit rating agencies provide credit rating agencies with more information
during the rating process. This could result in more accurate credit risk assessments for
these firms.
Issuers may engage in greater information sharing with credit rating agencies for multiple
reasons. First, if issuers believe that default is imminent, they will likely hire legal advisors
and investment bankers, among others, to help prepare the firm for the eventual default
and restructuring actions. Given this, much information is available to be shared with credit
rating agencies ex ante. Second, failing to provide more granular information to credit rating
agencies may result in “surprise” default events, which could result in panic pricing and
selling among market participants. Thus, providing rating agencies with greater information
pre-default can result in more efficient and lucrative creditor recoveries. Third, providing
rating agencies with greater information to more accurately assess default risk cannot only
help determine the specific timing of default but also allow market participants to more
accurately assess the remaining entity’s characteristics and competitiveness upon exiting the
bankruptcy process. Greater transparency pre-default may also have reputational benefits
for managers both during and after bankruptcy proceedings. Finally, while credit rating
agencies meet routinely with issuers to assess firms’ overall credit risk (Bonsall et al., 2016b),
conversations with credit rating agency personnel at both Moody’s and S&P suggest that
credit rating agencies meet with certain issuers more frequently if default risk is perceived to
be increasing over time. More frequent interaction could lead to greater information sharing
with credit rating agency analysts.
Industry competition for ratings by Fitch can help distinguish between reputational con-
20

cerns by Moody’s and greater information sharing by issuers prior to default. Reputational
harm arising from the discovery of inaccurate ratings prior to default is expected to be
higher when the duopoly profits enjoyed by Moody’s and S&P are less threatened. Specifi-
cally, Becker and Milbourn (2011) provide empirical evidence that Moody’s and S&P assign
more favorable credit ratings when Fitch rates a higher proportion of new issuances in an
industry and that their ratings exhibit a lower ability to accurately predict default.10 Other
studies (Bonsall et al., 2016a; Dimitrov et al., 2015; Kedia et al., 2014) document findings
that further support a reputation-based explanation for how competition from Fitch can lead
to lower quality credit ratings. Such behavior by incumbent rating agencies is consistent with
trading off reputation against lower future economic rents. Given this, the advent of greater
rating agency competition provides us with a potentially powerful setting to distinguish be-
tween a reputation-based explanation and an information sharing explanation for the results
in Tables 4 and 5. For defaulting issuers, we predict that greater rating competition from
Fitch will cause Moody’s and S&P to be less diligent in reducing the optimism in rating ad-
justments prior to default. In addition, we predict that credit rating adjustments will be less
predictive of default recoveries. Alternatively, if firms were providing credit rating agencies
with greater information during the rating process pre-default, then credit rating agencies
could continue to be motivated to accurately assess issuers’ default risk despite increased
rating agency competition.11
We explore the influence of rating competition on our findings in two ways. First, we
estimate a modified version of equation (2) that interacts each Default indicator variable
with FitchMktSh, defined as the proportion of new bond ratings issued by Fitch in year t for
firm i ’s two-digit NAICS industry.12 If reputational risk concerns are important determinants
10Bae et al. (2015) fails to find evidence that differences in Fitch’s market share lead to higher ratinglevels once (unobservable) industry characteristics are considered, particularly differences across regulatedand unregulated industries. Our tests control for this concern.
11Credit rating agencies may also simply choose to ignore issuer-provided information leading up to defaultwhen competition increases.
12Main effects for FitchMktSh are not included as the interaction of Default with FitchMktSh capturesthe four quarters for each year prior to default.
21

of our primary findings, we expect that the coefficient on the interactions of Default and
FitchMktSh will be positive, consistent with greater rating optimism prior to default when
competition from Fitch is higher. Second, we estimate an augmented version of equation
(3) which adds FitchMktSh and an interaction between Optimism and FitchMktSh. If
reputational risk concerns are important determinants of our primary findings, we expect
the coefficient on the interaction of Optimism and FitchMktSh will be negative, suggesting
that rating optimism has less predictive ability for recovery rates when competition from
Fitch is higher.
Panel A of Table 6 reports the effect of industry competition from Fitch on rating ad-
justments prior to default. We re-center FitchMktSh at its sample mean value to ease
interpretation of the Default coefficients. The coefficients on Default are significantly neg-
ative. In addition, the coefficient estimates grow increasingly negative leading up to default.
F -tests of the differences between the coefficients on Defaultt−3mo and Defaultt−12mo and
the coefficients on Defaultt−3mo and Defaultt−24mo reject the null hypothesis of no differ-
ence at the 0.01 level (two-sided). Also, the coefficients on the interactions between Default
and FitchMktSh are significantly positive. This evidence indicates that rating adjustments
are relatively more optimistic when there is greater rating competition from Fitch.
Panel B of Table 6 reports the effect of Fitch competition on the predictive ability of
rating adjustments for default recovery rates. For convenience, we re-center Optimism at
its sample mean value. Consistent with the evidence provided in Table 5, the coefficients on
PredictedRating and Optimism are both positive and statistically significant at the 0.01
level. These findings suggest that more favorable expected credit ratings and greater rating
adjustments, respectively, are positively associated with greater creditor recovery rates upon
default. The estimated coefficient on the interaction Optimism × FitchMktSh is negative
and statistically significant at the 0.01 level (t = −3.90). Thus, the same level of optimism in
rating adjustments is less predictive of future default recoveries for firms in industries with a
more competitive ratings environment. Specifically, for a firm in an industry at the median
22

level of Fitch market share, the coefficient is nearly 86 percent smaller than for a firm in an
industry with no presence from Fitch. Overall, it appears that reputational concerns have an
economically significant impact on how optimistic rating adjustments are prior to default, as
well as how informative rating agencies’ adjustments are regarding recoveries given default.
Thus, our primary findings do not appear to be solely driven by greater information sharing
by default firms pre-default.
4.4 Sensitivity to borrower accounting conservatism
Recent evidence by Donovan et al. (2015) demonstrates that recovery rates are higher for
firms with more conservative accounting practices. This evidence suggests that such prac-
tices lead to earlier covenant violations when negative shocks to borrowers’ creditworthiness
occur. In our investigation, more conservative accounting practices should be captured in
predicted credit ratings through reported profitability. More conservative accounting prac-
tices, however, could limit the rating agencies’ ability to use optimistic rating adjustments
prior to default. We control for this possibility by including a conservatism variable in our
default recovery analyses. Following Beatty et al. (2008) and Donovan et al. (2015), we mea-
sure Conservatism as the difference between the skewness of both operating cash flows and
earnings for the three years prior to default. Greater accounting conservatism is expected to
lead to earnings being more negatively skewed relative to operating cash flows. Accordingly,
higher values of Conservatism correspond to more conservative accounting practices. The
skewness measure is chosen over alternative measures because it provides us with the largest
sample size, coupled with the fact that it does not rely on stock returns, which incorporate
information in disclosed credit ratings.
In Table 7 we re-estimate our results from Table 5 and Panel B of Table 6 when Rating
is measured at year t − 1 after controlling for Conservatism. Similar to Donovan et al.
(2015) when they use skewness to measure conservatism, we find that while accounting
conservatism is positively associated with default recoveries in both columns (1) and (2) the
23

coefficient is not statistically significant at conventional significance levels. In addition, we
continue to find that the coefficients on PredictedRating and Optimism are both positive
and statistically significant at the 0.01 level (two-sided) in columns (1) and (2). Finally, we
find that the estimated coefficient on the interaction Optimism × FitchMktSh is negative
and statistically significant at the 0.01 level (two-sided) in column (2). Overall, our earlier
inferences are not altered after taking into account the influence of accounting conservatism
on default recoveries.
5 Conclusion
Credit rating agencies have faced scrutiny following perceived rating failures in the early
2000s (e.g., Enron, Worldcom), and more recently with regard to failures related to asset-
backed securities during the 2008 financial crisis. Critics of the major rating agencies suggest
that conflicts of interest inherent to the issuer-pay compensation model cause leading rating
agencies to assign inflated and untimely credit risk assessments of both issuers and securities.
Conversely, rating agencies assert that their reputations are their most important assets and
that maintaining their reputations prevents them from catering to issuers’ desires for more
favorable credit ratings.
Our study examines whether reputational concerns discipline credit rating agencies into
making more conservative credit rating adjustments for firms that eventually default. Credit
rating adjustments include both hard and soft adjustments. While hard adjustments typ-
ically account for quantitative firm characteristics, soft adjustments encompass qualitative
firm characteristics and are thus more subjective in nature. If rating agencies are concerned
about the reputational risk from failing to provide adequate credit risk assessments of is-
suers, the subjectivity inherent in soft adjustments can allow credit rating agencies to become
more conservative in their credit rating assessments as default approaches. Therefore, we
first examine whether firms that eventually default exhibit reduced (increased) optimism
24

(pessimism) as the default date approaches. We then examine whether optimism is pos-
itively associated with recovery rates upon default. We find results consistent with both
predictions.
The possibility exists that issuers increasingly share private information with rating agen-
cies if they believe default is imminent. For instance, firms typically have restructuring plans
in place pre-default, which they may disclose in an effort to avoid “surprise” default events.
However, prior research suggests that heightened rating agency competition reduces incum-
bent rating agencies’ reputational risk, resulting in lower quality ratings when competition
in a given industry increases. If our primary findings are driven by heightened reputational
risk, rather than greater information sharing, we expect greater rating agency competition to
weaken our findings of reduced optimism prior to default, as well as the association between
rating adjustments and creditor recovery rates. Therefore, we examine whether greater
Fitch market share in a given industry affects Moody’s rating adjustments and ability to
adequately assess creditor recovery risk. We find results consistent with these predictions.
Accordingly, while our primary results suggest that reputational risk disciplines credit rating
agencies when assessing default firms’ credit risk, our results also indicate that reputational
risk is downplayed by incumbent rating agencies when the threat of lost market share, and
thus lower future economic rents from issuers, increases.
Our study offers several contributions. First, while findings in prior research suggest
that rating adjustments are used opportunistically, our findings imply that incentives un-
der the issuer-pay compensation model are diminished when reputational concerns amongst
rating agencies are arguably the greatest—i.e., when firms approach default. Accordingly,
our study sheds light on when rating agencies use their adjustments defensively. Second,
while our results extend prior research by documenting that heightened competition impacts
rating agencies’ monitoring functions even in instances when external monitoring by market
participants is potentially high, they also suggest that rating agencies allow their reputations
to wane even in instances when failing to provide accurate credit risk assessments may hurt
25

them the most. Third, we extend prior literature which examines the determinants of credi-
tor recovery rates by providing evidence that subjective adjustments to model-based ratings
are informative about recovery rates in default. In addition, while prior research provides
mixed evidence as to the impact of increased rating stringency on creditor recovery rates
over time, our findings offer further evidence that increased stringency has a reduced impact
on creditor recovery rates when rating agency competition increases. Given this, market
participants should use caution when using ratings as a barometer for default recoveries in
their analysis.
26

References
Acharya, V. V., Bharath, S. T., Srinivasan, A., 2007. Does industry-wide distress affectdefaulted firms? Evidence from creditor recoveries. Journal of Financial Economics 85 (3),787–821.
Alp, A., 2013. Structural shifts in credit rating standards. The Journal of Finance 68 (6),2435–2470.
Altman, E. I., Karlin, B., 2009. The re-emergence of distressed exchanges in corporate re-structurings. NYU working paper No. FIN-09-012.
Altman, E. I., Kishore, V. M., 1996. Almost everything you wanted to know about recoverieson defaulted bonds. Financial Analysts Journal 52 (6), 57–64.
Ashcraft, A., Goldsmith-Pinkham, P., Hull, P., Vickery, J., 2011. Credit ratings and securityprices in the subprime MBS market. The American Economic Review 101 (3), 115–119.
Bae, K.-H., Kang, J.-K., Wang, J., 2015. Does increased competition affect credit ratings?A reexamination of the effect of Fitch’s market share on credit ratings in the corporatebond market. Journal of Financial and Quantitative Analysis 50 (5), 1011–1035.
Baghai, R., Becker, B., 2016. Non-rating revenue and conflicts of interest. Journal of Finan-cial Economics, forthcoming.
Baghai, R. P., Servaes, H., Tamayo, A., 2014. Have rating agencies become more conserva-tive? Implications for capital structure and debt pricing. The Journal of Finance 69 (5),1961–2005.
Bar-Isaac, H., Shapiro, H., 2013. Rating quality over the business cycle. Journal of FinancialEconomics 108 (1), 62–78.
Beatty, A., Weber, J., Yu, J. J., 2008. Conservatism and debt. Journal of Accounting andEconomics 45 (2), 154–174.
Beaver, W., Shakespeare, C., Soliman, M., 2006. Differential properties in the ratings ofcertified versus non-certified bond-rating agencies. Journal of Accounting and Economics42 (3), 303–334.
Becker, B., Milbourn, T., 2011. How did increased competition affect credit ratings? Journalof Financial Economics 101 (3), 493–514.
Bolton, P., Freixas, X., Shapiro, J., 2012. The credit ratings game. The Journal of Finance67 (1), 85–111.
Bonsall, S., 2014. The impact of issuer-pay on corporate bond rating properties: Evidencefrom Moody’s and S&P’s initial adoptions. Journal of Accounting and Economics 57 (2),89–109.
27

Bonsall, S., Green, J., Muller, K. A., 2016a. Are credit ratings more rigorous for widelycovered firms. Working paper, The Ohio State University and the Pennsylvania StateUniversity.
Bonsall, S., Holzman, E. R., Miller, B. P., 2015a. Managerial ability and credit risk assess-ment. Management Science, forthcoming.
Bonsall, S., Koharki, K., Neamtiu, M., 2015b. The effectiveness of credit rating agencymonitoring: Evidence from asset securitizations. The Accounting Review 90 (5), 1779 –1810.
Bonsall, S., Koharki, K., Neamtiu, M., 2016b. When do differences in credit rating method-ologies matter? Evidence from high information uncertainty borrowers. The AccountingReview, forthcoming.
Bradley, D., Gokkaya, S., Liu, X., 2016. Before an analyst becomes an analyst: Does industryexperience matter? The Journal of Finance 53 (1), 1 – 47.
Brown, L., Call, A., Clement, M., Sharp, N., 2015. Inside the ”black box” of sell-side financialanalysis. Journal of Accounting Research 53 (1), 1 – 47.
Cheng, M., Neamtiu, M., 2009. An empirical analysis of changes in credit rating properties:Timeliness, accuracy and volatility. Journal of Accounting and Economics 47 (1), 108–130.
Cheng, Q., Du, F., Wang, X., Wang, Y., 2016. Seeing is believing: Analysts’ corporate sitevisits. Working paper, Singapore Management University.
Cornaggia, J., Cornaggia, K., 2013. Estimating the costs of issuer-paid credit ratings. Reviewof Financial Studies 26 (9), 2229–2259.
Covitz, D., Harrison, P., 2003. Testing conflicts of interest at bond rating agencies withmarket anticipation: Evidence that reputation incentives dominate. Federal Reserve Bankworking paper.
deHaan, E., 2016. The financial crisis and corporate credit ratings. The Accounting Review,forthcoming.
Dimitrov, V., Palia, D., Tang, L., 2015. Impact of the Dodd-Frank Act on credit ratings.Journal of Financial Economics 115 (3), 505–520.
Donovan, J., Frankel, R. M., Martin, X., 2015. Accounting conservatism and creditor recov-ery rate. The Accounting Review 90 (6), 2267–2303.
Efing, M., Hau, H., 2015. Structured debt ratings: Evidence on conflicts of interest. Journalof Financial Economics 116 (1), 46–60.
Fama, E., French, K., 1997. Industry costs of equity. Journal of Financial Economics 43 (2),153 – 193.
28

Griffin, J., Nickerson, J., Tang, D., 2013. Rating shopping or catering? An examination ofthe response to competitive pressure for CDO credit ratings. Review of Financial Studies26 (9), 2270–2310.
Griffin, J. M., Tang, D. Y., 2012. Did subjectivity play a role in CDO credit ratings? TheJournal of Finance 67 (4), 1293–1328.
Griffin, P. A., Sanvicente, A. Z., 1982. Common stock returns and rating changes: A method-ological comparison. The Journal of Finance 37 (1), 103–119.
Hanson, S. G., Schuermann, T., 2004. Estimating probabilities of default. Federal ReserveBank of New York Staff Report (190).
Jankowitsch, R., Nagler, F., Subrahmanyam, M., 2014. The determinants of recovery ratesin the us corporate bond market. Journal of Financial Economics 114 (1), 155–177.
Jiang, J. X., Harris Stanford, M., Xie, Y., 2012. Does it matter who pays for bond ratings?Historical evidence. Journal of Financial Economics 105 (3), 607–621.
Jorion, P., Liu, Z., Shi, C., 2005. Informational effects of Regulation FD: Evidence fromrating agencies. Journal of Financial Economics 76 (2), 309–330.
Kedia, S., Rajgopal, S., Zhou, X., 2014. Did going public impair Moody’s credit ratings.Journal of Financial Economics 114 (2), 293–325.
Kliger, D., Sarig, O., 2000. The information value of bond ratings. The Journal of Finance55 (6), 2879–2902.
Kraft, P., 2015a. Do rating agencies cater? Evidence from rating-based contracts. Journalof Accounting and Economics 59 (2–3), 264–283.
Kraft, P., 2015b. Rating agency adjustments to GAAP financial statements and their effecton ratings and credit spreads. The Accounting Review 90 (2), 641 – 674.
Moody’s Investors Service, 2015. Form NRSRO.URL http://www.moodys.com/
Moody’s Investors Service, 2016a. About Moody’s ratings: Ratings policy and approach.https://www.moodys.com/Pages/amr002003.
Moody’s Investors Service, 2016b. Annual default study: Corporate default and recoveryrates, 1920-2015 New York, NY.
Partnoy, F., 1999. The Siskel and Ebert of financial markets: Two thumbs down for thecredit rating agencies. Washington University Law Quarterly 77 (3), 619–712.
Partnoy, F., 2006. How and why credit rating agencies are not like other gatekeepers. Workingpaper, San Diego University School of Law. Available at: SSRN 900257.
29

Partnoy, F., 2010. Overdependence on credit ratings was a primary cause of the crisis.Working paper, San Diego University School of Law.
Securities, Commission, E., 2003. Report on the role and function of credit rating agencies inthe operation of the securities markets. Securities and Exchange Commission, Washington,DC.
Senate, U. S., 2002. Financial oversight of Enron: The SEC and private-sector watchdogs.Committee on Governmental Affairs Staff Report.
Shleifer, A., Vishny, R. W., 1992. Liquidation values and debt capacity: A market equilib-rium approach. The Journal of Finance 47 (4), 1343–1366.
Standard & Poor’s, 2015. Form NRSRO.URL http://www.standardandpoors.com/
Vazza, D., Kraemer, N., 2016. 2015 annual global corporate default study and rating tran-sitions. Standard & Poor’s.
Walker, R., September 10, 2010. Role of credit rating agencies as risk information brokers.Study prepared for the Anthony T. Cluff Fund.
White, L. J., 2010. Markets: The credit rating agencies. The Journal of Economic Perspec-tives 24 (2), 211–226.
Xia, H., 2014. Can investor-paid credit rating agencies improve the information quality ofissuer-paid rating agencies? Journal of Financial Economics 111 (2), 450–468.
30

Appendix – Variable definitions
DefaultPrice = Trading price of defaulted debt, expressed as a percentage of par, as ofthe default date for distressed exchanges, or 30 days after default for all other types ofdefault (DEF PRICE, Moody’s Default and Recovery Database [DRD]).
Default = Indicator variable equal to one if observation pertains to a default firm, and zerootherwise.
Optimism = Rating− ˆRating. The Optimism variable takes on positive values when actualratings are higher than predicted ratings, and negative values when actual ratings arelower than predicted ratings.
PredictedRating = Expected credit ratings ( ̂Ratingit) estimated using the non-market basedvariables from Baghai et al. (2014). The determinants of ratings include interest cov-erage, profitability, book leverage, firm size, debt-to-profitability, negative debt-to-profitability; volatility of profitability, liquidity, convertible debt, off-balance sheet bor-rowing through operating leases, tangibility of assets, and capital expenditure. Thesefactors lead to the following ordered probit model (estimated annually):
Ratingit = α0 + α1IntCovit + α2Profitit + α3Book Levit + α4Sizeit + α5Debt/EBITDAit
+ α6Neg.Debt/EBITDAit + α7V olit + α8Cash/Assetsit + α9ConvDe/Assetsit
+ α10Rent/Assetsit + α11PPE/Assetsit + α12CAPEX/Assetsit
+∑j
δjIndustryj + uit
Rating = Moody’s historical issuer rating mapped to natural numbers such that highernumbers indicate higher rating quality, i.e., C = 1, ..., Aaa = 21 (www.moodys.com).
IntCov = Earnings before interest, taxes, depreciation, and amortization divided by interestexpense (EBITDA / XINT, Compustat).
Profit = Earnings before interest, taxes, depreciation, and amortization divided by sales(EBITDA / REVT, Compustat).
Book Lev = The sum of long- and short-term debt divided by total assets ((DLTT + DLC)/ AT, Compustat).
Size = Natural logarithm of total assets (AT, Compustat).
Debt/EBITDA = The sum of long- and short-term debt divided by earnings before interest,taxes, depreciation, and amortization; set equal to zero if negative ((DLTT + DLC) /EBITDA, Compustat).
31
Neg.Debt/EBITDA = Indicator variable equal to one if Debt/EBITDA < 0, and zerootherwise.
V ol = Standard deviation of Profit over the prior five fiscal years; a minimum of two yearsrequired.
Cash/Assets = Cash and short-term investments divided by total assets (CHE / AT, Com-pustat).
ConvDe/Assets = Convertible debt divided by total assets (DCVT / AT, Compustat).
Rent/Assets = Rent expense divided by total assets (XRENT / AT, Compustat).
PPE/Assets = Net property, plant, and equipment divided by total assets (PPENT / AT,Compustat).
CAPEX/Assets = Capital expenditures divided by total assets (CAPX / AT, Compustat).
Coupon = The initial annual payment for a bond expressed as a percentage of the faceamount (COUP RATE, DRD).
SeniorSecured = An indicator variable equal to one if the debt instrument is senior andsecured, and zero otherwise (DEBT SENR CD, DRD, Moody’s Default and RecoveryDatabase [DRD]).
Subordinated = An indicator variable equal to one if the debt instrument is subordinated,and zero otherwise (DEBT SENR CD , DRD, Moody’s Default and Recovery Database[DRD]).
DistressedExchange = An indicator variable equal to one if the default type is distressedexchange, and zero otherwise (DEF TYP CD, DRD, Moody’s Default and RecoveryDatabase [DRD]).
Chapter11 = An indicator variable equal to one if the default type is Chapter 11 bankruptcy,and zero otherwise (DEF TYP CD, DRD, Moody’s Default and Recovery Database[DRD]).
Equity = Market value of equity, measured as common shares outstanding times closingstock price, divided by total assets ((CSHO * PRCC F) / AT, Compustat).
DefaultBarrier = An assessment of distance to default, measured as short-term debt plusone half long-term debt, scaled by total assets ([DLC + 0.5*DLTT] / AT, Compustat).
LTDIssuance = The ratio of long-term debt to total debt (DLTT / [DLC + DLTT], Com-pustat).
Profitability = The profitability of the firm measured as earnings before interest, taxes,depreciation, and amortization (EBITDA), scaled by lagged total assets (OIBDP /AT , Compustat).
32

Intangibility = Intangible assets divided by total assets (INTAN / AT, Compustat)
Receivables = Total receivables divided by total assets (RECT / AT, Compustat)
Log(TotalAssets) = The natural logarithm of total assets (AT, Compustat).
Log(Employees) = The natural logarithm of the number of employees (EMP, Compustat).
FitchMktSh = The proportion of new bond ratings issued by Fitch in year t for firm i’stwo-digit NAICS industry (Mergent FISD).
Conservatism = The difference between the skewness of both operating cash flows andearnings for the three years prior to default (Compustat).
33
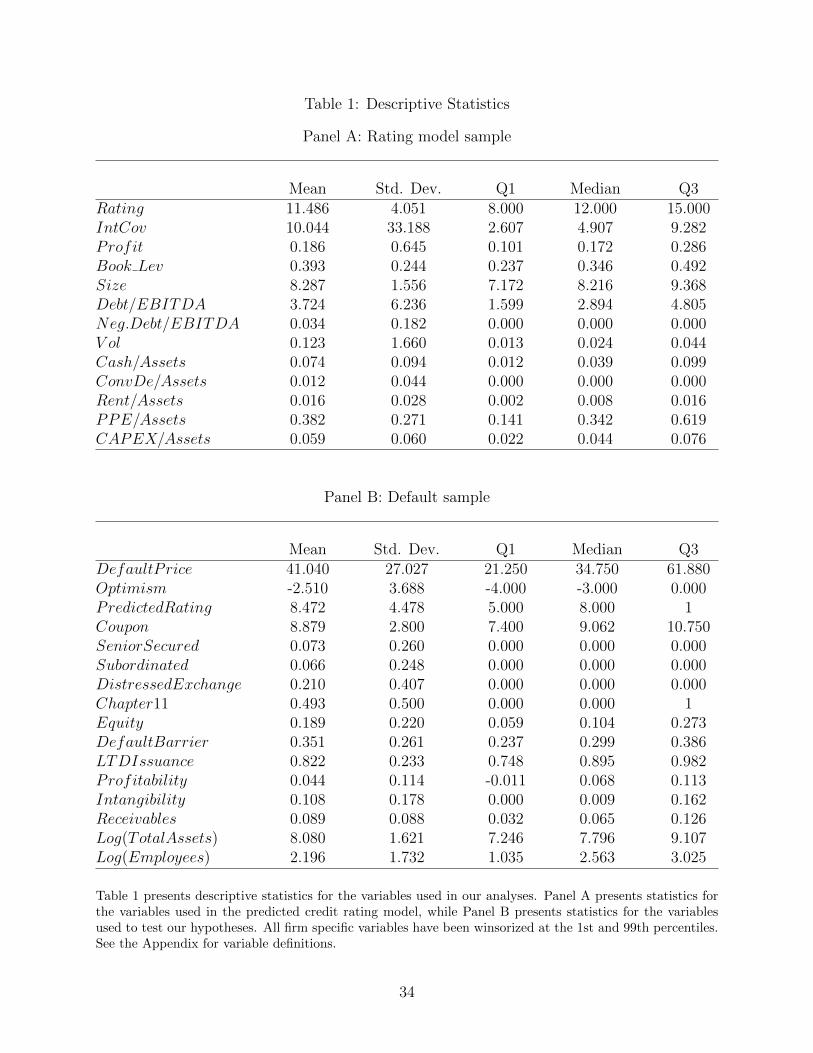
Table 1: Descriptive Statistics
Panel A: Rating model sample
Mean Std. Dev. Q1 Median Q3Rating 11.486 4.051 8.000 12.000 15.000IntCov 10.044 33.188 2.607 4.907 9.282Profit 0.186 0.645 0.101 0.172 0.286Book Lev 0.393 0.244 0.237 0.346 0.492Size 8.287 1.556 7.172 8.216 9.368Debt/EBITDA 3.724 6.236 1.599 2.894 4.805Neg.Debt/EBITDA 0.034 0.182 0.000 0.000 0.000V ol 0.123 1.660 0.013 0.024 0.044Cash/Assets 0.074 0.094 0.012 0.039 0.099ConvDe/Assets 0.012 0.044 0.000 0.000 0.000Rent/Assets 0.016 0.028 0.002 0.008 0.016PPE/Assets 0.382 0.271 0.141 0.342 0.619CAPEX/Assets 0.059 0.060 0.022 0.044 0.076
Panel B: Default sample
Mean Std. Dev. Q1 Median Q3DefaultPrice 41.040 27.027 21.250 34.750 61.880Optimism -2.510 3.688 -4.000 -3.000 0.000PredictedRating 8.472 4.478 5.000 8.000 1Coupon 8.879 2.800 7.400 9.062 10.750SeniorSecured 0.073 0.260 0.000 0.000 0.000Subordinated 0.066 0.248 0.000 0.000 0.000DistressedExchange 0.210 0.407 0.000 0.000 0.000Chapter11 0.493 0.500 0.000 0.000 1Equity 0.189 0.220 0.059 0.104 0.273DefaultBarrier 0.351 0.261 0.237 0.299 0.386LTDIssuance 0.822 0.233 0.748 0.895 0.982Profitability 0.044 0.114 -0.011 0.068 0.113Intangibility 0.108 0.178 0.000 0.009 0.162Receivables 0.089 0.088 0.032 0.065 0.126Log(TotalAssets) 8.080 1.621 7.246 7.796 9.107Log(Employees) 2.196 1.732 1.035 2.563 3.025
Table 1 presents descriptive statistics for the variables used in our analyses. Panel A presents statistics forthe variables used in the predicted credit rating model, while Panel B presents statistics for the variablesused to test our hypotheses. All firm specific variables have been winsorized at the 1st and 99th percentiles.See the Appendix for variable definitions.
34

Table 2: Correlations
(1) (2) (3) (4) (5) (6) (7) (8)DefaultPrice (1) 0.071∗ 0.060∗ -0.033 0.220∗∗∗ -0.056 0.332∗∗∗ -0.265∗∗∗
Optimism (2) 0.098∗∗∗ -0.768∗∗∗ 0.147∗∗∗ -0.028 0.115∗∗∗ 0.085∗∗ -0.360∗∗∗
PredictedRating (3) 0.105∗∗∗ -0.711∗∗∗ -0.272∗∗∗ -0.005 -0.049 -0.091∗∗ 0.195∗∗∗
Coupon (4) -0.013 0.131∗∗∗ -0.189∗∗∗ 0.070∗ -0.094∗∗ -0.242∗∗∗ 0.030SeniorSecured (5) 0.234∗∗∗ -0.023 -0.034 0.085∗∗ -0.074∗ -0.086∗∗ 0.127∗∗∗
Subordinated (6) -0.052 0.123∗∗∗ -0.058 -0.083∗∗ -0.074∗ 0.031 -0.125∗∗∗
DistressedExchange (7) 0.332∗∗∗ 0.057 -0.083∗∗ -0.234∗∗∗ -0.086∗∗ 0.031 -0.508∗∗∗
Chapter11 (8) -0.263∗∗∗ -0.328∗∗∗ 0.174∗∗∗ 0.041 0.127∗∗∗ -0.125∗∗∗ -0.508∗∗∗
Equity (9) 0.026 0.031 0.243∗∗∗ -0.064∗ -0.085∗∗ 0.063∗ -0.063∗ 0.064∗
DefaultBarrier (10) -0.096∗∗ 0.184∗∗∗ -0.367∗∗∗ -0.012 0.024 0.009 0.050 -0.118∗∗∗
LTDIssuance (11) 0.026 0.053 0.050 -0.036 -0.017 -0.050 0.185∗∗∗ 0.006Profitability (12) -0.071∗ -0.282∗∗∗ 0.264∗∗∗ 0.107∗∗∗ -0.061∗ 0.002 -0.298∗∗∗ 0.163∗∗∗
Intangibility (13) 0.020 0.027 -0.056 -0.088∗∗ -0.028 -0.054 0.115∗∗∗ -0.182∗∗∗
Receivables (14) -0.018 -0.091∗∗ 0.101∗∗∗ -0.041 -0.026 0.108∗∗∗ 0.016 -0.149∗∗∗
Log(TotalAssets) (15) 0.005 -0.694∗∗∗ 0.744∗∗∗ -0.322∗∗∗ -0.064∗ -0.136∗∗∗ 0.125∗∗∗ 0.215∗∗∗
Log(Employees) (16) -0.087∗∗ -0.519∗∗∗ 0.546∗∗∗ -0.137∗∗∗ -0.150∗∗∗ -0.080∗∗ -0.124∗∗∗ 0.280∗∗∗
Correlations (continued)
(9) (10) (11) (12) (13) (14) (15) (16)DefaultPrice (1) 0.185∗∗∗ -0.123∗∗∗ 0.023 -0.041 -0.082∗∗ -0.073∗ 0.025 -0.067∗
Optimism (2) 0.047 0.204∗∗∗ 0.091∗∗ -0.290∗∗∗ 0.055 -0.007 -0.625∗∗∗ -0.509∗∗∗
PredictedRating (3) 0.114∗∗∗ -0.420∗∗∗ -0.086∗∗ 0.243∗∗∗ -0.069∗ 0.084∗∗ 0.730∗∗∗ 0.573∗∗∗
Coupon (4) -0.024 0.025 -0.042 0.179∗∗∗ -0.035 0.001 -0.406∗∗∗ -0.163∗∗∗
SeniorSecured (5) -0.078∗∗ 0.050 -0.021 -0.110∗∗∗ -0.041 0.005 -0.041 -0.125∗∗∗
Subordinated (6) 0.088∗∗ 0.044 -0.029 -0.040 -0.021 0.099∗∗∗ -0.143∗∗∗ -0.072∗
DistressedExchange (7) -0.037 0.201∗∗∗ 0.245∗∗∗ -0.194∗∗∗ 0.109∗∗∗ -0.136∗∗∗ 0.141∗∗∗ -0.138∗∗∗
Chapter11 (8) 0.088∗∗ -0.206∗∗∗ -0.062∗ 0.140∗∗∗ -0.208∗∗∗ -0.132∗∗∗ 0.226∗∗∗ 0.260∗∗∗
Equity (9) -0.453∗∗∗ 0.142∗∗∗ 0.185∗∗∗ -0.303∗∗∗ -0.086∗∗ 0.022 0.001DefaultBarrier (10) -0.228∗∗∗ 0.024 0.003 0.162∗∗∗ -0.005 -0.267∗∗∗ -0.353∗∗∗
LTDIssuance (11) 0.189∗∗∗ -0.408∗∗∗ 0.109∗∗∗ 0.112∗∗∗ -0.357∗∗∗ -0.043 -0.222∗∗∗
Profitability (12) 0.066∗ 0.153∗∗∗ -0.034 0.003 0.082∗∗ -0.071∗ 0.159∗∗∗
Intangibility (13) -0.141∗∗∗ 0.170∗∗∗ 0.053 0.178∗∗∗ 0.180∗∗∗ -0.027 0.053Receivables (14) 0.008 0.098∗∗∗ -0.290∗∗∗ 0.106∗∗∗ -0.045 -0.121∗∗∗ 0.075∗
Log(TotalAssets) (15) 0.096∗∗ -0.229∗∗∗ 0.049 -0.009 -0.028 0.022 0.651∗∗∗
Log(Employees) (16) -0.003 -0.211∗∗∗ -0.071∗ 0.205∗∗∗ -0.055 0.109∗∗∗ 0.690∗∗∗
Table 2 presents Pearson and Spearman correlation for the variables used in our analyses. We report Pearson(Spearman) correlations above (below) the diagonal. All firm specific variables have been winsorized at the1st and 99th percentiles. ***, **, and * denote statistical significance at the 0.01, 0.05, and 0.10 levels,respectively. See the Appendix for variable definitions.
35

Table 3: Rating model estimation
(1)Rating
IntCov 0.0061∗∗∗
(4.05)Profit 0.0136
(0.51)Book Lev -3.0014∗∗∗
(-17.53)Size 0.7040∗∗∗
(23.77)Debt/EBITDA -0.0789∗∗∗
(-13.66)Neg.Debt/EBITDA -3.3831∗∗∗
(-17.76)V ol -0.0141
(-1.95)Cash/Assets -1.3708∗∗∗
(-4.46)ConvDe/Assets -1.5357∗∗∗
(-3.41)Rent/Assets -5.9437∗∗∗
(-5.17)PPE/Assets 0.9197∗∗∗
(4.20)CAPEX/Assets 1.7491∗∗
(2.88)Industry Fixed Effects YesObservations 26,758Pseudo R2 0.153
Table 3 presents a pooled estimation of the predicted rating ordered probit model over the 1990–2015 period.Our later analyses rely on annual estimations of the same model. Industry fixed effects are included basedon Fama and French (1997) industry definitions. Standard errors are clustered by firm. All firm specificvariables have been winsorized at the 1st and 99th percentiles. ***, **, and * denote statistical significanceat the 0.01, 0.05, and 0.10 levels, respectively. See the Appendix for variable definitions.
36

Table 4: Average rating optimism prior to events of default
Panel A: Default-only sample
Defaultt−3mo -1.669(-10.15)
Defaultt−6mo -1.331(-8.14)
Defaultt−9mo -1.086(-6.71)
Defaultt−12mo -1.022(-6.29)
Defaultt−15mo -1.002(-5.98)
Defaultt−18mo -0.934(-5.39)
Defaultt−21mo -0.828(-4.93)
Defaultt−24mo -0.826(-4.92)
F -test: Defaultt−3 = Defaultt−12 39.99∗∗∗
F -test: Defaultt−3 = Defaultt−24 44.56∗∗∗
37

Table 4 – continued
Panel B: Matched sample
(1) (2) (3)Default Non-Default Diff.
Defaultt−3mo -1.669 -0.102 -1.566∗∗∗
(-10.15) (-0.58) (-6.60)Defaultt−6mo -1.331 -0.145 -1.186∗∗∗
(-8.14) (-0.81) (-4.99)Defaultt−9mo -1.086 -0.124 -0.962∗∗∗
(-6.71) (-0.71) (-4.10)Defaultt−12mo -1.022 -0.067 -0.955∗∗∗
(-6.29) (-0.41) (-4.20)Defaultt−15mo -1.002 -0.110 -0.893∗∗∗
(-5.98) (-0.67) (-3.87)Defaultt−18mo -0.934 -0.140 -0.793∗∗∗
(-5.39) (-0.88) (-3.40)Defaultt−21mo -0.828 -0.136 -0.692∗∗∗
(-4.93) (-0.87) (-3.05)Defaultt−24mo -0.826 -0.160 -0.666∗∗∗
(-4.92) (-1.00) (-2.90)F -test: Defaultt−3 = Defaultt−12 39.99∗∗∗ 0.17 20.79∗∗∗
F -test: Defaultt−3 = Defaultt−24 44.56∗∗∗ 0.27 29.11∗∗∗
Table 4 presents the average rating optimism at three-month intervals over the two-year period prior to de-fault. Panel A presents only the actual default observations while Panel B presents both default observationsand industry-year matched non-default observations. Standard errors are clustered by firm. All firm specificvariables have been winsorized at the 1st and 99th percentiles. ***, **, and * denote statistical significanceat the 0.01, 0.05, and 0.10 levels, respectively. See the Appendix for variable definitions.
38
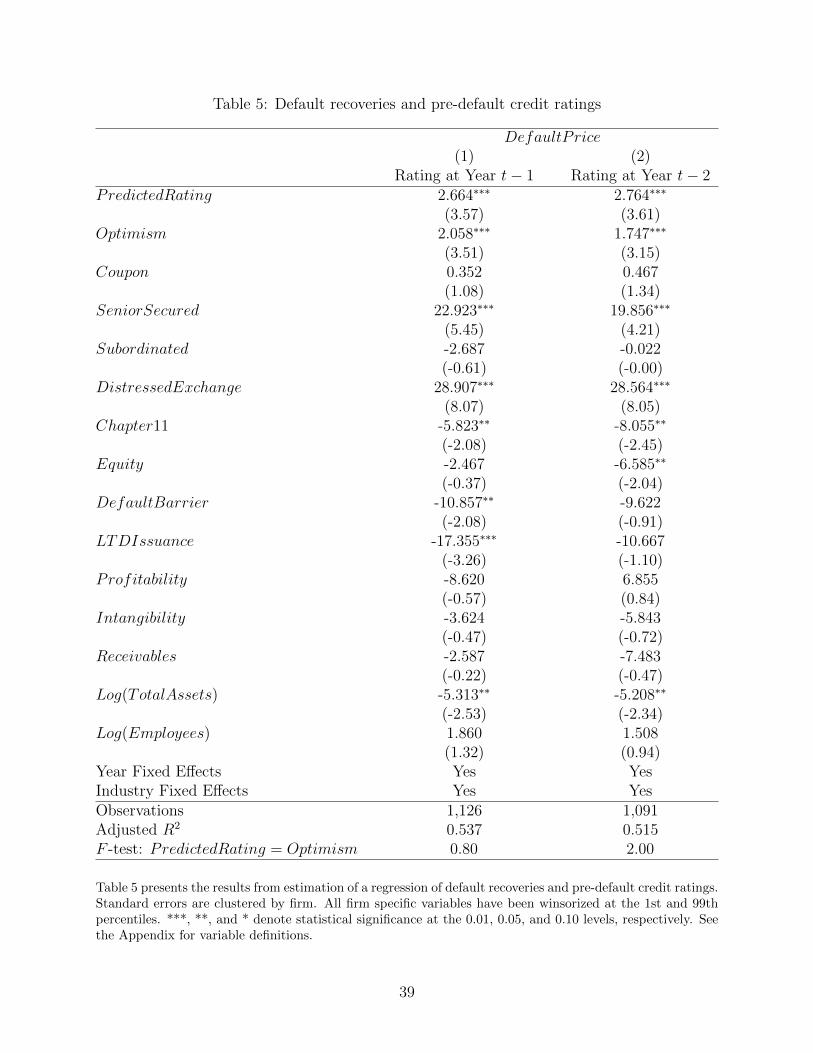
Table 5: Default recoveries and pre-default credit ratings
DefaultPrice(1) (2)
Rating at Year t− 1 Rating at Year t− 2PredictedRating 2.664∗∗∗ 2.764∗∗∗
(3.57) (3.61)Optimism 2.058∗∗∗ 1.747∗∗∗
(3.51) (3.15)Coupon 0.352 0.467
(1.08) (1.34)SeniorSecured 22.923∗∗∗ 19.856∗∗∗
(5.45) (4.21)Subordinated -2.687 -0.022
(-0.61) (-0.00)DistressedExchange 28.907∗∗∗ 28.564∗∗∗
(8.07) (8.05)Chapter11 -5.823∗∗ -8.055∗∗
(-2.08) (-2.45)Equity -2.467 -6.585∗∗
(-0.37) (-2.04)DefaultBarrier -10.857∗∗ -9.622
(-2.08) (-0.91)LTDIssuance -17.355∗∗∗ -10.667
(-3.26) (-1.10)Profitability -8.620 6.855
(-0.57) (0.84)Intangibility -3.624 -5.843
(-0.47) (-0.72)Receivables -2.587 -7.483
(-0.22) (-0.47)Log(TotalAssets) -5.313∗∗ -5.208∗∗
(-2.53) (-2.34)Log(Employees) 1.860 1.508
(1.32) (0.94)Year Fixed Effects Yes YesIndustry Fixed Effects Yes YesObservations 1,126 1,091Adjusted R2 0.537 0.515F -test: PredictedRating = Optimism 0.80 2.00
Table 5 presents the results from estimation of a regression of default recoveries and pre-default credit ratings.Standard errors are clustered by firm. All firm specific variables have been winsorized at the 1st and 99thpercentiles. ***, **, and * denote statistical significance at the 0.01, 0.05, and 0.10 levels, respectively. Seethe Appendix for variable definitions.
39

Table 6: The effect of competition from Fitch
Panel A: Rating adjustments sample
(1)RatingOptimism
Defaultt−3mo -1.612∗∗∗
(-5.88)Defaultt−6mo -1.281∗∗∗
(-4.72)Defaultt−9mo -0.875∗∗∗
(-3.40)Defaultt−12mo -0.839∗∗∗
(-3.17)Defaultt−15mo -0.878∗∗∗
(-3.44)Defaultt−18mo -0.741∗∗∗
(-2.77)Defaultt−21mo -0.530∗∗
(-2.04)Defaultt−24mo -0.504∗∗
(-1.99)FitchMktSh × Defaultt−3mo 3.039∗∗∗
(6.22)FitchMktSh × Defaultt−6mo 2.259∗∗∗
(3.16)FitchMktSh × Defaultt−9mo 2.030∗∗∗
(3.81)FitchMktSh × Defaultt−12mo 2.111∗∗∗
(3.12)FitchMktSh × Defaultt−15mo 1.945∗∗∗
(3.45)FitchMktSh × Defaultt−18mo 1.861∗∗∗
(3.84)FitchMktSh × Defaultt−21mo 1.646∗∗∗
(3.34)FitchMktSh × Defaultt−24mo 2.916∗∗∗
(5.85)Observations 3,624Adjusted R2 0.118F -test: Defaultt−3 = Defaultt−12 15.34∗∗∗
F -test: Defaultt−3 = Defaultt−24 20.35∗∗∗
40
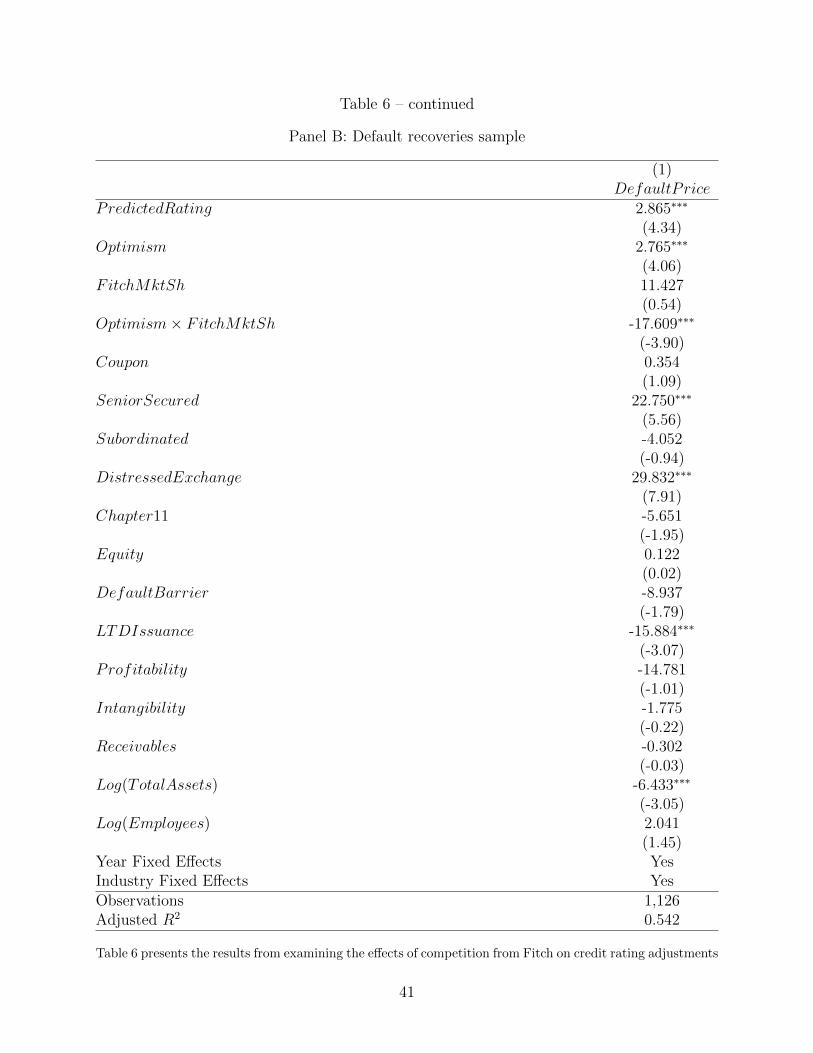
Table 6 – continued
Panel B: Default recoveries sample
(1)DefaultPrice
PredictedRating 2.865∗∗∗
(4.34)Optimism 2.765∗∗∗
(4.06)FitchMktSh 11.427
(0.54)Optimism× FitchMktSh -17.609∗∗∗
(-3.90)Coupon 0.354
(1.09)SeniorSecured 22.750∗∗∗
(5.56)Subordinated -4.052
(-0.94)DistressedExchange 29.832∗∗∗
(7.91)Chapter11 -5.651
(-1.95)Equity 0.122
(0.02)DefaultBarrier -8.937
(-1.79)LTDIssuance -15.884∗∗∗
(-3.07)Profitability -14.781
(-1.01)Intangibility -1.775
(-0.22)Receivables -0.302
(-0.03)Log(TotalAssets) -6.433∗∗∗
(-3.05)Log(Employees) 2.041
(1.45)Year Fixed Effects YesIndustry Fixed Effects YesObservations 1,126Adjusted R2 0.542
Table 6 presents the results from examining the effects of competition from Fitch on credit rating adjustments
41

prior to default and default recoveries. Panel A presents results for the rating adjustments sample whilePanel B presents results for the default recoveries sample. Standard errors are clustered by firm. All firmspecific variables have been winsorized at the 1st and 99th percentiles. ***, **, and * denote statisticalsignificance at the 0.01, 0.05, and 0.10 levels, respectively. See the Appendix for variable definitions.
42

Table 7: Sensitivity test: Default recoveries and pre-default credit ratings controlling foraccounting conservatism
(1) (2)DefaultPrice DefaultPrice
PredictedRating 2.671∗∗∗ 2.846∗∗∗
(3.59) (4.36)Optimism 2.059∗∗∗ 2.699∗∗∗
(3.47) (3.97)FitchMktSh 12.113
(0.56)Optimism× FitchMktSh -18.622∗∗∗
(-4.11)Conservatism 2.131 1.981
(1.39) (1.28)Coupon 0.353 0.356
(1.08) (1.09)SeniorSecured 22.937∗∗∗ 22.768∗∗∗
(5.49) (5.60)Subordinated -3.437 -4.655
(-0.79) (-1.08)DistressedExchange 28.986∗∗∗ 29.815∗∗∗
(8.20) (8.01)Chapter11 -6.126∗∗ -5.969∗∗
(-2.22) (-2.10)Equity -1.399 1.014
(-0.21) (0.16)DefaultBarrier -10.327∗∗ -8.616∗
(-2.04) (-1.80)LTDIssuance -17.237∗∗∗ -15.906∗∗∗
(-3.22) (-3.06)Profitability -8.895 -14.403
(-0.59) (-0.99)Intangibility -3.621 -1.815
(-0.47) (-0.23)Receivables -0.906 1.272
(-0.08) (0.11)Log(TotalAssets) -5.110∗∗ -6.171∗∗∗
(-2.41) (-2.89)Log(Employees) 1.833 2.014
(1.31) (1.44)Year Fixed Effects Yes YesIndustry Fixed Effects Yes YesObservations 1,125 1,125Adjusted R2 0.539 0.543
43

Table 7 presents the results from estimating the association between default recoveries and pre-default creditratings controlling for accounting conservatism. Standard errors are clustered by firm. All firm specificvariables have been winsorized at the 1st and 99th percentiles. ***, **, and * denote statistical significanceat the 0.01, 0.05, and 0.10 levels, respectively. See the Appendix for variable definitions.
44