creb december 2010 real estate statistics
TRANSCRIPT

8/8/2019 CREB December 2010 Real Estate Statistics
http://slidepdf.com/reader/full/creb-december-2010-real-estate-statistics 1/10REALTORS® are educated, licensed professionals trained to guide you through the real estate transaction.
No MLS® information can be reprinted without sourcing the Calgary Real Estate Board.
Absorption Rate
Total MLS® Information
DECEMBER 2010
StatsREB ®Calgary Real Estate Board
Total MLS® Inventory to Sa
R E A L T O R ® S O L D P R O P E R T I
1 42 8 1 44 7
1988
2535 24482239
19021 68 3 1 62 8 1673 1523 1496
1289
6006
6838
8154
10003
11725
1298913459
12865
11928
11349
10473
9439
71
402,055
395,435
399,661420,693 405,850
433,030
433,248
416,064
395,933410,708
403,679411,224
389
360,000352,000
352,000 375,000364,500
375,000 370,000362,000
350,000
355,000 359,000 360,000
344,0
0
2000
4000
6000
8000
10000
12000
14000
16000
18000
20000
22000
Dec-09 Jan-10 Feb-10 Mar-10 Apr-10 May-10 Jun-10 Jul-10 Aug-10 Sep-10 Oct-10 Nov-10 Dec-
# S a l e s / I n v e n t o r y
TOTAL MLS®
DECEMBER 2010
Sales
Inventory
Avg SalePrice
Median SalePrice
0
2
4
6
8
10
12
Dec-07 Feb-08 Apr-08 Jun-08 Aug-08 Oct-08 Dec-08 Feb-09 Apr-09 Jun-09 Aug-09 Oct-09 Dec-09 Feb-10 Apr-10 Jun-10 Aug-10
ABSORPTION RATE
TOTAL MLS® DECEMBER 2010
Balanced Market
0
2,000
4,000
6,000
8,000
10,000
12,000
14,000
16,000
Dec-07Feb-08Apr-08 Jun-08 Aug-08Oct-08Dec-08Feb-09Apr-09Jun-09 Aug-09 Oct-09 Dec-09Feb-10Apr-10 Jun-10 Aug-
TOTAL MLS®
DECEMBER 2010
Inventory Sales
Calgary, January 4, 2011 – Home and condo salesin Calgary and area remained relatively unchanged in
December 2010, indicating that a full-fledged recoveryin the housing market has yet to take hold, accordingto figures released today by the Calgary Real EstateBoard (CREB®).
The number of single family home sales in themonth of December 2010 were 734, compared withNovember 2010, when sales were 891—a decline of about 18 per cent. The number of condominium salesfor the month of December 2010 was 320. This wasup from the 310 condominium transactions recorded inNovember 2010.
Year-over-year, the number of single family homes soldin December 2010 in the city of Calgary were down 8
per cent. In December 2009, single family home salestotaled 799. Condominium sales saw a decrease of 6per cent from the same time a year ago. In December2009, condominium sales were 341.
Looking back in 2010, total single family home salesin the city of Calgary were 12,095, a decline of about16 per cent from 2009, when total single family saleswere 14,440. 2010 marks the lowest number of singlefamily home sales since 1995, when 9,534 singlefamily homes were sold. Total MLS® sales for Calgaryand area in 2010 were 21,789, a decline of about 15 percent from 2009, when total MLS® sales for Calgary andarea were 25,719. This is the lowest number of totalMLS® sales for Calgary and area since 2000, when totalMLS® sales were 20,488.
“Undoubtedly housing markets in Alberta and Calgaryunderperformed in 2010, as sales recoveries did notmaterialize as forecasted. In many ways, re-salesin 2010 showed a repeat of 2008, with a short livedresurgence in the first few months, when confidencereturned to the market,” says Diane Scott, president of CREB®.
“Employment and net-migration have been slower topick up here in Calgary—and these are key driversof our housing market. The good news is we arenow seeing marked improvements in investment andemployment in the energy sector. We believe thesegreen shoots in our economy, supported by improved
affordability and low interest rates, will eventuallytranslate into a gradual recovery of our housing marketas we move into 2011,” adds Scott.
The average price of a single family home in the cityof Calgary in December 2010 was $441,341, showinga 3 per cent decrease from November 2010, when theaverage price was $455,460, and a 2 per cent decreasefrom December 2009, when the average price was$451,349. The average price of a condominium inthe city of Calgary in December 2010 was $282,768,showing a 1 per cent decrease from November 2010,when the average price was $284,667 and a 2 per centdecrease over last year, when the average price was
EMPLOYMENT AND MIGRATION NEEDED TO SHAKE OFF WINTER CHILL
Low Interest Rates and Affordability to Support Housing Recovery in 2011
$288,640. Average price information can be useful inestablishing trends over time, but does not indicate
actual prices in centres comprised of widely divergentneighbourhoods, or account for price differentialsbetween geographical areas.
The median price of a single family home in the cityof Calgary for December 2010 was $389,000, showinga 3 per cent decrease from November 2010 when themedian price was $399,900. This was a 3 per centdecrease from December 2009, when the median pricewas $401,000. The median price of a condominiumin December 2010 was $258,500, showing a 2 percent increase from November 2010, when the medianprice was $253,300, and a 2 per cent decrease fromDecember 2009, when it was $265,000.
All city of Calgary MLS®
statistics include propertieslisted and sold only within Calgary’s city limits. Themedian price is the price that is midway between theleast expensive and most expensive home sold in anarea during a given period of time. During that time,half the buyers bought homes that cost more than themedian price and half bought homes for less than themedian price.
“Supply outstripped demand in the second half of 2010,establishing conditions for a buyers’ market. Overallwe did see significant improvements in affordability inthe Calgary market in 2010—and I think the messageto prospective buyers is that this is a great time to buyif you’re looking for good selection, specific locations
and price points. The median price did indeed declinein 2010, signaling a year-over-year price correctionof about 2 per cent for single-family homes, just over4 per cent for condos and 6 per cent for the outlyingtowns,” adds Scott.
Single family listings in the city of Calgary added forthe month of December 2010 totaled 744, a decreaseof 44 per cent from November 2010 when 1,318 newlistings were added, and showing a decrease of 8 percent from December 2009, when 806 new listingscame to the market.
Condominium new listings in the city of Calgary addedfor December 2010 were 369, down 42 per cent fromNovember 2010, when the MLS® saw 632 condo
listings coming to the market. This is a decrease of 17per cent from December 2009, when new condominiumlistings added were 444.
“There has been some curbing of inventory levelsduring the last three months of 2010, albeit at a slowpace. Early 2011 will see inventory levels adjust,resulting in a gradual return to a more balanced andsustainable housing market. All in all we believe it willbe a slow and gradual warm up in 2011, but it will takesome time for the housing market to bring inventorylevels down and shake off these winter blues,” saysScott.
1 of 10
8/8/2019 CREB December 2010 Real Estate Statistics
http://slidepdf.com/reader/full/creb-december-2010-real-estate-statistics 2/10
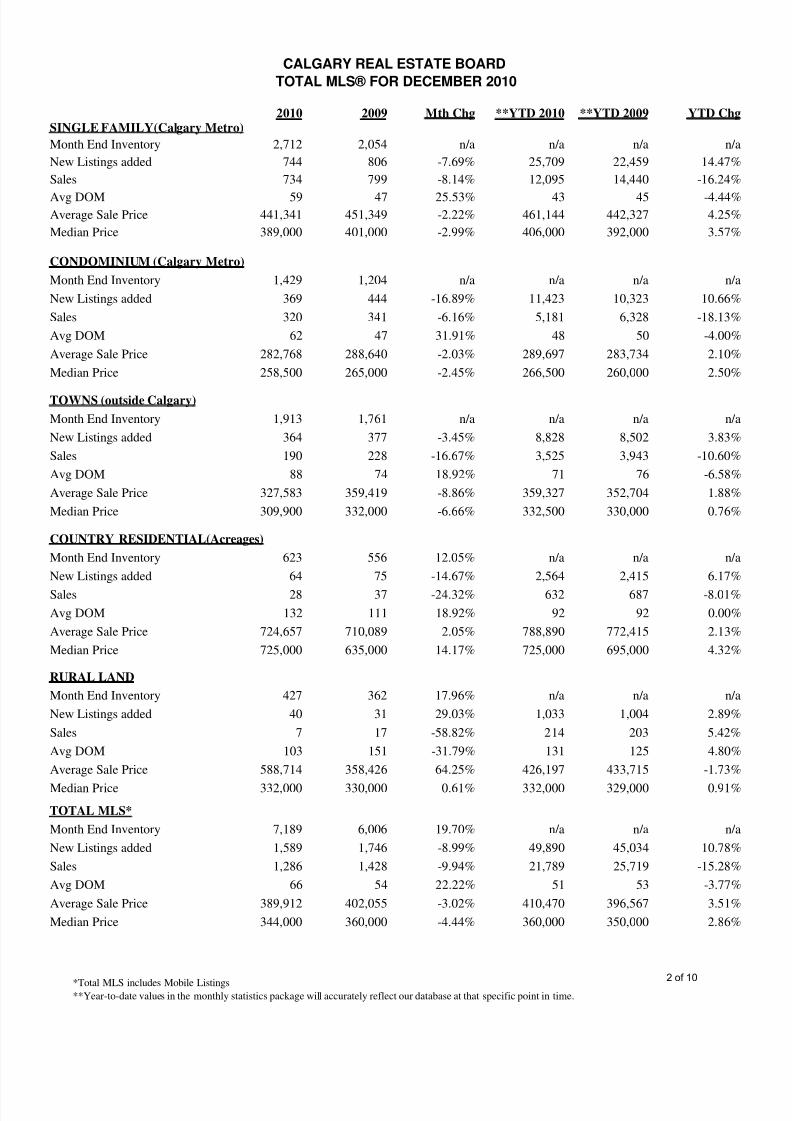
*Total MLS includes Mobile Listings**Year-to-date values in the monthly statistics package will accurately reflect our database at that specific point in time.
2010 2009 Mth Chg **YTD 2010 **YTD 2009 YTD ChgSINGLE FAMILY(Calgary Metro)
Month End Inventory 2,712 2,054 n/a n/a n/a n/a
New Listings added 744 806 -7.69% 25,709 22,459 14.47%
Sales 734 799 -8.14% 12,095 14,440 -16.24%
Avg DOM 59 47 25.53% 43 45 -4.44%Average Sale Price 441,341 451,349 -2.22% 461,144 442,327 4.25%
Median Price 389,000 401,000 -2.99% 406,000 392,000 3.57%
CONDOMINIUM (Calgary Metro)
Month End Inventory 1,429 1,204 n/a n/a n/a n/a
New Listings added 369 444 -16.89% 11,423 10,323 10.66%
Sales 320 341 -6.16% 5,181 6,328 -18.13%
Avg DOM 62 47 31.91% 48 50 -4.00%
Average Sale Price 282,768 288,640 -2.03% 289,697 283,734 2.10%
Median Price 258,500 265,000 -2.45% 266,500 260,000 2.50%
TOWNS (outside Calgary)
Month End Inventory 1,913 1,761 n/a n/a n/a n/a
New Listings added 364 377 -3.45% 8,828 8,502 3.83%
Sales 190 228 -16.67% 3,525 3,943 -10.60%
Avg DOM 88 74 18.92% 71 76 -6.58%
Average Sale Price 327,583 359,419 -8.86% 359,327 352,704 1.88%
Median Price 309,900 332,000 -6.66% 332,500 330,000 0.76%
COUNTRY RESIDENTIAL(Acreages)
Month End Inventory 623 556 12.05% n/a n/a n/a
New Listings added 64 75 -14.67% 2,564 2,415 6.17%
Sales 28 37 -24.32% 632 687 -8.01%
Avg DOM 132 111 18.92% 92 92 0.00%
Average Sale Price 724,657 710,089 2.05% 788,890 772,415 2.13%
Median Price 725,000 635,000 14.17% 725,000 695,000 4.32%
RURAL LAND
Month End Inventory 427 362 17.96% n/a n/a n/a
New Listings added 40 31 29.03% 1,033 1,004 2.89%
Sales 7 17 -58.82% 214 203 5.42%
Avg DOM 103 151 -31.79% 131 125 4.80%
Average Sale Price 588,714 358,426 64.25% 426,197 433,715 -1.73%
Median Price 332,000 330,000 0.61% 332,000 329,000 0.91%
TOTAL MLS*
Month End Inventory 7,189 6,006 19.70% n/a n/a n/a
New Listings added 1,589 1,746 -8.99% 49,890 45,034 10.78%
Sales 1,286 1,428 -9.94% 21,789 25,719 -15.28%
Avg DOM 66 54 22.22% 51 53 -3.77%
Average Sale Price 389,912 402,055 -3.02% 410,470 396,567 3.51%
Median Price 344,000 360,000 -4.44% 360,000 350,000 2.86%
CALGARY REAL ESTATE BOARD
TOTAL MLS® FOR DECEMBER 2010
2 of 10
8/8/2019 CREB December 2010 Real Estate Statistics
http://slidepdf.com/reader/full/creb-december-2010-real-estate-statistics 3/10
SINGLE FAMILY
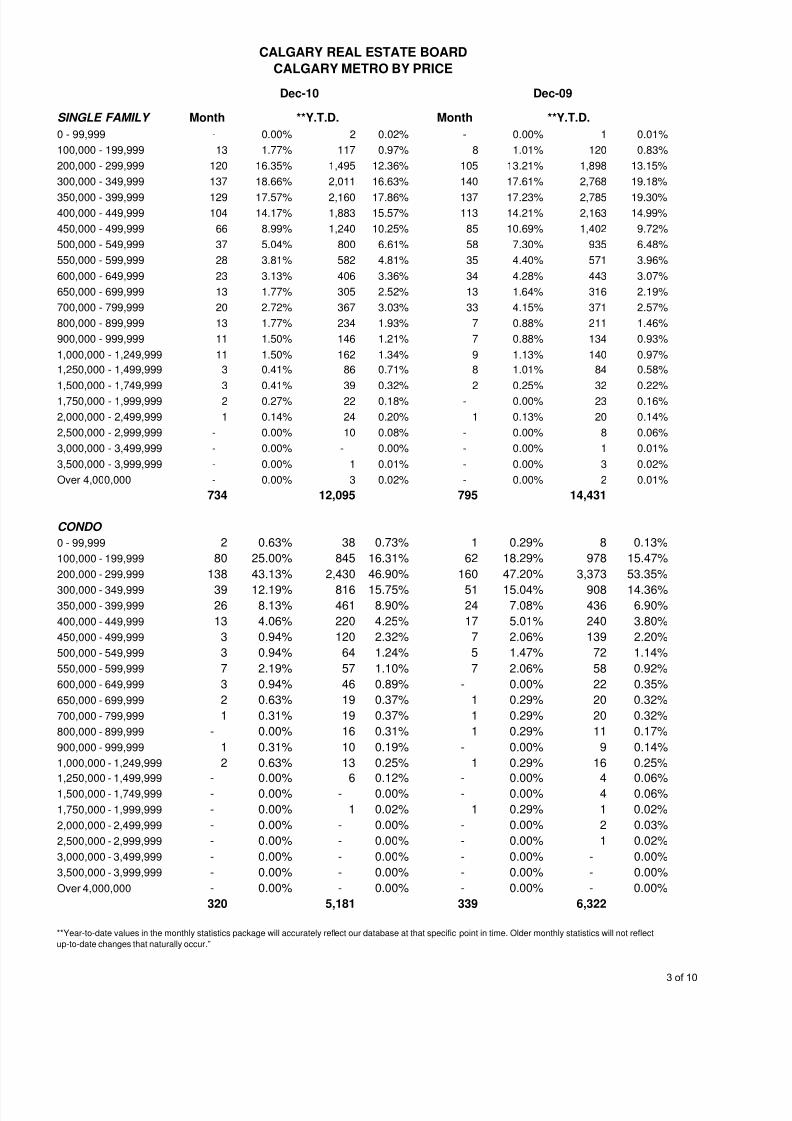
0 - 99,999 - 0.00% 2 0.02% - 0.00% 1 0.01%
100,000 - 199,999 13 1.77% 117 0.97% 8 1.01% 120 0.83%
200,000 - 299,999 120 16.35% 1,495 12.36% 105 13.21% 1,898 13.15%
300,000 - 349,999 137 18.66% 2,011 16.63% 140 17.61% 2,768 19.18%
350,000 - 399,999 129 17.57% 2,160 17.86% 137 17.23% 2,785 19.30%400,000 - 449,999 104 14.17% 1,883 15.57% 113 14.21% 2,163 14.99%
450,000 - 499,999 66 8.99% 1,240 10.25% 85 10.69% 1,402 9.72%
500,000 - 549,999 37 5.04% 800 6.61% 58 7.30% 935 6.48%
550,000 - 599,999 28 3.81% 582 4.81% 35 4.40% 571 3.96%
600,000 - 649,999 23 3.13% 406 3.36% 34 4.28% 443 3.07%
650,000 - 699,999 13 1.77% 305 2.52% 13 1.64% 316 2.19%
700,000 - 799,999 20 2.72% 367 3.03% 33 4.15% 371 2.57%
800,000 - 899,999 13 1.77% 234 1.93% 7 0.88% 211 1.46%
900,000 - 999,999 11 1.50% 146 1.21% 7 0.88% 134 0.93%
1,000,000 - 1,249,999 11 1.50% 162 1.34% 9 1.13% 140 0.97%
1,250,000 - 1,499,999 3 0.41% 86 0.71% 8 1.01% 84 0.58%
1,500,000 - 1,749,999 3 0.41% 39 0.32% 2 0.25% 32 0.22%
1,750,000 - 1,999,999 2 0.27% 22 0.18% - 0.00% 23 0.16%
2,000,000 - 2,499,999 1 0.14% 24 0.20% 1 0.13% 20 0.14%
2,500,000 - 2,999,999 - 0.00% 10 0.08% - 0.00% 8 0.06%
3,000,000 - 3,499,999 - 0.00% - 0.00% - 0.00% 1 0.01%
3,500,000 - 3,999,999 - 0.00% 1 0.01% - 0.00% 3 0.02%
Over 4,000,000 - 0.00% 3 0.02% - 0.00% 2 0.01%
734 12,095 795 14,431
CONDO
0 - 99,999 2 0.63% 38 0.73% 1 0.29% 8 0.13%
100,000 - 199,999 80 25.00% 845 16.31% 62 18.29% 978 15.47%
200,000 - 299,999 138 43.13% 2,430 46.90% 160 47.20% 3,373 53.35%
300,000 - 349,999 39 12.19% 816 15.75% 51 15.04% 908 14.36%350,000 - 399,999 26 8.13% 461 8.90% 24 7.08% 436 6.90%
400,000 - 449,999 13 4.06% 220 4.25% 17 5.01% 240 3.80%
450,000 - 499,999 3 0.94% 120 2.32% 7 2.06% 139 2.20%
500,000 - 549,999 3 0.94% 64 1.24% 5 1.47% 72 1.14%
550,000 - 599,999 7 2.19% 57 1.10% 7 2.06% 58 0.92%
600,000 - 649,999 3 0.94% 46 0.89% - 0.00% 22 0.35%
650,000 - 699,999 2 0.63% 19 0.37% 1 0.29% 20 0.32%
700,000 - 799,999 1 0.31% 19 0.37% 1 0.29% 20 0.32%
800,000 - 899,999 - 0.00% 16 0.31% 1 0.29% 11 0.17%
900,000 - 999,999 1 0.31% 10 0.19% - 0.00% 9 0.14%
1,000,000 - 1,249,999 2 0.63% 13 0.25% 1 0.29% 16 0.25%
1,250,000 - 1,499,999 - 0.00% 6 0.12% - 0.00% 4 0.06%
1,500,000 - 1,749,999 - 0.00% - 0.00% - 0.00% 4 0.06%
1,750,000 - 1,999,999 - 0.00% 1 0.02% 1 0.29% 1 0.02%
2,000,000 - 2,499,999 - 0.00% - 0.00% - 0.00% 2 0.03%
2,500,000 - 2,999,999 - 0.00% - 0.00% - 0.00% 1 0.02%
3,000,000 - 3,499,999 - 0.00% - 0.00% - 0.00% - 0.00%
3,500,000 - 3,999,999 - 0.00% - 0.00% - 0.00% - 0.00%
Over 4,000,000 - 0.00% - 0.00% - 0.00% - 0.00%
320 5,181 339 6,322
**Year-to-date values in the monthly statistics package will accurately reflect our database at that specific point in time. Older monthly statistics will not reflect
up-to-date changes that naturally occur.”
CALGARY REAL ESTATE BOARD
CALGARY METRO BY PRICE
Dec-10 Dec-09
Month **Y.T.D. Month **Y.T.D.
3 of 10

8/8/2019 CREB December 2010 Real Estate Statistics
http://slidepdf.com/reader/full/creb-december-2010-real-estate-statistics 4/10
TOWNS
0 - 99,999 1 0.53% 72 2.04% 5 2.21% 66 1.68%
100,000 - 199,999 34 17.89% 374 10.61% 21 9.29% 369 9.37%
200,000 - 299,999 54 28.42% 882 25.02% 55 24.34% 1,044 26.50%
300,000 - 349,999 34 17.89% 621 17.62% 43 19.03% 792 20.10%
350,000 - 399,999 27 14.21% 527 14.95% 25 11.06% 625 15.86%400,000 - 449,999 15 7.89% 383 10.87% 31 13.72% 387 9.82%
450,000 - 499,999 10 5.26% 210 5.96% 18 7.96% 219 5.56%
500,000 - 549,999 6 3.16% 143 4.06% 6 2.65% 117 2.97%
550,000 - 599,999 1 0.53% 70 1.99% 4 1.77% 85 2.16%
600,000 - 649,999 - 0.00% 53 1.50% 6 2.65% 54 1.37%
650,000 - 699,999 1 0.53% 40 1.13% 6 2.65% 41 1.04%
700,000 - 799,999 1 0.53% 48 1.36% 3 1.33% 52 1.32%
800,000 - 899,999 3 1.58% 35 0.99% 1 0.44% 38 0.96%
900,000 - 999,999 1 0.53% 25 0.71% - 0.00% 13 0.33%
1,000,000 - 1,249,999 1 0.53% 18 0.51% 1 0.44% 21 0.53%
1,250,000 - 1,499,999 1 0.53% 13 0.37% 1 0.44% 10 0.25%
1,500,000 - 1,749,999 - 0.00% 6 0.17% - 0.00% 5 0.13%
1,750,000 - 1,999,999 - 0.00% 2 0.06% - 0.00% 1 0.03%
2,000,000 - 2,499,999 - 0.00% 3 0.09% - 0.00% 1 0.03%
2,500,000 - 2,999,999 - 0.00% - 0.00% - 0.00% - 0.00%
3,000,000 - 3,499,999 - 0.00% - 0.00% - 0.00% - 0.00%
3,500,000 - 3,999,999 - 0.00% - 0.00% - 0.00% - 0.00%
Over 4,000,000 - 0.00% - 0.00% - 0.00% - 0.00%
190 3,525 226 3,940
COUNTRY RESIDENTIAL (ACREAGES)
0 - 99,999 1 3.57% 16 2.53% 2 5.56% 6 0.88%
100,000 - 199,999 1 3.57% 23 3.64% - 0.00% 12 1.75%
200,000 - 299,999 1 3.57% 26 4.11% 2 5.56% 34 4.97%
300,000 - 349,999 1 3.57% 23 3.64% 1 2.78% 28 4.09%350,000 - 399,999 2 7.14% 21 3.32% 3 8.33% 36 5.26%
400,000 - 449,999 - 0.00% 14 2.22% 1 2.78% 36 5.26%
450,000 - 499,999 - 0.00% 34 5.38% 2 5.56% 24 3.51%
500,000 - 549,999 - 0.00% 21 3.32% 4 11.11% 36 5.26%
550,000 - 599,999 2 7.14% 34 5.38% - 0.00% 41 5.99%
600,000 - 649,999 4 14.29% 42 6.65% 5 13.89% 43 6.29%
650,000 - 699,999 1 3.57% 37 5.85% 4 11.11% 51 7.46%
700,000 - 799,999 5 17.86% 83 13.13% 2 5.56% 93 13.60%
800,000 - 899,999 2 7.14% 75 11.87% - 0.00% 57 8.33%
900,000 - 999,999 4 14.29% 43 6.80% 3 8.33% 42 6.14%
1,000,000 - 1,249,999 2 7.14% 56 8.86% 2 5.56% 66 9.65%
1,250,000 - 1,499,999 - 0.00% 38 6.01% 3 8.33% 38 5.56%
1,500,000 - 1,749,999 2 7.14% 21 3.32% 2 5.56% 16 2.34%1,750,000 - 1,999,999 - 0.00% 10 1.58% - 0.00% 6 0.88%
2,000,000 - 2,499,999 - 0.00% 9 1.42% - 0.00% 13 1.90%
2,500,000 - 2,999,999 - 0.00% 4 0.63% - 0.00% 4 0.58%
3,000,000 - 3,499,999 - 0.00% - 0.00% - 0.00% 2 0.29%
3,500,000 - 3,999,999 - 0.00% 1 0.16% - 0.00% - 0.00%
Over 4,000,000 - 0.00% 1 0.16% - 0.00% - 0.00%
28 632 36 684
**Year-to-date values in the monthly statistics package will accurately reflect our database at that specific point in time. Older monthly statistics will not reflect
up-to-date changes that naturally occur.”
Month **Y.T.D. Month **Y.T.D.
CALGARY REAL ESTATE BOARD
TOWN AND COUNTRY BY PRICE CATEGORY
Dec-10 Dec-09
4 of 10
8/8/2019 CREB December 2010 Real Estate Statistics
http://slidepdf.com/reader/full/creb-december-2010-real-estate-statistics 5/10
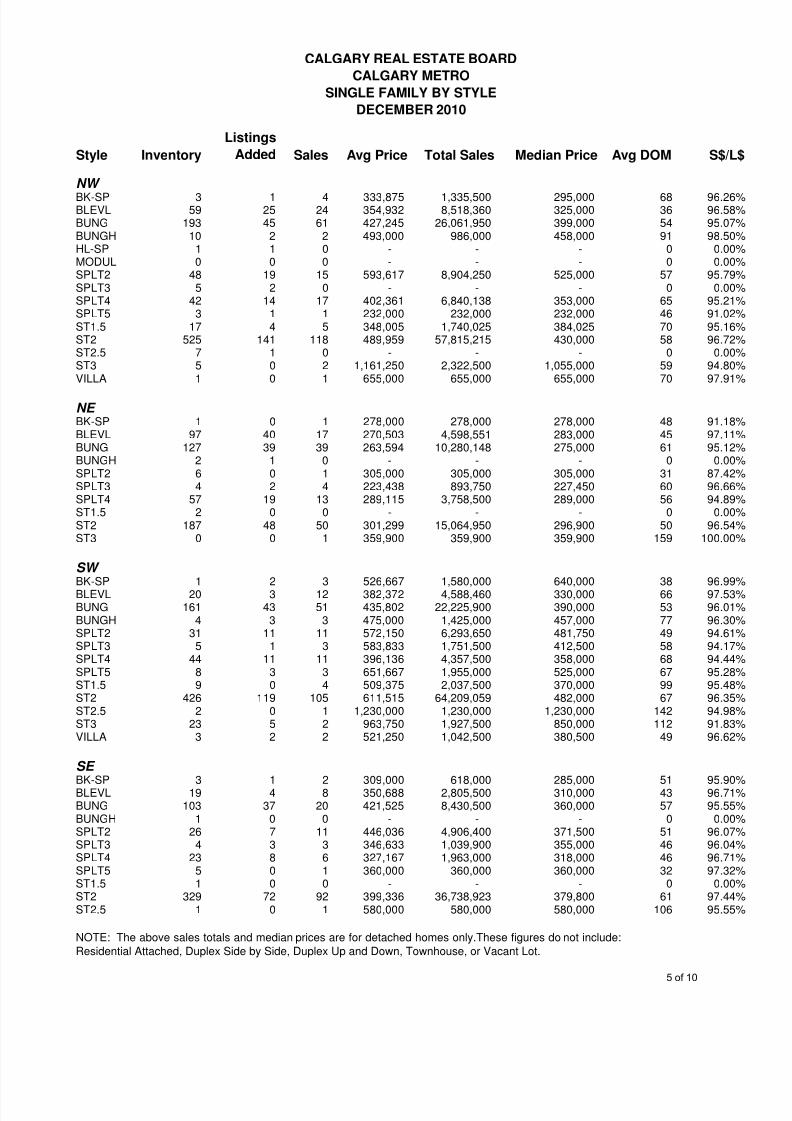
Style Inventory
Listings
Added Sales Avg Price Total Sales Median Price Avg DOM S$/L$
NW
BK-SP 3 1 4 333,875 1,335,500 295,000 68 96.26%BLEVL 59 25 24 354,932 8,518,360 325,000 36 96.58%BUNG 193 45 61 427,245 26,061,950 399,000 54 95.07%BUNGH 10 2 2 493,000 986,000 458,000 91 98.50%HL-SP 1 1 0 - - - 0 0.00%MODUL 0 0 0 - - - 0 0.00%SPLT2 48 19 15 593,617 8,904,250 525,000 57 95.79%SPLT3 5 2 0 - - - 0 0.00%SPLT4 42 14 17 402,361 6,840,138 353,000 65 95.21%SPLT5 3 1 1 232,000 232,000 232,000 46 91.02%ST1.5 17 4 5 348,005 1,740,025 384,025 70 95.16%ST2 525 141 118 489,959 57,815,215 430,000 58 96.72%ST2.5 7 1 0 - - - 0 0.00%ST3 5 0 2 1,161,250 2,322,500 1,055,000 59 94.80%VILLA 1 0 1 655,000 655,000 655,000 70 97.91%
NE
BK-SP 1 0 1 278,000 278,000 278,000 48 91.18%BLEVL 97 40 17 270,503 4,598,551 283,000 45 97.11%BUNG 127 39 39 263,594 10,280,148 275,000 61 95.12%BUNGH 2 1 0 - - - 0 0.00%SPLT2 6 0 1 305,000 305,000 305,000 31 87.42%SPLT3 4 2 4 223,438 893,750 227,450 60 96.66%SPLT4 57 19 13 289,115 3,758,500 289,000 56 94.89%ST1.5 2 0 0 - - - 0 0.00%ST2 187 48 50 301,299 15,064,950 296,900 50 96.54%ST3 0 0 1 359,900 359,900 359,900 159 100.00%
SW
BK-SP 1 2 3 526,667 1,580,000 640,000 38 96.99%BLEVL 20 3 12 382,372 4,588,460 330,000 66 97.53%BUNG 161 43 51 435,802 22,225,900 390,000 53 96.01%BUNGH 4 3 3 475,000 1,425,000 457,000 77 96.30%SPLT2 31 11 11 572,150 6,293,650 481,750 49 94.61%SPLT3 5 1 3 583,833 1,751,500 412,500 58 94.17%SPLT4 44 11 11 396,136 4,357,500 358,000 68 94.44%SPLT5 8 3 3 651,667 1,955,000 525,000 67 95.28%ST1.5 9 0 4 509,375 2,037,500 370,000 99 95.48%ST2 426 119 105 611,515 64,209,059 482,000 67 96.35%ST2.5 2 0 1 1,230,000 1,230,000 1,230,000 142 94.98%ST3 23 5 2 963,750 1,927,500 850,000 112 91.83%VILLA 3 2 2 521,250 1,042,500 380,500 49 96.62%
SE
BK-SP 3 1 2 309,000 618,000 285,000 51 95.90%BLEVL 19 4 8 350,688 2,805,500 310,000 43 96.71%BUNG 103 37 20 421,525 8,430,500 360,000 57 95.55%BUNGH 1 0 0 - - - 0 0.00%SPLT2 26 7 11 446,036 4,906,400 371,500 51 96.07%SPLT3 4 3 3 346,633 1,039,900 355,000 46 96.04%SPLT4 23 8 6 327,167 1,963,000 318,000 46 96.71%SPLT5 5 0 1 360,000 360,000 360,000 32 97.32%ST1.5 1 0 0 - - - 0 0.00%ST2 329 72 92 399,336 36,738,923 379,800 61 97.44%ST2.5 1 0 1 580,000 580,000 580,000 106 95.55%
NOTE: The above sales totals and median prices are for detached homes only.These figures do not include:
Residential Attached, Duplex Side by Side, Duplex Up and Down, Townhouse, or Vacant Lot.
CALGARY METRO
CALGARY REAL ESTATE BOARD
SINGLE FAMILY BY STYLE
DECEMBER 2010
5 of 10

8/8/2019 CREB December 2010 Real Estate Statistics
http://slidepdf.com/reader/full/creb-december-2010-real-estate-statistics 6/10
Style Inventory
Listings
Added Sales Avg Price Total Sales Median Price Avg DOM S$/L$
NW
APART 214 39 30 239,442 7,183,250 220,000 70 95.55%APRTM 6 0 0 - - - 0 0.00%
BK-SP 1 1 1 102,000 102,000 102,000 59 85.71%
BLEVL 8 3 2 250,000 500,000 235,000 46 94.38%
BUNG 21 6 9 398,833 3,589,500 395,000 64 96.39%
LOFT 2 0 0 - - - 0 0.00%
PENTH 1 0 0 - - - 0 0.00%
SPLT2 1 1 0 - - - 0 0.00%
SPLT4 7 0 2 301,250 602,500 280,000 58 95.65%
SPLT5 4 1 3 325,000 975,000 300,000 57 96.65%
ST2 105 25 24 306,475 7,355,400 262,500 59 96.46%
ST2.5 2 2 1 557,000 557,000 557,000 41 98.60%
ST3 5 2 1 364,000 364,000 364,000 28 98.40%
VILLA 5 2 1 428,000 428,000 428,000 13 95.13%
NE APART 41 11 5 172,780 863,900 173,000 39 94.83%
BLEVL 6 1 0 - - - 0 0.00%
BUNG 11 2 0 - - - 0 0.00%
SPLT2 1 0 0 - - - 0 0.00%
SPLT4 3 0 2 217,500 435,000 200,000 83 93.59%
ST2 65 18 11 192,469 2,117,160 198,500 49 95.40%
ST3 3 0 0 - - - 0 0.00%
VILLA 3 0 1 300,000 300,000 300,000 63 92.34%
SW
APART 508 143 138 279,684 38,596,351 245,000 62 96.11%
APRTM 24 3 2 368,000 736,000 212,000 55 94.99%
BK-SP 2 0 0 - - - 0 0.00%
BLEVL 8 3 2 177,500 355,000 170,000 60 94.72%
BUNG 23 8 4 272,750 1,091,000 283,000 59 93.60%
BUNGS 1 0 0 - - - 0 0.00%
LOFT 9 3 3 241,667 725,000 210,000 80 93.69%
PENTH 12 1 1 315,000 315,000 315,000 63 95.48%
SPLT2 2 0 1 288,750 288,750 288,750 97 96.41%
SPLT3 0 0 1 360,000 360,000 360,000 65 94.76%
SPLT4 16 4 3 292,833 878,500 290,000 54 97.65%
SPLT5 2 0 2 426,000 852,000 297,000 35 98.51%
ST2 116 31 30 304,394 9,131,810 290,000 60 96.47%
ST2.5 2 1 1 315,000 315,000 315,000 30 95.45%
ST3 35 11 2 464,500 929,000 370,000 74 94.24%
VILLA 11 1 0 - - - 0 0.00%
SE
APART 74 28 16 223,400 3,574,400 213,000 59 94.88%APRTM 0 0 1 565,000 565,000 565,000 230 98.45%
BLEVL 2 0 0 - - - 0 0.00%
BUNG 9 3 2 318,500 637,000 282,000 84 96.54%
BUNGH 1 0 0 - - - 0 0.00%
PENTH 1 1 0 - - - 0 0.00%
SPLT2 2 1 1 672,000 672,000 672,000 63 96.14%
SPLT4 4 1 0 - - - 0 0.00%
ST2 40 12 15 327,078 4,906,169 287,386 57 96.27%
ST3 2 0 0 - - - 0 0.00%
VILLA 2 0 0 - - - 0 0.00%
CALGARY REAL ESTATE BOARD
CALGARY METRO
CONDO BY STYLE
DECEMBER 2010
6 of 10

8/8/2019 CREB December 2010 Real Estate Statistics
http://slidepdf.com/reader/full/creb-december-2010-real-estate-statistics 7/10
Type
Sold or
Leased
Sold or
Leased
Avg Price or
Lse / M2
Avg DOM Total Sales SP / LP
BWP L 1 8.61 28
IND L 13 9.41 103
OFC L 19 13.91 105
RET L 6 19 115
AGR S 24 1,872,188 114 44,932,500 83.75%
BUS S 78 86,426 110 6,741,208 81.80%
BWP S 17 619,353 168 10,529,000 88.69%
IND S 48 498,203 102 23,913,763 92.63%
LAN S 35 1,129,709 158 39,539,800 90.90%MFC S 17 869,118 79 14,775,000 97.14%
OFC S 22 554,650 116 12,202,290 88.74%
RET S 23 489,062 81 11,248,435 88.95%
TypeSold orLeased
Sold orLeased
Avg Price orLse / M
2Avg DOM Total Sales SP / LP
BWP L 1 8.611 28
IND L 13 9.4051 103
OFC L 19 13.906894 105
RET L 6 19 115
AGR S 24 1,872,188 114 44,932,500 83.75%
BUS S 78 86,426 110 6,741,208 81.80%
BWP S 17 619,353 168 10,529,000 0.886854
IND S 48 498,203 102 23,913,763 0.926317
LAN S 35 1,129,709 158 39,539,800 90.90%MFC S 17 869,118 79 14,775,000 97.14%
OFC S 22 554,650 116 12,202,290 88.74%
RET S 23 489,062 81 11,248,435 88.95%
COMMERCIAL SUMMARY
CALGARY REAL ESTATE BOARD
Year to Date December 31, 2009
Year to Date December 31, 2010
7 of 10

8/8/2019 CREB December 2010 Real Estate Statistics
http://slidepdf.com/reader/full/creb-december-2010-real-estate-statistics 8/10
CALGARY REAL ESTATE BOARD
1428 14471988
2535 24482239
1902 1683 1628 1673 1523 1496 1289
6006
6838
8154
10003
11725
1298913459
12865
11928
11349
10473
9439
7189
402,055
395,435
399,661420,693 405,850
433,030
433,248
416,064
395,933410,708
403,679411,224
389,912
360,000352,000
352,000 375,000364,500
375,000 370,000362,000
350,000
355,000 359,000 360,000
344,000
$0
$50,000
$100,000
$150,000
$200,000
$250,000
$300,000
$350,000
$400,000
$450,000
$500,000
0
2000
4000
6000
8000
10000
12000
14000
16000
18000
20000
22000
Dec-09 Jan-10 Feb-10 Mar-10 Apr-10 May-10 Jun-10 Jul-10 Aug-10 Sep-10 Oct-10 Nov-10 Dec-10
A v e r a g e / M e d i a n S a l e s P r i c e
# S a l e s / I n v e n t o r y
TOTAL MLS®
DECEMBER 2010
Sales
Inventory
Avg Sale Price
Median Sale Price
8 of 10

8/8/2019 CREB December 2010 Real Estate Statistics
http://slidepdf.com/reader/full/creb-december-2010-real-estate-statistics 9/10
CALGARY REAL ESTATE BOARD
4
6
8
10
12
ABSORPTION RATE
TOTAL MLS® DECEMBER 2010
0
2
Dec‐07 Feb‐08 Apr‐08 Jun‐08 Aug‐08 Oct‐08 Dec‐08 Feb‐09 Apr‐09 Jun‐09 Aug‐09 Oct‐09 Dec‐09 Feb‐10 Apr‐10 Jun‐10 Aug‐10 Oct‐10 Dec‐10
Balanced Market
CALGARY REAL ESTATE BOARD
6,000
8,000
10,000
12,000
14,000
16,000
TOTAL MLS®
DECEMBER 2010
Inventory Sales
0
2,000
,
Dec‐07 Feb‐08 Apr‐08 Jun‐08 Aug‐08 Oct‐08 Dec‐08 Feb‐09 Apr‐09 Jun‐09 Aug‐09 Oct‐09 Dec‐09 Feb‐10 Apr‐10 Jun‐10 Aug‐10 Oct‐10 Dec‐10
9 of 10

8/8/2019 CREB December 2010 Real Estate Statistics
http://slidepdf.com/reader/full/creb-december-2010-real-estate-statistics 10/10
CALGARY REAL ESTATE BOARD
2,000
3,000
4,000
5,000
6,000
7,000
TOTAL MLS®
DECEMBER 2010
New Li st in gs S al es
0
1,000
Dec‐07 Feb‐08 Apr‐08 Jun‐08 Aug‐08 Oct‐08 Dec‐08 Feb‐09 Apr‐09 Jun‐09 Aug‐09 Oct‐09 Dec‐09 Feb‐10 Apr‐10 Jun‐10 Aug‐10 Oct‐10 Dec‐10
CALGARY REAL ESTATE BOARD
8,000
10,000
12,000
14,000
16,000
18,000
20,000
6,0067,189
TOTAL MLS® INVENTORY
AS
OF
DECEMBER MONTH END
0
2,000
4,000
,
2009 2010
10 of 10