creation to value realisation our 2020 vision/media/files/g/green-dragon-gas/...creation to value...
TRANSCRIPT

Green Dragon Gas
Creation to Value Realisation
Our 2020 Vision
Capital Markets Day
April 27, 2016
“20 Years of CBM in China” www.greendragongas.com
LSE: GDG.LN

Creation to Value Realisation: Our 2020 Vision
Disclaimer
This presentation does not constitute an invitation to underwrite, subscribe for, or otherwise acquire or dispose of any shares of Green
Dragon Gas Ltd. (the “Company”) in any jurisdiction. The Company’s shares have not been and will not be registered under the US
Securities Act of 1933 (the “Securities Act”) and may not be offered or sold within the United States absent registration under the
Securities Act or an exemption from registration.
The information contained in this presentation is given in good faith but no representation or warranty is made in relation to the accuracy
or completeness of the information, or any oral information provided in connection therewith, or the data it generates and no
responsibility, obligation or liability is or will be accepted by the Company or its affiliates or advisors or by any of their respective officers,
employees or agents in relation to it.
This presentation contains certain forward looking statements with respect to the financial condition, results, operations and businesses
of the Company. The statements and forecasts involve risk and uncertainty because they relate to events and depend on
circumstances that will occur in the future. There are a number of factors that could cause actual results or developments to differ
materially from those expressed or implied by these forward looking statements and forecasts.
Past performance is no guide to future performance and persons needing advice should consult an independent financial advisor.
This presentation and the information contained in it are confidential and should not be distributed, published or reproduced, in whole or
in part, or disclosed by recipients directly or indirectly to any other person.
-2-Creation to Value Realisation: Our 2020 Vision

Capital Markets Day
• Introduction………………………………Randeep S. Grewal, Chairman & CEO
“Creation to Value Realisation”
• Financials ………………………………Tim Eastmond, Chief Accounting Officer
• Operational Review & Update………..Jorg Kohnert, Chief Operating Officer
• Our Vision to 2020 …………………….Randeep S. Grewal, Chairman & CEO
• Q&A
• SCADA online
Agenda
Creation to Value Realisation: Our 2020 Vision -3-

Introduction
Creation
• Through 20 years of hard work on the shoulders of a relentless and committed workforce we have:
• Built strong acreage position• De-risked 25 Tcf of gas resources
• Develop technology with proven results
“Creation to Value Realisation”
Value Realisation
• 2020 Vision outlines the steps to realising value for our shareholders through:
• Asset appropriate funding structure and shareholder liquidity
• Upstream focused• Monetise value forward through on farmouts - NPV
-4-Creation to Value Realisation: Our 2020 Vision
Creation to Value Realisation: Our 2020 Vision
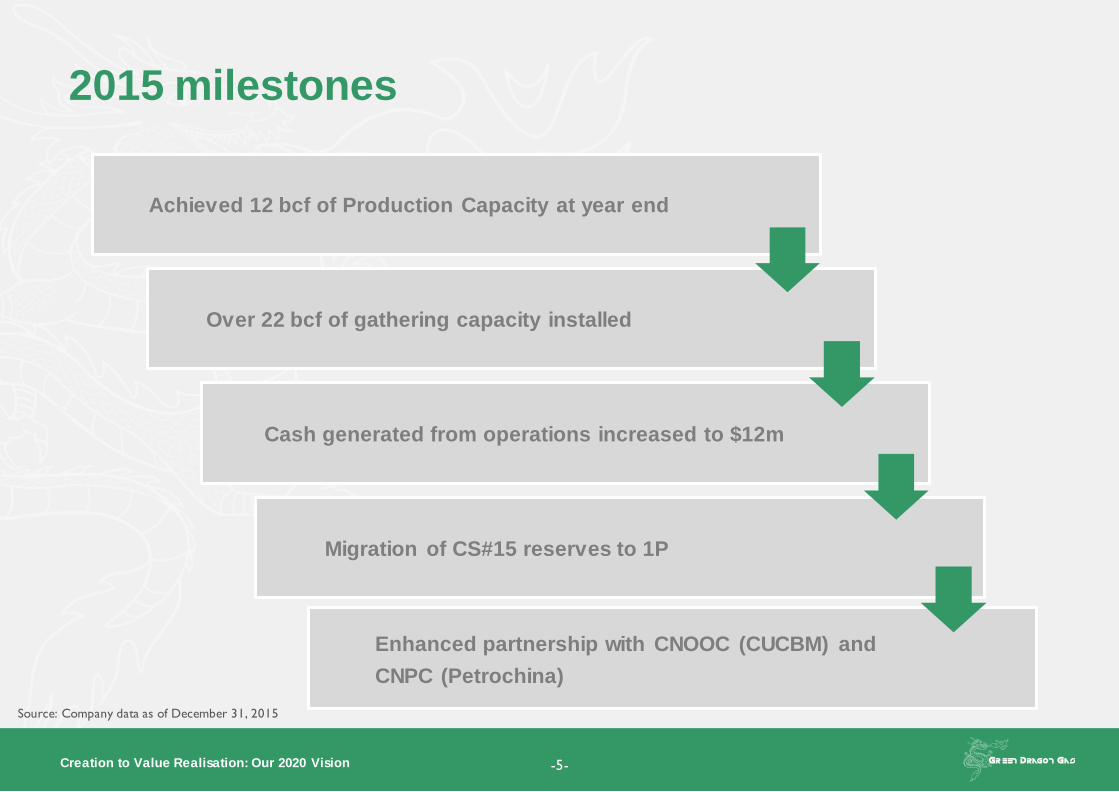
2015 milestones
Source: Company data as of December 31, 2015
Achieved 12 bcf of Production Capacity at year end
Over 22 bcf of gathering capacity installed
Cash generated from operations increased to $12m
Migration of CS#15 reserves to 1P
Enhanced partnership with CNOOC (CUCBM) and
CNPC (Petrochina)
-5-

Creation to Value Realisation: Our 2020 Vision
GDG – a snapshot
Focus on production and cash flow
• Exceeded 2015 annual production capacity target of 12 bcf
• Investment in infrastructure – converting production potential to sales
• Monetising invested capital to enhance shareholder return
• CNOOC significantly advancing infrastructure build on GSS in line with
commitments
• GCZ providing consistent cash flow following cost recovery by CNPC
2016 – A transformational year
• Build on production success through additional well connections and
infrastructure
• Coal Seam 15 to compound reserve growth and production potential
• Target 16 bcf gross annual production rate
• Significant sales and production increases from existing wells
“Connections are everything…”
-6-

Creation to Value Realisation: Our 2020 Vision
Leading China CBM independent
Large reserves base • Largest publicly listed CBM reserves base in China: 1P: 173 bcf; 2P: 549 bcf; 3P: 2,379 bcf*
• Reserves independently verified by 10 consecutive CPRs
• Six Inland Production Sharing Contracts covering 1,869,599 acres (7,566 km² )
• Ongoing migration to 1P reserves: 17% increase at year-end 2015
Integrated operations and strong partners• Strong, highly capitalised Chinese partners: CUCBM (CNOOC), CNPC and PetroChina
• Proven PSC titles: Protected by Netherlands-PRC Bilateral Investment Treaty
• Equity participation in over 2,037 wells
Centrally located among China’s gas consumers
• Multiple routes to monetise gas: GDG-owned refuelling stations, industrial customers, multiple
gas pipelines, sales via electricity
Experienced leadership and strong corporate profile
• Highly experienced operational management team with a track record in Coal Bed Methane
• High quality shareholder base: includes Aberdeen, Chandler Corp, Fidelity, Platinum Asset,
GIC, Management
8Blocks
$4.0bn2P Reserves
2,037Drilled Wells
1.9macres
*YE2015
-7-

Financials
Tim Eastmond
Chief Accounting Officer
Creation to Value Realisation: Our 2020 Vision
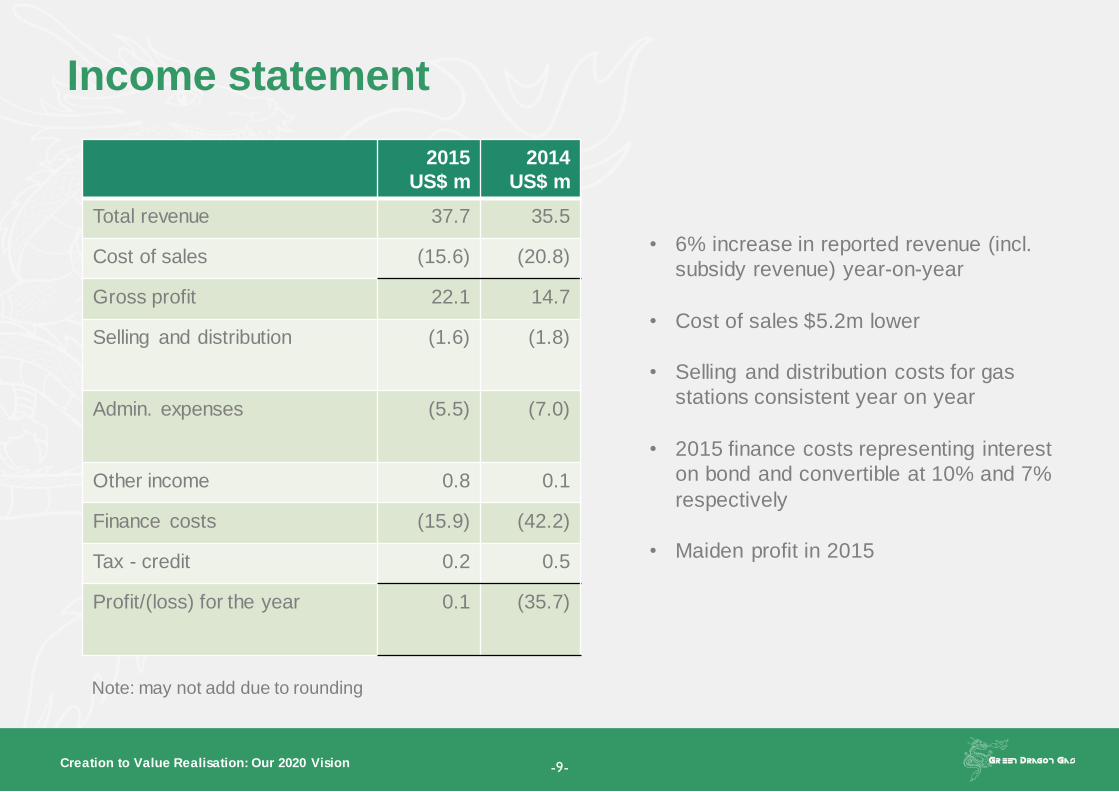
Income statement
2015
US$ m
2014
US$ m
Total revenue 37.7 35.5
Cost of sales (15.6) (20.8)
Gross profit 22.1 14.7
Selling and distribution (1.6) (1.8)
Admin. expenses (5.5) (7.0)
Other income 0.8 0.1
Finance costs (15.9) (42.2)
Tax - credit 0.2 0.5
Profit/(loss) for the year 0.1 (35.7)
• 6% increase in reported revenue (incl.
subsidy revenue) year-on-year
• Cost of sales $5.2m lower
• Selling and distribution costs for gas
stations consistent year on year
• 2015 finance costs representing interest
on bond and convertible at 10% and 7%
respectively
• Maiden profit in 2015
Note: may not add due to rounding
-9-

Creation to Value Realisation: Our 2020 Vision
Balance sheet
2015
US$ m
2014
US$ m
PP&E 272.0 157.6
Exploration assets 1,043.9 1,157.9
Other 5.2 5.6
Current assets 51.5 103.2
Total assets 1,372.6 1,424.4
Current liabilities 15.4 22.2
Convertible notes 48.3 47.2
Bonds 86.8 85.1
CUCBM provision 370.2 367.0
Deferred tax liability 154.3 163.5
Total liabilities 675.2 685.0
Net assets 697.4 739.3
• PP&E increase on GSS transition to
production and recording CUCBM
investment
• Cash on hand of $26.9m
• Total assets decreased due to
exchange on translation
• CUCBM provision increased due to
2015 expenditure to be recovered
• Net assets reduced entirely due to
exchange on translation from
functional currency
Note: may not add due to rounding
-10-

Creation to Value Realisation: Our 2020 Vision
Cash flow
2015
US$ m
2014
US$ m
Operations
Cash from ops 20.1 5.4
Cash after working cap
and tax
12.4 0.6
Investing
Expln. activities (42.3) (39.8)
Other (5.2) (53.8)
Total investing (47.5) (93.6)
Financing (12.3) 139.0
Net inc/decrease (47.3) 46.1
Exchange (5.8) (0.7)
Closing cash (26.9) (80.0)
• Cash from operations increases
to $12.4m
• Operating cash includes initial
receipts from GCZ following cost
recovery by CNPC
• Increases investment in
exploration and production assets
• 2014 investing includes one-off
Conoco settlement of $40.0m
• Financing cash flow in 2015
represents interest paid on bonds
entered on 2014
• Financing inflow in 2014 due to
new bonds
Note: may not add due to rounding
-11-

Creation to Value Realisation: Our 2020 Vision -12-
Inflection Point
-10,000
-5,000
0
5,000
10,000
15,000
1H 12 2H 12 1H 13 2H 13 1H 14 2H 14 1H 15 2H 15
Profit from Operations (US$'000)

Creation to Value Realisation: Our 2020 Vision
-
5.0
10.0
15.0
20.0
25.0
30.0
35.0
40.0
2012 2013 2014 2015
Revenue, including subsidy Cash from operations
2012-2015 - Strong underlying revenue
and cash performance
• Consistent revenue growth and
improving cash performance
year-on-year
• Cash from operations at $12.4m
• Further production and
infrastructure enhancements to
drive cash flow in 2016
-13-
Note: Normalised to take into account one-off events

Creation to Value Realisation: Our 2020 Vision
Reserves
case
2016
Capex
2017
Capex
2018
Capex
Total
capex
NPV 10
US $ m
1P 74.6 39.9 Nil 114.5 1,227.2
2P 178.0 171.9 2.8 358.8 4,022.0
Unlocking value – discretionary capex investment
-14-
• Significant value in reserves base
• Target RBL funding on approval of ODP for development capital
• Continuing to pursue farmout opportunities in exploration areas
Source: NSAI 2015 independent reserves report

Creation to Value Realisation: Our 2020 Vision
Track record of delivering value through investment
0 100 200 300 400 500 600
2015
2014
2013
2012
bcf2P 1P
86%
6%3%5%
2P reserves distribution
GSS
GCZ
GSN
GFC
• GDG has consistently provided reserves
growth year on year through investment
• Further investment in 2016 and 2017 unlock
significant additional NPV 10 value
• Capex for NPV 10 case is modest at $114.5m
• Moderate additional investment transforms
the business – moving to self-sustaining from
operations
• Potential in multiple blocks
• 86% of 2P reserves from 5% of land bank –
significant 2P growth potential
Annual Audited Reserve values (bcf)
2P Reserves Distribution (%)
-15-

Creation to Value Realisation: Our 2020 Vision -16-
Long term value creation
What Next? - 1P Development Plan

Creation to Value Realisation: Our 2020 Vision
ODP Process
-17-
Weeks 1 2 3 4 5 6 7 8 9 10 11 12 13 14 15 …… 26
ODP Application Letter (5 Copies) 7d
Economical Model compile (Waiting for SA) 35d (for finalizing SA)14d (complete
the model)
Finalize Main ODP Draft Waiting for Economic Model 7d
Specialists Review Main ODP Draft 7d
Revise ODP Draft Base on Specialists Suggestions 7d
Submit ODP to CNOOC Investment Committee 28d
Environmental impact assessment 49d
Energy Conservation Review 14d
Financial statement and capital credit certificate 21d
Resolution of Board of Directors for Additional Share 21d
Submit Main ODP Report to NDRC for Approval 94d

Operational Review & Update
Jorg Kohnert
President and Chief Operating Officer

Creation to Value Realisation: Our 2020 Vision
Corporate Social Responsibility
Commitment to the environment
• Zero use of harmful chemicals
• Own gas to generate power for operations
• Clean water as a by-product of production for irrigation or consumption
• Use of biodegradable drilling mud
• No recorded environmental incidents
-19-
Commitment to the community
• Drilling of water wells for local villages
• Maintenance of local infrastructure
Commitment to our people
• Zero lost time incidents in 2015
• In depth HSE policy and continuous training
• Ongoing commitment to safety

Creation to Value Realisation: Our 2020 Vision
Upstream asset portfolio: 6 PSCs over 8 Blocks
Xinjiang
Tibet
Qinghai
Inner Mongolia
Heilongjiang
Jilin
Liaoning
Beijing
Hebei
ShandongNingxia
Gansu
Shanxi
Shaanxi
Jiangsu
HubeiShanghai
Zhejiang
Fujian
Jiangxi
Guizhou
Sichuan
YunnanGuangxi Guangdong
Hong Kong
Anhui
Hunan
Chongqing
Tianjin
Qinyuan PSC
(GQY PSC)
3,665km2
Baotian-
Qingshan
PSC (GGZ
PSC) 947km2
Fengcheng PSC
(GFC PSC)
1,541km2
Shizhuang South
PSC (GSS PSC)
388km2
Shizhuang
North PSC
(GSN PSC)
375km2
Chengzhuang
Block (GCZ
Block) 67km2
Existing main gas pipelines
CNG mother stations
Group CBM blocks
Capital of province
Henan
Panxie East PSC
(GPX PSC)
584km2
P Production
D Development / Pilot stage
EA Exploration & Appraisal
P
P
D
EA
EA
EA
EA
Both included under Shizhuang South PSC
GSS
GDG interest: 60%
Partner: CNOOC
Operator: GDG
1P/2P/3P: 153/473/1,379 bcf
GCZ
GDG interest: 47%
Partner: PetroChina
Operator: PetroChina
1P/2P/3P: 15/31/52 bcf
GSN
GDG interest: 50%
Partner: CNOOC
Operator: CNOOC
1P/2P/3P: 5/18/721 bcf
GQY (A)
GDG interest: 10%
Partner: CNOOC
Operator: CNOOC
1P/2P/3P: N/A
GQY (B)
GDG interest: 60%
Partner: CNOOC
Operator: GDG
2C: 17 bcf
GFC
GDG interest: 49%
Partner: CNOOC
Operator: GDG
1P/2P/3P: N/A /26/228 bcf
GPX
GDG interest: 60%
Partner: CNOOC
Operator: GDG
Best Prospective: 16 bcf
GGZ
GDG interest: 60%
Partner: PetroChina
Operator: GDG
Best Prospective: 416 bcf* Total wells is inclusive of non operated wellsReserves by Netherland, Sewell & Associates, Inc as of December 31, 2015
EA
D
-20-

Creation to Value Realisation: Our 2020 Vision -21-
2015 Operational Statistics
Exploration and Production
• GDG operated 322 wells at year-end
• 13 LiFaBriC wells drilled and 27 connected to sales infrastructure in 2015
• Total of 46 LiFaBric wells selling in GSS at year end
• 2015 gross production of 10.3bcf and an exit capacity of 12.12 bcf per year
Sales Gas Volumes
• Total gross sales for 2015 of 3.7 bcf
• 1.8 bcf of PNG sales in GCZ
• 1.1 bcf of PNG sales in GSS
• 0.7 bcf of CNG sales
• 0.17 bcf of Gas to Power sales
Source: Company data as of December 31, 2015

Creation to Value Realisation: Our 2020 Vision
• 25 bcf, 40 bcf and 694 bcf of 1P, 2P and 3P
reserves booked respectively
• 1P and 2P NPV grew by US$197m and
US$850m respectively
• 132 bcf, 276 bcf and -244 bcf of 1P, 2P and
3P reserves booked
• 1P, 2P and 3P NPV grew by US$977m,
US$2.5bn and US$877m respectively
• 900 bcf of 1P production
• NPV value of US$8bn
• Migration of exploration block into 1P
• 1P capex of US$1bn
Reserve Progression
2006-2010
2011-2015
2016-2020
-22-
2010 reserves (GSS Example)
CS#3 CS#15
CS#3 CS#15
2015 reserves (GSS Example)
2020 reserves (GSS Example)
CS#3 CS#15

Creation to Value Realisation: Our 2020 Vision
Infrastructure – GDG Operated GSS Block
-23-

Creation to Value Realisation: Our 2020 Vision
Recent Achievements – Pipeline Compression
-24-

Creation to Value Realisation: Our 2020 Vision
Recent Achievements – Example Circuit 3
• Prior to optimisation, the circuit contained 4
compressors with compression capacity of
300kW
• 6 compressors were brought online in January
2016 to bring compression capacity to 570kW
• Wells on circuit were bypassed to optimise flow
• Sale volumes increased from 1.04MMcf to
1.68MMcf representing a 60% volume increase
circuit 3 production (mcf/d)
-25-

Creation to Value Realisation: Our 2020 Vision
Real Time Operations Centre
Real time data for making real time decisions
• Monitoring of the entire production, gathering and downstream sales process
• Efficient and effective allocation of resources
• Advance warning of problems and ability to act instantaneously
-26-

Creation to Value Realisation: Our 2020 Vision
Real Time Operations Control Centre
• OCC can monitor and generate reports throughout
the entire operation
• Generate reports for data analysis and long term
planning
Sales
Production
-27-
Creation to Value Realisation: Our 2020 Vision
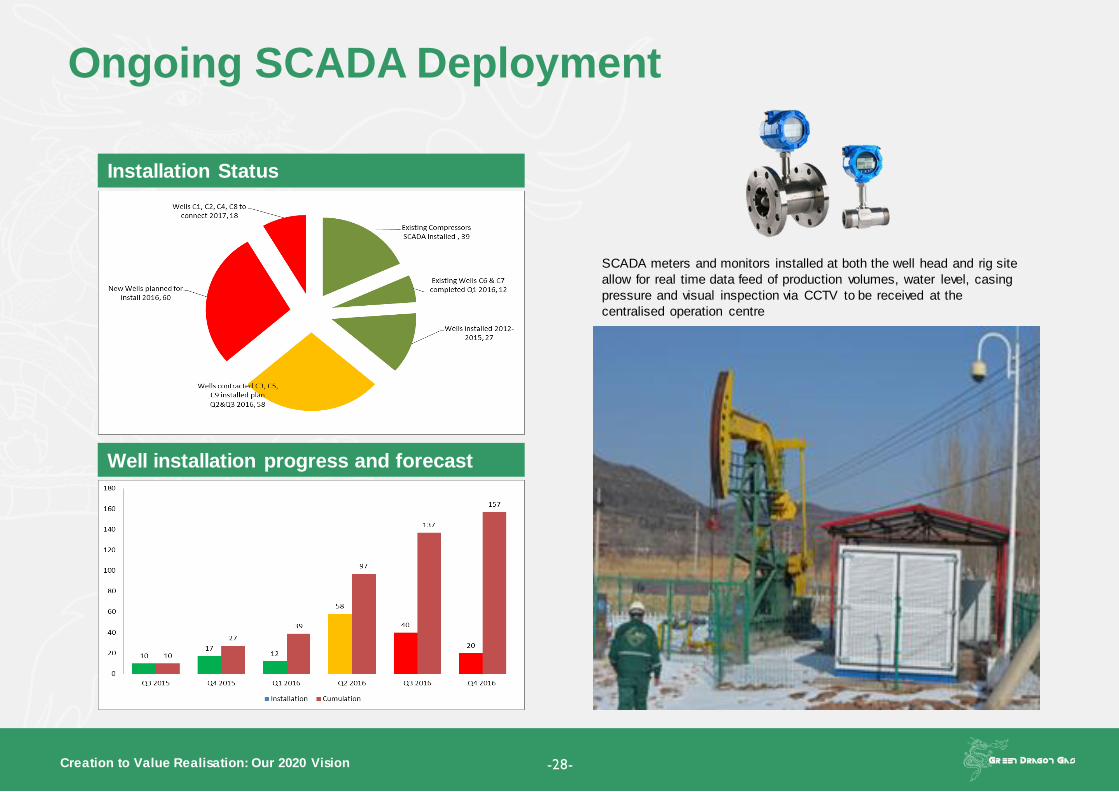
Ongoing SCADA Deployment
Well installation progress and forecast
Installation Status
SCADA meters and monitors installed at both the well head and rig site
allow for real time data feed of production volumes, water level, casing
pressure and visual inspection via CCTV to be received at the
centralised operation centre
-28-
Creation to Value Realisation: Our 2020 Vision
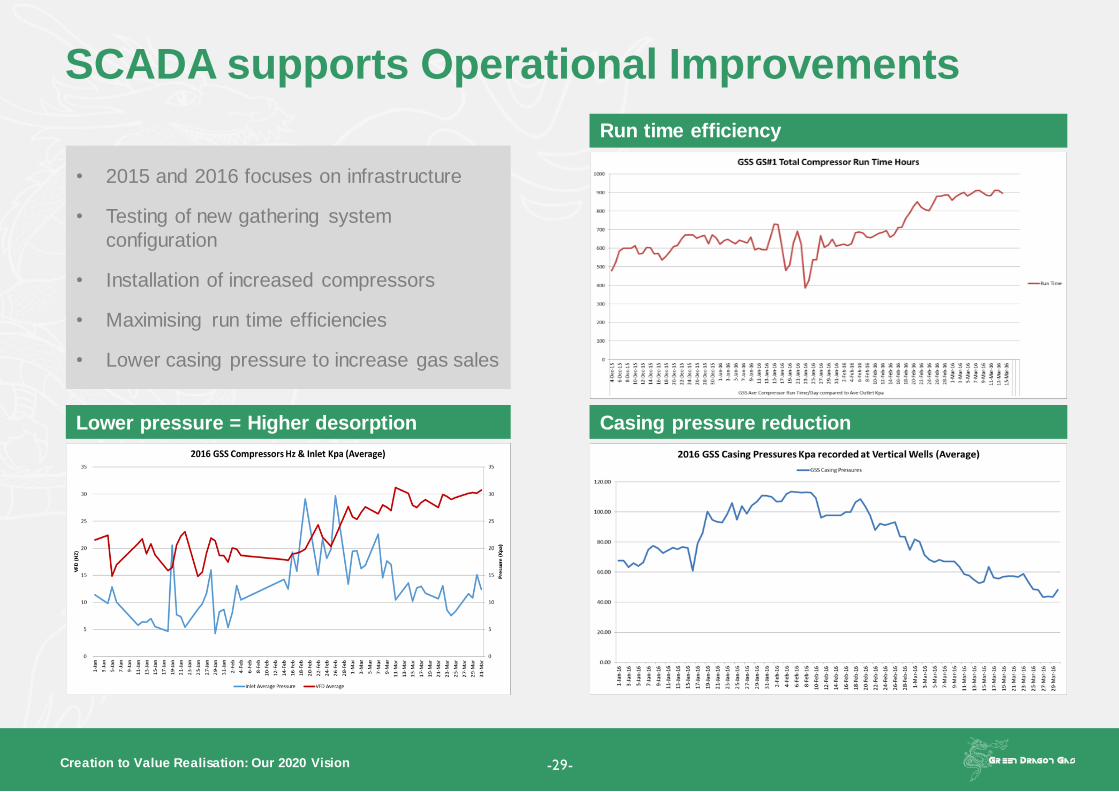
SCADA supports Operational Improvements
-29-
Lower pressure = Higher desorption Casing pressure reduction
• 2015 and 2016 focuses on infrastructure
• Testing of new gathering system
configuration
• Installation of increased compressors
• Maximising run time efficiencies
• Lower casing pressure to increase gas sales
Run time efficiency

Creation to Value Realisation: Our 2020 Vision
What next? – Screw Compressor
-30-
• Lower gas discharge temperature due to more efficient
cooling system
• Vacuum at well head
• Capable of operating with negative suction pressures and
discharges > 1.5 MPa
• Basic difference in wellhead vs centralised gathering
• Well-head located compressor eliminates pressure
drop in the suction line to the compressor
• Locating compressor at / near the wellhead provides
the lowest possible well head pressure
• Pipeline size efficiency Moisture – Well head compression
allows efficient removal of moisture from the gas stream

Creation to Value Realisation: Our 2020 Vision
What next? – Screw Compressor Initial Results
Completed the first test run of Greka's own Screw
Compressor on April 22, 2016.
Screw Compressor internal design
-31-
Well
GSS-188
W/H
pressure
Inlet
Pressure Flow rate
Before 145KPa 9KPa 152mcf/d
After 9KPa -35Kpa 225mcf/d

Creation to Value Realisation: Our 2020 Vision
What next? – Expanding and optimising Infrastructure
• Annual processing capacity of 22.81 bcf
• Shizhuang and Shizhuang #1 Stns complete on time
• CNOOC constructed pipe network >90% complete
• Ongoing tie-in wells to infrastructure
-32-
CNOOC Trunk Line (Existing)
CNOOC Branch lines (Existing)
CNOOC Branch lines (Construction)
GDG Trunk line
Greka IPF station
CNOOC Gathering Stations
Gathering Stations expected in 2017
Existing Gathering Stations
Station bcf Status
Greka IPF 6.5 Online
Guixian station 3.6 Online
Shizhuang station 1.4 Online
Shizhuang south #1 11.2 Online
Online & operating - subtotal 22.7
Shizhuang south #2 10.4 Ongoing
Shizhuang south #3 10.1 Ongoing
Shizhuang south #4 10.2 Ongoing
Total 53.4

Creation to Value Realisation: Our 2020 Vision -33-
Coal Seam 3 and 15 floor contour map in Zaoyuan area
What Next? – GSS – Reserve Migration for CS#15
Source: Company data
• Well defined coal seams #3 and #15
• 1st LFB drilled in CS15 encountered a 4m thick
coal
• Vertical intersection avoided penetration to
adjacent LST
• Well following standard dewatering progress
• Exhibiting casing pressure – a sign of gas
desorption
• GSS Block,CS15 has a GIP of 1.2 Tcf
• Total drilled and logged 80 wells in coal seam
CS15
• Distance between #3 & #15CS is 89-120m, Ave
106 m
Coal NO.Vitrinite
ReflectanceDepth Thickness Gas Content PERM Saturaton
(%) (m) cm³/g(daf) (md) (%)
3# 2.96 574.08 6.23 12.21 0.76 50.00
15# 3.01 698.67 4.53 17.51 0.22 61.00

Exploration
Jorg Kohnert
President and Chief Operating Officer

Creation to Value Realisation: Our 2020 Vision
Achievements• 7 producing wells
• 3 workovers completed
• GGZ Static Model 40% completed
Current Activities• 3rd Party data acquisition
• Seismic data interpretation and re-processing
• Stratigraphic correlations
Deliverables• 3D Static Model
• Preparing data and reports for CRR
• ODP
GGZ Block 2015
Contour Map
-35-

Creation to Value Realisation: Our 2020 Vision
• Exploration drilling: 27 wells (incl. 6 Slim holes, 6 directional wells)
• LiFaBriC drilling: 3 wells (incl. 2 re-drill)
• Fractured 3 wells / 9 layers
• 6 wells produced (peak of 900 m3/d)
• 1 G&G Study
• Drilled 8 vertical exploration wells
• Fractured 6 wells across 10 layers
BQ2, BQ1-D1, BQ1-D2, BQ18, BQ20, BQ17
• Producing 6 wells to test commerciality
• Preparation of CRR
BQ2, BQ1-D1, BQ1-D2, BQ18, BQ20, ACE-ZY04-3
• CRR submitted and reserves certified
• ODP submitted and approved
• Commercial production and sales
GGZ History
2006-2014
2015
2020
-36-
Wells drilled in 2015

Creation to Value Realisation: Our 2020 Vision
12 12 12 12 11 11 11
12 12 12 12 11 11 11
12 12 12 12 12 12 12 12 11 11 11
12 12 12 12 12 12 12 12 11 11 11
12 12 12 12 12 12 12 12 11 11 11
12 12 12 12 12 12 12 12 12 11 11
12 12 12 12 12 12 12 12 12 12 12 12 12 12 12 11 11
12 12 12 12 12 12 12 12 12 12 12 12 12 12 12 11 11
12 12 12 12 12 12 12 12 12 12 12 12 12 12 11 11 11
11 12 12 12 12 12 12 12 12 12 12 13 12 12 12 11 11 12
11 12 12 12 12 12 12 12 12 12 13 12 12 12 12 12
12 12 12 12 12 12 12 12 12 12 13 12 12 11 12 12
12 12 12 12 12 12 12 12 12 12 13 13 13 13 12 12 12 12 12 12
12 12 12 12 12 12 12 12 12 13 13 13 12 12 12 12 12 12 12 12 12 12 12 12 12 12 11
12 12 12 12 12 12 12 12 12 13 13 12 12 12 12 12 12 12 12 12 12 12 12 12 12 12 11
11 11 11 11 12 12 12 12 12 12 12 12 12 12 12 12 12 12 13 12 12 12 12 12 12 12 12 12 12 12 12 12 12 12 12 12 11
11 11 11 11 12 12 12 12 12 12 12 12 12 12 13 13 13 13 12 12 12 12 12 12 12 12 12 12 12 12 12 12 12 12 12 12 12
12 12 12 12 12 12 12 12 12 12 12 12 12 13 12 12 12 12 12 12 12 12 12 12 12 12 12 12 12 12 12 12 12 12
11 12 12 12 12 12 12 12 12 12 12 12 13 12 12 12 12 12 12 12 12 12 12 12 12 12 12 12 12 12 12 12 12 12 12
11 12 12 12 12 12 12 12 12 12 12 12 12 12 12 12 12 12 12 12 12 12 12 12 12 12 12 12 12 12 12 12 12 12 12 12 12
11 12 12 12 12 12 12 12 12 12 12 12 12 12 13 12 12 12 12 12 12 12 12 12 12 12 12 12 12 12 12 12 12 12 12 12 12 12 11
12 12 12 12 12 12 12 12 12 12 12 12 12 12 12 12 12 12 12 12 12 12 12 12 12 12 12 12 12 12 12 12 12 12 12 12 12 12 12 11 11
12 12 12 12 12 12 12 12 12 12 12 12 12 12 12 12 12 12 12 13 12 12 12 12 12 12 12 12 12 12 12 12 12 12 12 12 12 12 11 11
12 12 12 12 12 12 12 12 12 12 12 12 12 12 12 12 12 12 12 12 12 12 12 12 12 12 12 12 12 12 12 12 12 12 12 12 12 12 12
12 12 12 12 12 12 12 12 12 12 12 12 12 12 12 12 12 12 12 12 12 12 12 12 12 12 12 12 12 12 12 12 12 12 12 12 12 12 11 12
12 12 12 12 12 12 12 12 12 12 12 12 12 12 12 12 12 12 12 12 12 12 12 12 12 12 12 12 12 12 12 12 12 12 12 12
12 12 12 12 12 12 12 12 12 12 12 12 12 12 12 12 12 12 12 12 12 12 12 12 12 12 12 12 12 12 12 12 12 12 11 11
12 12 12 12 12 12 12 12 12 12 12 12 12 12 12 12 12 12 12 12 12
12 12 12 12 12 12 12 12 12 12 12 12 12 12 12 12 12 12 12 12 12 12
12 12 12 12 12 12 12 12 12 12 12 12 12 12 12 12 12 12 12 12 12 12 12 12
12 12 12 12 12 12 12 12 12 12 12 12 12 12 12 12 12 12 12 12 12 12
11 12 12 12 12 12 12 12 12 12 12 12 12 12 12 12 12 12 12 12 12 12 12 12 12 12
11 11 11 12 12 12 12 12 12 12 13 12 12 12 12 12 12 12 12 12 12 12 12 12 12 12
11 12 12 12 12 12 12 12 13 13 12 12 12 12 12 12 12 12 11 11 12 12 12 12
11 12 12 12 12 12 12 12 13 12 12 12 12 12 11 11 11 11 11 11 12 12 12
11 12 12 12 12 12 12 12 12 12 12 12 11 11 11 11 11 11 11
12 12 12 12 12 12 12 12 12 11 11 11 11 11 12
12 12 12 12 13 13 13
-37-
GGZ Block – Location and Reserves
Low Estimate Prospective Resources
Best Estimate Prospective Resources
High Estimate Prospective Resources
Area: 869.9 km2NSAI (SPE-PRMS)
Net reserves/resources bcf
PRMS Low Estimate Prospective 20.4
PRMS Best Estimate Prospective 415.9
PRMS High Estimate Prospective 941.2
OGIP 4,552
Source: Netherland, Sewell & Associates, Inc as of Dec 31 2015

Creation to Value Realisation: Our 2020 Vision -38-
GGZ Block – 7 Coal Seams with high Gas Content
Coal seam 3#: 14 m3/t (494 ft3/t)
Coal seam 5#: 14.5 m3/t (512 ft3/t)
Coal seam 12#: 14 m3/t (494 ft3/t)
Coal seam 17#: 16 m3/t (565 ft3/t)
Coal seam 19#: 17 m3/t (600 ft3/t)
Coal seam 26#: 16 m3/t (565 ft3/t)
Coal seam 29#: 15 m3/t (529 ft3/t)
Coal
Seam
Depth mtvd
(Min - Max)
Thickness mtvd
Min-Max (Ave)
Gas Cont m3/t
(Min-Max/Ave)
CS#3 0 - 800 0.3-2.2 (Ave:1.2) 6.22-21.27 11.35
CS#5 50 - 850 0-2.8 (Ave: 0.6) 4.80-22.33/11.45
CS#12 100 – 900 0-2.2 (Ave: 1.4) 6.56-20.96/12.69
CS#17 140 – 1000 0-13.6 (Ave: 5.2) 8.26-23.98/14.14
CS#19 170 – 1100 0.7-12.0(Ave:6.7) 5.17-26.37/14.10
CS#26 250 – 1150 0-3.3 (Ave:1.3) 7.21-22.38/13.60
CS#29 270 - 1200 0-9.0 (Ave:2.9) 5.83-20.85/13.69

Creation to Value Realisation: Our 2020 Vision
Feb Mar Apr May Jun Jul Aug Sep Oct Nov Dec
GGZ Data Prep. & Static Modeling Data QC Static Modeling
Production eval. & Volumetrics
CRR evaluation & preparation
ODP Preparation
GQY Data Prep. & Static Modeling Data QC Static Modeling
Production eval. & Volumetrics
CRR evaluation & preparation
ODP Preparation
GFC Data Prep. & Static Modeling Data QC Static Modeling
Production eval. & Volumetrics
CRR evaluation & preparation
ODP Preparation
GPX Data Prep. & Static Modeling Data QC Static Modeling
Production eval. & Volumetrics
CRR evaluation & preparation
ODP Preparation
2016 Plan in Exploration Blocks
-39-

Our Vision to 2020
Randeep S. Grewal
Chairman and Chief Executive

Creation to Value Realisation: Our 2020 Vision
“Bringing value forward for shareholders”
Our vision to 2020
Where we are now
• Significant acreage and asset positions in China
• De-risked asset base, substantial reserve value growth
• Most lucrative gas margins globally
• Technical and commercial proof of concept established
• Stable Government and policy support
Our mission – accelerating value
• Secure asset appropriate financing
• Bring forward block development and subsequent cash
generation for shareholder value
• Deliver enhanced NPV where possible
-41-

Creation to Value Realisation: Our 2020 Vision
Funding and liquidity
-42-
• Clear focus on asset appropriate financing including reserve based lending,
divestiture, farmouts, equity/convertibles
• Roadmap to RBL
- Consistent and growing production and sales
- Significant NPV 10 base
- Development based financing for development investment
- ODP approval to unlock access to RBL
• Other shareholder value considerations
- Fixing low free float/liquidity in the shares
Creation to Value Realisation: Our 2020 Vision
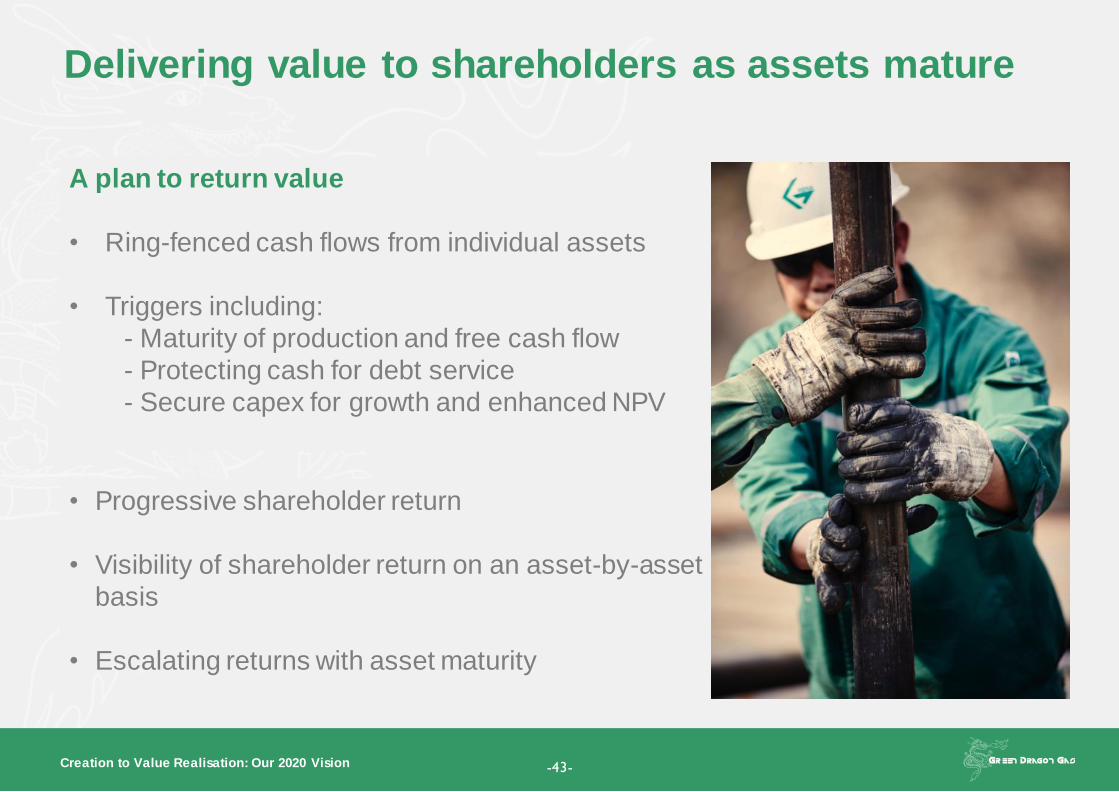
Delivering value to shareholders as assets mature
A plan to return value
• Ring-fenced cash flows from individual assets
• Triggers including:
- Maturity of production and free cash flow
- Protecting cash for debt service
- Secure capex for growth and enhanced NPV
• Progressive shareholder return
• Visibility of shareholder return on an asset-by-asset
basis
• Escalating returns with asset maturity
-43-

Creation to Value Realisation: Our 2020 Vision
A strategic review for downstream
• Corporate vision as an upstream production company
• Rationalising downstream operations
- Monetise downstream assets – reinvestment in
upstream and simplify our business model and logistics
“A pure play upstream group focused
on delivering value at the well head”
-44-

Creation to Value Realisation: Our 2020 Vision
Farm out opportunities
• Significant exploration and development position
• Proof of concept in place, R&D dollars already spent
• Strengthening our balance sheet and financial position- Accelerating development
- Realising value for shareholders on farm out
- Enhancing project economics and present value
• Bringing value forward- From sequential development to concurrent development
- Pulling production forward on multiple assets
- Enhanced shareholder NPV
- Acceleration of returns/satisfying capital requirements
- Re-rating our intrinsic value
-45-