creation of a 3r-oriented, sustainable society · creation of a 3r-oriented, sustainable society...
TRANSCRIPT


Creation of a 3R-Oriented, Sustainable Society
Others
Present Situation of “Reduce”
Legislation and Policies to Promote the Creation of a 3R-Oriented Society1. Legislative System
2. Fundamental Law for Establishing a Sound Material-Cycle Society
3. Law for Promotion of Effective Utilization of Resources
4. Waste Management Law
5. Containers and Packaging Recycling Law
6. Home Appliance Recycling Law
7. End-of-Life Vehicle Recycling Law
8. Construction Material Recycling Law
9. Food Recycling Law
10. Green Purchasing Law
11. METI Industrial Structure Council: Guidelines for Waste Treatment and Recycling
12. Governance of Waste and Recycling
13. Environmental Labels and Identification Marks
14. Design for Environment (DfE)
15. Material Flow Cost Accounting (MFCA)
16. 3R Technology Development Program
17. International Promotion of the 3Rs
1. Containers and Packaging
2. Automobiles
3. Home Electric Appliances
October is a month for promoting 3Rs
3R Awards Programs
Support system
Brochures
1. The Need for Creating a Sustainable Society
2. Current Situation for Waste in Japan
……………………………………………………………………………………… 10
……………………………… 13
…………………………………………… 16
……………………………………………………………………………… 22
…………………………………………………………… 24
……………………………………………………………………… 32
…………………………………………………………………… 36
………………………………………………………………… 39
…………………………………………………………………………………… 42
……………………………………………………………………………… 44
…………… 46
……………………………………………………………… 49
…………………………………………………… 51
………………………………………………………………………… 53
…………………………………………………………… 59
……………………………………………………………… 60
………………………………………………………………… 61
…………………………………………………………………………… 63
……………………………………………………………………………………………… 68
……………………………………………………………………………… 69
………………………………………………………………… 86
……………………………………………………………………………………… 87
…………………………………………………………………………………………… 88
………………………………………………………………………………………………… 90
…………………………………………………………2
……………………………………………………………………4
Present Situation of Reuse and Recycling1. Glass Bottles
2. Steel Cans
3. Aluminum Cans
4. PET Bottles
5. Plastics
6. Styrofoam
7. Paper
8. Automobiles and Motorcycles
9. Lead Batteries for Automobiles
10. Compact Secondary Batteries (Rechargeable Batteries)
11. Cellular Phones and Personal Handy Systems (Cell Phones)
12. Personal Computers
…………………………………………………………………………………………… 70
……………………………………………………………………………………………… 73
………………………………………………………………………………………… 74
……………………………………………………………………………………………… 75
…………………………………………………………………………………………………… 76
………………………………………………………………………………………………… 77
……………………………………………………………………………………………………… 79
………………………………………………………………………… 80
……………………………………………………………………… 82
………………………………………… 83
…………………………………… 84
………………………………………………………………………………… 85
Forward ………………………………………………………………………………………………………1
Contents
In the course of economic activities based on mass-production/consumption/disposal, Japan has been
producing an enormous amount of waste, and is currently facing various problems, such as a shortage of
final disposal sites and adverse environmental effects of inappropriate waste disposal. There are concerns
over the depletion of resources and energy for the future due to changes in the global economic status,
thus resulting in a price surge for resources such as oil and iron.
In order to overcome problems with the environment as well as with resources, it is essential to
establish a sustainable society by promoting what is called the “3Rs”: reduce waste generation, reuse parts,
and recycle used products as raw materials.
The Japanese government currently strives to actively confront environmental and resource constraints
by establishing and revising appropriate laws and guidelines. They include the Containers and Packaging
Recycling Law, Home Appliance Recycling Law, Construction Materials Recycling Law, Food Recycling
Law, End-of-Life Vehicles Recycling Law, Green Purchasing Law, Promotion of Utilization of Recycled
Resources and Waste Disposal Law. Most importantly, however, the government should seek to establish
a society in which environmentally concerned economic activities are highly appreciated through
implementation of the 3Rs of every citizen, using it to penetrate into a range of economic activities and
social engagements.
In accordance with the proposal presented in the report “Vision for an Economy of Recycling”
prepared at the Industrial Structure Council, the Ministry of Economy, Trade and Industry has been
promoting the “3R” policy in order to shift the society of mass-production/consumption/disposal to a
sustainable economic system. This handbook features an outline of the legislation concerning the creation
of a sustainable society and the trends of the 3Rs in individual fields. We hope that it will be helpful to
those who are engaged in 3R-related activities.
Forward
11

*Related to industry/manufacturing・Global waming・Acid rain・Ozone layer depletion・Marine pollution・Trans-boundary movement of hazardous waste・Residual organic pollutants
*Natural ecological environmental problems・Destruction of tropical rain forests・Extinction of waildlife species・Desertification・Pollution problems in developing countries
*Traditional pollution problems caused by industries・Air pollution・Water pollution・Soil contamination・Noise, vibration, odor・Ground settlement
*Natural ecological environmental problems・Destruction of the natural environment in Japan
*Problems related to chemical substances
*Uban and domestic environmental problems
*Enargy-saving・Enargy-saving・New energies・Alternative energies*Resource saving
Note:3Rs:Reduce, Reuse, and Recycle
*Minimization of enegy and resource utillzation
*Reduce(waste)
*Reuse(parts, products, etc.)
*Recycle(waste)
*Proper intermediate treatment(measures to reduce dioxin, heavy metal, toxic wastes)
*Minimization of final disposal volume
Global environmental problems
Regional environmentalproblems
[Note]Problems concerning waste and the 3Rs (aiming for a Sustainable Economic Systems)
Energy and resouce saving
CO2
fromincine-ration
Dioxin fromincine-ration
Enargysaving and CO2
reductionthroughthe 3Rs
Energy and resoucesaving throughthe 3Rs
(Source Clean Japan Center)
Fig. I-1a Environmental Problems Fig. I-1b Cumulative Demand against Current Reserves by 2050
In the year 2050, more than several times more metallic resources will be required than the current reserves
The metals almost exhausted by 2050: Fe,MoW,Co,Pt,Pd
The metals used twice as much as the current reserves by 2050: Mi,Mn,Li,In,Ga
The metals exceeding the reserves by 2050: Cu,Pb,Zn,Au,Ag,Sn
Cumulative demand from 2005 and 2050
Reserves base
Current reserves
Current outputs
* Reserves base: Amount of resources including those that are economically difficult to mine at present and subeconomic resources.
Source: National Institute for Materials Science
2
Creation of a 3R-Oriented, Sustainable Society
1 The Need for Creating a Sustainable Societ
In the course of economic activities based on mass-production/consumption/disposal, Japan is facing problems such as a shortage of final disposal sites and the adverse environmental effects of hazardous substances, as well as concern over the depletion of mineral resources in the future. These environmental and resource constraints are at the level in which a restriction of economic activities or reduction of the size of the economy would result.
(1) Environmental problems
In Japan, as many as 470 million tons of waste are generated every year, and the number of remaining sustainable years of final disposal sites is rapidly dwindling: 15.6 years for general waste and 7.7 years for industrial waste. Under these circumstances, it is necessary to promote measures concerning waste disposal and the 3Rs (reduce, reuse and recycling).
Furthermore, environmental problems have recently expanded, due to industrial pollution on a global level, including the long-term environmental effects of hazardous substances such as dioxin, PCB, and endocrine-disrupting chemicals, as well as global warming.
(2) Resource constraints
In the 20th century, human beings mined and consumed limited mineral resources such as oil and metal at a rapid pace. As a result, the supply of rare metals, indispensable for manufacturing high-tech products such as automobiles and electrical and electronic equipment, is increasingly at risk, along with general metal resources, which would obviously be restricted in 2050, according to an academic study.
According to the overview of Japan’s material f low, Japan utilized about 1.82 billion tons of resources in total, consuming 490 million tons of energy and discharging 580

3
million tons of waste. Most of the 750 million tons of resources accumulated in
Japan, which are utilized for roads, bridges, and buildings, will become industrial waste in due course. Meanwhile, the amount of resources that were recycled and reused was about 230 million tons and subsequently remained at a low level, accounting for about 12.5% of the total amount of resources utilized.
As outlined above, in order to achieve sustainable development in the 21st century, Japan should take measures in relation to problems concerning waste and enforce the 3Rs as its top priority. There is an urgent need to establish a new economic system that is favorable for both the environment and the economy.
More specifically, for the sustainable development of Japan, it is essential to move from the conventional economic system
that is based on mass-production/consumption/disposal and create a sustainable economic system and society, while promoting “the environmentalization of industry” (incorporating measures for environmental and resource constraints into business activities) and “industrialization of the environment” (generating market value through measures for environmental and resource constraints) through effective use of the power of the private sector.
*Source: White Paper on Environment/Sustainable Society (FY2008), Ministry of the Environment
Fig. I-2 Japan’s Material Flow (FY2006)
(Unit: Million tons)Imported products (57)
Importedresources (756)
Imports (813)
Domesticresources (778)
Input of natural resources (1,591)
Water content, etc. (290)
Input of all materials(1,819)
Exports (170)
Accumulated net increase (754)
Energy consumption and industrialprocess emissions (494)
Food consumption (91)
Fertilization (17)
Natural reduction (85)
Generation ofwaste (583)
Waste reduction (241) Final disposal (29)
Amount cyclically used (228)(Source) Ministry ofthe Environment
(Note) Water content, etc.: Water content in waste (sludge, animal manure, excrement, waste acid, and waste alkali) and input of earth and sand accompanying economic activities (sludge from the mining industry, construction industry, and water supply business, and slag from the mining industry)

4
2 Current Situation for Waste in Japan
(1) Municipal Solid Waste (MSW)
[1] Total amount of municipal solid waste discharged
The total amount of municipal solid waste discharged (MSW: waste discharged from households) in FY2008 was 48.11 million tons—enough to fill the Tokyo Dome 130 times (0.3 tons per m3) —with the per capita/day amount at 1,033g (see Fig. I-3).
The total amount of MSW discharged and the per capita/day amount discharged started to increase rapidly around FY1985. However, it has remained almost flat since FY1989,
and successively decreased from FY2000. The amount of disposal per person/day has decreased by about 13% from the peak year, FY2000.
Note: Total MSW discharge = MSW collected + MSW directly delivered + MSW treated in-house.
Source: Ministry of the Environment, Discharge and Treatment of MSW (FY2008) (April 16, 2010) (revised)
Fig. I-3 MSW Discharge
Tota
l MS
W d
isch
arge
(10
,000
tons
)
Total MSW discharge (10,000 tons) Per capita/day amount discharged (g/person/day)
Per
cap
ita/d
ay a
mou
nt d
isch
arge
d (g
/per
son/
day)
4,209
951975
1,017
4,340
4,550
4,750
4,9355,026
5,113 5,090 5,127 5,180 5,2225,291 5,310 5,361 5,370
5,483 5,468 5,420 5,4275,338
5,272
1,061
1,0981,115 1,125 1,119 1,124 1,134 1,138
1,152 1,153
1,162
1,1591,185 1,180
1,166 1,163
1,146
1,089
1,033
1,131
5,2045,082
4,811
1,116
FY1985 FY1986 FY1987 FY1988 FY1989 FY1990 FY1991 FY1992 FY1993 FY1994 FY1995 FY1996 FY1997 FY1998 FY1999 FY2000 FY2001 FY2002 FY2003 FY2004 FY2005 FY2006 FY2007 FY2008
4,500
5,000
5,500
400
900
800
700
600
500
1,000
1,100
1,200

Collected bycitizen grops 293 M t
Total dischange 4,811 M t
[5,082 M t]
Planned treatment 4,518 M t
4,777M t (100%)
In-house treatment 5 M t
[6 M t]
Direct recycling 234M t (5.2%)
264 M t (5.5%)
Intermedate treatment 4,197M t (93.0%)
4,391 M t (92.0%)
Direct final disposal 82 M t (1.8%)
118M t(2.5%)
[305 M t]
Treatment residue 922 M t (20.4%)
979M t(20.5%)
3,412M t (71.5%)
Reduced3,275 M t (72.6%)
Recycled after treatment451 M t (10.0%)
462M t (9.7%)
517M t(10.8%)
Final disposal after treatment471 M t (10.4%)
Total amount recycled 978 M t
[1,030 M t]
Total final disposal 553 M t (12.3%)
635M t(13.3%)
Fig. I-4 Flow of MSW Treatment in Japan (FY2008)
Notes: 1. The total amount of MSW treated does not correspond to the “amount of scheduled treatment” due to errors in measurement. [ ]: the amount of FY2005 2. Rate of waste reduced in treatment (%) = [(intermediate treatment) + (directly recycling)] / (total MSW treated) x 100
Source: Ministry of the Environment, Discharge and Treatment of MSW (FY2008) (April 16, 2010)
5
[2] Waste treatment
In the total amount of MSW t reated in FY2008, 41.97 million tons underwent intermediate treatment by municipalities, such as incineration, comminution and selection, while 2.34 million tons were directly delivered to recycling industries, collectively accounting for 98.2% of the total amount of MSW treated. Out of the 41.97 million tons of MSW delivered to intermediate treatment facilities, 4.51 million tons were reused after treatment. The total amount
of MSW recycled, the sum of the amount of MSW recycled through intermediate treatment, the amount of MSW directly recycled, and the amount of recyclable resources recovered by citizen groups, was 19.78 million tons. Some 0.82 million tons of MSW were delivered to direct final disposal without going through intermediate treatment (direct landfill) and 32.75 million tons were reduced through intermediate treatment (see Fig. I-4).

4,151 4,153
4,8604,928 4,972 4,911 4,934 4,966 4,990 5,044 5,057 5,111 5,119
5,209 5,196 5,145 5,1545,051
4,975
4,773
4,514
0
1,000
2,000
3,000
4,000
5,000
6,000
77.7
14.6
5.2
2.5
77.5
14.5
5.5
2.5
79.2
13.8
5.2
1.8
4,900
37.1
2.5
60.4
26.4
3.0
70.6
21.1
5.8
73.1
19.9
6.7
73.4
17.0
10.2
72.7
14.9
10.7
74.3
14.4
11.3
74.3
12.5
12.0
75.5
11.5
12.3
76.3
10.3
12.8
76.9
8.6
13.4
78.0
7.5
3.1
11.5
77.9
6.7
3.6
11.6
78.1
5.9
4.3
12.4
77.4
5.3
4.4
12.1
78.2
4.3
4.5
12.8
78.4
3.6
4.4
13.9
78.1
3.5
4.6
14.4
77.5
2.9
5.2
14.6
77.3
Amount of MSW treated (thousand tons) Direct incineration Recycling through intermediate treatment Direct recycling Direct final disposal
Figures in parentheses are percentages
1980 1985 1989 1990 1991 1992 1993 1994 1995 1996 1997 1998 1999 2000 2001 2002 2003 2004 2005 2006 2007 2008
6
[3] Recycling
In FY2008, 2.34 million tons of MSW were separately collected and directly recycled by municipalities, 4.51 million tons were recycled through intermediate treatment, and 2.93 million tons were collected by citizen groups for recycling. The total amount of MSW recycled, aggregating all of the above, was 9.78 million tons (see Fig. I-4). The recycling rate increased yearly to 20.3%, about four times higher than in FY1989 (4.5%) (see Fig. I-6). However, recycling has yet to be promoted sufficiently for some kinds of MSW, such as kitchen garbage.
Fig. I-5 Waste Treatment Methods
4
5
6
7
8
9
10
11
12
13
14
15
16
17
18
20
19
4.5
5.3
6.1
7.3
8.0
9.1
9.810.3
11.0
12.1
13.1
14.3
15.0
15.9
16.8
17.6
19.0
20.3 20.3
19.6
21(%)
1989 1990 1991 1992 1993 1994 1995 1996 1997 1998 1999 2000 2001 2002 2003 2004 2005 2006 2007 2008 (FY)
Notes: 1. Direct recycling is a category introduced in 1998, and refers to the amount of MSW that is directly delivered to recycling industries without going through recycling facilities.
2. Until FY1997, the amount of “direct recycling” was included in the amount of “recycling through intermediate treatment.”
Source: Ministry of the Environment, Discharge and Treatment of MSW (FY2008) (April 16, 2010) (revised)
Source: Ministry of the Environment, Discharge and Treatment of MSW (FY2008) (April 16, 2010) (revised)
Fig. I-6 Recycling Rate

7.9
10.0
8.07.6
7.8
8.2 8.1
8.78.5
9.4
11.7
12.8 12.9 12.813.2
13.814.0 14.0
14.8
15.6 15.7
18.0
192196
167
157 157 154149 151
142
151
172178
172165
160153
145
133 130122 122
138
0
50
100
150
200
250
300
7
9
11
13
15
17
19
Remaining capacity Number of remaining sustainable years
(million m3)
1980 1985 1989 1990 1991 1992 1993 1994 1995 1996 1997 1998 1999 2000 2001 2002 2003 2004 2005 2006 2007 2008 (FY)
(years)
7
[4] Final disposal sites
As of the end of FY2008, there were 1,823 final disposal sites for MSW. The remaining capacity was 121.84 million m3 and the national estimated number of remaining
sustainable years was 18.0 years (see Fig. I-7). As the distribution of final disposal sites is regionally uneven, the number of remaining sustainable years may differ among regions.
Fig. I-7 Remaining Capacity and Number of Remaining Sustainable Years of Final Disposal Sites for MSW
Final landfill/Facility for exudated water treatment
Note) Of the remaining capacity corrected in accordance with an air survey, etc. in FY2005, the increment amount (7,737m3) was added to the data for the fiscal years before 2004 to compute the remaining capacity and the number of remaining sustainable years for each fiscal year.
Source: Ministry of the Environment, Discharge and Treatment of MSW (FY2008) (April 16, 2010) (revised)
Number of remaining sustainable years = Remaining capacity at the end of the fiscal year(Total final disposal in the fiscal year / Weight of landfill waste)
8
(2) Industrial Waste
[1] Total amount of industrial waste discharged
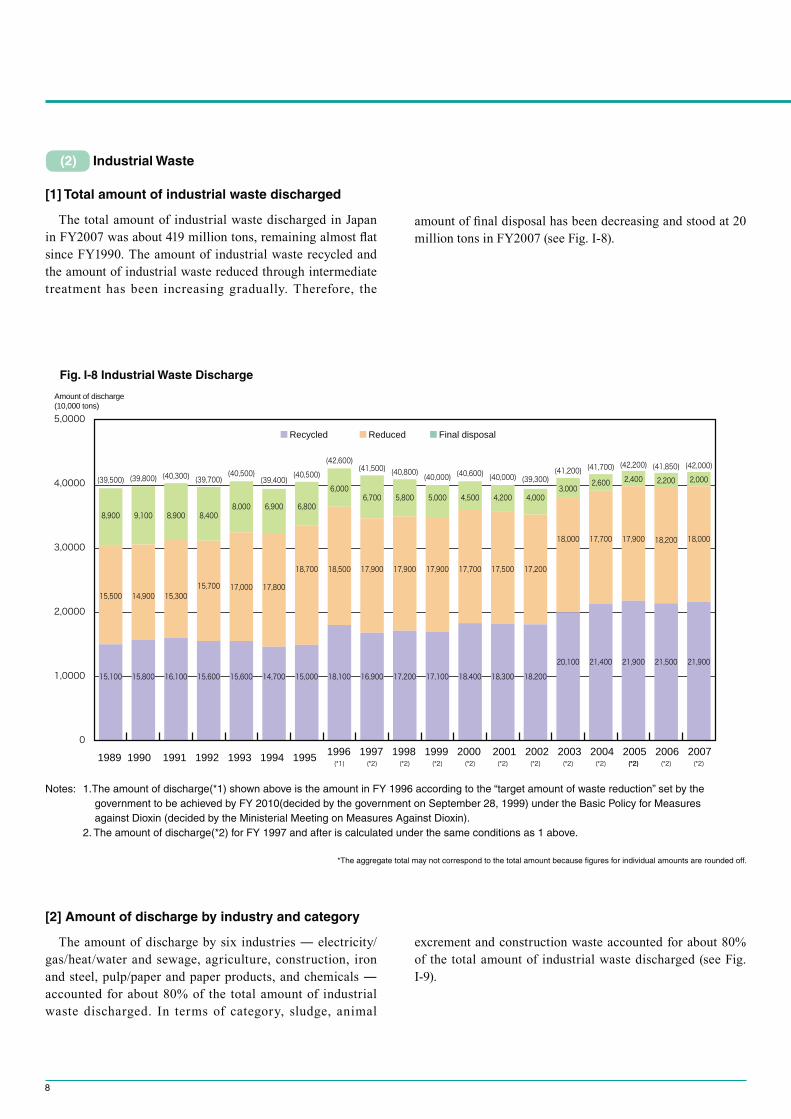
The total amount of industrial waste discharged in Japan in FY2007 was about 419 million tons, remaining almost flat since FY1990. The amount of industrial waste recycled and the amount of industrial waste reduced through intermediate treatment has been increasing gradually. Therefore, the
amount of final disposal has been decreasing and stood at 20 million tons in FY2007 (see Fig. I-8).
[2] Amount of discharge by industry and category
The amount of discharge by six industries ― electricity/gas/heat/water and sewage, agriculture, construction, iron and steel, pulp/paper and paper products, and chemicals ― accounted for about 80% of the total amount of industrial waste discharged. In terms of category, sludge, animal
excrement and construction waste accounted for about 80% of the total amount of industrial waste discharged (see Fig. I-9).
(*2)
(42,000)
18,000
21,900
(*2)
■Recycled ■Reduced ■Final disposal
Amount of discharge(10,000 tons)
(39,500) (39,800) (40,300) (39,700)(40,500)
(39,400) (40,500)
(42,600)(41,500) (40,800) (40,000) (40,600) (40,000) (39,300)
(41,200)
8,900 9,100 8,900 8,4008,000 6,900 6,800
6,0006,700 5,800 5,000 4,500 4,200 4,000
3,000
15,500 14,900 15,30015,700 17,000 17,800
18,700 18,500 17,900 17,900 17,900 17,700 17,500 17,200
18,000
15,100 15,800 16,100 15,600 15,600 14,700 15,000 18,100 16,900 17,200 17,100 18,400 18,300 18,200
20,100
(41,700)
2,600
17,700
21,400
(42,200)
2,400
17,900
21,900
(41,850)
2,200 2,000
18,200
21,500
0
1,0000
2,0000
3,0000
4,0000
5,0000
(*2)(*2)(*2)(*2)(*2)(*2)(*2)(*2)(*2)(*2)(*1)1989 1990 1991 1992 1993 1994 1995 1996 1997 1998 1999 2000 2001 2002 2003 2004 2005 2006 2007
Fig. I-8 Industrial Waste Discharge
Notes: 1.The amount of discharge(*1) shown above is the amount in FY 1996 according to the “target amount of waste reduction” set by the government to be achieved by FY 2010(decided by the government on September 28, 1999) under the Basic Policy for Measures against Dioxin (decided by the Ministerial Meeting on Measures Against Dioxin). 2. The amount of discharge(*2) for FY 1997 and after is calculated under the same conditions as 1 above.
*The aggregate total may not correspond to the total amount because figures for individual amounts are rounded off.

Unit: Thousand tons/yearFigures in parentheses are percentages.
By industry By category
Sludge185,305(44.2)
Animal excrement87,476(20.9)
Construction waste60,900(14.5)
Slag20,715(4.9)
Ash dust16,964(4.0)
Metal scrap11,461(2.7)
Wood scrap 5,971(1.4)Waste plastic6,428 (1.5)
Glass/concrete/ceramic scrap 13,360 (3.2)
Waste acid 5,662(1.3)
Others 15,662(3.7)
Total419,425 (100.0)
Electricity, gas, heat supply and water
95,810(22.8)
Agriculture87,811(20.9)
Construction77,253(18.4)
Total419,425(100.0)
Iron and steel38,265(9.1)
Pulp, paper and paper products
38,265(9.1)
Chemicals17,578(4.2)
Mining12,509(3.0)
Food 10,097(2.4)
Ceramic, stone and clay products9,811(2.3)
Electric machinery, equipment and supplies/ Information and communication electronics equipment/ Electronic parts and devices5,149(1.2)
Others29,662(7.1)
Source: Ministry of the Environment, Discharge and Treatment of Industrial Waste (FY2007) (January 14, 2010)
9
418,497 M tn. (100%)
Total discharge 419,425 M tn. (100%)
Direct recycling 90,128 M tn. (21%)
Intermediate treatment319,102 M tn. (76%)
Direct final disposal 10,196 M tn. (2%)
Treatment residue 138,630 M tn. (33%)
Reduced 180,471M tn. (43%)
181,926 M tn. (43%)
Recycled after treatment 128,684 M tn. (31%)
Final disposal after treatment 9,946 M tn. (2%)
Total amount recycled 218,811 M tn. (52%)
214,772 M tn. (51%)
Total final disposal2,400 M tn. (5%)
21,799 M tn. (5%)
3.2 3.3
3.7 3.9
4.3
4.5
6.1
7.7 7.2
211,059
190,312 183,937 176,089 179,408 181,782
184,178
184,834 186,252
8
0
50,000
100,000
150,000
200,000
250,000
300,000
2
3
4
5
6
7
(thousand m3)
1997 1998 1999 2000 2001 2002 2003 2004 2005 (FY)
(year)
[3] Flow of industrial waste treatment
Of the total amount of industrial waste discharged (about 419.4 million tons), about 90.1 million tons were directly recycled, and about 319.1 million tons were delivered to intermediate treatment, which were further reduced to about 138.6 million tons and then recycled or finally disposed
of. Finally, 52% of the total amount of industrial waste discharged was recycled and 5% was finally disposed of (see Fig. I-10).
[4] Final disposal sites
As of April 1, 2005, the remaining capacity of final disposal sites for industrial waste was about 186.25 million m3, an increase of about 1.42 million m3 (0.8%) over the previous year. The national average number of remaining sustainable years of f inal disposal sites was 7.7 years (see Fig. I-11).
Fig. I-9 Amount of Industrial Waste Discharged by Industry and Category (FY2007)
Fig. I-10 Flow of Industrial Waste Treatment in Japan (FY2006)
Fig. I-11 Remaining Capacity and Number of Remaining Sustainable Years of Final Disposal Sites for Industrial Waste
Figures in parentheses are data for FY 2004Note: The aggregate total may not correspond to the total amountbecause figures for individual amounts are rounded off.
Source: Ministry of environment, Discharge and Treatment of Industrial Waste (FY 2005) (January 8, 2008)
Notes: Number of remaining sustainable years = Remaining capacity(m3)/amount of final disposal(tons)(conversion ratio between ton and m3 =1)
Source: Ministry of environment, Discharge and Treatment of Industrial Waste (As of April 1, 2005)

10
Legislation and Policies to Promote the Creation of a 3R-Oriented Society
1 Legislative System
In the more than ten years since the “Law for Promotion of Utilization of Recycled Resources (amended to the Law for Promotion of Effective Utilization of Resources)” came into force in 1991, related laws have systematically been provided
Green Purchasing Law
Put into force in January 2001
Fundamental Law for Establishing a SoundMaterial-Cycle Society (basic framework law)
ligations of the national and local governments, businesses and citiz ken by the national government
To ensure material recycling in society;
to reduce environmental burden
aste management
[Establishment of a general scheme]
[Regulations in accordance with the character
aste management
2.Regulations f acilities
3.Regulations on w usinesses
4.Establishment of standards for wasted management
6.Dev rt
lic sector
1.Reduction and recycling of b
2.Utilization of recyclable resources and reusab rts
3.Product designing and manufacturing with awareness
of the 3Rs
4.Product labeling f waste
5.Voluntary take-bac
6.Promotion of effective utilization of b
Promotion of the 3Rs
Put into fo ril 2001Amended in June 2006
Containers andPackaging
Recycling LawPut into f il 2000Amended in June 2006
Recycling Law
Put into f il 2001
FoodRecycling Law
Put into force in May 2001Amended in June 2007
ConstructionMaterial
Recycling LawPut into force in May 2002
End-of-LifeVehicles
Recycling LawPut into force in January 2005
elected discharge of waste by consumers
kaging
byecycling of containers
kaging by businesses that manufacture and use them
ar owners bear recycling costManufactures take back and recycle flourocarbons, air bags and shredder dust
elated businesses take bac ovide end-of-life vehicles
onsumers bear collection and recycling costs
etailers take back used
consumersManufacturers recycle
manufacture,sell fo charge of recycling food waste
Construction contractors tale charge of:
orting dismantled construction materials;
and ecycling construction
material waste
Put into fo il 2001
Wasted Management LawLaw for Promotion of Effective
Utilization of Resources
Fundamental Plan for Establishing a Sound Material-Cycle Society :
The national government shall take the initiative in , etc.
Fig. II-1 Legislative System for Promoting the Creation of a 3R-Oriented Society
based on experience and measures of promoting the reduction, reuse and recycling of waste. The “Containers and Packaging Recycling Law” and the “Food Recycling Law” were amended in June 2006 and June 2007 respectively (see Fig. II-1).

Reduce
Reuse
Recycle
<Measures over various lifecycle phases>
Production Distribution
Law for Promotion of Effective Utilization of Resources
Recycling Laws
Waste Management and Public Cleansing Law
The Fundamental Plan for Establishing a Sound Material-Cycle Society
Promotion of voluntary measures in line with guidelines issued by the Industrial Structure Council (35 items in 18 industries)nsing Law
Collection DisposalConsumption/Use
11
Fig. II-2a Laws in Product Lifecycle
Fig. II-2b Shift to a Sustainable Society
End of WWII
Year Law (enforcement) Social situation, etc.
1945Waste was a “public sanitation problem” arising from garbage that must be solved in the public health service.
1960 Worsened environmental contamination was caused by illegal waste handling as a result of a massive generation of waste.
1971 Waste Management and Public Cleansing Law
…Clarification of waste disposal responsibility and disposal standard, including industrial waste.
1991 Law for the Promotion of Utilization of Recycled Resources
…The start of promoting recycling measures based on the recycling laws.
2000 Containers and Packaging Recycling Law2001 The Fundamental Law for
Establishing a Sound Material-Cycle Society
Building a sustainable society in which consumption of natural resources, thereby the environmental load, is reduced.
Law for Promotion of Effective Utilization of Resources
The 3R concept that gives priority to reducing and reusing over recycling.
Home Appliance Recycling Law Overall amendment of the Law for the Promotion of Utilization of Recycled Resources for comprehensive promotion of 3R efforts.
Food Recycling LawGreen Purchasing Law
2002 Construction Waste Recycling Law2005 End-of-Life Vehicle Recycling Law
The 1st year of an era of sustainable society
High economic growth period

12
In addition to these laws, 3R for a diverse range of wastes, by-products, and used products has been promoted by implementing necessary measures according to the guidelines (see p.46) provided by the Industrial Structure Council for relevant commodities and businesses.
Fig. II-3 Laws and Guidelines to Control Waste
Garbage (Business-related
garbage, household garbage)
Containers and packaging
Paper
Others(Personal computers, gas appliances, etc.)
FurnitureClothes
Home appliances
Others
Chemicals
Pulp, paper and paper products
Iron and steel
Electricity, gas, heat supply and water
Food
Agriculture
Construction
General waste Industrial waste
Law for Promotion of Effective Utilization of Resources
(Specified resources-recycled products)
Mining
Manufacturing of vehicles
Home Appliance Recycling Law
washing machines
manufacturers reproduce products therefrom
Construction Material Recycling Law
sorting dismantled construction materials and recycling construction material waste
Law on the Appropriate Treatment and Promotion of Utilization of Livestock Manure
disposal and storage facilities, maintenance of facilities
Food Recycling Law
sell food products take charge of recycling food waste
End-of-Life Vehicles Recycling Law
cost, and manufacturers tack back and recycle fluorocarbons, air bags and shredder dust
Law for Promotion of Effective Utilization of Resources
Designing with awareness of the 3Rs, product labeling for separate collection of waste
Promotion of 3Rs of by-products, utilization of recycled materials
Guidelines issued by the Industrial Structure Council
Guideline by product category (35 commodities)
Containers and Packaging Recycling Law
containers and packaging
packaging by municipalities, recycling of containers and packaging by manufactures and user entities

13
2 Fundamental Law for Establishing a Sound Material-Cycle Society
Fig. II-4 Framework of Fundamental Law for Establishing a Sound Material-Cycle Society
Outline of the Law
The law defines individual roles to be played by citizens, businesses, municipalities and the national government in establishing a sound material-cycle society, and provides basic principles for promoting necessary measures (see Fig. II-4).
(1) Subjects to be regulated
The law states that it shall be applicable to “waste” in general, valuable or valueless, and that efforts should be made to prevent products from generating waste materials and to promote recycling of such waste materials generated by focusing on their utility as “recyclable resources.”
(2) Parties to be regulated
The law attributes responsibility to the national and local governments, businesses and citizens. The two distinctive features of the law are that it clarifies the discharger responsibility of businesses and citizens, while defining the extended producer responsibility.
[1] Title of the law: Fundamental Law for Establishing a Sound Material-Cycle Society
[2] Date put into force: January 2001 (promulgated in June 2000)
[3] Purpose: Providing a basic framework and clarifying the process for establishing a sound material-cycle society

14
(3) Basic Plan for Establishing a Sound Material-Cycle Society
The Basic Plan for Establishing a Sound Material-Cycle Society was developed in March 2003 during efforts to comprehensively promote the policies related to Establishing a Sound Material-Cycle Society, as planned.
This Basic Plan is to be reviewed roughly every five years, and in March 2008, the plan was revised into the Second Basic Plan for Establishing a Sound Material-Cycle Society
In the Second Basic Plan, numerical targets for FY2015
are provided for three indices of different phases of the material flow: “entry,” “recycled” and “exit” so as to ascertain how much resources are taken, consumed and disposed. Meanwhile, account was taken of past trends in technological innovation and changes in the demand structure of goods and services toward realization of a Sound Material-Cycle Society, where measures for waste generation restraints, reuse, reuse after treatment, disposal and so forth are well balanced.
[1] Material productivity (=GDP/Amount of natural resources)Fig. II-5 Material Productivity (Unit: 10,000 yen/t)
0
25
50
2015200520001995199019851980 2010Source: Ministry of the Environment
Note) Material productivity in FY2007 was 361,000 yen/t, up by 37% from FY2000 (264,000 yen/t).
[2] Usage rate of Recycled Goods (=Usage rate of recycled goods / (Usage rate of recycled goods + amount of natural resources used)Fig. II-6 Usage Rate of Recycled Goods (Unit: %)
0
5
10
15
2015200520001995199019851980 2010Source: Ministry of the Environment
Note) Usage rate of recycled goods in FY2007 was 13.5%, up by 3.5 points from FY2000 (10.0%).
[3] Final disposalFig. II-7 Amount of Final Disposal (Unit: Million tons)
0
50
100
150
20152010200520001995199019851980Source: Ministry of the Environment
Note) The amount of final disposal in FY2007 was 27 million tons, down by 53% from FY2000 (56 million tons).
With regard to “exit,” an index is defined as “amount of final disposal” (landfill waste) representing an urgent need for final disposal sites. The numerical targets are set as follows: an 80% decrease from FY1990 [110M tn.] and a 60% decrease from FY2000 [56M tn.] to reach 23 million tons in FY2015. The amount of final disposal was 27 million tons in FY2007.
With regard to “recycled,” an index is defined as “usage rate of recycled goods” representing how much resource input is cyclically used (reuse and reuse after treatment). The numerical targets are set as follows: an 80% increase from FY1990 [8%] and a 40 to 50% increase from FY2000 [10%] to reach 14 to 15% in FY2015. It was 13.5% in FY2007.
With regard to “entry,” an index is defined as “material productivity” representing how effectively material is used (how much affluence is produced with less resource) by industries and people’s lives. The numerical target was doubled from FY1990 [210,000 yen/t], and aimed at a 60% increase of the FY2000 rate [260,000 yen/t] in FY2015 [420,000 yen/t]. In FY2007, the material productivity was 361,000 yen/t.

15
(4) Extended producer responsibility
In discussions on 3R-related policies and systems, “Extended Producer Responsibility (EPR)” is often used.
Extended producer responsibility means that producers bear a certain degree of responsibility for proper recycling and management of the products that they produced even after the products are used and disposed of.
More specifically, in order to contribute to prevention of waste generation as well as recycling and proper disposal of recyclable resources, producers are required to [1] design recycling-oriented products, [2] indicate the materials or ingredients of products, and [3] take back and recycle designated products after they are disposed of.
Having studied extended producer responsibility as an
environmental policy approach since 1994, the OECD developed and published a guidance manual for OECD members in 2001.
[1] Definition
[2] Primary effect
[3] Major objective
[4] Sharing responsibility
[5] Specific policy
instruments and measures
[6] EPR and PPP
“An environmental policy approach in which a producer’s responsibility, physical and/or financial, for a
product is extended to the post-consumer stage of a product’s life cycle”. This approach has the following
features:
(a) The responsibility is transferred from local governments to the producer.
(b) Producers consider the environmental impact when designing their products.
Transfer the financial and/or physical responsibility of waste management from local governments and the
general taxpayer to the producer, encourage positive changes in material selection and in the design aspects
of a product. Appropriate signals can be sent to the producer to internalize a substantial portion of the
external environmental cost of the product.
(a) Source reduction (natural resource conservation/material conservation)
(b) Waste prevention
(c) Design of more environmentally compatible products
(d) Closure of material-use loops to promote sustainable development
Sharing responsibility among parties concerned in the product chain from production to disposal is an
inherent key of EPR.
(a) Take-back and recycling of products
(b) Deposit/refund scheme
(c) Material taxes as earmarked taxes
(d) Advance disposal fee
(e) Criteria for users of recycled products
(f) Leasing
The Polluter Pays Principle (PPP) states that the polluter should bear the expenses of preventing and
controlling pollution to ensure that the environment is in an acceptable state.
In contrast, EPR seeks to solve problems by holding producers responsible for the entire life cycle of a
product.
Inconsistency between EPR and PPP can be completely prevented by clearly defining their roles.
Source: OECD, Extended Producer Responsibility: Guidance Manual for Governments (2001) (compiled by the Clean Japan Center)
Table II-1 Extended Producer Responsibility under the OECD “Extended Producer Responsibility: Guidance Manual for Governments”

[1] Title of the law: Law for Promotion of Effective Utilization of Resources[2] Date put into force: April 2001 (promulgated in June 2000)[3] Purpose: Comprehensively promoting reduction of waste, reuse of parts, and recycling of used products as raw materials[4] Outline of the law: The law provides for measures to be taken by businesses, such as 3R-related measures in the production
stage, 3R consideration in the product designing stage, labeling for separated collection, and development of a system for self-collection and recycling by manufacturers.
16
3 Law for Promotion of Effective Utilization of Resources
(1) Responsibilities of parties concerned
[1] Businesses• Rationalize use of raw materials with the aim of reducing
used products and by-products• Using recyclable resources and reusable parts• Promoting the use of used products and by-products as
recyclable resources and reusable parts“Recyclable resources”: Used products or by-products (waste) generated in plants that can be used as raw materials“Reusable parts”: Used goods that can be used as parts of the products
[2] Consumers• Using products as long as possible• Using products containing recyclable resources• Cooperating for separated collection• Cooperating with measures taken by the national and local
governments as well as by businesses[3] National and local governments• Taking financial measures• Promoting the use of recyclable resources in procurement• Promoting science and technology development• Endeavoring to gain the understanding of the public
(2) Industries and products to be regulated
The law provides the standards of judgment (ministerial ordinances) for the 3Rs (reduction, reuse and recycling), and requires that businesses comply with the standards with respect to 10 designated industries and 69 product items (covering about 50% of municipal and industrial waste).
(3) Provision of product information
In order to integrate DfE into the economic system and benefit the entire company, it is vital to achieve clear standardization in labeling and assessment indices for DfE to facilitate each entity involved in the product life cycle.
Law for Promotion of Effective Utilization of Resources therefore designates product items in which the 3Rs are considered. Items include automobiles, home electric appliances (television sets, refrigerators, washing machines, microwave ovens, clothes dryers), PCs, copiers, metal furniture, gas/oil equipment, bathroom units and pachinko machines. Items the require labeling for separate collection include PET bottles, steel cans, aluminum cans, plastic tray packaging, paper container packaging and compact secondary batteries. Moreover, a new information disclosure system with information on materials contained in the product (home electric appliances and PCs) was planned to be introduced in July 2006.
*Notes: The symbol presented in left side shall be attached to the body and packaging of the
subject product items (PCs, air conditioners, television sets, refrigerators, washing machines,
microwave ovens, clothes driers) containing subject materials (lead and lead compounds,
mercury and mercury compounds, hexavalent chromium compounds, cadmium and cadmium
compounds, polybromo-biphenyls, polybromo-diphenyl ether). Information such as the location
and amount of materials contained shall be indicated in manuals and websites.
Subject materials contained (labeling is obligatory)
Fig. II-8 Identification of Materials Contained

17
I. For Products
<raw material> <Product design>Specified Resources-Saved Product
Specified Reuse-Promoted ProductSpecified Resources-Recycled Product
(PCs, compact rechargeable batteries, total 2 product items.)
Specified Labeled Product
Designated Resources Reutilizing Industry
Use for products manufacturing of recyclable reusable parts Design for reuse and recycle
(efforts relating to raw material and structure, etc.)
Execution of self-collection and recycling
Labeling to facilitate separated collection
Design for Reduce(Rationalization of the use of raw materials, etc.)
Manufacture
Businesses to be obligated to promote the reduction of generation of used products, to use reusable parts and recycled resources(use recycled material as raw materials)
Red
uce
Dis
trib
utio
n/S
ervi
ce
Con
sum
ptio
n
Red
uce/
Rec
ycle
Separation/Collection
Reu
se
II. For By-products
Manufacture
Businesses to be obligated to promote the reduction of generation of by-products and recycling (use recycled resources as raw material)
Red
uce
Reu
seR
ecyc
le
Paper manufacturing industry, glass container manufacturing industry, etc. total 5 industries
[Overview standards of judgment]
equipment
recyclable resources
records, etc.
[Overview standards of judgment]
sorting
[Overview standards of judgment]
g
etc.
[Overview standards of judgment]
Personal computers, automobiles,
machines, metal furniture, gas and oil appliances, copying machines,
devices using compact rechargeable batteries, total 50 product items.
Designated Resources-Saving Industry
Reduction of by-products generation and promoting of recycling measure
Specified By-product
[Overview standards of judgment]
generation, etc.
pulp producing industry and paper
automobile manufacturing industry, etc. total 5 industries
[Overview standards of judgment]
products, etc.
Coal ash generated by the electricity industry, soil and sand, concrete lumps, asphalt-concrete lumps or lumbers generated by the construction industry, total 2 product items.
steel cans, aluminum cans, PET bottles,
rechargeable batteries, PVC construction materials, total 7 product items.
Personal computers, automobiles, H machines, metal furniture, gas and oil appliances, total 19 product items.
[Overview standards of judgment]ization of the use of raw
materialsring
opportunity for repairin advance, etc.
Fig. II-9 Scheme of the Law

18
4 Specified reuse-promoted products Required to promote the use of recyclable resources or reusable parts (designing and manufacturing products that can be easily reused or recycled)
1 Designated resources-saving industries Required to reduce generation of by-products (by ensuring rational use of raw materials and promoting use of by-products as recyclable resources)
2 Designated resources-reutilizing industries Required to use recyclable resources and reusable parts
3 Specified resources-saved products Required to ensure rational use of raw materials, prolong product life and reduce generation of used products
(television sets, air conditioners, refrigerators,
washing machines, microwave ovens, clothes dryers)
(including rotary types)
salt manufacturing) and organic chemical
manufacturing
washing machines, microwave ovens, clothes dryers)
bath heaters with gas burners, oil-fired water heaters)
devices, electric assisted bicycles, electric powered wheelchairs, printers, portable data collecting devices, cordless phones, facsimile
devices for simplicity radio transmission, radio sets for amateurs, video cameras, headphone stereos, electric vacuum cleaners, electric
shavers, electric therapeutic apparatuses, electric bubble generators, electric toys)

19
5 Specified labeled products Required to be labeled to facilitate separated collection
6 Specified resources-recycled products Required to promote self-collection and recycling
7 Specified by-products Required to promote the use of by-products as recyclable resources

20
Specified Resources-Recycled Products
Changes in amount of self-collection and recycling rate
Personal computers
Changes in amount of self-collectionBusiness use
FY2001 450,000 unitsFY2007 510,000 units
Home useFY2004 230,000 unitsFY2007 340,000 units
Recycling rateBusiness use (desktop)
FY2007 81.1%<Statutory target: 50%>Home use (desktop)
FY2007 71.2%<Statutory target: 50%>
Compact secondary batteries (NiCd batteries)
Amount of self-collectionFY2001 628 tonsFY2007 1,030 tons
Recycling rateFY2007 73.5%
<Statutory target: 60%>
Specified Labeled Products
[Overview standards of labeling]・ Items to be labeled: material (e.g. paper, plastic)・ Design, size, location of labeling mark, etc.
Labeling to facilitate separated collection
[Labels and labeling rate]
Obligation of businesses in self- collection and recycling
[Overview standards of judgment] Measure of self-collection (presence or absence of correction of recycling costs)
Setting of target Measure of recycling Condition where businesses take back specified used resource-recycled products from municipalities
Ensuring safety in collecting and recycling, etc.
Obligation to use reusable parts and recyclable resources as raw materials, etc.
[Overview standards of judgment] Setting of target Maintenance of equipment Setting a plan to utilize recyclable resources and record the implementation results, etc.
[Changes in use rate of recyclable resources, etc.] Paper manufacturing industry (paper recycling rate)
FY2000 57.3% FY2006 60.8%<Statutory target: 62% in FY2010>
Rigid PVC pipes and pipe fitting manufacturing industry (use rate of used PVC pipes and pipe fittings)
FY2000 43.9% FY2006 61.3%
Glass container manufacturing industry (cullet-use rate)
FY2000 77.8% FY2006 92.6%<Statutory target: 91% in FY2010>
Copier manufacturing industry (parts-reuse rate) FY2002 2.45kg/unit FY2005 2.54kg/unit
Construction industry (recycling rate of asphalt and concrete lumps)
FY2005 99%
Designated Resources-Reutilizing Industries
Steel cans, aluminum cans: 99% PET bottles: 100% Containers and packaging (paper, plastic): 99% Compact rechargeable batteries (encapsulated alkaline batteries): 99%
PVC construction materials: 100%
Designated Resources-Reutilizing Industries
3. Collecting and recycling used products
Obligation to use reusable parts and recyclable resources as raw materials, etc.
(5 industries - Paper manufacturing, glass container manufacturing, rigid PVC pipe & pipe fitting manufacturing, copier manufacturing, and construction)
Designated Resources-Saving Industries
Obligation to reduce and recycle by-products
(4 industries - Pulp and paper manufacturing, industrial inorganic chemicals manufacturing, etc., iron making/steel making/steel making and rolling, and primary copper refining and smelting)
Specified Resources-Recycled Products
Obligation of businesses for self-collection and recycling
(2-items - Personal computers, compact secondary batteries)
Specified Labeled Products
Labeling obligation
(7 items - Steel cans, aluminum cans, PET bottles, paper containers and packaging, plastic containers and packaging, compact secondary batteries, and rigid PVC products)
1. Reducing and recycling by-products produced in manufacturing
Discharge
Consumption
Parts
Products
Distribution
Materials
Product Lifecycle
Fig. II-10 Implementation of the Law for Promotion of Effective Utilization of Resources

21
Obligation to reduce and recycle by-products
[Overview standards of judgment]・ Setting of target・ Maintenance of equipment・ Setting a plan to reduce generation
of by-products, and submission of the plan to the relevant minister, etc.
[Changes in the amount of final disposal of by-products] Pulp and paper manufacturing industry
FY2000 612,000 tons FY2005 424,000 tons
Industrial inorganic chemicals manufacturing industry
FY2000 1 million tons FY2005 690,000 tons
Iron-making, steel-making, and steel-making and rolling industry
FY2000 810,000 tons FY2005 690,000 tons
Primary copper refining and smelting industry FY2000 660,000 tons FY2005 520,000 tons
Automobile manufacturing industry FY2000 51,000 tons FY2005 10,000 tons
Obligation to recycle by-products
[Overview standards of judgment]・ Maintenance of equipment・ Setting a plan to use
by-products, etc.
[Changes in by-product use rate] Coal ash in the electricity industry
FY2000 82% FY2006 97%
Asphalt and concrete lumps recycling rate in the construc-tion industry
FY2005 99%
Obligation to reduce weight and size, and prolong life by means of reduction-oriented design
[Overview standards of judgment]・ Weight saving and downsizing (rational use of raw materials)・ Ensuring a longer service life and opportunity for repairs・ Preliminary assessment, etc.
[Examples of reduction-oriented design] Lighter and more compact Automobiles - Lighter bonnet
22kg -> 8kg Personal computers - Weight saving
1,650g -> 1,199g Pachinko machines - The steel plunger base was replaced with an aluminum die cast alloy (reduction of approx. 160g).
Metal furniture - Reduced-mass structure by using joints as legs (13% reduction)
Long service life Automobiles - Extension of specified replacement period
CVT oil: 40,000km to 80,000km Oil filter: 20,000km to 30,000km
Personal computers - Long-life hard disks 1.5 times longer than conventional 2.5-inch models.
Designated Resources-Saving Industriesy
Specified Resources-Saved Products
Obligation to facilitate the collection of recycled materials by means of reuse- and recycling-oriented design
[Overview standards of judgment]・ Considerations on raw materials, etc.・ Improved disassembly efficiency (structural and sorting considerations)・ Preliminary assessment, etc.
[Examples of reuse- and recycling-oriented design]
Considerations of raw materials, etc. Automobiles - Reduced variety of materials
The types of polypropylene are reduced from 30 to six. Prefabricated bath unit - Materials available for use as recyclable resources were increased to 13.2% of the total weight.
Improved disassembly efficiency TV - The parts were reduced to half the number in conven-tional models.
46% reduction of screws (from 231 to 125) Personal computers - Reduction of screws by an average of 25% improved the efficiency of disassembly.
Gas and oil appliances - Quick connection reduced the number of screws (from five to none).
Labeling Air-conditioners - Labeling of plastic parts weighing more than 5g
Specified Reuse-Promoted Products
Specified By-products
Specified by-products
Obligation to recycle by-products
(2 items - Coal ash in the electricity industry, and soil, sand and wood in the construction industry)* Only by-products resulting from energy supply and construction are included.
Obligation to reduce weight and size, and prolong life by means of reduction-oriented design
(19 items - Personal computers, automobiles, pachinko machines, pinball machines, metal furniture)
processes (zero-emission measures in production sites)
2. Environmentally conscious product design(Design focusing on reducing weight and facilitating the collection of recyclable materials, etc.)
Specified Resources-saved Products
Obligation to reduce and recycle by-products
(1 industry - Automobile manufac-turing)
Designated Resources-saving Industries
Obligation to facilitate the collection of recycled materials by means of reuse- and recycling-oriented design
(50 items - Personal computers, automobiles, home electric appliances, pachinko machines, pinball machines, metal furniture, gas and oil appliances, copiers, prefabricated bath units, custom kitchens, compact secondary battery driven equipment)
Specified Reuse-promoted Products

[1] Title of the law: Waste Management and Public Cleaning Law (Waste Management Law)[2] Date put into force: Date designated by Cabinet Order within one year after the date of promulgation (promulgated in May
2010)[3] Purpose: To preserve the living environment and improve public health by preventing waste generation, promoting proper
waste management (transportation, disposal, recycling, etc.) and maintaining a clean living environment.[4] Outline of the law: The law provides for the definition of waste, permission for engaging in the waste disposal business,
permission for establishing waste disposal facilities, and setting of the waste disposal criteria (see Fig. II-11).
22
(1) Definition of wasteThe law defines “waste” as “refuse, bulky refuse, ashes,
sludge, excreta, waste oil, waste acid, waste alkali, carcasses and other filthy and unnecessary matter, which are in solid or liquid state.” In other words, “waste” means things that become useless because they can no longer be used by their owners or be sold to others for value.
Whether a thing falls under the definition of waste is comprehensively judged in light of its nature, the condition of its discharge, the ordinary way to handle it, whether it has any commercial value, and its owner’s intention. For example, if used tires are piled up in an open field and left untouched for as long as about 180 days, they are regarded as waste.
Among waste materials discharged in business activities, 20 kinds of waste materials, such as ashes, sludge, animal excrement discharged in the livestock industry, waste oil, waste acid, waste alkali, and animal bodies discharged in the livestock industry, are defined as industrial waste, and other kinds of waste materials are defined as municipal solid waste.(2) Responsibilities of businesses
[1] Businesses shall bear the responsibility of properly managing waste materials generated in their activities or entrust such management in writing to licensed waste disposal businesses.
[2] Businesses are also required to follow the flow of waste materials that they discharge until their final disposal in
accordance with the “Manifest” (waste management sheet).[3] Businesses discharging a vast quantity of waste
(businesses that have discharged 1,000 tons or more of industrial waste or 50 tons or more of specially controlled industrial waste in the previous year) need to develop a waste disposal plan.
[4] Except for incineration under the waste disposal standards, (incineration under) other laws or ordinances, or incineration inevitable for public interests or social custom, businesses shall be prohibited from incinerating waste and shall be punished for violating this prohibition.(3) Permission of disposal facilities
Businesses shall obtain permission to establish a waste disposal facility under this law even in the case of engaging in recycling provided under the Home Appliance Recycling Law or the Containers and Packaging Recycling Law.(4) Special schemes
Licenses for engaging in a waste disposal business or establishing waste disposal facilities shall not be required under two special schemes: the National Permit System and the Disposal and Recycling Approval Scheme.
The National Permit System was created as an enhanced version of the original Wide-Area Disposal and Recycling Designation Scheme, with the aim of promoting better waste management (based on the amended law, which entered into effect on December 1, 2003) (see Table II-2).
4 Waste Management Law
National Permit System Disposal and Recycling Approval Scheme
Details of the scheme
Waste that falls under either of the following categories:1. Items those are not likely to have a harmful impact on the human living
environment as a result of their decomposing easily under normal transport conditions, evaporating, or otherwise undergoing changes in their physical properties.
2. For products that have become waste, if entities that conduct manufacturing, processing or sales operations of the said products also conduct treatment of said waste items, a reduction in the volume of said waste, and other proper management can be ensured.
<MSW>
entities that have received authorization from the Minister of the Environment as businesses that conduct waste management over a wide area.
Businesses approved by the Minister of Environment as carrying out disposal and recycling of designated waste materials in accordance
a waste disposal business or for establishing waste disposal facilities.
<MSW>
<Industrial waste>
Waste materials subject to the scheme
Table II-2 Outline of the Special Schemes for Waste Disposal Businesses and Facilities

23
Fig. II-11 Flow under the Waste Management Law

[1] Title of the law: Law for Promotion of Sorted Collection and Recycling of Containers and Packaging (Containers and Packaging Recycling Law)[2] Date put into force: April 2000 (promulgated in June 1995) December 2006 (amended in June 2006) Reduction of Discharge,
etc. is enforced in April 2007 Payment of Money to the Municipal Government is enforced in April 2008[3] Purpose: Reducing containers and packaging that are discharged as MSW from households, clarifying the role-sharing in
managing these waste, i.e., consumers sorting waste materials when discarding them, municipalities carrying out collection of sorted waste, and businesses recycling the collected waste, with the aim of ensuring proper management of waste and effective use of resources through reduction of MSW and adequate use of recyclable resources.
[4] Outline of the law: The law provides for a collection and recycling system in which municipalities take charge of collecting sorted containers and packaging (sorted and discarded by consumers) and businesses take charge of recycling such collected containers and packaging (see Figs. II-11 and II-12).
24
5 Containers and Packaging Recycling Law
(1) Containers and packaging“Containers” refers to things in which products are contained
(including bags), and “packaging” means things used to wrap products.
The term “containers and packaging” as used in this law shall mean containers and packaging of goods (including cases where containers and packaging of goods are paid for) which become unnecessary when the said goods have been consumed or when the said containers and packaging have been removed from the goods.
(2) Containers and packaging subject to recycling“Containers” subject to the law include glass containers, PET
bottles, paper containers, plastic containers (including styrene foam trays and plastic bags), and “packaging” subject to the law includes packaging and wrapping materials, all of which are discharged from households, under the following conditions.[1] Are they containers/packaging?
Examples: Caps of PET bottles, covers of pudding cups, plastic films, etc. of the transparency used for the box lunch sold in convenience stores, etc. are containers/packaging.[2] Are they containers/packaging of goods?
Examples: Containers or packaging on which a premium or prize is placed, bags for cleaning and containers or packaging of courier service are not.[3]Do the containers/packaging become unnecessary if the goods were consumed or if the containers/packaging are detached from the goods?
Examples: Dirty bags where desiccant was directly placed, CD cases and camera cases are not.
(3) Businesses to be obligated to recycleThe law specifies that businesses (manufacturers/users) that are to
be regulated are obliged to recycle containers and packaging.
(4)Businesses shall endeavor to reduce“Specified container users” who manage any of the following
retail trades shall endeavor to reduce waste containers and packaging discharged by reducing the excess use of containers and packaging.• Retail Trade, General Merchandise• Retail Trade (dry goods, apparel and apparel accessories)• Retail Trade (food and beverage)• Motor Vehicle Parts and Accessories Stores• Retail Trade (furniture, household utensil and household appliance)• Drug and Toiletry Store• Book and Stationery Stores• Sporting Goods, Toy, Amusement Goods and Musical Instrument
Stores• Tobacco and Smoking Article Specialty Stores
60% of domestic waste is from containers and packagingIn Japan, the amount of waste per annum is 48.11 million tons
(in FY2008), of which waste discharged from households is 34.10 million tons, accounting for 70.9%. Containers and packaging discharged from households account for about 62% of domestic waste in terms of volume.
1 2
43
5
Manufacturers of products that use containers and packaging
Businesses importing containers, importing products in containers or packaging, or using containers or packaging for imported products
entrustment of designated manufacturers/users.
Manufacturers of food, soft drinks,
paint, medicine, cosmetics
Manufacturers of containers
Manufacturers of
Retailers and wholesalers
Importers
Businesses using containers and
Schools, religious organizations, and restaurants that provide take-out services
Source: Ministry of Environment, Actual condition survey of utilizingwaste from containers and packaging and its disposal and business
report about effect verification(2003)
Containersand packaging
61.6%
Waste other thanContainers and
packaging38.4%
Paper 18.6%
Plastic40.1%
Metal 2.0%
Glass 0.7%
Others 0.2%
Fig. II-12 Share of Waste from Containers and Packaging in the Total Amount of Household Waste (in terms of volume for FY2008)

25
(5) Obligation of specified container users
[1] Measures for target setting and rational use of containers and packagingSpecified container users are obligated to set a target for reducing the basic unit (*) of containers and packaging (i.e., target
setting), and systematically take the necessary measures to achieve the target (i.e., rational use of containers and packaging).(*) A value given by dividing the quantity of used containers and packaging by a value having a close relation with the quantity of
used containers and packaging, such as the amount of sales or selling floor area.
(6) Obligation of copious container usersOf the specified container users, those who used more than 50 tons of containers and packaging materials (the sum of paper,
cardboard, plastic and other types of containers and packaging materials) in the previous fiscal year (copious container users) are obligated to compute the quantity of the containers and packaging used in that year and the basic unit, etc., enter the result in the annual report and submit the report by the end of June of the current fiscal year.
Examples of Rational Use of Containers and Packaging
Encouragingthe use of My Bag
Sell My Bag and lend My Basket to encourage
consumers to bring their own bags and baskets.
Using proper containers and packaging materials
Stop using oversized packaging and choose
containers and packaging that fit the size
of the merchandise.
Inquiring aboutthe need for packaging
Make it customary to ask clients whether they use
containers and packaging.
Introducingpoint systems
Offer benefits such as coupons and freebies to consumers who bring My
Bags or decline packaging, or introduce point systems.Selling food
by weightSell fresh food by weight,
and where possible reduce pre-packed items.
Using thinner,lighter containers
Use containers that have thinner walls than those
used now.
Using simplepackaging
Avoid double packaging, and promote partial
packaging of merchandise.
Charging forcontainers and packagingcurrently offered for free
Charge for containers and packaging, including plastic
shopping bags, currently distributed free of charge.
Fig. II-13 Examples of Rational Use of Containers and Packaging
[2] Other obligation
Providinginformation
Establishing an organized system, etc.
Considerations on safety, etc.
Rational use of containers and packaging, and effect verification
Coordination with concerned parties
Business owners need to provide consumers at shops information that will help to reduce waste containers and packaging, distribute brochures explaining the measures taken by business owners, and indicate the importance of reducing waste containers and packaging.
It is necessary to assign responsible persons and educate employees.
Considerations on the safety and functionality of containers and packaging materials are required.
The amount of used containers and packaging, the measures that were taken, and the effects of these measures need to be verified.
In order to effectively take the necessary measures, one must take into consideration coordination with the government, relevant local public bodies, consumers, related organizations and collaborating businesses.

26
(7) Funding for municipalities“Payment of Money to the Municipal Government” is a new
system that takes effect in FY2008.The system is based on the provision set forth in Article
10 (2) of the Containers and Packaging Recycling Law, for the purpose of improving the recycling efficiency and reducing social costs through the collaboration of citizens and municipalities with specific businesses.
When the total amount of expenses actually required for recycling falls below the total amount of expenses prospected to be required for recycling (amount of cost efficiency), one half of the amount corresponding to difference in expenses is paid to the municipal government as a contribution toward transitioning toward recycling.
Source: “Payment of Money to the Municipal Government” The Japan Containers and Packaging Recycling Association
Prospected
Prospected amount
Actual expenses
amount Actual amount
Prospectedamount
Prospectedcost
Prospectedvolume
Contribution money
Amount of cost efficiency
Prospectedsum for
recycling
Actual sumfor recycling
Fig. II-14

27
Category Recycling method Examples of Recycled products
Glass bottles Crushed into cullets
PET bottles
Paper containers and packaging
Plastic containers and packagingPolystyrene foam trays
Palletized, etc
Polyester raw materials
Sorted by paper-making material RDF
RDF
civil engineering materials
+
+
Raw materials for plastic products
Liquefaction
Blast furnace reducing agent
Gasification
Coal materials substitute for the coke oven
Conversion into solid fuel, etc. (Note)
including imitation wood and palettes
materials
* Steel cans, aluminum cans, paper cartons, and corrugated cardboard are subject to the Containers and Packaging Recycling Law, but they have yet to be subject to the recycling obligation.
(Note) A contingent or complementary way used when smooth recycling in any other way is difficu
Used for manufacturing construction boards of material
woven from crushed recycled paper
Fig. II-15 Three Recycling Routes Fig. II-16 Scheme under the Containers and Packaging Recycling Law (Designated body route; PET bottles)
Fig. II-17 Methods for Recycling Waste from Containers and Packaging under the Recycling Obligation

28
Present Situation of RecyclingThe number of those carrying out collection of sorted waste
and recycling under the Containers and Packaging Recycling Law has been increasing steadily (see Fig. II-18).
The volume of PET bottles collected separately in FY2008 was 284,000 tons (see Fig. II-19), which is a small increase compared to FY2007. The volume of PET bottles collected and then recycled by municipalities was 277,000 tons (see Fig. II-20), out of which 154,000 tons were recycled and 122,000 tons were recycled and sold via the designated body (see Fig. II-21(d)).
With respect to paper containers/packaging and plastic containers/packaging, which were included in the scope of regulation in 2000, the volume of those separately collected in FY2007 was 84,000 tons and 672,000 tons (see Fig. II-19). Meanwhile, the volume of those recycled was 80,000 tons and 640,000 tons (see Fig. II-20), out of which 27,000 tons and 375,000 tons were recycled and sold via the designated body (see Fig. II-21(e)(f)), respectively.
0
200,000
100,000
300,000
400,000
500,000
700,000
600,000
800,000
332,417 290,570 185,644 643,114283,44182,957
327,230 286,627 181,060 672,065283,86683,804
Colorless glass bottles Amber glass bottles Glass bottles of other colors Paper containers/packaging PET bottles Plastic containers/packaging(including white (styrofoam) trays)
(Source: Ministry of the Environment)
339,019 292.323 181,385 609,215268,26681,815
292,775 243,916 107,533 -21,361-
322,284 274,374 136,953 -47,620-
326,110 290,127 149,332 -75,811-
352,386 312,539 164,551 100,810124,87334,537
355,157 311,993 162,481 197,273161,65149,723
348,698 304,172 163,903 282,561188,19457,977
356,977 309,857 165,011 401,697211,75376,878
346,671 301,262 166,076 471,488238,46969,197
341,748 293,825 174,082 558,997251,96271,012
(tons)
FY1997
FY1998
FY1999
FY2000
FY2001
FY2002
FY2003
FY2004
FY2005
FY2006
FY2007
FY2008
Fig. II-19 Volume of Containers and Packaging Collected
100
80
60
40
20
0
FY1997 49.5% 49.5% 47.2% -19.4%-
FY1998 57.2% 57.3% 54.8% -31.1%-
FY1999 61.2% 61.3% 58.9% -37.3%-
FY2000 81.1% 81.5% 79.5% 27.3%72.5%10.6%
FY2001 83.9% 84.3% 83.4% 34.5%80.6%12.4%
FY2002 86.4% 86.8% 84.7% 40.4%84.9%16.2%
FY2003 92.3% 92.6% 91.0% 53.4%91.6%23.7%
FY2004 92.2% 92.6% 91.3% 57.5%91.6%25.3%
FY2005 95.1% 95.4% 94.7% 62.9%94.7%29.9%
FY2006 95.0% 94.8% 94.5% 67.5%95.9%32.8%
FY2007
FY2008
95.6% 95.9% 95.3% 71.8%97.2%38.4%
95.7% 95.8% 95.3% 72.7%98.1%35.8%
Colorless glass bottles Amber glass bottles Glass bottles of other colors Paper containers/packaging PET bottles Plastic containers/packaging(including white (styrofoam) trays)
(Source: Ministry of the Environment)
Fig. II-18 Number of Municipalities Carrying Out Collection of Sorted Waste

29
Colorless glass bottles Amber glass bottles Glass bottles of other colors Paper containers/packaging PET bottlesPlastic containers/packaging
(including white (styrofoam) trays)
275,119
303,240
307,237
334,549
339,443
337,888
345,208
334,659
228,170
256,227
272,559
294,959
298,785
293,240
297,510
291,868
95,190
123,227
134,084
150,139
152,965
156,856
157,217
157,145
-
-
-
77,568
180,306
268,640
384,865
455,487
19,330
45,192
70,783
117,877
155,837
183,427
204,993
231,377
-
-
-
26,310
44,675
54,145
69,508
59,668
327,796 281,524 167,209 538,123244,02663,031
328,755 281,799 174,004 582,876261,26578,627
0
100,000
200,000
300,000
400,000
500,000
600,000
700,000(tons)
322,444 279,896 179,426 616,079277,01581,383
317,258 276,935 170,080 644,327277,42182,026
FY1997
FY1998
FY1999
FY2000
FY2001
FY2002
FY2003
FY2004
FY2005
FY2006
FY2007
FY2008
Fig. II-20 Volume of Containers and Packaging Recycled (Volume of Those Delivered to Recycling Businesses)
Fig. II-21 Trends in the Volume of Sales of Containers and Packaging Recycled via the Designated Body and the Use of Recycled Products
Raw materials for glass bottle
Other uses
FYVolume of Sales
Raw materials for glass bottle
(percent distribution) Other uses
(percent distribution)43,926
(1.8) (2.1) (4.6) (3.2) (19.0) (9.2) (9.5) (2.5)(3.2)
0
20,000
40,000
60,000
80,000
100,000
(tons)
120,000
979
199744,905
(97.8)
(2.2)
91,783
3,389
200795,172
(96.4)
(3.6)
91,505
2,327
200893,832
(97.5)
(2.5)
1998 1999 2000 2001 2002 2003 2004 2005 200657,425 63,838 73,804 90,333 94,341 104,672 101,566 96,514 102,04656,376 62,501 70,388 87,429 76,436 95,006 91,877 93,472 99,488(98.2) (97.9) (95.4) (96.8) (81.0) (90.8) (90.5) (96.8) (97.5)
1,049 1,337 3,416 2,904 17,905 9,666 9,689 3,042 2,558
(a) Colorless glass bottles
Raw materials for glass bottle
Other uses
45,057
(4.2) (17.1) (18.7) (28.1) (31.2) (10.1) (9.8) (9.2)(12.4)
0
30,000
60,000
90,000
(tons)
150,000
120,000
1,317
46,374
(97.0)
(3.0)
102,148
10,542
112,690
(90.6)
(9.4)
102,826
8,734
111,561
(92.2)
(7.8)
70,159 88,532 103,701 121,696 123,439 119,042 121,707 117,455 115,72767,189 73,395 84,297 87,469 84,885 107,044 109,756 102,935 105,051(95.8) (82.9) (81.3) (71.9) (68.8) (89.9) (90.2) (87.6) (90.8)
2,970 15,137 19,404 34,227 38,554 11,998 11,951 14,520 10,676
FYVolume of Sales
Raw materials for glass bottle
(percent distribution) Other uses
(percent distribution)
1997 2007 20081998 1999 2000 2001 2002 2003 2004 2005 2006
(b) Amber glass bottles

30
1997 26,531
8,821(33.2)
17,711(66.8)
1998 53,56414,818(27.7)
38,746(72.3)
1999 58,936
8,589(14.6)
50,347(85.4)
87,183
7,303(8.4)
79,880(91.6)
92,734
5,185(5.6)
87,549(94.4)
100,037
5,332(5.3)
94,705(94.7)
94,05115,069(16.0)
78,982(84.0)
97,20519,816(20.4)
77,389(79.6)
107,194
22,967(21.4)
84,227(78.6)
108,426
17,209(15.9)
91,217(84.1)
103,460
26,707(25.8)
76,753(74.2)
108,020
19,880(18.4)
88,140(81.6)
0
20,000
40,000
60,000
80,000
100,000
120,000
Raw materials for glass bottle
Other uses
(tons)
FYVolume of Sales
Raw materials for glass bottle
(percent distribution) Other uses
(percent distribution)
2007 20082000 2001 2002 2003 2004 2005 2006
(c) Glass bottles of other colors(tons)
Volume of Sales
■ Textiles (percent distribution)
■ Plastic sheets(percent distribution)
■ Bottles (percent distribution)
■ Molded products(percent distribution)
■ Others (percent distribution)
1997 8,3986,077(72.4)1,114(13.2)
756(9.0)366
(4.4)87
(1.0)
1998 23,90916,895(70.7)5,218(21.8)
211(0.9)
1,265(5.3)320
(1.3)
1999 39,60525,188(63.6)
11,450(29.0)
179(0.4)
2,530(6.4)258
(0.6)
2000 68,57538,317(55.9)
23,407(34.1)
326(0.5)
3,802(5.5)
2,723(4.0)
2001 94,91248,659(51.3)
37,510(39.5)
381(0.4)
5,330(5.6)
3,032(3.2)
2002 112,48558,940(52.4)
45,632(40.5)
606(0.6)
5,314(4.7)
1,993(1.8)
2003 124,29857,445(46.2)
50,021(40.2)
11,312(9.1)
3,944(3.2)
1,576(1.3)
2004 147,69863,554(43.0)
54,589(37.0)
23,351(15.8)4,239(2.9)
1,965(1.3)
2006 106,44555,458(52.1)
41,088(38.6)6,493(6.1)
3,087(2.9)319
(0.3)
2007 111,84761,292(54.8)
43,258(38.7)3,915(3.5)
2,796(2.5)559
(0.5)
2008 121,50067,685(55.7)
46,810(38.5)3,278(2.7)
2,965(2.4)761
(0.6)
2005 143,03264,103(44.8)
58,788(41.1)
12,134(8.5)
6,217(4.3)
1,790(1.3)
■ Textiles
■ Plastic sheets
■ Bottles
■ Molded products
■ Others
0
20,000
40,000
60,000
80,000
100,000
120,000
140,000
160,000
FY
(d) PET bottles
(tons)
■ Papermaking materials
■ Materials other than papermaking materials
■ Refuse-derived fuel
2000 10,2304,546(44.4)2,566(25.1)3,118(30.5)
2001 20,79315,301(73.6)1,196(5.7)
4,295(20.7)
2002 24,35820,284(83.3)
157(0.7)
3,917(16.0)
2003 29,88126,969(90.3)
15(*0.0)2,897(9.7)
2004 27,16325,053(92.2)
203(0.8)
1,907(7.0)
2006 28,09326,689(95.0)
47(0.2)
1,357(4.8)
2007 27,08325,813(95.3)
197(0.7)
1,073(4.0)
2008 26,66025,125(94.2)
262(1.0)
1,274(4.8)
2005 26,47124,894(94.0)
223(0.9)
1,354(5.1)
0
6,000
12,000
18,000
24,000
30,000
FY
■ Papermaking materials(percent distribution)
■ Refuse-derived fuel(percent distribution)
■ Materials other than papermaking materials(percent distribution)
Volume of Sales
(e) Paper containers/packaging(tons)
Volume of Sales
■ Materials(percent distribution)
■ Liquefaction (percent distribution)
■ Blast furnace (percent distribution)
■ Coke (percent distribution)
■ Gasification (percent distribution)
■ White trays (Materials)(percent distribution)
■ White trays (liquefaction)(percent distribution)
2000 43,8304,882(11.1)3,348(7.6)24,656(56.3)9,771(22.3)638
(1.5)520
(1.2)13
(*0.0)
2001 118,4709,246(7.8)7,886(6.7)42,306(35.7)50,631(42.7)7,529(6.4)777
(0.7)95
(*0.0)
2002 180,16223,426(13.0)6,828(3.8)46,621(25.9)91,175(50.6)11,188(6.2)921
(0.5)3
(*0.0)
2003 256,15041,626(16.2)5,847(2.3)58,811(23.0)120,767(47.1)28,076(11.0)1,022(0.4)
0(0.0)
2004 309,53756,035(18.1)6,426(2.1)55,870(18.0)137,980(44.6)52,203(16.9)1,023(0.3)
0(0.0)
2006 380,434131,256(34.5)4,389(1.2)37,282(9.8)
152,103(40.0)54,559(14.3)845
(0.2)0
(0.0)
2007 381,163149,678(39.3)4,258(1.1)31,259(8.2)
138,626(36.4)56,531(14.9)810
(0.2)0
(0.0)
2008 374,590171,586(45.9)2,730(0.7)15,605(4.2)
137,209(36.7)46,682(12.5)778
(0.2)0
(0.0)
2005 365,92488,852(24.2)6,993(1.9)36,444(10.0)174,061(47.6)58,641(16.0)933
(0.3)0
(0.0)
■ Materials■ Liquefaction■ Blast furnace■ Coke ■ Gasification■ White trays (Materials)■ White trays (liquefaction)
0
50,000
100,000
150,000
200,000
250,000
300,000
350,000
400,000
FY
(f) Plastic containers/packaging

31
Sorted collection Recycling
Fiber 68
Fiber 47
Fiber 7
Recycled products
Exported, etc.
Domestic recycling
Designated bodies154
Others130
Separately collected by municipalities284
Fig. II-22 Flow of Collection and Recycling of PET Bottles (FY2008)
(unit: 1,000 tons)
Sorted collection Recycling
Plastic products172
Thermal decomposition oils 3
Blast furnace reducers 17
Coke ovensChemical raw materials
137
Synthetic gases 47
Recycled products
Designated bodies 604
Others
Separately collected by municipalities 672
Fig. II-23 Flow of Collection and Recycling of Plastic Containers and Packaging (FY2008)
(unit: 1,000 tons)
Unit bid price (weighted average)
(unit: 10,000 yen/ton)
Colorless glass bottles
Plastic (average)
Amber glass bottles
Glass bottles of other colors PET bottles Paper
Plastic (material recycling) Plastic (chemical recycling)
Plastic(material recycling)
Plastic (average)
Plastic(chemical recycling)
Glass bottlesof other colors
Amber glass bottlesColorless glass bottlesPaper
PET bottles
1997 2000 2001 2002 2003 2004 2005 2006 2007 2008 2009
Source: Newsletter No. 46, The Japan Containers and Packaging Recycling Association
Figures in parentheses indicate the amount of handling by product.
Highest unit bid prices offered by recycling businesses

[1] Title of the law: Law for Recycling of Specified Kinds of Home Appliances (Home Appliance Recycling Law)[2] Date put into force: April 2001 (promulgated in June 1998)[3] Purpose: Clarifying the role-sharing between consumers, retailers and home appliance manufacturers in managing used home
appliances disposed of by households, with the aim of promoting waste reduction and recycling.[4] Outline of the law: The law provides for a collection and recycling system in which home appliance retailers take charge of
collecting used home appliances and home appliance manufacturers take charge of recycling collected appliances (see Fig. II-26).
32
6 Home Appliance Recycling Law
[2] Home appliance retailers (Those who sell home
appliances shall collect and transport them.)
• Taking back home appliances, which they have sold, from businesses that dispose of them
• Taking back home appliances at the request of consumers who buy new ones to replace old ones and proper delivery of collected home appliances to the manufacturers, etc.
• I ssuing home appl iance recycl ing coupons*3 to manufacturers and the designated body and sending copies to dischargers
• Displaying the costs of collecting and transporting in shop windows
[3] Home appliance manufacturers and importers
(Those who manufacture home appliances shall
recycle them.)
• Taking back home appliances, which they have manufactured or imported, from retailers
• Recycling these home appliances• Publishing the costs for recycling these home appliances
(recycling fees)
[4] Designated body (Association for Electric Home
Appliances)
• Recycling home appliances whose manufacturers are unknown or those entrusted by specific manufacturers (manufacturers whose production volume is less than 900,000 units for air conditioners, 900,000 units for televisions, 450,000 units for refrigerators, and 450,000 units for washing machines)
[5] Municipalities
• Measures to promote collecting, transporting and recycling
(1) Home appliances to be regulated
[1] Air conditioners[2] CRT-type televisions, liquid crystal televisions, plasma
televisions*1[3] Refrigerators, freezers[4] Washing machines, clothes driers*1
(2) Recycling
“Recycling” means removing parts and materials from used home appliances and reusing them as parts or raw materials for new products, or assigning them, with or without charge, to those who will reuse them. “Recycling” includes thermal recycling or using waste as fuel. However, it is currently required to satisfy a certain recycling level*2 only in terms of recycling waste as parts or raw materials of new products.
Recycling level required under the law
(3) Responsibilities of parties concerned
[1] Consumers (Those who use home appliances
shall pay for recycling costs.)
• Appropriate disposal• Payment of costs for collection and recycling
*1 Liquid crystal televisions, plasma televisions, and clothes driers became
subject to the regulation as of April 2009.
*2 Recycling rate =
*3 The Association for Electric Home Appliances operates the home appliance
recycling coupon system, which is convenient for paying and collecting
recycling fees. Recycling fees may be paid and collected via retailers or by
Weight of materials recycledWeight of units treated for recycling
Air conditioner LCD TV and plasma television
Tube television
Refrigerator-freezer Washing machine
Definitely
70% 50%55%
60% 65%
Recyclingrules
Preferably
Definitely
Preferably
Definitely
PreferablyDefinitely
Preferably
DefinitelyPreferably
Fig. II-25 Recycling Level Required under the Law

33
Present Situation of Recycling
The four items have been taken back by retailers or municipalities, and then recycled by manufacturers/importers or the designated body (Association for Electric Home Appliances) at 49 recycling plants for home appliances (as of February 2010).
In FY2008, manufacturers/importers or the designated body took back a total of about 12.73 million units (up by 5.9% compared to the previous year) of the four items at take-back sites, and the recycling rates for the four items were 74% to 89% (see Fig. II-27). All these recycling rates exceeded the target levels under the Home Appliance Recycling Law.
With regard to the composition of the weight of materials recycled, iron, copper, aluminum and glass account for the majority of the total, depending on products (see Figs. II-28 and II-29).
CFCs used as refrigerants for air conditioners, refrigerators/freezers, and clothes driers, and CFCs in the heat insulator of refrigerators/freezers are also collected and decomposed.
The ratio of home appliances illegally discarded to the number of units taken back has varied between 1% and 2% during the last few years (see Fig. II-30). The total number of the four items illegally discarded in FY2008 was 113,496 (1,465 municipalities, 121.56 million people: 95.2% of total population). This was a decrease of 2,319 units (2%) compared to the same term of the previous year. Continued investigation of the actual situation is needed.
Air conditioner: 3,675 yen
Television set: 3,150 yen
Refrigerators Freezers: 4,830 yen
washing machine: 3,675 yen
34949
2,6252,835
4,830
2,520
Fig. II-26 Flow of Recycling of Used Home Appliances

34
0
1000
2000
3000
4000
5000
6000
0
20000
40000
60000
80000
100000
120000
140000
160000
180000
0
20
40
60
80
100
■Air conditioners ■Television sets ■Refrigerators ■Washing machines
(thousand units) Number of units treatedfor recycling
(tons) Recycling rate(%)
Source: Association for Electric Home Appliances
2821
1,968
2746
5,365
Number of units taken backat designated take-back sites
94,010
82,749
163,056156,546
8489
74
89
Recycling rate = weight of materials recycled
Weight of units treated for recycling
Fig. II-27 Recycling by Manufacturers/Importers and the Designated Body (FY2008)
Other valuablematerials
8,849 Other valuable materialsOther valuable materials
Other valuable materials
Fig. II-28 Weight of Materials Recycled by Manufacturers/Importers and the Designated Body (FY2008)
Air conditioners Television sets Refrigerators Washing machinesOthers (printed boards, gas, other alloy)9.2%
Iron/ iron alloy45.9%
Copper/copper alloy17.0%
Plastic17.9%
Aluminum/Aluminum alloy10.0%
Glass61.7%Plastic
14.4%
Iron/ iron alloy12.4%
Printed boards6.7%
Others(copper alloy, aluminum alloy)3.6%
Iron/ iron alloy46.3%
Plasti44.1%
Others(aluminum/ aluminum, gas)9.6%
Iron/ iron alloy50.1%
Plastic35.7%
Others(other alloys) 14.2%
Source: Association for Electric Home Appliances
Fig. II-29 Composition of Home Appliances
April May June July August September October November December January February March6000
9000
12000
15000
FY2007 FY2008
* The number of units illegally discarded across the country was estimated based on findings from 1,762 municipalities from FY2005 to FY2006.
Source: Ministry of Environment, “Status of illegally discarded home appliances (February 22, 2010)”
Fig. II-30 Ratio of Number of the Four Items Illegally Discarded to the Number of Units Taken Back
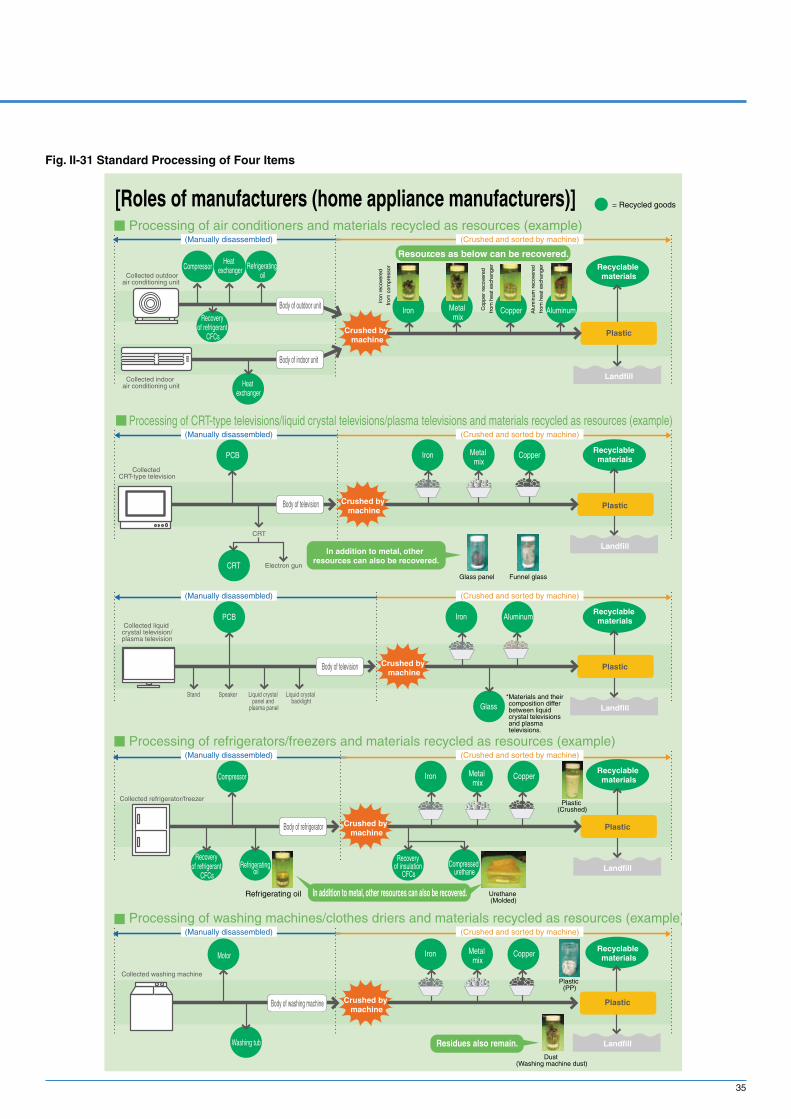
35
Fig. II-31 Standard Processing of Four Items
= Recycled goods[Roles of manufacturers (home appliance manufacturers)]Processing of air conditioners and materials recycled as resources (example)
Collected outdoor air conditioning unit
Collected indoor air conditioning unit
Collected CRT-type television
Collected liquid crystal television/plasma television
Collected refrigerator/freezer
Collected washing machine
CRT
Electron gun
Stand Speaker Liquid crystal backlight
Liquid crystal panel and
plasma panel
Glass panel Funnel glass
Plastic (Crushed)
Plastic (PP)
Dust (Washing machine dust)
Urethane (Molded)
Body of outdoor unit
Body of indoor unit
Body of television
Compressor
Compressor
Motor
Washing tub
Heat exchanger Refrigerating
oil
Iron CopperMetal mix
Iron CopperMetal mix
Iron CopperMetal mix
Iron CopperMetal mix
Recovery of refrigerant
CFCs
Heat exchanger
PCB
PCB
Body of television
Body of refrigerator
Body of washing machine
CRT
Recovery of refrigerant
CFCsRefrigerating
oil
Recovery of insulation
CFCsCompressed
urethane
(Manually disassembled) (Crushed and sorted by machine)
Processing of CRT-type televisions/liquid crystal televisions/plasma televisions and materials recycled as resources (example)(Manually disassembled) (Crushed and sorted by machine)
Processing of refrigerators/freezers and materials recycled as resources (example)(Manually disassembled) (Crushed and sorted by machine)
Processing of washing machines/clothes driers and materials recycled as resources (example)(Manually disassembled) (Crushed and sorted by machine)
(Manually disassembled) (Crushed and sorted by machine)
Refrigerating oil
Crushed by machine
Crushed by machine
Crushed by machine
Crushed by machine
Crushed by machine
In addition to metal, other resources can also be recovered.
Recyclable materials
Plastic
Landfill
Recyclable materials
Recyclable materials
Recyclable materials
In addition to metal, other resources can also be recovered.
Residues also remain.
Plastic
Plastic
Landfill
Landfill
Plastic
Landfill
Recyclable materials
Plastic
Landfill
Resources as below can be recovered.
Iron
rec
over
ed
from
com
pres
sor
Cop
per
reco
vere
d
from
hea
t exc
hang
er
Aluminum
Iron
Glass
Aluminum
Alu
min
um r
ecov
ered
from
hea
t exc
hang
er
*Materials and their composition differ between liquid crystal televisions and plasma televisions.

36
7 End-of-Life Vehicle Recycling Law
(1) Vehicles to be regulatedNearly all four-wheel vehicles (including large vehicles and
commercial vehicles, such as trucks and buses)(2) Responsibilities of the parties concerned
[1] Car owners (end users)Payment of recycling fee, delivering end-of-life vehicles
to ELV-collecting businesses that are registered with local authorities[2] ELV-collecting businesses
Taking back ELVs from end users and then delivering them to CFC-collecting businesses and auto-dismantling businesses[3] CFC-collecting businesses
Collecting fluorocarbons properly from ELVs in accordance with the recycling standards and handing over ELVs to car manufacturers/importers[4] Auto dismantling businesses
Dismantling ELVs properly in accordance with the recycling standards, collecting airbags and handing over ELVs to car manufacturers/importers[5] Shredding businesses
Shredding dismantled ELVs (press, cutting and shredding) in accordance with the recycling standards, handing over shredder dust (waste remaining after shredding dismantled ELVs) to car manufacturers/importers
[6] Car manufacturers/importersCollecting and recycling CFCs, airbags and shredder dust
from ELVs that are manufactured and imported by themselves
(3) Payment of recycling fee[1] People who purchase new cars shall pay recycling fees upon purchase. People who own any cars for which they have not paid recycling fees shall pay the fees by the time they dispose of such cars.[2] Recycling fees are determined on every car by individual car manufacturers/importers, depending on the possible quantity of shredder dust and CFCs, number of airbags and simplicity of taking off airbags.[3] The average fee for recycling shall be disclosed by car manufacturers/importers. Visit the websites provided by car manufacturers/importers, or the website for the automobile recycling system (http://www.jars.gr.jp).
Fig. II-32 Recycling Uses of ELVs
[1] Title of the law: Law on Recycling of End-of-Life Vehicles (ELV Recycling Law)[2] Date put into force: January 1, 2005 (promulgated in July 2002)[3] Purpose: Construct a recycling system to ensure recycling and proper disposal of ELVs role-sharing of businesses,
beginning with car manufacturers.[4] Outline of the law: The law provides role-sharing between car owners, ELV-collecting businesses, car manufacturers, and
car importers to build a recycling-oriented society in which waste is reduced and resources are used with care.

37
Fig. II-33 Concept of the ELV Recycling Law
(Source: Data by Automobile Recycling WG, Waste Prevention and Recycling Subcommittee, Environment Committee, Industrial Structure Council)

38
(4) State of compliance with the End-of-Life Vehicle Recycling LawAround 100,000 automobile-related business operators, including dealers and shredders, are obliged to report the collection and
transportation of ELVs to the ELV Recycling System on the Internet (transfer report). Collection of approximately 3,580,000 ELVs was reported in FY2008.
Table II-3 Results of Electronic Manifest by Process
ProcessNo. of reports No. of reports
FY2008 FY2007 FY2008 FY2007
Process 3,580,882 3,708,996 3,585,291 3,717,347Recovery of CFCs 2,798,418 2,792,803 2,794,004 2,792,951
Disassembly *1) 3,716,791(137,361)
3,867,341(149,065)
3,713,619(138,003)
3,875,309(149,445)
Shredding *1) 6,129,797(2,610,501)
6,294,740(2,623,147)
6,185,373(2,611,053)
6,341,740(2,627,370)
*1 Figures in parentheses indicate the number of transfer reports in the same process.
Table II-4 Collection of Three Items by Carmakers]
ItemNo. of reports
FY2008 FY2007
CFCs 2,717,277 2,662,431Airbags 1,306,233 1,002,406
ASR 3,229,027 3,2889,507
(5) Recycling fee deposits
Table II-5 Result in FY2007 by Time of Deposit
Time of deposit
No. of vehicles Deposit (unit: \1,000)
FY2008 Cumulative total after law enforcement FY2008
Cumulative total after law enforcement
New vehicle registration 4,710,448 23,218,225 52,574,067 257,394,656
Regular inspection ─ 63,044,979 ─ ─Collection 512,910 6,448,169 2,734,219 46,571,107
Total 5,223,358 92,771,371 55,308,286 912,075,297(Note 1) Cumulative total after law enforcement: The cumulative total between January 2005 and March 2006. The same applies to the rest of this
document.(Note 2) The number of ELVs does not exactly coincide with the number of vehicles sold due to the presence of ELVs excluded from the ELV law and
the time lag in paying deposits.(Note 3) The deposit system at the time of periodic inspection was terminated at the end of February 2008.
Table II-6 Number of Vehicles on Deposit, and Outstanding Amount of Deposits as of the End of FY2007
The number of vehicles and the balance of the recycling fee deposit given by subtracting the money paid to relevant business operators, reimbursement for used cars exported overseas, and specified recycling deposit, etc. from the cumulative total of the recycling fees after law enforcement.
No. of vehicles *1) Amount of deposit (unit:\1,000)
74,767,000 770,655,774*1) Equipment fitted later is not included.
(Source: Data by Automobile Recycling WG, Waste Prevention and Recycling Subcommittee, Environment Committee, Industrial Structure Council)

5 million yen or more(contracting fee)
100 million yen or more(contracting fee)
500m2 o or more(total floor space)
80m2 or more(total floor space)
Standard sizeType of construction
Other construction work (civil engineering work)
Repairing or remodeling (renovating) of a building
Construction of a new building or extension
Demolition of a building
(1) Construction works to be regulated
Notes:1. Demolition work means demolishing parts of a building, such as the
foundation, foundation piles, walls, posts, roof trusses, bases, diagonal framing, floor covers, roof plates or horizontal framing, which support the weight of the building or its live load, snow, wind pressure, earth pressure or hydraulic pressure, or earthquake or other vibration or impact.
2. Work for demolishing part of a building or constructing part of a new building or extension shall be subject to the regulation if the total floor area of the part concerned falls under the standard size. Reconstruction work shall be regarded as a combination of demolition and construction of a new building (or extension).
(2) Construction materials to be regulated
site is more than 50 km away from the nearest recycling
facility.
construction waste (see Fig. II-34).
Total7,700
million tons
Source: Ministry of land, Infrastructure, Transport and Tourism
Others(metal scraps, plastic waste,paper waste)363million tons(5%)
Concrete mass3,215 millionn tons(42%)
concrete mass2,606 million tons(34%)
Construction sludge752million tons(10%)
Wood generatedin construction471 million tons(6%)
Mixed construction waste293million tons(4%)
Source: Committee for the Promotion of Recycling of Construction By-product,(2004)
Recycled resources(Law for Promotion of Effective
utilization of Resources)
Construction By-products
Products that can be useddirectly as raw materials
Waste(Waste Management Law)
Products that cannotbe used as resources
dangerous objects
Products that can beused as resources
=Recycling of these items is mandatory under the
Construction Material Recycling LawConstruction by-products are products generated as byproducts
from construction; they include recycled resources and waste.
Note 1: The aggregate total may not correspond to the total amount because figures for individual amounts are rounded off.
Note 2: The survey is carried out every five years.
Fig. II-34 Amount of Construction Waste Discharged, by Product Category (FY2005)
Fig. II-35 Relationship between Construction By-products, Recycled Resources and Waste
39
8 Construction Material Recycling Law
[1] Title of the law: Law on Recycling Construction-Related Materials (Construction Material Recycling Law)[2] Date put into force: May 2002 (promulgated in May 2000)[3] Purpose: To promote sorting and recycling of designated construction materials that are discharged in the process of
demolishing buildings[4] Outline of the law: The law provides for the process of sorted demolition and recycling carried out by contractors and the
contractual procedures to be followed by the client and the prime contractor for construction works (see Fig. II-37).

40
Sorted demolitionand so on
s detareneg dooW
ru n
s Wo s
Fig. II-36 Flow of Sorted Demolition and Recycling
Fig. II-37 Flow of Sorted Demolition and Recycling: from placement of order to implementation
Fig. II-38 Example of Recycling of Concrete Aggregate

41
(3) State of compliance with the Construction Material Recycling Law
Fig. II-39 Number of Notifications concerning Relevant Constructions according to Article 10 of the Law
105,
309
175,
755
187,
621
203,
295
16,0
07
24,2
93
25,1
51
22,8
22
31,0
49
32,5
79
38,5
14
43,6
74
231,
097
188,
791
274,
397
Demolition of building Construction, repair, and remodeling of building
Demolition and building of other structures
Total
FY2002
FY2003
FY2004
FY2005
FY2006
FY2007
FY2008
105,
309
175,
755
187,
621
193,
565
203,
295
188,
791
174,
538
16,0
07
24,2
93
25,1
51
26,6
26
27,4
28
22,8
88
21,7
51
22,8
22
31,0
49
32,5
79
38,5
14
43,6
74
45,1
68
47,5
01
144,
138
231,
097
245,
351
256,
847
243,
790
258,
705
0
50,000
100,000
150,000
200,000
(Notification)
300,000
250,000
Fig. II-40 Number of Notifications concerning Relevant Constructions according to Article 11 of the Law
5,32
4
5,90
9
5,21
5
4,68
8
4,70
9
5,76
8
5,76
8
3,03
9
2,90
3
2,90
3
3,22
5
3,22
5
4,62
4
4,20
6
150,
356
159,
477
119,
211
111,
535
128,
144
140,
991 159,
886
119,
992
126,
959
170,
010
136,
057
149,
531
111,
535
119,
992
Demolition of building Construction, repair, and remodeling of building
Demolition and building of other structures
Total
FY2002
FY2003
FY2004
FY2005
FY2006
FY2007
FY2008
0
100,000
140,000
120,000
160,000
180,000
40,000
20,000
60,000
80,000
200,000
(Notification)
220,000
5,32
4
5,90
9
5,21
5
4,68
8
4,70
9
5,76
8
4,54
3
3,03
9
2,90
3
3,13
2
3,22
5
3,22
5
4,62
4
4,20
6
150,
356
159,
477
119,
211
111,
556
102,
80612
8,14
4
140,
991 159,
886
120,
227
110,
481
126,
959
170,
010
136,
057
149,
531
3,347
5,723
6,827
7,6368,393
7,831 7,660 7,878
FY2001 FY2002 FY2003 FY2004 FY2005 FY2006 FY2007 FY2008
Registration
9,000
0
1,000
2,000
3,000
4,000
5,000
6,000
7,000
8,000
* Data for FY2002 is before the enforcement of the Construction Material Recycling Law (June 2002–March 2003).
* Data for FY2002 is before the enforcement of the Construction Material Recycling Law (June 2002–March 2003).
Fig. II-41 Number of Registered Demolishing and Construction Business Operators according to Article 21 of the Law
* The data is the number o f r e g i s t r a t i o n s a t t h e end o f each f i sca l year (source: Ministry of Land, Infrastructure, Transport and Tourism).

42
9 Food Recycling Law
(1) Food waste to be regulated[1] Unsold or uneaten food waste generated in the process of
distribution and consumption[2] Leftover plant and animal food generated in the process
of manufacturing, processing and cooking food products (excluding kitchen waste discharged from households)
(2) Food-related businesses to be regulated[1] Businesses engaged in manufacturing/processing food
products for wholesale or retail sales* e. g., food manufacturers, green grocers, department stores,
supermarkets
[2] Restaurants and other food-service businesses* e. g., cafeterias, restaurants, hotels, Japanese-style hotels,
wedding centers, floating restaurants
(3) Role of parties concerned[1] Food-related businesses
All food-related businesses engaged in manufacturing and distributing food products or providing catering and restaurant services shall achieve the target specified for individual sectors of the food industry for handling of food waste, etc. (prevention of waste generation, recycling, reduction of final disposal, and heat recovery).
◊ Obligation to submit a regular reportFood-related business operators who produce more than
the specified quantity (100 tons/year) of food waste, etc. (copious generator) are required to submit a regular annual report to the competent minister.
For franchise chain businesses, whether a franchise business is a copious generator or not is determined by the amount of food waste generated by the franchisees.
[2] ConsumersConsumers shall prevent generation of food waste by
improving their methods of buying and cooking food and by using recycled products.
[3] The national and local governmentsThe national and local governments shall implement
measures to promote recycling of recyclable food resources.
(4) Target of recycling and priority of measuresAim: Achieve the recycling target specified for each sector
of food industry by FY2012.• Food manufacturer 85% (81%) • Food retailer 45% (31%)• Food wholesaler 70% (61%) • Catering service/restaurant 40% (21%)* Figures in parentheses indicate results from FY2005.
[1] Prevention: Preventing generation of food waste[2] Recycling: Recycling of food waste as raw materials
for producing fertilizer, feedstuff, fat and oil products, methane, ethanol, or fuels and reducers manufactured through carbonization processes. • Fertilizers: compost made by aerobic fermentation,
organic fertilizer made by drying• Animal feeds: feed for livestock or aquarium fish
made by pressure steaming, aerobic fermentation or dehydration through frying
• Oil and fat products: cooking oil, soap• Methane: biogas made by anaerobic fermentation of
kitchen waste (composed of methane gas (about 60%) and carbon dioxide gas (about 40%)), used as fuel
• Ethanol: Used as an alternative of oil• Fuels and reducers manufactured through carbonization
processes: Used as alternatives for charcoal.
[3] Reduction: reducing the amount of food waste by dehydration, drying, fermentation or carbonization (roasting)
[4] Heat Recovery: Heat is recovered or transferred from food waste.
(5) Exceptions in the Food Recycling LawIt is necessary to execute widespread recycling to execute the recycling smoothly.Therefore, the Food Recycling Law provides exceptions that negate the need for obtaining the following permissions usually
required for the collection and transportation of municipal solid waste (MSW):(1) Permission for unloading is not needed if food waste is carried in the site of a recycling business operator registered by the
competent minister.(2) Permission for the collection and transportation of food waste is not needed as long as the range of a recycling business plan
approved by the competent minister is not exceeded. (If food waste is subject to the Waste Management Law, the recycling business operator is required to follow procedures stipulated in the said law, such as obtaining permission to conduct disposal business or establish waste disposal facilities. (If food waste is applicable to waste of Waste Management Law, it is necessary to follow procedures concerned with permission of waste disposal businesses and permission to establish a waste disposal facility.)
From the viewpoint that attempts the simplification of procedures, the notification of manufacturing and sales is assumed to be unnecessary for registration recycling businesses, as also stated in the Law Concerning Safety Assurance and Quality Improvement of Feeds, and Manure Managing Law.
[1] Title of the law: Law Concerning Promotion to Recover and Utilize Recyclable Food Resources (Food Recycling Law)[2] Date put into force: May 2001 (promulgated in June 2000) Amended in December 2007 (promulgated in June 2007)[3] Purpose: To prevent and reduce food waste discharged from food-related businesses, thereby decreasing the amount for
final disposal, as well as to promote recycling of such waste as fertilizers and animal feeds.[4] Outline of the law: The law provides for measures to be taken by food-related businesses.

43
Fig. II-43 Food Waste and Recyclable Food Resources
Table II-7 Amount of Food Waste Generated and Recycled (FY2007)(Unit: %)
Waste generated a
year (10,000 tons)
Recycling rate (%)
Reduction of generation
(%)
Reduction in quantities
(%)
Recycled(%)
Allocation of recycled waste by usage (%)
FertilizerAnimal feeds
Methane Oil and fat products
Food manufactures
493 81 5 3 73 41 50 6 3
Food wholesalers
74 62 4 1 56 69 23 ─ 7
Food retailers
263 35 4 2 30 67 26 ─ 7
Food-service businesses
305 22 3 2 15 28 31 ─ 40
Total 1,134 54 4 3 47 46 43 4 7
(Source: Department of Statistics, Ministry of Agriculture, forestry and Fisheries, “Actual condition survey on utilization of recyclable food resources (2007)”)
Note: The grand total may not match the sum of subtotals because figures are rounded off.
Production stage(Food manufacturing)
Distribution stage(Food Distribution)
Consumption stage(restaurants and households
Animal and plant waste
Food waste
RecycledUtilization of
Recyclable Food Resources
Unsold food and food waste
Cooking leftovers and
The law refers to food waste that can be
used as fertilizers, animal feeds and so
on as “Recyclable Food Resources.”
Food waste includes leftover plant and animal food generated in the process of manufacturing and cooking food products and unsold or uneaten food waste generated in the process of distribution and consumption.
= Permission is not needed.
(* The applicant is the recycling business operator.)
A City B City
[1] Registered Recycling Business System (Article 11)
Food related business Recycling business(Transport)(Registered)
Food circulation resource
(Loading) Permis-sion is needed.
[Exception: Permission for MSW collecting and transporting business is not needed at the unloading site.]
(Unloading) Permis-sion is not needed.
Fig. II-42 Exceptions concerning Permission for MSW Collecting and Transporting Business
Recycling business operator E
Stores owned by a food-related business operator
A City B City C City D City
E City F City
Farmer F
(*The applicant is the food-related business operator, recycling business operator or a person engaged in agriculture, forestry or fisheries.)
[2]Recycling Business Plan Approval System (Article 19)
Final entity of the recycling group
Agricu
ltura
l/stock
farm
/fishe
ry p
rod
uct, e
tc.
Waste disposal and cleaning operator A
Food circulation resource
[An exception that negates the need for permission for the collection and transportation of MSW within the range of the recycling plan]
Specific fertilizer/animal feed, etc.

44
10 Green Purchasing Law
Businesses, citizens
Local government
National government/ organizations
Manufacturers/ retailers
Green procurement generally means that, when purchasing raw materials, manufacturers choose eco-friendly goods or procure products from manufacturers that implement environmental considerations. In other words, it means procuring materials and parts from manufacturers that have established systems for environmental management and prohibited substance management. Large manufacturers have developed their own “green procurement criteria” and started taking measures accordingly. For example, 18 large information/communication device manufacturers unified their green procurement criteria in 2002 and included heavy metals and halogen compounds such as
cadmium (Cd), lead (Pb), mercury (Hg) and hexavalent chromium (Cr6+), which are contained in materials and parts, as common items to be disclosed. In July 2006, an information disclosure system with information on materials (Pb, Hg, Cd, and Cr6+ as well as two kinds of Br (bromine)-based flame retardants) contained in the product (home electric appliances and PCs) was introduced. Furthermore, the EU enforced the RoHS Directive, which prohibited home electric appliances and communication devices from containing the above six materials. Manufacturers have already started to take these measures.
Fig. II-44 Green Purchasing Law
[1] Title of the law: Law Concerning the Promotion of Eco-friendly Goods and Services by the State and Other Entities Authorities (Green Purchasing Law)
[2] Date put into force: April 2001 (promulgated in May 2000)[3] Purpose: To create and develop markets for recycled products and other products that contribute to the reduction of
environmental impact.[4] Outline of the law The law provides for the purchase of eco-friendly goods by the national government and national organizations (and provides
for local authorities’ obligation to make efforts), while requiring businesses and citizens to choose eco-friendly goods, to the greatest possible extent (see Fig. II-44).
The law designates the types of eco-friendly goods on which priority should be placed in procurement and judgment criteria with respect to 256 items (see Table II-8).

45
Table II-8 Designated Procurement Items and Criteria (256 in total)
CategoryDesignated procurement item
(Cabinet Decision on February 5, 2010)Criteria
Paper 8 items including information paper (copy paper, business forms, coated inkjet paper), printing paper (coated or uncoated printing paper), hygienic paper (toilet paper, facial tissue)
Composition of recycled pulp, Use of Forest Certification products and thinned wood, Degree of whiteness, etc.
Stationery 81 items including mechanical pencil, ball point pens, scissors, dust blowers, glue, files, binders, desk mats, windowed envelopes, blackboard dusters, can/bottle crushing machines
Use of recycled plastic, thinned wood, plant-origin plastic, Global warming potential
Office Furniture 10 items including chairs, desks, shelves, coat hooks, umbrella stands, blackboards
OA Machines 17 items including copiers, printers, facsimile machines, display devices, digital printers
Energy efficiency
Home appliances Refrigerators, freezers, refrigerators with freezer, electrically heated toilet seat, television
Air conditioners Air conditioners, gas-heat pump systems, heaters
Water heaters Electric hot water heaters, gas-water heaters, oil-fired water heaters, gas cookers
Lighting Fluorescent lighting apparatuses, fluorescent lamps, electric-lamp bulbs, LED lighting equipment, internal lighting type LED indicator lights
Vehicles 5 items including automobiles (Natural gas driven vehicles), ETC devices, etc.
Gas emissions, fuel consumption
Fire extinguisher Fire extinguishers Use of recycled extinguishing agent
Uniforms and Work clothes
Uniforms, work clothes Use of resin recycled from PET bottles
Interior fixtures and bedding
10 items including carpets, curtains, blankets, futons, bed frames, etc.
Work gloves Work gloves
Other fiver goods Tents, tarpaulins, protective netting
Facilities Photovoltaic generation systems, solar thermal systems, kitchen waste disposers, Water-saving apparatuses
Use of solar energy, Reduction of kitchen waste
Emergency supplies 6 items including PET bottle water, pouch-packed food, emergency canned fuel, blanket, etc.
Use-by date, Use of resin recycled from PET bottles
Public works projects Public works[1] Recycled materials (48 items including particle boards, ceramic-
quality tiles, blast furnace cement, permeable concrete, heat-insulating window sashes/doors, automatic water taps, light control systems, and sewage sludge fertilizer)
[2] Construction machinery (low-emission type, low-noise type)[3] Method of construction (5 items including recycling of construction
sludge s and road surface layer)[4] Special-purpose items (drainage paving, transparent paving and tree
planting on the roof)
Usage degree of recycled materials, emitted gas and noise
Services Energy-saving diagnoses, cafeterias, printing, tire retread, car repair, government office building management, plants management, cleaning, insect pest control, transportation and delivery, passenger transport, lighting facility supply, retailers in government office buildings, etc.
Contents of technical qualifications and diagnoses, kitchen waste disposal, composition of recycled paper, tire retread, use of recycled car parts
Note: For green purchasing, environmental labels such as Eco-Mark (certified by the Japan Environment Association) and Eco-Leaf (used by the Japan Environmental Management Association for Industry) are important information sources to distinguish eco-friendly goods.

46
11 METI Industrial Structure Council: Guidelines for Waste Treatment and Recycling
In the Guidelines for Waste Treatment and Recycling (by Product Category/Sector), the Industrial Structure Council indicates measures to be taken by businesses for waste treatment and recycling, with the aim of promoting voluntary actions.
The Guidelines were first developed in 1990 with respect to 14 product categories and 10 sectors. After repeated revisions for improvement and enhancement of the contents, they were revised in October 2005 for the seventh time, regulating 35 product categories and 18 sectors in
total, and were reviewed in October 2006.The Guidelines play two roles: [1] a collection of
voluntary measures to be undertaken with respect to product categories and sectors that are not regulated under recycling-related laws, and [2] implementation guidelines with respect to product categories and sectors that are regulated under recycling-related laws. Industries aim at achieving the numerical targets for recycling set in the guidelines as quickly as possible.
Paper
Plastics
Bicycles
Carpets
Lead batteries for automobiles and two-wheel vehicles
Fire extinguishers
Gas and kerosene equipment
Construction materials
Fluorescent tubes
Glass bottles
Automobiles
Home electrical appliances
Futons
Cassette gas cylinders
Pachinko game machines, etc.
Textile products
Bath tubs and bathroom units
Vending machines
Steel cans
Motorbikes
Spring mattresses
Dry cell batteries, button batteries
Aerosol cans
Personal computers and peripheral devices
Lubrication oil
Kitchen components
Single-use cameras
Aluminum cans
Tires
Office furniture
Small secondary batteries, etc.
Small gas cylinders
Iron and steel
Textiles
Car part manufacturing
Leasing
Gas
Paper/pulp manufacturing
Nonferrous metal manufacturing
Electronic/ electric device manufacturing
Cement manufacturing
Factory-produced housing manufacturing
Chemicals
Electricity
Oil refineries
Rubber product manufacturing
Glass sheet manufacturing
Automobile manufacturing
Distribution
Coal mining
Copying machines
Electric wires
Cellular phones and PHS
(1) Guidelines by product category (35 commodities)
(2) Guidelines by sector (18 businesses)
(Fore more details, see “Guidelines for Waste Treatment and Recycling (By Industry Sector),” METI)

47
(3) Guidelines by product category (target and future approach)
(4) Guidelines by sector (target and future approach)
* Colored portion of the items is covered by the Law for Promotion of Effective Utilization of Resources.
* Colored portion of the items is covered by the Law for Promotion of Effective Utilization of Resources.
1.Paper Paper recycling rate 62% [FY2010]2. Glass bottles Cullet-use rate 91% [FY2010]3. Steel cans Maintenance of recycling rate over 85%4. Aluminum cans Maintenance of collection and recycling rate
over 85%5. Plastics PET bottle collection rate over 80% [FY2014]6. Automobiles Recycling rate of 85% [FY2002 - FY2014]7. Motorbikes Recycling rate of 85% [FY2002 - FY2014]8. Tires Recycling rate of over 90% [FY2005]9. Bicycles Feasible recycling rate of 67%10. Home electric
appliancesRecycling rate: Air-conditioner 60%, TV 55%, refrigerator 50%, washing machine 50%
11. Spring mattresses Building of a recycling system is under review.12. Office furniture Measures for promoting 3R are under review.13. Carpets Reduction of lint within processes to 20% of
FY2001 [FY2006]14. Futons Reduction of cotton waste within processes
to less than 4.5% - 4%15. Dry cell batteries/
button batteriesProduction and delivery of 6,000 collection boxes
16. Compact secondary batteries
Recycling rate: Compact sealed lead storage battery 50%, NiCd battery 60%, nickel-hydrogen battery 55%, lithium secondary battery 30%
17. Batteries Review for restructuring a recycling system
1. Iron and steel Reduction of final waste disposal amount to 50% of FY1998 in FY2010
2. Paper/pulp manufacturing Reduction of final waste disposal amount to 57% of FY1998 in FY2010
3. Chemicals Reduction of final waste disposal amount to 75% of FY1998 in FY2010
4. Glass sheet manufacturing Reduction of final waste disposal amount to 42% of FY1998 in FY2010
5. Textiles Improvement of intermediate treatment and expansion of recycling efforts for reducing sludge
6. Nonferrous metal manufacturing Target of reduction of final waste disposal amount in FY2010 (to the FY1998 level): Japan Mining Industry Association: 37%; Japan Brass Makers Association: 76%; Japan Aluminum Association: 14%; Japan Aluminum Refiners’ Association: 10%; Japanese Electric Wire and Cable Maker’s Association:50%
7. Electricity Maintenance of a final waste disposal rate in FY2010 similar to the level of FY2006 (approx. 8% in FY2004)
8. Automobile manufacturing Reduction of final waste disposal amount to 87% of FY1998 in FY2010
9. Car part manufacturing Reduction of final disposal amount of waste produced in production processes to 96% of FY1990 by FY2010
10. Electronic/ electric device manufacturing
Reduction of final waste disposal amount to 5% of FY2003 in FY2010
11. Oil refineries Reduction of final waste disposal amount to 67% of FY1990 in FY2010
12. Distribution Reduction of packaging materials to 25% of FY2000 and shopping bags to 35% of FY2000 in FY2010
13. Leasing A solution for a problem area is under review for understanding actual treatment of products and promoting efficient recycling.
14. Cement manufacturing Target amount of waste and by-products produced per ton of cement in FY2010 is set to 400kg.
15. Rubber product manufacturing Reduction of final waste disposal amount to more than 45% of FY2001 in FY2010
16. Coal mining Reduction of final waste disposal amount to more than 80% of FY1998
17. Gas Reduction of final waste disposal amount to 25% of FY1998 in FY2010
18. Factory-produced housing manufacturing
Reduction of waste produced in production phase to more than 80% of FY2001 in FY2010
18. Gas canisters Measures against residual19. Aerosol cans Measures against residual20. Portable gas cylinders PR for proper handling21. Fire extinguishers Collection rate 60% [FY2005]22. Pachinko machines Material recycling target rate 55% [FY2005]
(Pachinko machines and pinball slot machines)
23. Personal computers and peripheral devices
Recycling rate [FY2003] Desktop PC 50%, Laptop 20%, CRT display 55%, LCD display 55%
24. Copiers Expansion of general collection system is under review.
25. Gas and kerosene equipment
Review of assessment guidelines
26. Textile products Building of a recycling system is under review.27. Lubrication oil Review of sorting methods for more efficient
recycling28. Electric wires Measures for recycling electric wires29. Construction materials Expansion of PVC pipe fitting recovery bases30. Bath tubs and
bathroom unitsSupply of materials information is under review.
31. Kitchen components Material indication methods, etc. are under review.
32. Cellular phones and PHS
Setting of collection and recycling targets is under review.
33. Fluorescent tubes, etc. Development focusing on downsizing, improved efficiency and longer life
34. Vending machines Determination of substances to be controlled and understanding of use state
35. Single-use cameras Measures for promoting collection

48
0
50
100
150
200
250
FY2010 (Estimation)
FY2005 (Estimation)
FY2004FY2003FY2002FY2001FY19981FY1996FY1990
Example of a guideline for waste treatment and recycling (Reviewed in October 2006)
<By product category>
<By sector>
Pachinko machines, etc.
Iron ore industry
1. Considerations to be taken into designing and manufacturing toward 3R[1] Implementation of the product assessment[2] Disclosure of the conditions and effects due to the measures carried out[3] Commonization and standardization to prolong the life of products eligible for
repairing[4] Reduce varieties of materials and amount of lead[5] Standardized labeling of materials2. Goals of material recycling FY2001: 35%, FY2005: 55%, FY2007: 75%3. Measures for distribution and disposals Adopt a nationwide system of collection and recycling, and maintain and
expand collection sites4. Promotion of R&D R&D for reusing parts based on the concept of easy disposal, reduction of
shredder dust and the law to prevent irregularity5. PR activity Instruct and enlighten on the appropriate disposal methods and publicize
recycling status implemented by the businesses
(overview)
1. Considerations to be taken into designing and manufacturing toward 3R• Reduction in usage of ABS resin and plywood and the number of parts for
frames• Implementation of research on types of resin and amount of environmental
burden (e.g., lead) used• Material labeling for resin parts that weigh 100g or more. Parts lighter than
100g are labeled to the maximum extent.2. Material recycling Pachinko machines Slot machines FY2001 (actual): 41.4% - FY2002 (actual): 51.9% 62.8% FY2003 (actual): 63.6% 64.7% FY2004 (actual): 74.4% 69.1% FY2005 (actual): 82.3% 87.3%3. Measures for distribution and disposals In the Tokyo Metropolis, a new collection system in which the machines are
delivered to manufacturers at collection sites by area blocks was launched in October 2003 and its area expanded to be nationwide.
4. Promotion of R&D The system for facilitating reusable parts is strengthened.5. PR activity Publicizing measures taken for recycling through industry newsletters and
exhibitions
1. Goal to reduce final disposal Meet a goal of a 50% decrease in final disposal in FY2010 in comparison with
FY19982. Recycling of iron and steel slag [1] Promotion of research/study to further increase utilization of iron steel slag [2] PR activities to encourage utilization3. Acceptance of materials from other industries With regard to waste plastic (including waste plastic, waste tires, ASR, etc.), an
acceptance system is developed aiming at accepting one million tons in 2010, given that conditions including a system of goods collection are met.
(overview)
(Development of recycling iron and steel slag)Amount of iron and steel slag generated: 38.14 million tons in FY2006(37.48 million tons in FY2005)Final disposal of iron and steel slag: 340,000 tons in FY2006 (320,000 tons in FY2005)Effective use of iron and steel slag: 99.1% in FY2006 (99.2% in FY2005)[1] Measures for increased use of recycled waste and improved reliability・ Have continued preliminary working for revision of “JIS A 5015 (iron and steel slag
for road construction)”・ Uploaded the full text of the revised Guidelines on Control of Iron and Steel Slag Product and
a list showing the progress of related companies for corporate manual production to our website in an effort to improve reliability, and at the same time, published slag newsletters and distributed the pamphlets and brochures explaining the products subject to the Green Purchasing Law to government and municipal offices for PR.
(Progress of waste plastic acceptance) FY2006: 370 thousand tons (FY2005: 440 thousand tons)
(overview)
(Measures to further increase utilization)・ Promotion of R&D to apply iron and steel slag to harbor and ocean fields・ Revision of JIS for iron and steel slag aggregate for concrete or iron and steel slag
for road construction・ Setup of a group standard on iron and steel slag for civil engineering(Enlightenment)・ Promotion of enlightenment for various slag products・ Support to acquire JIS (Electric arc furnace oxidizing slag aggregate for concrete)
acknowledgment factory(Others) With regard to waste plastic, an acceptance system is being developed aiming at
accepting one million tons in 2010, given that conditions including a system of goods collection are met.
(overview)
・ start collection of new type of slot machines used for pachinko ball・ measure to collect from solitary islands・ maintain and expand collection sites・ promotion of R&D for parts reuse based on the concept of easy disposal,
reduction of shredder dust
New collection system
Pachinko parlors/ distributors
Recycling businesses
Manufacturers
Pachinko machines replacement center (Sorting and storage of collected machines)
Used machines
Route collection
Collect at delivery
Machine of its own Machine of its own
Request for disposal
New machines
Recycled parts
(10,000 tons)
Note: Final disposal is a sum total of slag, dust and sludge.
Final disposal (goal and actual amount)

Fig. II-45 Outline of Governance of Waste and Recycling
“Guideline for governance of waste and recycling for dischargers” was developed by the Waste Prevention and Recycling Subcommittee, Environment Committee, Industrial Structure Council in September 2004 in order to properly instruct dischargers to promote appropriate disposal and recycling of waste.1. Background of development of Guideline for governance of waste and recycling
In recent years, some major cases of illegal dumping including Teshima, Kagawa Pref. (1990), the prefectural boundary between Aomori and Iwate (2002), and Yokkaichi city, Mie Pref. (2005) have been revealed, and they have caused serious social problems.
Subsequently, the Waste Disposal Law was revised to ask dischargers to accept heavier responsibilities. In the case of the prefectural boundary between Aomori and Iwate, both
prefectural governments took the following steps: reported and levied fees on dischargers; disclosed the name of the company that is confirmed to have perpetrated illegal disposal; and ordered the said company to remove the waste from the site. Violation of laws such as by illegal dumping may cause risk to a company’s management due to its degraded image of the corporate brand.
Upon these facts the “Guideline for governance of waste and recycling” is assembled with concepts that include the importance of compliance, views of social responsibility of a corporation and necessity to address the issue with a standpoint of corporate management.
49
12 Governance of Waste and Recycling

Review governance details seeking a higher level of approach
Thorough dissemination of waste-sorting control
edam ssergorp eht revo tnemssessA against the goal
dna devorpmi eb ot seussi tcartxE feedback
Fig. II-46 Flow Followed by a Discharger to Practice the Governance of Waste and Recycling
2. Points to be considered in governance of waste and recycling
Governance of waste and recycling is a concept of an ideal approach for a corporation (discharger) to increase the corporate value through improvement of the corporate brand image and reduced management risk by preventing an inappropriate discharge of waste by the corporation. The guideline has three specific points to consider.
The necessity of a company-wide approach, where not only the personnel in charge of waste management on site but also the entire organization from the top management to employees are involved in disposal and recycling of waste, is presented as a primary point. The importance to promote appropriate disposal, among others, through active involvement of top management by securing personnel and budget for the waste control department and requiring a company-wide approach, is emphasized.
Second, in order to mitigate the risk of inappropriate discharge of the waste by the corporation, the significance of establishing a cooperative relationship with broader
varieties of parties concerned, including subsidiaries, partner corporations, retailers, disposal and recycling businesses, to pursue appropriate treatment of the waste is highlighted. Coordination with disposal and recycling businesses has greater significance because it will enable the discharger to properly carry out disposal and recycling through opinion exchanges about better methods of sorting, treatment and recycling of waste.
The third point to consider is the idea of provision and sharing information with a variety of third parties, such as customers, consumers, investors including stockholders of the corporation, the local community including local, about approaches made by the corporation. This effort allows the corporation to receive reasonable assessment over their approach, which helps them further improve governance of waste and recycling.
50

係業界団体や企業が自主的に識別マークを使用し、リサイクル製品や分別のための材質等を表示しています。
Fig. II-47 Eco-Mark Fig. II-36 Identification Marks
“Environmental Labels and Declarations” is a claim representing the environmental aspects of the product and service, of which general principles are provided by ISO14020 “Environmental labels and declarations - General principles,” a standard issued by International Organization for Standardization (and JIS (Japan Industrial Standard) Q 14020) as a stimulator to promote the supply and demand of eco-friendly products and services and the possibility of continuous market-oriented improvement of the environment. It can be presented in the form of statements, symbols or graphics made on product or packaging labels, product literature, technical bulletins, advertising, publicity or similar applications. JIS categorizes the environmental labels into three types based on the ISO standard.
(1) Type I: Environmental labels
The type I Environmental label is a label granted by third-party bodies and operated in accordance with ISO 14024 (Environmental labels and declarations—Type I environmental labeling—Principles and procedures) issued in 1999 and JIS Q 14024 established in 2000. In this system, third-party accreditation bodies establish criteria among the environmental friendliness of products in comparison with other similar products in light of the entire life cycle for specific kinds of commodities, and certify some products as environmentally friendly in accordance with the criteria. Predetermined marks can be attached to certified products.
“Eco-Mark” in Japan, “Blue Angel” in Germany and “Nordic Swan” in North European countries are included in Type I labels.
“Eco-Mark” service is provided by the Japan Environment Association (http://www/jears.or.jp), which started its service in 1989 with seven product categories of “spray products in which the designated CFC is not used.” They cover 43 product categories and 4,690 brands as of the end of September 2010 as a result of annual extension of subject product categories and certified products.
(2) Type II environmental labels
The type II Environmental labels is a type in which self-declaration is made by businesses in accordance with ISO 14021 (Environmental labels and declarations—Self-declared environmental claims—Type II environmental labeling) issued in 1999 and JIS Q 14021 established in 2000. Since it is essential to assure reliability in self-declared environmental claims and since vague or unclear environmental claims could mislead consumers, definitions are provided for the following twelve terms.
Compostable
Degradable
Designed for disassembly
Extended life product
Recovered energy
Recycled content
[Preconsumer materials, postconsumer materials, recycled material, collected (recycled) materials]
Reduced energy consumption
Reduced resource use
Reduced water consumption
Reusable and refillable
Waste reduction
The type II label is based on self-declarations by businesses of their environmental consideration, indicating how environmentally friendly their products are, in the form of statements, symbols or graphics. Additionally, the “Mobius Loop” is a symbol claiming “Recyclable” or “Recycled Content.” Industrial associations and companies also use their own original identification marks to indicate recycled products and materials to be selectively collected.
51
13 Environmental Labels and Identification Marks

(3) Type III environmental labels The type III environmental label indicates qualitative data on the environmental impact of products through the entire life cycle, from gathering of resources to manufacturing, use, and disposal/recycling, calculated by the life cycle assessment (LCA) method and using predetermined environmental indicators in accordance with ISO 14025 (Environmental labels and declarations—Type III environmental declarations—Principles and procedures) issued in June 30, 2006. However, only a few countries have adopted the type III environmental labels. As an example, Eco-Leaf is an environmental label that has been used in the “Eco-Leaf Type III Environmental Labeling Program” since June 2002 by the Japan Environmental Management Association for Industry (http://www.jemai.or.jp). Sixty-two cineraria by product category were laid down and 496 product items (sum total 930 items) were registered and publicized in the program as of the end of February 2010.
古紙配合率100%再生紙を使用しています。
Products recycled from PET bottles
PETボトル再利用品
Products made of recycled paper (Green Mark)
Products made of recycled paper (100% made of recycled paper)
Products made of paper recycled from milk cartons
Paper containers Corrugated cases
Committee for Milk Container EnvironmentalIssueshttp://www.yokankyo.jp
Corrugated Case Recycling Councilhttp://www.jcca.gr.jp/jp/index8a.html
R bottle Energy saving
Japan Glass Bottle Associationhttp://www.glassbottle.org
The Energy Conservation Centerhttp://www.eccj.or.jp
3R Promotion Forumhttp://www.3r-forum.jp
Japan Milk Carton Recycling Associationhttp://www.packren.org
Council for PET Bottle Recyclinghttp://www.petbottle-rec.gr.jp
Paper Recycling Promotion Centerhttp://www.prpc.or.jp
No.XX-04-001
Product registration numberRepresenting a product with an environmental label granted and indicating a data registration number
Fig. II-49 Identification Marks Fig. II-50 Eco-Leaf Environmental Label
52

14 Design for Environment (DfE)
53
(1) Toward realization of green product chain
In reducing environmental burden and minimizing material consumption and the amount of waste generated through the entire life cycle of the product (from material acquisition and utilization to recycling and disposal of end-of-life products), it is essential to take the concept of the 3Rs into the designing and manufacturing, design for environment (DfE).
Although the idea of energy saving in light of global warming should be incorporated into DfE in addition to the design and manufacturing requiring efficient material consumption, controlling waste amount, detoxification and an easy disassembly, bear in mind that the nature of those design aspects may conflict with each other.
By adopting DfE, a positive effect leading a variety of industries to promote development of eco-friendly products seems to be spreading. Effective material usage through cyclical use by utilizing recycled material made from used products in the same product category increases at some manufacturers.
Accelerating to expand a sound material-cycle society demands materialization of a “green product chain” in which environmental considerations are incorporated through “green manufacturing” by manufacturers, and it will be assessed by green consumers and green markets.
Use of a range of information about environmental considerations taken into the product is essential to realize this. For efficient use of such information by each party concerned, visualization and communication at each stage of the product life cycle (i.e., material procurement, production, distribution/retailing, consumption/purchase, discharge/taking back and reusing/recycling) is needed. Such information in addition to the traditional information about functions and price will become new evaluation criteria at the market, resulting in bearing vital power to further stimulate the businesses that are properly evaluated and enabling them to produce more innovation.
Considering the current development of the global trend of the accelerated division of labor and market globalization, satisfying DfE based on the global point of view is critical.
ISO as international standards, therefore, provide Guide 64 (Guide for the inclusion of environmental aspects in product standards) and TR14062 (Environmental management - Integrating environmental aspects into product). IEC, the International Electrotechnical Commission, issued a common guidance standard for DfE at the WG2 of a new technical committee (TC111), which was established for the purpose of reviewing cross-cutting environmental standards.

Table II-9 Establishment/Revision of Product Assessment Guidelines of Industrial Associations (As of the end of April, 2010)
Name of association Condition of product assessment guidelinesJapan Automobile Manufacturers Association(http://www.jama.or.jp)
Jul. 1994 Guidelines for Pre-Evaluation in the Product Designing Stage for Promotion of Recycling established
Dec. 2001 Judgment Criteria Guidelines on Prevention of Generation of Used Products/Use of Recycled Resources or Parts established
Japan Bicycle Promotion Institute(http://www.jbpi.or.jp)
June 1997 Product Assessment Manual Guidelines on Bicycles established (final revision in Mar. 2006)
Association for Electric Home Appliances(http://www.aeha.or.jp)
Oct. 1991 Product assessment Manual: Electric Home Appliances established (4th edition on May 2006)
Japan Office Institutional Furniture Association(http://www.joifa.or.jp)
Apr. 1996 Guidelines on Environmental Measures for Office Furniture established (final revision in Sept. 2008)
Apr. 2001 Product Assessment Manual: Metal Furniture established (final revision in Sept. 2008)
Apr. 1998 JOIFA Environmental Self-Action Plan established (final revision on Dec. 2007)
Japan Luminaires Association(http://www.jlassn.or.jp)
Mar. 1992 Product Assessment Manual: Luminaires established (final revision in Sept. 2001)
Japan Game Machine Association, Japan Electric Game Machine Association
Jan. 1998 Product Assessment Manual established
Japan Electric Game Machine Association(http://www.nichidenkyo.or.jp)
Jul. 2001 Product Assessment Manual revised
Japan Electronics and Information Technology Industries Association(http://www.jeita.or.jp)
Aug. 2001 Product Assessment Manual revised
Japan Business Machine and Information System Industries Association(http://www.jbmia.or.jp)
Jul. 1995 Environmental Designing Assessment Guidelines for Information Processing Devices established (final revision in Sept. 2000)
Jan. Environmental Designing Assessment Guidelines for Personal Computers established
Name of association Condition of product assessment guidelinesJapan Industrial Association of Gas and Kerosene Appliances(http://www.jgka.or.jp)
Jul. 2006 3R Designing Guidelines for Preparing Product Assessment Manual (copiers, etc.) established
Japan Gas Association(http://www.gas.or.jp/default.html)
Apr. 1993 Assessment Guideline for Gas Appliances established
Oct. 1993 Assessment Guideline for Kerosene Appliances established
Sept. 2009 Assessment Guidelines for Gas/Kerosene Appliances revised (to include 3R programs)
Japan Association of Kitchen & Bath(http://www.kitchen-bath.jp)Japan Reinforced Plastics Society, (Bath Tub Division) (http://www.jrps.or.jp)Japan Bath Unit Association
Jun. 2001 Product Assessment Manual: Bath Units established (final revision in Dec. 2005)
Japan Association of Kitchen & Bath(http://www.kitchen-bath.jp)
Apr. 2001 Product Assessment Manual: Kitchen Components established (final revision in Dec. 2007)
Japan Electric Lamp Manufacturers Association(http://www.jelma.or.jp)
Jul. 1992 Product Assessment Manual: Lamps and Stabilizers established (final revision in Apr. 2008)
Japan Vending Machine Manufacturers Association(http://www.jvma.or.jp)
Aug. 1997 Product Assessment Manual: Vending Machines established (final revision in Feb. 2007); Title changed to Product Assessment Guideline: Vending Machines
Communication and Information Network Association of Japan(http://www.ciaj.or.jp)
Mar. 2001 Product Environmental Assessment Guidelines for Cellular Phones/PHS established (final revision in Feb. 2004)
Aerosol Industry Association of Japan(http://www.aiaj.or.jp)
Aug. 2002 Design Guidelines for Easily Recyclable Aerosol Containers established
Note: Based on interviews with the industrial associations concerned
54
(Source: Industrial Structure Council, October 17, 2006 (revised))
(2) Product assessment guidelines applied by
industrial associationsIn 1994, the Industrial Structure Council established
the “Guidelines for Preparing Pre-Evaluation Manuals in Product Designing to Contribute to the Promotion of the Use of Recycled Resources” as a reference for manufacturers to achieve DfE.
Industrial associations developed “product assessment guidelines” applicable to their products in accordance with the Council Guidelines. They implement DfE by conducting pre-evaluation under their own guidelines.
Product assessment (pre-evaluat ion) means that manufacturers, prior to production, investigate, estimate and evaluate the safety and resource/environmental impact of their products at the stages of production, distribution, use, discharge, and recycling/disposal, and amend their product designs and production methods as necessary, thereby reducing the resource/environmental impact.

55
Fig. II-51 Use of Recycling-Oriented Materials
Fig. II-52 Recycling-Oriented Chair
(3) Examples of DfE
[1] MaterialsIn order to promote recycling of resin materials used
for auto parts, Company A unifies part materials while encouraging more frequent use of easily recyclable thermoplastic resin, including polypropylene resin.
Company B uses easily recyclable materials for personal computers, such as magnesium-alloy cases and halogen-free plastics.
[2] Recycling-oriented designs and material indication
Company C designs office chairs that can easily be dismantled by using single materials and indicates as many materials as possible, thereby promoting the recycling of materials.
Subject parts to reuse and polypropylene
Subject parts to reuse
Thermoplastic resin
Polypropylene
Magnesium alloy
Hslogen-free
Recycling plastic

56
Waste washing machine New refrigerator
[3] Examples of advanced recycling schemes - Home electric appliances -
In the field of home electric appliances, recycling efforts by manufacturers and the Design for the Environment (DfE) technology make it possible to reuse recycled plastics recovered from used products. This contributes to promoting highly efficient recycling for reducing the use of new resources. The use of recycled materials will be beneficial in terms of strengthening competitiveness as the resource price is rapidly increasing as well as suppressing CO2 emissions.
Example 1Waste plastics recovered from used home electric
appliances are reused as parts and materials for producing home electric appliances. This is called “self-circulation material recycling.”
Used products are manually disassembled to subtilize and recover waste plastics by manufacturers in collaboration with recycling operators. Technology to adjust the physical properties and serviceable life of plastics to the characteristics required for reused materials was developed.
Example 2Plastics collected from the waste washing machine
parts are reworked for use as materials for refrigerators.
Example 3Glass-reinforced AS resin (ASG), used for the cross-
flow fan of the indoor unit of air-conditioners, is recycled as materials for producing new cross-flow fans for air-conditioners.
Design, production, shipment
Crushing (12mm or less)
Extrusion, pellet sortingWashing tub molding
Collection and disassembly of waste washing machines
Recovery of washing tub
[Material recycling example - Waste washing machine tub to new product]
(Source: Report from the Basic Pol icy WG, Waste Prevention and Recycling Subcommittee, Environment Committee, Industrial Structure Council)
Used air-conditioner (indoor unit) Crushed
pieces
Collection and sortingCrushing
(dedicated crusher)
- Cleaning - Removal of metal
- Crushing - Pelletization
RecycledAGSpellet
Virgin ASG pellet

57
[4] Examples of advanced recycling schemes - Automobiles -
In the automobile industry, efforts are also made to reuse the materials, such as the recyclable plastics recovered from used parts, for manufacturing the same parts through the development and design of products, keeping in mind the effective use of recyclable resources collected from car parts, combined with recycling technologies.
Example 1
Recyclable plastics collected from bumpers are reused as raw materials for producing car parts.
Example 2Recyclable plastics collected from bumpers are reused as
raw materials for manufacturing bumpers.
(Source: Data by the Basic Policy WG, Waste Prevention and Recycling Subcommittee, Environment Committee, Industrial Structure Council)
Recycled materials
Recycle maker
Extrusion Sorting Exfoliation of coating film
Recycling processRemoval of coating film
Removal of coating film
Collection of bumpers
New car bumper
Car maker User Dealer
99.9 98.5
Seat back board
Engine under cover
Luggage
Trim

58
(4) Establishing standards for promoting advanced recycling schemes
Calculation and display methods of recycled and reused indicator of electric and electronic equipment (JIS C 9911)
The marking for identification of plastic parts for electric and electronic equipment (JIS C 99112)
Aiming at promoting the reuse of resources, indicators for displaying the recycled resources and their percentage in electric and electronic equipment are standardized to allow consumers to easily understand the content for increasing the popularity of eco-products in the market.
Clear indication of the history and characteristics of plastic parts with a new marking on the parts will facilitate and improve efficiency of the sorting of plastic parts in recycling plants.
Indication Mark
Fire-retarding materials are not contained. FR0
Use of recycled plastic materials and percentage (Example) Material: Polypropylene, Content: 50%
>PP < R50
In the electric and electronic industry, Japan Industrial Standards (JIS), which standardizes the definition and indication of the use rate of recycled resources, such as recyclable plastics, have been established for promoting self-circulation recycling schemes. In order to closely coordinate the design and the recycling phases in the self-circulation recycling scheme, the JIS for integrating the indications, such as the material indication for recyclable plastics, location of screws, and disassembly positions, has also been established.
Efforts for strengthening coordination between the product design and recycling phases for achieving effective and efficient recycling are important.

59
15 Material Flow Cost Accounting (MFCA)
(1) Overview of MFCAThe MFCA is an essential tool for environmental
management accounting (specially used for the assessment of corporate environmental expenditure), which visualizes waste by measuring the flows and stocks of materials of negative products in a production process in both physical and monetary units. The use of MFCA will bring about an improvement in production processes by reducing waste and boosting yield, and at the same time will reduce costs and environmental impact through productivity enhancement.
Input(100kg)
Cost of raw materials ¥1,000
Cost of processing ¥600
OutputIndividual product (80kg)
Cost of waste ¥1,600Production process
(20kg)
Cost of raw materials ¥200
Cost of processing ¥120
Total ¥320
Waste
Output
Individual product (80kg)
Cost of raw materials ¥900
Cost of processing ¥480
Total ¥1,280
Input
(100kg)
Cost of raw materials ¥1,000
Cost of processing ¥600
Total ¥1,600
Negative product
Negative product
Conventional cost accounting
MFCA
Escapes notice in the conventional cost accounting.
320
1,280
Total cost of product1,600
Operating profit500
Sales administrative expense400
Sales profit900
Cost of negative product (loss)
Cost of positive product
Sales2,500
MFCA based P/L (unit: ¥1,000)
(Not known)
500Operating profit
400Sales administrative expense
900Sales profit
1,600Cost of positive product
2,500Sales
P/L in conventional method (unit: ¥1,000)
(Not known)
<Previous material>
Grinding portion
Grinding portion
<New material (80% reduction)>
(2) Differences between conventional cost accounting and MFCA
(3) Examples of MFCALens machining process in company A
(Problem) 2/3 of material loss occurred in the rough lens grinding process.(Countermeasure and result) Near shape (thin lens) was employed in cooperation with the raw material supplier, resulting in an 80% reduction in the amount of grinding.
Adhesive tape production process in company B(Problem) Loss reached around 2/3 of sales profit in company B.(Countermeasure and result) Negative product was reduced by 10% in 2004 after installing new production equipment, etc.
Precision part material machining process in company C
(Problem) Costs for thermal disposal of waste liquid solvent were too large (accounting for 80% of the total disposal cost).(Countermeasure and result) The disposal method was changed from thermal disposal to microbial activated sludge treatment. The energy-saving effect was 33 million yen/year (2,328t/year, in CO2 equivalent). Capital investment (66 million yen/year) could be recouped mostly in a year.
(Source: Report from the Basic Policy WG, Waste Prevention and Recycling Subcommittee, Environment Committee, Industrial Structure Council)
Result of improvement and target(Adhesive tape for electronic parts)
Total
Negative product
Positive product
(target)<- Separator
<- Adhesive material
<- Base material
Adhesive tape for electronic parts [three-layer system]
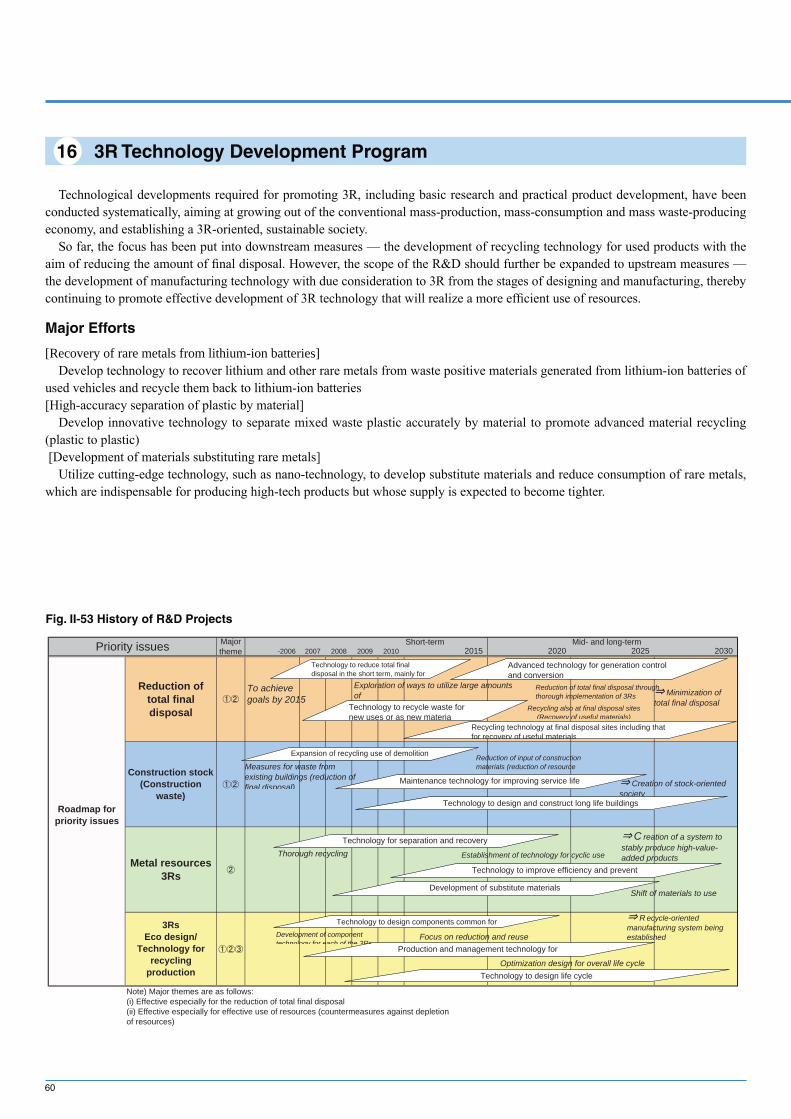
60
16 3R Technology Development Program
Technological developments required for promoting 3R, including basic research and practical product development, have been conducted systematically, aiming at growing out of the conventional mass-production, mass-consumption and mass waste-producing economy, and establishing a 3R-oriented, sustainable society.
So far, the focus has been put into downstream measures — the development of recycling technology for used products with the aim of reducing the amount of final disposal. However, the scope of the R&D should further be expanded to upstream measures — the development of manufacturing technology with due consideration to 3R from the stages of designing and manufacturing, thereby continuing to promote effective development of 3R technology that will realize a more efficient use of resources.
Major Efforts
[Recovery of rare metals from lithium-ion batteries]Develop technology to recover lithium and other rare metals from waste positive materials generated from lithium-ion batteries of
used vehicles and recycle them back to lithium-ion batteries[High-accuracy separation of plastic by material]
Develop innovative technology to separate mixed waste plastic accurately by material to promote advanced material recycling (plastic to plastic) [Development of materials substituting rare metals]
Utilize cutting-edge technology, such as nano-technology, to develop substitute materials and reduce consumption of rare metals, which are indispensable for producing high-tech products but whose supply is expected to become tighter.
Fig. II-53 History of R&D Projects
Short-term Mid- and long-term-2006 2007 2008 2009 2010 2015 2020 2025 2030
Metal resources3Rs
Note) Major themes are as follows:(i) Effective especially for the reduction of total final disposal(ii) Effective especially for effective use of resources (countermeasures against depletionof resources)
Priority issues Majortheme
Roadmap forpriority issues
Construction stock(Construction
waste)
Reduction oftotal finaldisposal
3RsEco design/
Technology forrecycling
production
Technology to reduce total finaldisposal in the short term, mainly for
Recycling technology at final disposal sites including thatfor recovery of useful materials
Advanced technology for generation controland conversion
Technology to recycle waste fornew uses or as new materia
Expansion of recycling use of demolitiont
Technology to design and construct long life buildings
Maintenance technology for improving service life
Technology to design components common for
Production and management technology fori t d 3R
Technology to design life cycle
Technology for separation and recovery
Technology to improve efficiency and preventi it t i ti
Development of substitute materials
Reduction of input of constructionmaterials (reduction of resource
Creation of stock-orientedsociety
Measures for waste fromexisting buildings (reduction offinal disposal)
To achievegoals by 2015
Exploration of ways to utilize large amountsof
Reduction of total final disposal throughthorough implementation of 3Rs
Recycling also at final disposal sites(Recovery of useful materials)
Thorough recycling
Shift of materials to use
Establishment of technology for cyclic use
Development of componenttechnology for each of the 3Rs
Focus on reduction and reuse
Optimization design for overall life cycle
Minimization oftotal final disposal
C reation of a system tostably produce high-value-added products
R ecycle-orientedmanufacturing system beingestablished

61
Fig. II-54 Sustainable Material-Cycle Economic Society in Asia
17 International Promotion of the 3Rs
(a)
(b)
(1)
Country A
Production
ConsumptionDisposal/recycling
(1)
Country B
Production
Consumption
Disposal/recycling
(1) Shifting to a material-cycle economic structure by each country(2) Establishing a proper material recycling system in Asia(a) Advanced material recycling network of manufacturers, etc.(b) Management of contamination in terms of the global material recycling trade scheme
Well established cooperation among countries and enhanced efficient use of materials promote restrained material usage and hinder the spread of the environmental pollution
Recently, with the economic growth of Asian countries and the globalization of economy, the international trade amount of recyclable resources, such as scrap metal and used plastic, has been increasing in the Asian region. Now, recyclable resources that were recycled only in Japan are becoming utilized globally.(For example, the CRT glass cullet of televisions collected according to the rules of the Home Appliance Recycling Law of Japan is exported as raw materials for CRT production in Asia.)
In addition, Japanese companies operating abroad are facing the problems of recycling and disposing wastes that is
caused by their operation in Asian countries.However, in many Asian countries, the legal systems and
industrial infrastructure on recycling of resources have not yet been built. Smooth international trade of recyclable resources will be interrupted if an improper process of recycling causes environmental pollution in these countries.
Under this situation, The Working Group on Enhancing International Recycling, Waste Prevention and Recycling Subcommittee, Environment Committee, Industrial Structure Council/METI, recommended a sound method for the international recyclable resources circulation system within the Asian region in October, 2004.
In this report, it was said that each Asian countries must make further efforts to realize a “Sustainable Asia based on the 3Rs” (Fig. II-54). To realize the goal, each country first makes a considerable effort in constructing a sound domestic recycling system for recyclable resources. In addition, recyclable resources that cannot be recycled in each country should be utilized efficiently between Asian countries to reduce consumption of natural resources while preventing the
expansion of environmental pollution.In order to solve this problem, the Ministry of Economy,
Trade and Industry is attempting to share information concerning the trend of waste disposal and 3R-related regulations and policies as well as the development of related industries through political dialogs with other nations, while carrying out technological cooperation and human resources development to support the establishment of systems and infrastructures in various countries.

62
Agreed between the ministries of both nations in December 2006. Know-how for implementing recycling facilities that maximize the effective use of resources, accumulated by municipalities through the development of eco-towns, will be given through interchanges with local governments in China.- Cooperation for recycling technology
In order to resolve waste and recycling problems faced by local communities in China, demonstration projects have been carried out by fully utilizing Japan’s advanced recycling technology and systems.
For example, we take the following actions in China and Southeast Asian nations:[1] China- Political dialogs
Started in 2004 with the National Development and Reform Commission of R.P.China, aiming at exchanging opinions on 3R policy in Japan and China. The second conference and the third conference were held in Beijing in June 2007 and in June 2009.- Cooperation for sustainable city development
Sustainable city development planning
Smooth operation of home appliance recycling systems
Actions for developing sustainable cities in Asia Support by METI
Feasibility study to understand business needs and possibilities
Exchange of people including acceptance of interns and dispatch of experts
“Demonstration projects” at local factories fully utilizing Japan’ s advanced recycling technology
[Eco-Towns in Japan]Company
Local government Municipality
Company
- Business bases transfer of environmental technologies including appropriate disposal technology
- Overseas deployment of recycling industry
- Integration of recycling industries mainly organized by municipalities
- Zero-emissions through disposal networks containing multiple facilities
- Consultation for business planning and operation
Accumulation of knowledge and know-how required for establishing infrastructures
[2] Southeast Asian nations (Thailand, Indonesia, the Philippines, Malaysia, Indonesia)- Political dialogs
Carried out to foster a common view in order to conduct cooperation according to the Green Aid Plan (GAP), which is a program that supports the efforts of developing nations to save energy and cope with environmental problems. An exchange of opinions for waste disposal and 3R-related cooperative actions are also carried out.- Examples
The cooperation for sustainable city development as mentioned above has also been offered in other Asian countries, including Thailand, since FY2009.
[Thailand]- Cooperative program for introducing a recycling system in FY2004 (JETRO)
- Support for implementing a waste home appliance (specified items) recycling system in FY2005
- Cooperation for sustainable city development (from FY2009)
[China]- Acceptance of central and local government staff in training courses of 3R policies in Japan through JICA and other organizations in FY2006 (acceptance of approx. 120 persons)
- Cooperation for establishing sustainable cities (from September 2007 onward)
[Vietnam]- Supportive project for 3R Initiative in Hanoi (FY2006 to 2009)
[Philippines]- Planning and research of recycling industry development (JICA) (FY2006 to 2007)
[Malaysia]- Support for implementing a recycling system in FY2006 (JETRO)
- Environmental conservation training course (AOTS)
[Indonesia]- Invitation of senior official missions to 3R training and inspection in FY2006 (JETRO)

63
(1) Reducing the weight and thickness of containersReduction is one of the priorities in the Fundamental Law for Establishing a Sound Material-Cycle Society in perspective of
decreasing the consumption of natural resources and generation of waste. In the production phase of cans, bottles, PET bottles and other containers and packaging, efforts toward cutting back on weight and thickness have been promoted.
Eight recycling organizations for containers and packaging (Note) made individual self-action plans to promote 3R activities by business operators, in which the targets and measures for promoting 3R were determined by material, and a 3R promotion liaison conference was formed to follow the state of annual achievement. Efforts toward reduction have steadily been made to achieve the targets by FY2010.(Note) Eight recycling organizations for containers and packaging:
Glass Bottle Recycling Promoter Association, Council for PET Bottle Recycling, Paper Containers and Packaging Recycling Promotion Council, Plastic Containers and Packaging Promotion Council, Steel Can Recycling Council, Aluminum Can Recycling Association, Beverage Paper Container Recycling Association, and Cardboard Recycling Promotion Council.
• Glass bottlesLightweight bottles have been increasingly used year by year, drastically changing the
image of bottles as being heavy. Returnable bottles that are lighter than conventional bottles by as much as 45% are used for the milk bottles dedicated to home delivery. Large beer bottles that are about 20% lighter than conventional bottles have been on the scene. Bottles are now much easier to take hold of and carry.
Some estimate that returnable milk bottles have saved as much as 30,000 tons in resources annually, upon shipments, between 2003 and 2009.
Present Situation of “Reduce”
1 Containers and Packaging
Table III-1 Reduction in FY2008 (in comparison with FY2004)
MaterialTarget achieved by FY2010
(in comparison with FY2004)Results in FY2008
Glass bottles Reduce weight per bottle by 1.5%.Average weight reduction per bottle: 1.4%(Reference: Weight reduction: 1,527 tons; 26 items of 7 categories)
PET bottlesReduce weight per bottle by 3% for each of the major sizes and usages of containers.
Of 15 major sizes and usages, 13 attained weight reduction of 0.1 to 11.0%.
Trays Reduce the total weight by 2%. Weight reduction: 1.3%
Plastic containers and packaging
Reduce 3% to the result of FY2004.(1) Confirmed reduction: 1,375 tons(2) Conversion of effects of improvement in cost unit: 12,856 tons (see p27 for details)
Steel cans Reduce 2%. Weight reduction/can: 2.0%
Aluminum cans Reduce weight by 1% per can on an average. Average weight reduction/can: 0.8%
Beverage packs Reduce weight by 1%. No change in the total weight.
Cardboard Reduce weight by 1% per m2. Weight reduction/m2: 0.9%
Source: Follow-up report in 2008 for the Self-Action Plan for Promoting 3R of Containers and Packaging, December 2009 (3R Promotion Liaison Conference)
Table III-2 Effects of Reduction: Resources Saved by Reducing Bottle Weight (2003 -> 2009)The following are major types of glass bottles (by category and capacity) whose weight reduction between 2003 and 2009 saved resources significantly.
Category Average reduction per bottle Production (‘09) Saved resource
Small bottle for beverage [114g (2003) - 108g (2009)] × 1.4848 billion bottles = 9,400 tons
720ml Distilled spirit bottle [501g (2003) - 474g(2009)] × 85.7 million bottles = 2,300 tons
720ml wine bottle [385g (2003) - 355g (2009)] × 58.9 million bottles = 1,800 tons
360ml noodle sauce bottle [198g (2003) - 171g (2009)] × 47.8 million bottles = 1,300 tons
700ml whiskey bottle [531g (2003) - 500g (2009)] × 39.2 million bottles = 1,200 tons
Total 16,000 tons
Glass Bottle Recycling Promoter Association
Weight reduction of 200-ml milk bottles
Traditional bottle244g
Weight reduction of 20%
Weight reduction of 23%
Weight reduction of 43%
Modern bottle 182g
Light and coated bottle 140g

64
• PET bottlesAs the production of PET bottles has been increasing every year, thinner and lighter bottles have been developed to reduce the use
of PET resin and promote the effective use of limited resources. The weight of 2- and 1.5-liter heatproof bottles was reduced by 26% and 35% respectively in the past 20 years.
The recent weight reduction of 520-ml bottles from 30g to 12g (reduction of 40%), and 2-liter bottles from 63g to 42g (reduction of 33.3%) are good example of drastic weight reduction. Of the 15 items subject to weight reduction, the weight of 13 containers was successfully reduced in FY2008, showing the progress for achieving the targets in the self-action plan (3% reduction by 2010 in comparison with the result in FY2004).
Table III-3 Weight Reduction of PET Bottles
Manufacturer Bottle type Reduction Percentage
Asahi Soft Drinks 2000-ml bottle for Juroku-cha 57g -> 43g 24.6%
Suntory 2000-ml bottle for mineral water (Okudaisen) 47g -> 40g 14.9%
Otsuka Pharmaceutical
500-ml bottle for POCARI SWEAT 27g -> 18g 33.3%
(Source) 2009 Annual Report on PET Bottle Recycling (Website of the Council for PET Bottle Recycling)
Weight Reduction of PET Bottles by Size and Usage (2008)
*Reduction rate based on the unit bottle weight (100) in FY2004(Source) Data from the Council for PET Bottle Recycling
• Paper containers and packaging, paper containers for beverage
There have been various efforts to reduce the weight and volume of paper containers and packaging. For example, improvements in tissue paper are achieved through simple changes, such as reducing the height of the tissue box by reducing the volume of tissue paper, or reducing the use of paper for producing tissue boxes by eliminating the overlapped portion of cover to reduce the area of the carton expansion plan.
In 2008, the weight of paper containers for beverages had been reduced by 1.3% from the level in FY2004. Manufacturers are continuing efforts with related businesses for even further reduction.
(Source: Cases of 3R Improvements in Paper Containers and Packaging)December 2009 (Paper Containers and Packaging Promotion Council)
Targets in the Self-Action Plan for achieving weight reduction (3%) by 2010
350ml
80 90 95 97 100 105
500ml
1,500ml
2,000ml
500ml
1,500ml
500ml
2,000ml
2,700ml
4,000ml
1,000ml
1,800ml
500ml
1,000ml
1,800ml
101.8
97.6
95.7
96.2
99.7
99.8
90.1
89.0
94.6
99.2
99.5
99.9
94.8
98.3
100.0
Sweet sake
Sake
Aseptic
Pressure-tight
Heatproof
Usage Size
Soy sauce
Cold beverage
Alcoholic beverage
Cut overlapped flap at the opening part
Cut overlapped flaps on both sides
Before improvement After improvement

65
• Plastic containers and packagingOne-third of plastics produced are used for containers and packaging film sheets familiar with us. There have been various efforts
including weight reduction, development of repacking containers, proper packaging, and reduction in labeled items.
Cans (steel and aluminum)Efforts to produce thinner and lighter cans have been promoted. Weight reduction of steel cans in previous years include a
reduction of 63% for 350g cans, and a reduction of 20% for 190g cans. In FY2008, the average weight reduction of steel cans for beverages was 2.01% (0.72g/can).
A reduction of 16.5% in the weight of aluminum cans had been achieved in the period of 1985 to 1994, and subsequent reduction of 1.2% by the year of 2004. The weight reduction of aluminum cans in FY2008 was 0.8% on average, compared with that in FY2004.
• CardboardCardboard is used for packing products, and
designed according to the conditions of product distribution (e.g., strength of products and methods of transportation). Efforts for reducing the thickness of cardboard materials resulted in saving the weight per 1 m2 by 3.5% from 1990 to 2007.
Weight reduction of cardboard (g/m2)
(Source: Follow-up report in 2007 for the Self-Action Plan for Cardboard)
Examples of effects of reduction(i) Confirmed reduction = 1,375 tons - 1,375 tons by reviewing film composition, reducing the thickness of wrapping materials, and reducing the size (food related business)(ii) Conversion of effects of improvement in cost unit = 12,856 tons- 5,230 tons in total by Japan Soap and Detergent Association, Japan Frozen Food Association, and Japan Oilseeds Processors Association- 7,626 tons in total by Japan Polyethylene Products Industrial Federation and Japan Plastic Food Containers Industry Association*: Difference between the presumed quantity in FY2006, given by the cost unit in FY2004 multiplied by the amount of product shipment in FY2008,
and the actual quantity of consumption in FY2008.(Source: Follow-up report in 2009 for the Self-Action Plan for Plastic Containers and Packaging)

66
(2) Reduction of plastic shopping bagsReducing the use of plastic shopping bags has become a
social concern, and various activities have been taken across the country since the new system was introduced according to the amendments of the Containers and Packaging Recycling Law (April 2007).
The activities are roughly classified into the following: (1) plastic shopping bag charging scheme based on voluntary agreements between local administrations, residents and businesses, (2) discount service for those who decline shopping bags, and (3) distribution of My Bag. Some municipalities are considering taking specific measures toward reducing the use of plastic shopping bags.
Charging for shopping bags based on voluntary agreements is referred to as the “Kyoto Method” since Kyoto was the first city to charge for shopping bags, in January 2007. The cities, including Sendai, Nagoya and various other cities across the nation, have followed the practice since then.
Machida City, a municipality in Tokyo, launched the first municipality-level effort in Japan to ban the use of plastic bags in collaboration with administrations, residents and businesses.
National Map for Activities to Reduce Plastic Shopping Bags
~ Collaborations of Related Parties ~As of October 1, 2008; Surveyed by the Ministry of Economy, Trade and Industry
Sapporo City (Oct. 2008; except Nishi-ku (Jun. 2008))Rumoi City (Oct. 2008) Iwamizawa City (Jul. 2008)Chitose City (Jul. 2008) Eniwa City (Jul. 2008)Tobetsu-cho (Jun. 2008) Kitahiroshima City (Jul. 2008)Ebetsu City (Oct. 2008) Ishikari City (Oct. 2008)
Kucchan-cho (Jun. 2008)Tomakomai City (Jun. 2008)Muroran, Date, Noboribetsu Cities (Jul. 2008)Hakodate City (Oct. 2008)
Asahikawa City (Oct. 2008)Furano City (Oct. 2008)Kitami City (Oct. 2008)Bihoro-cho (Oct. 2008)
Kushiro City, Kushiro-cho (Oct. 2008)Obihiro City (Oct. 2008)
Sendai City (Jun. 2007)Miyagi prefecture (Scheduled in Feb. 2009)
Kawaguchi City (Scheduled in Nov. 2008) Kasukabe City (Scheduled within FY2008)
Yokohama City (Apr. 2007) Kawasaki City (Oct. 2007)
Naha City (Sept. 2007) Okinawa prefecture (Oct. 2008)
Kakegawa City (Jun. 2007) Shimada City (Apr. 2008)Iwata City (May 2008) Fukuroi City (May 2008)Shizuoka City (Oct. 2008) Hamamatsu City (Oct. 2008), etc.
Nagoya City (Oct. 2007)Seto City (Mar. 2008)Toyota City (Apr. 2008)Toyoake City (Apr. 2008)Anjo City (Jun. 2008), etc.
Gifu prefecture (Jan. 2008) Wanouchi-cho (Jan. 2008)Ogaki City (Mar. 2008) Kakamigahara City (Apr. 2008)Kitagata-cho (Jul. 2008) Takayama City (Oct. 2008)Gifu City (Sept. 2008)
Ise City (Sept. 2007) Nabari City (Jul. 2008) Iga City (Jul. 2008)Suzuka City (Sept. 2008) Kameyama City (Sept. 2008) Kuwana City (Oct. 2008) Inabe City (Oct. 2008) Kisosaki-cho (Oct. 2008) Toin-cho (Oct. 2008)
Suginami Ward (Jan. 2007)
Wakayama prefecture (Scheduled in Jan. 2009)
Kaifu-gun (Jul. 2007)
Yamanashi prefecture (Jun. 2008)
Higashine City (May 2008)Yamagata City (Jul. 2008)Tsuruoka City (Sept. 2008)Tendo City (Oct. 2008), etc.
Toyama prefecture (Apr. 2008)
Sado City (Apr. 2007)
Kobe City (Feb. 2007)Aioi city (Jun. 2007)Kamigori-cho (May 2008)
Fukuoka City (Dec. 2007)
Hiroshima City (Apr. 2008)
Kyoto City (Jan. 2007)
Tsuruga City (Oct. 2007)
Machida City (Mar. 2008)
Hitachinaka City (Feb. 2008) Hitachiota City (May 2008)Kasama City (Jun. 2008) Tsukuba City (Sep. 2008) Takahagi City (Oct. 2008)
Hamanaka-cho (Apr. 2008)
[Legend]Charged: Voluntary agreement between municipality, residents, citizens’ groups, and business operators (I)
Charged: Request for cooperation by municipality (II)
Abolished: Voluntary agreement between municipality, citizens’ groups, and business operators (III)

67
Activities to Reduce Plastic Shopping Bags ~ Collaborations among Related Parties ~
Examples of charging for plastic shopping bags
[Kyoto City]: On January 10, 2007, business operators, citizens’ groups, Kyoto City Committee on Promotion of the
Charging of Plastic Shopping Bags, and Kyoto City concluded an agreement so as to restrict careless delivery and use of plastic shopping bags and encourage consumers to bring their own shopping bags. This “Kyoto-style” agreement was the first one concluded among citizens’ groups, companies, and the local government in Japan. Later, on April 17 and October 20, 2007 and on June 27, 2008, they had the second, third, and fourth meetings to conclude the agreement with additional parties. At present, the agreement is concluded with 13 business operators (67 stores, two shopping malls) and 13 citizens’ groups. The total number of bags used at 10 stores that started to charge for plastic shopping bags was reduced from the prior level (39.20 million annually) to 6.5 million.
[Kakegawa City] Kakegawa Supermarket Association, Kakegawa City Consumer Association, and Kakegawa City concluded an agreement for reducing
plastic shopping bags. Under this agreement, the charging started at nine stores on June 1, 2007, and spread to 18 stores of 15 business operators as of March 24, 2008. Kakegawa City launched a “My Bag 80” campaign and could raise the rate of the use of own bags to 80% by the end of December 2008 (from 38% in January 2007). The number of shopping bags used was reduced by 11.6 million during the period between June and September 2008, compared with the same months of the previous year.
[Ise City] On
September 11, 2007, seven supermarkets in Ise City, citizens’ groups, and Ise City concluded an agreement so as to reduce plastic shopping bags. The charging started at 21 stores in the city on September 21, 2007, and spread to 31 stores of 10 business operators as of September 21, 2008. The rate of the use of own bags was 91.3% in September 2008.
[Toyama prefecture]Concerted introduction of charging for plastic shopping bags at supermarkets: In November 2007, 12 supermarket operators in the prefecture, consumers’ groups, and the prefectural Plastic Shopping Bag
Reduction Promotion Council announced that charging for shopping bags would begin in April 2008. On March 5, 2008, the administrative authority, citizens’ groups, and business operators concluded an agreement on promoting the reduction of shopping bags and the charging started at 208 stores of major supermarket operators (including 88 stores of one laundry operator) in the prefecture on April 1, 2008. As of November 3, 2008, 400 stores of 44 business operators (including 148 stores of six laundry operators) charged for shopping bags. In the three months of April, May and June 2008, 29.293 million shopping bags were saved.
[Hamanaka-cho in Hokkaido]Declaration to reduce plastic shopping bags; Request all stores to cooperate: In April 2008 in Hamanaka-cho in Hokkaido (a town next to Nemuro City with a population of 7,000; it flourished through dairy farming to produce raw milk for
Häagen-Dazs ice cream and other products and through the fishing industry, and is the hometown of the animation “Lupin the 3rd”), the mayor, the president of the Chamber of Commerce, the president of autonomous associations, and the chairman of the Plastic Shopping Bag Reduction Promotion Committee singed the “Hamanaka-cho Declaration of Plastic Shopping Bag Reduction” and charging for shopping bags started. At 60 stores in the town, consumers who receive a plastic shopping bag at a store are supposed to put the charge (1 yen) in a box installed at each store (at three convenience stores and one home center, shopping bags are basically free but consumers are to put some money in a box of the same type on a voluntary basis). In October 2008, common shopping bags for town people designed by said committee won the “My Unique Bag Prize (Presidential Award from the Hokkaido Association of Department Stores)” at the “My Bag Contest in Hokkaido,” which was held by the Hokkaido Bureau of Economy, Trade and Industry and five distributor organizations. The idea to prepare the bags at member stores and lend them to consumers who forget their own bags was highly appreciated.
[Sendai City] On May 14, 2007, business operators, citizens’ groups, and Sendai City concluded an agreement for reducing plastic shopping bags.
Under this agreement, business operators are making efforts to start charging for shopping bags. The charging started at four stores of four business operators on June 1, 2007, and spread to 28 stores of seven business operators as of July 1, 2008. The number of shopping bags used from June 2007 up to the end of May 2008 was reduced by 12.1 million from the previous fiscal year.
Examples of establishing original municipal ordinances
[Suginami Ward]Suginami Ward Ordinance on Promotion of Charging for Plastic Shopping Bags:
On October 16, 2006, Summit Inc., Suginami Ward Plastic Shopping Bag Reduction Promotion Council, and Suginami Ward concluded the “Agreement on Activities to Promote the Reduction of Plastic Shopping Bags” and carried out a demonstration experiment from January 15, 2007 to March 31, 2007.In May 2007, the “Conference to Discuss Suginami Ward Ordinance on Promotion of the Charging of Plastic Shopping Bags (provisional)” was established and discussions started. In September, the discussion results were compiled and were disclosed for Public Comment from October 11 to November 10, 2007. The Suginami Ward Ordinance on Promotion of the Charging of Plastic Shopping Bags was adopted in March 2008 and was enforced on April 1, 2008 (the ordinance is applicable to supermarkets and other stores that use over 0.2 million shopping bags annually and such stores are obliged to submit a plan, by the end of June 2008, to raise the percentage of their customers’ use of their own bags to 60% or more in two years). As of April 1, one business operator (Peacock Store) submitted a plan for reducing plastic shopping bags to Suginami Ward and started charging at three stores in the ward (one of them had started charging for shopping bags prior to the enforcement of the ordinance).
[Sado City]
Sado City in Niigata started a “Campaign for Abolishing Plastic Shopping Bags” in April 2007. As of November 1, 2008, cooperative stores in the city increased to 195. According to the questionnaire survey for 22 large-scale stores, the percentage of customers bringing their own bags was 78.3%. The number of shopping bags used at 15 major stores out of those cooperative stores decreased from 4.73 million in FY2007 to 0.58 million in FY2008 (down by 88%).Public Comments were invited from August 15 to September 16, 2008, on a draft ordinance to require supermarkets and other stores that use over 0.1 million shopping bags annually to submit a plan to raise the percentage of their customers’ use of their own bags to 60% or more. The ordinance is scheduled to be enforced in April 2009.
Examples of abolishing plastic shopping bags
[Machida City]Conclusion of an agreement on abolishing plastic shopping bags at model stores: On March 4, 2008, Machida City, citizens’ groups, and a business operator (one supermarket in the city) concluded an agreement
on carrying out a test for abolishing plastic shopping bags, with the aim of realizing a “society without plastic shopping bags.” The test was initially scheduled to last only for six months from March 14, 2008, but it is still underway. The business operator is in charge of carrying out the test and verifying its effects, while citizens’ groups and the administrative authority fully support this activity. After this test, they are going to work on collaborating with other business operators in the city and are discussing means to expand the abolishment of plastic shopping bags throughout the city
Examples of business operators’ voluntary efforts
Plan to abolish free delivery of plastic shopping bags at 1000 stores nationwide by FY2012: AEON established the “Global Warming Prevention Manifesto” on March 14, 2008, and is planning to abolish the free delivery of plastic shopping bags at 1000 stores nationwide by FY2012 so as to raise the average percentage of customers who do not accept shopping bags to 80%. The company is going to donate 50% of the proceeds from the abolition of free delivery to local activities for environmental conservation and to use the remaining 50% to purchase CO2 emission rights and donate them to the national government. The free delivery of shopping bags was first abolished in January 2007, and expanded to 387 stores (including those scheduled) of the company’s consolidated companies by the end of 2008.
SEIYU set a goal to raise the percentage of customers who do not accept shopping bags to 50% by 2010 and started a service to discount 2 yen each for such customers at all its stores on June 14, 2007. The company also introduced a system to sell a shopping bag for 20 yen and exchange a no longer usable bag for a new one. As of the end of December 2007, the percentage reached 31.6% (23.7% at the beginning), exceeding 30%, the initial target for 2007. The monthly percentage for October 2008 was 47.5%.
LAWSON developed a “Convenience Store Eco Bag” which is of a size and shape, with pockets at both sides, just suitable for a boxed lunch and PET bottle drinks , which sell well at convenience stores. The company delivered the eco bags free of charge from March 28, 2007 through a “Campaign for Bringing an Eco Bag.” The company gradually expanded areas to deliver the bags and delivered a total of 1.682 million eco bags at its stores as of the end of February 2008.
POP Display StandsIn order to help shop clerks ask customers whether they need shopping bags, 12 convenience store chains that are members of the Japan Franchise Association, put POP Display Stands around cash registers for four months from July to the end of October 2008. The campaign was carried out at all stores of these 12 convenience store chains (42,000 stores).

68
In the automobile industry, efforts toward reduction include prolonged life in vehicles and liquids, lighter body on vehicles, and a reduced amount of refrigerant used for car air-conditioners. [1] Examples of prolonged life- Prolonged life in vehicles: Rustproof alloys are used for the body and underbody parts.- Longer lasting liquids for reducing the frequency of replacement
LiquidSpecified replacement
intervals
Engine oil 10,000kw=>15,000kw
Engine coolant liquid 3 years=>11 years
Oil filter 20,000kw=>30,000kw
CVT oil 40,000kw=>80,000kw
[2] Examples of weight reduction
[3] Examples of reducing refrigerant for air-conditioners in cars (HFC134a)- Development and installation of refrigerant saving air conditioners have been promoted for reducing the cost unit of the use of
refrigerant by 20% in 2010 in comparison with 1995.
95 99 00 01 02 03 04 05 06 07 08
Quantity per car (g) (% of 95)
700(100)
650(93)
615(88)
603(86)
588(84)
582(83)
553(79)
548(78)
536(77)
521(74)
520(74)
* Quantity per car = Total amount of HFC134a in production / Number of cars produced
Maximum reductions between 1995 and 2006
Passenger cars810g → 400g
-51%
Light cars500g → 290g
-42%
Buses6,800g → 4,000g
-41%
Major refrigerant-saving technologies
- Integration of components
- Compact and high-performance heat exchangers
- Sealed shaft at connections of piping
- Use of low-leak hoses
- Comprehensive control of assembling process
(Source: Material from the Global Warming Prevention Subcommittee, Biotechnology Taskforce, Industrial Structure Council)
2 Automobiles
- Weight reduction by using high-tension steel plates (rational use of raw materials)
- Weight reduction by 151kg through heavy use of light metals
Reinforced Front Hinge Pillar (different thickness)
Front Door Inner Panel (different thickness)
Rear Door Inner Panel (different thickness)
Main Floor
Reinforced Rear Hinge Pillar
Thin Wall Fuel Filler Pipe
Aluminum Trunk Lid (high speed blow molding)Magnesium Front Seat
Back Frame
Lightweight Sound Proof Floor Mat
CFRP Propeller Shaft
Aluminum Rear Subframe
Aluminum Rear Bumper Beam
Aluminum Casting Rear Lower Arm BAluminum Extrusion Rear Lower Arm AAluminum Casting Rear Control Arm
Aluminum Casting Rear KnuckleAluminum Casting Rear Upper Arm
Aluminum Rear Brake Caliper
High Frequency Quenching Center Pillar
Aluminum Bonnet Hood
Aluminum Front Fender (high speed blow molding)
Aluminum Die Casting Two Piece Intake Manifold
Magnesium Cylinder Head Cover
Aluminum Front Subframe
Aluminum Mount Collar
Aluminum Bracket
Aluminum Front Bumper Beam
Aluminum Casting Front Arm (peeling-less)
Aluminum Casting Front Knuckle
Aluminum Casting Front Upper Arm
Aluminum Front Brake Caliper
Strength Side Sill
Inner Panel Side Sill
*MPa is an abbreviation for Mega Pascal and indicates the types of strength of high-tension steel plates.

69
[1] Expansion of available volume in the same dimensions- Expansion of available volume from 450 to 500
liters in the same dimensions by increasing the effective volume through the development of new materials for parts with thinner walls, and review of parts arrangement.
[2] Examples of reducing the amount and weight of raw materials- Thin wall design for large components and gas formation
contributed to reducing the amount of resin used by 17% (7,510g -> 6,240g).
- Product weight was reduced by 21% to facilitate collection and transportation
(26.6kg -> 21.0kg).
[3] Examples of prolonged life- The number of parts for replacement was reduced by
installing a deodorizing filter using a transition metal catalyst for which neither maintenance nor replacement is needed for ten years.
Old New
Higher function (performance, capacity) inthe limited external dimensions (resources)
*500-liter level function in the externaldimensions for 450 liters
Development and use of high-performance vacuum and urethane-insulating materials for
increasing the effective internal volume
Development and appropriate arrangement of a compact, high-performancecompressor and prevention of effects of heat
Development and use of high-performancefans for integration
Development and use of compact coolingunits for integration
Movement of the evaporating dish directly beneath the machine compartment
Freezer:Approx. -20 C
Compressor: Approx. 50 C
Compressor: Approx. 50 C
Chiller: Approx. 5 C
Ex
pa
ns
ion
of
vo
lum
e
Deodorizing filter using a transition metal catalyst
(Source: Product Assessment Example Management System, Association for Electric Home Appliances)
http://www.aeha.or.jp/assessment/example.html
(Source: Material from Basic Policy WG, Waste Prevention and Recycling Subcommittee, Environment Taskforce, Industrial Structure Council)
(Source: Product Assessment Example Management System, Association for Electric Home Appliances)
http://www.aeha.or.jp/assessment/example.html
3 Home Electric Appliances
Thin wall design for resin-component formation
Use of recycled materials
Separated parts for reducing volume

70
1 Glass Bottles
Glass Bottle Recycling Promoter Associationhttp://www.glass-recycle-as.gr.jpPresent Situation of Reuse and Recycling
(1) Reuse of glass bottles (returnable bottles)Returnable bottles, traditionally used for large Sake bottles,
beer bottles and milk bottles, are cleaned each time they are returned for reuse; and because of their availability for repeated use, they have a much lower environmental impact than disposable containers, and are particularly effective both for curbing global warming and promoting 3R measures.
The effect of energy saving is high in returnable bottles -- their energy consumption is several times smaller than disposable bottles throughout the lifecycle from production to collection and disposal. In addition, approximately 100g of CO2 emissions can be reduced by buying goods in returnable bottles, instead of those in disposable bottles.
Yet, the recent use rate of returnable bottles has been declining year by year because of changes in consumer preference, and various efforts have to be made to promote the use of returnable bottles.
When the use of returnable bottles, which has continuously been in decline, can be maintained or even recovered through these efforts, energy saving and reduction in CO2 emissions will be significant. (For example, if the level of 2005 is ensured in 2010, the energy saving equivalent to approximately 200,000 kilo liters of oil (i.e., biomass fuel introduction target of 210,000 kilo liters) will be achieved).
In addition to large Sake bottles, beer bottles and milk bottles, returnable bottles are used for 720-ml and 300-ml Sake, 900-ml distilled spirit, 200-ml juice, and seasonings such as vinegar and soy sauce. A marusho (“regular” in Chinese character enclosed by a circle) or R mark is engraved on these returnable bottles for ensuring they are returnable.
<< Comparison of energy consumption (per container)>>
0.0
1.0
2.0
3.0
4.0
5.0
6.0
7.0(MJ)
One-way container (disposable)
Returnable container (reuse)
500 mlglass 633 mlglass 350 mlglass 250 mlglass 500-ml PET 1500-ml PET
Major returnable bottles
(Source: Institute for Policy Sciences (report of survey concerning Containers and Packaging Lifecycle Assessment in FY2004))
Changes in use rate of returnable bottles
1998 1999 2000 2001 2002 2003 2004 2005 2006 2007 2008Shipments of returnable bottles(10,000 tons) 340 310 275 255 217 192 180 170 159 153 144
Shipments of one-way bottles(10,000 tons) 188 178 173 168 166 156 133 129 126 123 119
Rate of returnable bottles 64.4 63.5 61.4 60.3 56.7 55.2 57.5 56.9 55.8 55.4 54.8
0
50
100
150
200
250
300
350
400
1998 1999 2000 2001 2002 2003 2004 2005 2006 2007 200850
52
54
56
58
60
62
64
66Shipments of returnablebottles (10,000 tons)Shipments of one-way bottles (10,000 tons)Rate of returnable bottles
(Source: Glass Bottle Recycling Promoter Association)
Sake Beer Sake MilkSoda popDistilled spirits

71
Glass Bottle Recycling Promoter Associationhttp://www.glass-recycle-as.gr.jp
Fig. IV-2 Shipments of Eco-bottles
(2) Recycling of glass bottlesGlass bottles are classified into returnable bottles used
repeatedly (e.g., beer bottles, large Sake bottles and milk bottles) and one-way bottles containing food, seasonings, beverages, medicine, juice, refined sake, and distilled spirit (in the order of the largest volume of use), which are collected and reused as raw glass materials (cullet).
The cullet use rate has been increasing every year since FY1989 and had already reached 96.7% by FY2008, exceeding the 91%-level that was expected to be achieved by FY2010 under the Law for Promotion of Effective Utilization of Resources (see Fig. IV-1). While almost all colorless and brown glass containers are recycled as raw glass materials,
60% of glass containers in other colors is recycled for other uses.
Eco-bottles, which contain cullet by more than 90%, have been increasingly used year by year, reaching 105 million in 2008 (see Fig. IV-2).
Fig. IV-3 Ratio of Cullet Supplied for Other Uses (FY2007)
Source: Japan Glass Bottle Association
Fig. IV-1 Amount of Glass Bottles Produced, Amount of Cullet Used and Cullet Use Rate
Used for glass wool
Use for asphalt paving
Glass shortfiber
28.4%
Roadbedmaterials,backfillingmaterials
53.7%
Pavingaggregate
4.8%
Burnt tiles6.8%
Secondaryconcreteproducts
1.5%
Others4.8%
Seasoning
1.8-liter sake
Middle and smallbottles of sakWhisky
Distill spirit
Other wines andspiritsBeverage
Juice
Beer

72
How to identify returnable bottles
Marusho mark
R mark
A mark specified in the Measurement Law. It indicates the containers manufactured in such a way as to ensure a specified quantity of liquid when the containers are filled with a liquid product to a certain height. Bottles with this mark have been used as returnable bottles since the early times.
A mark attached to standardized returnable bottles approved by the Japan Glass Bottle Association.
Glass Bottle Recycling Promoter Associationhttp://www.glass-recycle-as.gr.jp
Flow of Recycling of Glass Bottles (FY2007)
Cullet plants Autonomous bodies (Municipalities)
Glass bottle plants Stores and consumers
Flow of Recycling of Glass Bottle Materials (FY2008)
METI Reuse Model Projects
● FY2008
◆ Demonstration project to sell goods in returnable bottles and collect used bottles at drugstore chains
◆ Model project for a recycling system for R300 bottles and R900 bottles in Kyoto
◆ Demonstration project to introduce reuse cups at smaller scale athletic events
◆ Creation of a portal site for returnable bottles

73
The weight of steel cans recycled in 2008 was about 680,000 tons and the recycling rate was 88.5%, exceeding the 85% level targeted in the Guidelines for Waste Treatment and Recycling by Product Category (see Fig. IV-4). Thus, recycling of steel cans is going smoothly, for the following reasons.[1] Separate collection systems have been disseminated
nationwide.[2] People become more aware of separate collection.[3] Steel makers provided effective acceptance systems
for recycling scrapped cans (82 locations across the nation).
[4] Resource recycling markets are established throughout the steel industry.
Used steel cans are pressed into scraps or shredded and used as materials in iron-making plants. They are also recycled into various iron products, such as construction materials, materials for automobiles, and materials for refrigerators, washing machines, and other home appliances and new steel cans (see Fig. IV-5).
2 Steel Cans
1982 1983 1984 19861985 1987 1988 1989 1990 1991 1992 1993 1994 1995 1996 1997 1998 1999 2000 2001 2002 2003
Recycling rate = Weight of steel cans recycled Weight of steel cans consumed
Source: Japan Steel Can Recycling Association
Notes)1. For data up to 1998, the amount of cans produced and the amount of can scraps are used as
the weight of cans consumed and the weight of cans collected, respectively.2. Steel cans in the figure refer to beverage cans, generals cans and 18-liter cans.
■ Steel cans consumed ■ Steel cans recycled ■ Recycling rate
2005
(%)(tons)
2004 (Year)2007 20082006
100
80
60
40
20
00
300,000
600,000
900,000
1,200,000
1,500,000
39.5 39.9
33.236.6 38.0 38.1
40.743.6 44.8
50.1
56.8
61.0
69.873.8
77.379.6
82.5 82.9
84.2 85.2 86.1 87.5
975,850 975,4511,026,802
1,117,8721,126,749
1,207,3021,249,942
1,332,756
1,458,6481,437,834
1,399,5911,359,741
1,475,0061,420,761 1,422,420
1,351,478
1,284,5461,268,928
1,215,357
1,055,237
948,644911,224
385,733 389,000341,000
409,000 428,000460,000
509,000
581,000 654,000
721,000
795,000829,010
1,030,0001,047,960
1,100,2201,075,265
1,059,5721,051,397
1,022,800
898,565
816,806 796,921
87.1
908,397
791,298
867,998 834,000
777,701
831,546
770,250732,220
710,000683,046
88.7 88.185.1
88.5
39.5 39.9
33.236.6 38.0 38.1
40.743.6 44.8
50.1
56.8
61.0
69.873.8
77.379.6
82.5 82.9
84.2 85.2 86.1 87.5
975,850 975,4511,026,802
1,117,8721,126,749
1,207,3021,249,942
1,332,756
1,458,6481,437,834
1,399,5911,359,741
1,475,0061,420,761 1,422,420
1,351,478
1,284,5461,268,928
1,215,357
1,055,237
948,644911,224
385,733 389,000341,000
409,000 428,000460,000
509,000
581,000 654,000
721,000
795,000829,010
1,030,0001,047,960
1,100,2201,075,265
1,059,5721,051,397
1,022,800
898,565
816,806 796,921
87.1
908,397
791,298
867,998 834,000
771,601
831,546
770,250732,220
710,000683,046
88.7 88.185.1
88.5
Recycled products
683kt
Supplied by can manufacturers
Food manufacturers/bottles
Food cans 523ktGeneral cans 112kt18-liter cans 30kt
Imports108kt
Exports1kt
Food distribution
Steel cans consumed
772kt
Aluminum covers, foreign materials
33kt
Discharged from households
Discharged from businesses
Iron and steel manufacturers
*716kt
Building materials, automobiles, home appliances, steel cans, etc.
Iron scrap disposers
716kt
Local governments(36.6%) *262kt
Disposers in the private sector
(63.4%)*454kt Dumped,
scattered, etc.*56kt
Source: Japan Steel Can Recycling Association
Fig. IV-5 Flow of Recycling of Steel Cans (FY2006)
Fig. IV-4 Weight of Steels Cans Consumed, Weight of Cans Recycled and Recycling Rate
Japan Steel Can Recycling Associationhttp://www.steelcan.jp

74
3 Aluminum Cans
The weight of aluminum cans consumed, the weight of cans recycled and the recycling rate have been increasing year by year (see Fig. IV-6) as the rate of canned beer and the rate of aluminum cans for drinks other than beer have been increasing. The recycling rate of aluminum cans has been improving due to the following:[1] the spread of collecting sorted waste;[2] the large number of users of recycled cans; and[3] the ease of recycling aluminum cans.
In FY2008, the amount of aluminum cans recycled was 261,000 tons and the recycling rate was 87.3%, with businesses being asked for their continuous cooperation and to contribute to educational activities in order to achieve the 90%. The weight of aluminum cans reused as materials was 175,000 tons in FY2008 and the can-to-can rate was 66.8%. Aluminum cans are also reused for automobile parts, deoxidizers for iron-making (see Fig. IV-6 and IV-7).
78.5
169.6 167.5
174.4 177.8 177.4185.2 184.3 183.6
166.5
185.2171.4
184.3
160.3168.6
159.1
145.6
147.2144.3135.0133.2
80.6 82.8 83.1 81.886.1
91.7 90.9 92.787.3
75.8 74.5
67.870.3
63.7 61.757.3
62.1 62.766.8
No.
of c
ans
cons
umed
/col
lect
ed (
100
mill
ion
cans
)
Rec
yclin
g ra
te (
%)
50
0
100
150
200
250
1999 2000 2001 2002 2003 2004 2005 2006 2007 2008 0
10
20
30
40
50
60
70
80
90
100No. of cans consumedNo. of cans recycled
Recycling rate (%)Can-to-can rate (%)
Notes) 1. The recycling rate is the proportion between the weight of recycled cans and that of consumed cans. 2. The can-to-can rate is the percentage of aluminum cans recycled into aluminum cans again.
Japan Steel Can Recycling Associationhttp://www.steelcan.jp
Fig. IV-6 Changes in the aluminum can recycling rate (last decade)
Fig. IV-7 Flow of Recycling of Aluminum Cans (FY2008)Notes:1 . T h e t o t a l a m o u n t o f
aluminum cans recycled is calculated by the Japan Aluminum Can Recycling Association based on the survey resul ts repor ted by r e c y c l i n g bu s i n e s s operators.
2 . T h e t o t a l a m o u n t o f aluminum cans consumed i s c a l c u l a t e d b y t h e Association based on the data provided by METI and other surveys.
3 . T h e t o t a l a m o u n t o f aluminum cans recycled acco rd ing to rou tes i s est imated by the Japan Aluminum Can Recycling Association.
Source: Japan Aluminum Can Recycling Association
Amount consumed 299,000 tons(18.43 billion bottles)
Dis
char
ged
from
hous
ehol
ds
269,000 million tons
Generalhouseholds,etc.
Dis
char
ged
from
busi
ness
es
30,000 million tons
Vending machines/Kiosk
Business offices
Plants
Trains/Busses
Leisure facilities
Others
135,000 tons
106,000 tons
16,000 tons
27,000 tons
12,000 tons
3,000 tons
Sorted collection
Collected by citizens' groups(neighborhood associations,volunteers, schools, etc.)
Collection at sites(supermarkets,convenience stores, etc.)
Bottlers and cleaningservice businesses
Others
Recycling facilities andunburnable waste disposalfacilities
Taken way from stationsfor sorted discharge
Waste disposal businesses
110,000 tons
25,000 tons
106,000 tons
16,000 tons
27,000 tons
15,000 tons
Res
ourc
eco
llect
ion
busi
ness
es28
4,00
0to
ns
Retainedwaste:
18,000 tons
included in284,000tons
Rec
yclin
gbu
sine
sses
(sec
onda
ryal
lym
anuf
actu
rers
,etc
.):2
61,0
00to
ns
Amount recycled: 261,000 tons(16.03 billion bottles)
For aluminum cans:175,000 tons (66.8%)
For die-casting/deoxidizers:86,000 tons (33.2%)
Exported:5,000 tons
Landfilled or burned:15,000 tons

1,000 tons
Pro
duct
ion,
Sal
es a
nd C
olle
ctio
n
Production of resinCollection by businessesSeparate collection by municipalities
Old collection rateCollection rate
Sales of specified labeled PET bottlesCollection by businesses
Col
lect
ion
rate
%
1997 1998 1999 2000 2001 2002 2003 2004 2005 2006 2007 2008 Fiscal year- Old collection rate = [Separate collection by municipalities + Collection by businesses] / Production of resin for PET bottles (FY1997 - FY2004)- Collection rate = [Separate collection by municipalities + Collection by businesses] / Sales of PET bottles (FY2005 and FY2008)
75
Fig. IV-8 Changes in Production, Sales and Collection of Specified Labeled PET Bottles and Collection Rates
Fig. IV-9 Volume and Use of Domestically Recycled PET Bottles in FY2008
4 PET Bottles
The Council for PET Bottle Recycling http://www.petbottle-rec.gr.jpThe Japan Containers And Packaging Recycling Association http://www.jcpra.or.jp
PET bottles used for soft drinks, specified seasoning, and alcohol are to be labeled under the Law for Promotion of Effective Utilization of Resources. Due to the revision of PET bottle categories, the category of “soy sauce” was expanded and reorganized as “specified seasoning” in April 2008.The collection by both municipalities and businesses of PET bottles, one of the specified labeled products, has increased rapidly since around the time of the enforcement of the Containers and Packaging Recycling Law in 1997, in line with the increase in PET bottles for beverage use (see Fig. IV-8).
In FY2008, the sales of specified labeled PET bottles were 571,000 tons, while the amount collected by municipalities was 284,000 tons and the amount collected by businesses as confirmed by the Council for PET Bottle Recycling was 162,000 tons. The collection rate was 77.9%
The amount of resin recycled in Japan as confirmed by the Council for PET Bottle Recycling was 192,000 tons, which was reused for fiber products (46%), sheet products (50%), bottles (2%), and molded items and others (2%) (see Fig. IV-9).
Fiber products
Suit
Molded items and others 2%Bottles 2%
Sheet 50%
Domesticallyrecycled PETflakes in FY2008:1,916,000 tons
Fiber46%
Floor mat
School bag
Sheet products
Plastic folder Parting tray Egg pack
Bottles Detergentbottle
Drinking waterbottle
Molded itemsand others
Box for collectingcontainers
PET band
Garbage bag

10,000 tons/year
MSW Industrialwaste
Domesticconsumptionof resin products
Resinproduced
1980 1985 1986 1987 1988 1989 1990 1991 1992 1993 1994 1995 1996 1997 1998 1999 2000 2001 2002 2003 2004 2005 2006 2007 2008 (Year)
Stages of producing resin, processing products and placing pr oducts on the market Stage of discharging waste Stage of managing waste
Resinproduced
1,345
Domesticconsumption ofresin products
1,089
Resin productsused and
discharged912
MSW502
Industrialwaste496
Total plasticwaste discharged
998
Processing/production waste
discharged86
Processing/production
waste86
Resinrecycled
53
Resin exported386
Plastic materials66
RDF7
RDF35
Landfill42
Simple incineration37
Landfill80
Plastic materials147
Liquefaction/gasification/blast furnacing
5
Incineration forpower generatio
147
Incineration forheat application
82
Liquefaction/gasification/blast furnacing
24
Incineration forpower generatio
207
Incineration forheat application
42
Simple incineration80
Resin imported194
Liquid resin129
Processing waste65
Production waste21
Resin products imported160
Resin products exported83
Industrial waste
MSW Total waste
Us ed
Not used
Us ed
Not used
Plastic materials
21421%
Mat
eria
l rec
yclin
gCh
emica
l rec
yclin
gT
herm
al e
r cy
clin
gN
ot u
sed
Liquefaction/gasification/
blast furnacing253%
RDF414%
Plastic wasteeffectively
75876%
Plastic wastenot used
24024%
Simple incineration
11812%
Landfill12212%
Incineration for power generation
35335%
Incineration for heat application
12412%
The amount of production waste is not included in the amount of resin production.
The amount for this year is based on that of materials recycled from the previous year (2.13 million tons) except for the amount of exported (1.52 million tons) and recycled fiber from PET bottles (80,000 tons).
The amount of resin products used and discharged is calculated using the original estimation system of the institute, based on amounts used by demand sector and resin type (the amount used in each year since 1976) and product-life cycles by demand sector (1960 discharge model established by the institute).
Numbers ① to ⑥ correspond to those in the chart in the following page.
76
5 Plastics
• The effective utilization rate of plastic waste increased by 3% to 76%, while the recycling rate of general waste materials remained the same as the previous year.The amount of plastic waste generated was 9,980,000 tons (up by 40,000 tons from the previous year). The amount of MSW was at the same level as the previous year, at 5,020,000 tons, and that of industrial waste increased slightly by 40,000 tons to 4,960,000 tons.• Out of the 5,020,000 tons of MSW, the amount of containers and packaging was the largest at 3,540,000 tons (percent distribution: 71%), followed by domestic articles (970,000 tons, 19%), electric/machinery (260,000 tons, 5%), and others (250,000 tons, 5%). These ratios were almost the same as in the previous year. The amount of industrial waste (4,960,000 tons) is broken down as follows: electric/machinery – 1,220,000 tons (percent distribution: 25%); containers and packaging – 1,150,000 tons (23%); construction materials – 720,000 tons (15%); transportation – 440,000 tons (9%); agriculture, forestry and fisheries – 180,000 tons (4%); domestic articles – 130,000 tons (3%); and others – 250,000 tons (5%). There were 10,000-ton decreases from the previous year both in agriculture, forestry and fisheries, and domestic articles. Processing and production waste also declined from 890,000 tons in the previous year to 860,000 tons (17%).• The amount of plastic waste used effectively increased by 360,000 tons to 7,580,000 tons (76% of the total amount discharged). The amount used as raw materials (material recycling) was almost the same as in the previous year, at 2,140,000 tons (up only 10,000 tons). Regarding the amount used for thermal recycling, the amount used as “solid fuel”
decreased by 190,000 tons to 410,000 tons, and the amount “incinerated for heat application” decreased by 80,000 tons to 1,240,000 tons, while that “incinerated for power generation from waste” increased by 640,000 tons to 3,530,000 tons. As a result, the percent distribution of thermal recycling (energy recovery) expanded from 48% to 51%. Meanwhile, the amount used for liquefaction, gasification or blast furnacing (chemical recycling) decreased by 40,000 tons to 250,000 tons.• The amount burned decreased by 290,000 tons to 1,180,000 tons and the amount landfilled decreased by 20,000 tons to 1,220,000 tons, while the total declined by 310,000 tons to 2,400,000 tons.• The amount of plastic waste has generally changed within a small margin compared with the previous year.
Fig. IV-10 Amount of Plastics Produced and Discharged
Fig. IV-11 Flow of Recycling of Plastic Products and Waste (2006) (Unit: 10,000 tons)
Plastic Waste Management Institutehttp://www.pwmi.or.jp

77
6 Styrofoam
Japan Expanded Polystyrene Recycling Association (JEPSRA)http://www.jepsra.gr.jp
Styrofoam in a broad sense is divided into three types, according to the manufactu r ing method: expanded polystyrene (EPS) or sty rofoam in a nar row sense; polystyrene paper (PSP); and extruded polystyrene (XPS). These three types of styrofoam are used and treated in final disposal differently.(1)EPS: It is used for containers for agricultural or fishery
products or buffer packaging for home appliances and OA equipment, and generally discharged from businesses. The amount of EPS supply decreased slightly from about 240,000 tons in 1991 to about 200,000 tons. The amount of domestic distribution has been about 170,000 to 180,000 tons (see Fig. IV -13), of which 56% is used for containers for fresh fish or vegetables/fruit, 30% for buffering, and the rest for construction/civil engineering (see Fig. IV-12).
EPS waste is collected through wholesale markets, and large home appliance stores and supermarkets or by businesses engaging in intermediary treatment of industrial waste. The amount of EPS collected and recycled has been increasing year by year, reaching 82,200 tons (material recycling) with the material recycling rate at 53% in 2008. Collected EPS waste is recycled as ingots (about 80% is finally exported), reused as packaging, videocassettes or synthetic wood after being palletized, or used as mortar additives after crushing. Thermal recycling such as incineration for power generation was carried out for 30.5% of domestic distribution (2008); and the material recycling and energy recovery rate was 83.5%. Chemical recycling, such as reduction in blast furnacing, liquefaction or gasification, also started in 2001 (see Fig. IV-13).
Fig. IV-12 Amount of EPS Supplied, by Use (thousand tons/year)
Chemical recycling
Others
Crushed
Pellets
Ingots
90,000(tons)
0
10,000
20,000
30,000
40,000
50,000
60,000
70,000
80,000
1997 1998 1999 2000 2001 2002 2003 2004 2005 2006 2007
55,000 56,80060,400
63,900 66,300 68,800 68,00071,800 71,400
75,80082,500
Total
Fig. IV-13 Actual Data of Material Recycling
(168,000 tons in 2008)
Source: Japan Expanded Polystyrene Recycling Association
Construction/civil engineering
20,800 tons (12%)
Buffering, etc. 49,900 tons
(30%)
Containers 97,300 tons
(58%)

78
(2)PSP: It is used for many kinds of food containers such as trays, noodle cups, natto containers, and packed-meal cases. PSP is a resource-saving material made more than 90% from air and less than 10% from polystyrene resin. Type III Eco-Leaf is issued as the environmental label for this material.The annual shipment of PSP is about 130,000 tons, and the
ratio of PSP in 900,000 tons of food containers made of oil in Japan is 13%. The estimated ratio of the food containers containing other materials in the approximately 14 million tons (Note 1) of domestically consumed volumes of plastics is about 6%.
The amount of oil used for producing PSP is equivalent to 0.1% of the total volume of oil consumed in Japan (roughly 0.22 billion kilo liters).
Note 1) Present Situation of Petrochemical Industry 2007, p4, p13 (Japan Petrochemical Industry Association)
The majority of PSP food containers are disposed as domestic garbage. This is equivalent to 0.3% of all domestic garbage, but in fact, all of these are subject to the Container
and Packaging Recycling Law. White trays are separately collected by municipalities, while the voluntary collection system is also available for PSP trays (white, colored, and patterned). In this system, consumers clean and dry these trays and bring them to stores. Consumers and container manufacturers are the main players, and distributors, supermarkets and other mass retailers cooperate in promoting collection. The amount of collection in the voluntary collection system reaches around 12,000 tons annually.
Adding the amount of collected and recycled PSP after being cleaned and dried by consumers according to the Containers and Packaging Recycling Law, the entire recycling rate is roughly 30% of the amount of PSP and trays produced.(Reference: Japan Polystyrene Foamed Sheet Industry Association
http://www.jasfa.jp, Japan Polystyrene Paper Fabrication Industry Association http://www.japfca.jp/
(3)XSP: It is used as heat-insulating construction materials and discharged by construction operations
Table IV-1 Amount of Collected and Recycled PSP Traysunit: 1,000 tons
PSP tray production2000 2001 2002 2003 2004 2005 2006
Estimated separate collection (3rd Separate Collection Plan)
8.30 11.9 14.9 10.2 12.6 14.4 9.50
Result of separate collection 3.04 3.40 3.55 4.22 3.93 4.58 4.33
Accepted by the Container and Packaging Recycling Association: Inner number of results
0.66 0.99 1.05 1.16 1.13 0.97 0.90
Voluntary collection and recycling (including colored and patterned)
13.8 14.1 12.8 12.4 11.9 11.6 11.7
(Source: Japan Polystyrene Foamed Sheet Industry Association)
Plastic Waste Management Institutehttp://www.pwmi.or.jp
Collection Carrying in Sorting
Recycled products Recycled material
Recycling
Schematic illustration of voluntary collection

79
7 Paper
In 2008, the production of paper/paperboard reached 28.85 million tons, the majority of which is consumed domestically (see Fig. IV-14).
Used paper discharged from households is collected by local communities or municipalities. Used paper discharged from industries is collected by collecting traders, and used paper discharged voluminously from industries (e.g., printing and bookbinding plants) is collected by tsuboage businesses specialized in collecting mainly industrial waste.
In 2008, 22.21 million tons of used paper was collected and about 19.13million tons of recycled paper were consumed (see Fig. IV-15). Both the paper collection rate and the paper recycling rate (rate of used paper to the total paper-making raw materials) have been increasing year by year, reaching 76.7% and 62.4in 2008 respectively (see Fig. IV-16).
The target of the paper-recycling rate is 62%, and it is expected to be achieved by FY2010 under the Law for Promotion of Effective Utilization of Resources.
In order to achieve this target and to advance the used paper recycling further, it is important to advance the used paper in the paper field where the paper recycling rate is low compared with the hardboard field. To achieve this, paper manufacturers are expected to improve used paper recycling technology, and consumers are expected to proactively use used paper products while increasing their awareness of such products and thoroughly separate used paper from other garbage.
Under the Containers and Packaging Recycling Law, 83,804 tons of used paper containers were separately collected by municipalities and 82,026 tons were recycled in
FY2008. About 80% of the total amount of recycled paper is used for corrugated cases, newspapers, and magazines. In recent years, the export of used paper has expanded rapidly, and 3.87 million tons were exported in 2008.
Slightly more than 1% of total recycled paper is also used as cushioning, such as pulp mold, heat insulators for building, and solid fuel.
Pulp production 9,771 Pulp export 209
*164
Pulpwoodconsumption(1,000 m3) DP 10,391 Import 25,153 Total 35,544
Pulp import 1,753 Pulp consumption
Paper/paperboard import 1,332
Paper/paperboard production 28,849
Paper/paperboard export 1,268
Consumption 18,124
Consumption 129
Paper/paperboard supply 28,880
Paper/paperboard consumption 28,943
Used paperuncollected 6,732 (23.3%)
Use
d pa
per s
uppl
y to
pape
r man
ufac
ture
rs
18,236
Rec
ycle
d pu
lp
sale
s
Dire
ct s
uppl
iers
(in
clud
ing
gene
ral t
radi
ng c
ompa
nies
)
Used paper imports 55
Used paper exports 3,866
Collection spots
Intermediate businesses (including collecting agents)
Tsuboage businesses
Collection by citizens(town clubs, schools, kids clubs, etc.)
Collection by local gover nmentsCollection by newspaper distributors
Collecting businesses
Households
Community(Mainly wholesalers districts)
Small sites (Mainly small shopping area,
office buildings, stations and markets)
Large sites(Factories of corrugated papers, paper containers, printing, bookbinding, publishers, newspaper companies, department stores and supermarkets)
Sou
rces
of u
sed
pape
r
Use
d pa
per c
olle
cted
22,211(76.7%)
Fig. IV-16 Paper Collection Rate and Paper Recycling Rate
Fig. IV-15 Generation and Distribution of Recycled Paper (2008: thousand tons/%)
Fig. IV-14 Paper Production by Type of Paper (2007)
Paper Recycling Promotion Centerhttp://www.prpc.or.jp
39.0% 30.5%
6.1%
2.4%
28,849,363
61.0%
12.5%
Newspapers 12.5%
Printing/informationpaper36.6%
Paper61.0%
Packing paper 3.2%
Toilet paper 6.2%
Paperboard 2.6%
Corrugatedcases30.5%
Paperboard 39.0%
Paperboard for paper container 6.1%
Other paperboard 2.4%
Total production 28,849,363 tons
1974 1980 1985 1990 1995 2000 2005 2008
Paper collection rate
Paper recycling rate

80
8 Automobiles and Motorcycles
In 2005, the number of vehicles owned was 74.69 million while the number of disused vehicles has remained almost unchanged in the past decade at around 4 million a year (see Fig. IV-17). The recycling system for end-of-life vehicles has already been established in the form of infrastructure for collecting iron scraps. In this system, the collection rate is nearly 100% and the recycling rate has reached 90% (see Fig. IV-18). In May 1997, the Ministry of International Trade and Industry (the current Ministry of Economy, Trade and Industry) published the End-of-Life Vehicle Recycling Initiative, which set specific numerical targets such as improving the recycling rate for end-of-life vehicles to 95% or more by 2025 and reducing the amount of end-of-life vehicles dumped into landfill to 1/5 of the amount in 1996.
Shredder dust generated from end-of-life vehicles (waste remaining after shredding dismantled ELVs) was mainly used as landfill. But the shortage of final waste disposal facilities means we need to decrease the quantity of shredder dust used as landfill. Furthermore, fees are needed when car owners dispose of cars because of the rising landfill fee and changes in the fee for iron scraps. Under these circumstances, the recycling system of ELVs was in disarray at one time, and there was concern about illegal disposal.
It contributes to global warming when car air conditioners and CFCs are not treated properly. Airbags are obstacles in car dismantling and require professional treatment. In view of these circumstances, the End-of-life Vehicle Recycling Law was enacted in January 2005. By the end of March 2008, recycling fees had been deposited for about 74.17 million
vehicles (770.9 billion yen). As the Law for Promotion of Effective Utilization of Resources includes automobiles in the specified resource-saving products and the specified reuse-promoting products, the automobile industry works on the recycling of resin parts, development of recycling technology in consideration of the discarding stage, development of new materials and car structures that will contribute to recycling, and implementation of material marking.
2005200420032002200120009199199819971996199519941993199219910
200
400
600
800
1,000
100
300
500
700
900
0
1,000
2,000
3,000
4,000
5,000
6,000
7,000
8,000(1,000 units) (1,000 units)
531
5,991
752
522
696
6,166
486
647
6,326
478
653
6,501
502
687
6,685
513
708
6,880
552
673
7,000
507
589
7,081
495
586
7,212
504
596
7,265
515 521
591 579
7,341 7,399
560 541
583 585
7,422 7,466
482
585
7,469
Number of disused vehicles and used vehicles exported
Number of vehicles newly registered
Number of vehicles owned
selcihev fo rebmun = detropxe selcihev desu dna selcihev desusid fo rebmuN .1 :setoNowned in the previous year + number of vehicles newly registered in the present year – number of vehicles owned in the present year
si detropxe selcihev desu dna selcihev desusid fo rebmun eht fo nwoadkaerB .2 unknown due to lack of eligible statistics.
Source: Japan Automobile Manufacturers Association
End-of -life vehiclerecycling rate
= Source: Ministry of Economy, Trade and Industr
Airbags
Note: The same businesses may operate as dealers, used car dealers, or auto repair shops.
Dealers
Used car dealers
Auto repair shops
Local governments
Car manufacturers and importers (take back and recycle/destroy)
Discarded on streets
CFC12HFC134a
Shredder dust
Car
man
ufac
ture
rsC
ar im
port
ers
Dea
lers
End
use
rs
Shr
edde
r bu
sine
sses
(a
bout
130
0)
Dis
man
tling
bus
ines
ses
(abo
ut 6
,700
)
ELV-c
ollectin
g bus
inesse
s (ab
out 7
8,000
)CF
Cs-co
llectin
g bus
inesse
s(abo
ut 18
,000)
Rec
yclin
g ra
te 9
5%
New
car
sal
es:
abou
t 5.1
mill
ion
Impo
rted
car
s sa
les:
ab
out 2
.4 m
illio
n
Dea
lers
Reused parts 20-30%
(engines, body parts, electrical components)
Recycledas parts20-30%
Recycles as materials50-65%
Shredder dust 10-15%
Recycled partsabout 15%
(engines, catalysts,nonferrous metals, tires)
End-of-lifevehicle scraps(only outer frames
without engines or tires)55-65%
Weight of vehicles supplied for recyclingWeight of vehicles collected
Fig. IV-18 Flow of Recycling of End-of-Life Vehicles and the Current Recycling Rate (as of the end of March 2008)
Fig. IV-17 Number of Disused Vehicles and Used Vehicles Exported
Japan Automobile Manufacturers Associationhttp://www.jama.or.jp

81
Motorcycle manufacturers that are members of the Japan Automobile Manufacturers Association and participating motorcycle impor ters star ted operat ing a voluntary motorcycle recycling system in October 2004.
System of motorcycle recyclingThere are 190 (designated) collecting sites for disused
motorcycles in Japan. Businesses dealing with the disused motorcycles recycling system (15,000 shops) are clearly identified with a sticker so that users can readily recognize them.
For disposal/recycling of disused motorcycles, 14 facilities have been properly established nationwide. Proper treatment is provided for the motorcycles in consistency with the instruction manual developed by participating manufacturers and importers.
Since a recycling fee is paid at the time of purchase when buying a new motorcycle bearing a recycling label, motorcycle shops take the motorcycle without charging the user a fee when it is disused. For motorcycles without a recycling label, users pay the fee for recycling.
An electronic information system is introduced by the designated body to collect the motorcycle, disposal/recycling facilities and management company for more efficient management of recycling fees, information and distribution of motorcycles. A traditional manifest is replaced by the control voucher (recycling fee receipt integrated) to manage the distribution until it is taken for recycling.
Recycling dataRecycling labels are affixed to all motorcycles produced or
shipped for domestic sale by the 16 member manufacturers on or after October 1, 2005 (a total of 453 models).
The number of disused motorcycles taken back by the designated bodies was 2,898 and the recycling rate on a weight basis was 86.2% in FY2008. The recycling rate of scooters was 85.9%, whereas the rate of motorcycles was 86.9%. 14 disposal/recycling facilities
Recycling
Recycling
Recycling
Recycling
Recycling
Recycling
Treatment
Treatment
Treatment
Recycling
l
dd
ss
Rec
yclin
g ra
te 8
6.2%
Separation andrefinement of oil
Shredding,g
Dissolve and
e
Recycle non-iron
Melting, metal recovery, heatrecovery
Landfill
l
n Material
g
s
y Sorting
l disassembly)
Shreddingand sorting
metal and resin (Disassembled)
Fig. IV-20 Flow of Disposal/Recycling of Disused Motorcycles (by weight)
Fig. IV-19 Motorcycle Recycling System
Japan Automobile Manufacturers Associationhttp://www.jama.or.jp

82
9 Lead Batteries Used for Starting Engines of Automobiles (Lead Batteries for Automobiles)
Twenty-seven million vehicle batteries for new vehicles or maintenance are brought into the Japanese market annually. The lifespan of vehicle batteries is roughly three to five years depending on usage.
Due to the nature of vehicle batteries, they contain plastics such as polypropylene and large amounts of lead and sulfuric acid, making proper disposal vital.
The current recycling system of vehicle batteries is established. The members of the Battery Association of Japan that are battery manufacturers voluntarily purchase recycled lead batteries, taking them back and recycling them, and 20 million lead batteries are expected to be taken back annually.
Although this system has exerted some effectiveness and functionality, there were concerns that the collection of batteries became stagnant due to an increased amount of imported vehicle batteries of which recycling requirements were not necessarily met and the possibility that disused batteries would become chargeable if the market price of lead had significantly dropped. In view of these circumstances,
Cover(polypropylene)
Battery case(polypropylene)
Negative electrode(lead)
Separator(polypropylene)Positive electrode(lead)
Electrolytic solution(sulfuric acid)
Fig. IV-21 Structure of Vehicle Batteries
the reports are collected and sorted at the joint meeting of the Central Environment Council in order to assure the effectiveness of the collection and recycling of imported batteries and to establish a continuous and stable system that is less susceptible to the trend of the lead market.
Recent soaring copper price accelerates the export of used copper, causing a decrease in the smelted copper for recycling in Japan.
Flow of trade-in recycling system by lead battery manufacturers as dischargers
Collection route
Product
Entrustment
Product
Collection sitet Collection sitet Collection sitet
Source: Battery Association of Japan
Collection sitetProduct Product Product
Chargefree
Discharge
Deliver
Co
llect
ion
Rec
ycle
d le
ad
Trade in Trade in Trade in
Users
Disposalbusinesses
Collection anddelivering businesses
Retailers Wholesalers
Salesagency
Lead batterymanufacturers
Fig IV-22 Present Recycling System of Vehicle Batteries
Battery Association of Japanhttp://www.baj.or.jp

83
10 Compact Secondary Batteries (Rechargeable Batteries)
There are many types of batteries/cells, as shown in Fig. IV-23.
Among these types of bat ter ies/cells, the Law for Promotion of Effective Utilization of Resources stipulates that compact rechargeable batteries (nickel-cadmium batteries, nickel metal hydride batteries, lithium ion batteries, and compact sealed lead batteries) shall be collected and recycled by manufacturers of compact rechargeable batteries, and collected by manufacturers of equipment that uses such batteries (29 items; see page 18). Collection and recycling of compact rechargeable batteries is carried out by the Japan Portable Rechargeable Battery Recycling Center (JBRC), which consists of manufacturers of compact rechargeable batteries and manufacturers of equipment that uses such bat ter ies, and the Mobile Recycling Network, which consists of the Telecommunications Carriers Association and Communications and Information Network Association of Japan. Compact rechargeable batteries are collected from cooperative shops such as electric appliance home improvement retailers and bicycle shops, and registered businesses engaging in elect r ic works and building maintenance, municipalities, and schools, and mobile phone retailers, and then converted by recycling contractors into nickel, cadmium, cobalt, lead, and iron. The amount of compact rechargeable batteries collected has been increasing year by year, and in FY2008, 3,258 tons in total of such batteries were collected (see Table IV-2). The recycling rate differs among types of compact rechargeable batteries, ranging from 50% to 76% (FY2008).*JBRC collects nickel-cadmium batteries, nickel-metal
hydride batteries, lithium ion batteries, and compact sealed lead batteries for four home-use items (cordless phones, headphone stereo sets, video cameras and hand-held vacuum cleaners). Mobile Recycling Network collects lithium batteries for
cellular phones.
Fig. IV-23 Types of Batteries/Cells
Source: Japan Portable Rechargeable Battery Recycling Center
Fig. IV-24 Collection Box of Compact Rechargeable Batteries (JBRC)
Voluntary collection(t)
Disposed(t)
Recycled(t)
Recyclingrate(%)
Statutory target(%)
984(1,030)
Nickel-cadmiun batteries
886(927)
649(681)
73.3(73.5) 60
224(185)
Nickel metal hydride batteries
202(166)
154(127)
76.6(76.6) 55
320(302)
Lithium iron batteries
297(278)
188(178)
63.3(64.1) 30
1,729(2,224)
Compact sealed lead batteries
1,729(2,223)
865(1,112)
50.0(50.0) 50
3,258(3,741)Total 3,114
(3,595)1,857(2,099)
Notes: The upper figures are actual data from FY2008, while figures in parenthesis indicate a sum of FY2007 based on the data publicized by the JBRC, Battery Association of Japan, Telecommunications Carriers Association and Communications and Information Network Association of Japan (Mobile Recycling Network)
Table IV-2 Amount of Compact Secondary Batteries (Rechargeable Batteries) Collected
Japan Portable Rechargeable Battery Recycling Center http://www.jbrc.comTelecommunications Carriers Association http://www.tca.or.jpCommunications and Information network Association of Japan http://www.ciaj.or.jpBattery Association of Japan http://www.baj.or.jp
Please put used compact rechargeable batteries (domestic use only) into the recycling boxes located at shops that are members of the Rechargeable Battery Recycling Club. You can search for these collection spots on the JBRC Website (http://www.jbrc.com).

84
11 Cellular Phones and Personal Handy Systems (Cell Phones)
The number of cell-phone subscribers in Japan exceeded 100 million as of the end of March 2007, resulting in a 90% dissemination rate against population, and many cell phones are disposed of.
Cell phones use rare metals such as gold, silver and palladium as well as general metals (copper, aluminum or iron). In addition, some parts contain toxic material, e.g., GaAs, which requires extra-careful treatment since it will be environmental burden if disposed as non-burnable waste. The Law for Promotion of Effective Utilization of Resources obliges collection and recycling of batteries (compact secondary batteries).
The Mobile Recycling Network, which consists of cell-phone manufacturers and telecommunication carriers, promotes cell-phone recycling. The bodies of cell phones,
Fig IV-25 Cell Phone Collection Shop
9,440 sites (as of Mar. 2007)
Fig. IV-26 Flow of Recycling of Cell Phones
Before launch of Mobile Recycling Network
After launch of Mobile Recycling Network
FY2000 FY2001 FY2002 FY2003 FY2004 FY2005 FY2006 FY2007 FY2008
Cell-phone body
Amount collected (thousand units)
13,615 13,107 11,369 11,717 8,528 7,444 6,622 6,443 6,174
Weight collected (t) 819 799 746 821 677 622 558 544 533
Battery
Amount collected (thousand units)
11,847 11,788 9,727 10,247 7,312 6,575 6,133 7,198 8,388
Weight collected (t) 304 264 193 187 159 132 125 145 167
Recharger
Amount collected (thousand units)
3,128 4,231 3,355 4,387 3,181 3,587 3,475 3,706 4,776
Weight collected (t) 328 361 251 319 288 259 234 250 355
Table IV-3 Factual Data of Recycling of Cell Phones
Telecommunications Carriers Association http://www.tca.or.jpCommunications and Information network Association of Japan http://www.ciaj.or.jp
Notes: Collection rate is calculated at the time of new purchase and cancellation of the contract using the following formula.Amount recycled is calculated by the following formula.Amount recycled = recycling rate × weight collectedRecycling rate = Rate of metal content of the cell phone
rechargers and bat ter ies are voluntarily collected by distributors at no cost and they are recycled for metal materials. The “Environmental Impact Assessment for cellular phones and PHS” was established as a guideline for the manufacturers, and assessments were implemented.
The amount of collection in FY2008 was 6,170,000 units, but many users do not dispose of the old model after changing to a new one due to poor awareness about recycling cellular phones as well as high added values and the sophisticated design of the machine. For these reasons, the amount of collection tends to decrease.

85
12 Personal Computers
In accordance with the Law for Promotion of Effective Utilization of Resources enacted in April 2001, computer manufacturers have been required to design products that consider the 3Rs (reduce, reuse, and recycle), and are also obliged to collect and recycle disused computers for business use. Manufacturers have also been required to collect and recycle computers discharged from households. Accordingly, computers sold on or after October 1, 2003, and discharged from households are, in principle, to be collected at designated collection spots, free of charge, and recycled. Computers subject to collection are desktop PCs including body, CRT displays and LCD, and laptop PCs. Standard peripheral devices such as keyboards and mouse are collected if they are discharged with PCs.
Unlike large home electric appliances, disused PCs for home-use do not necessarily leave the end-user when a new PC is bought due to its distribution system feature, since it is common for purchasers to take the product home and transfer data from the old PC. A different system from large-sized home electric appliances is established for PCs.
At present , a col lect ion system is establ ished by cooperation between the Japan Portable Rechargeable Battery Recycling Center (JBRC) and Japan Post Holdings designating post offices as collection spots for disused PCs from households so that the PCs are collected through “Eco Yu Pack,” a parcel service for disused PC collection. The number of computers collected from households reached a total of 35,584 in FY2008.
Not required when discharging PCs bearing PC Recycle Label
It varies depending on manufacturers
information/fee
Frow of PC
Eco-You-PackJapan Post Holdings
About 20,000 post offices excluding some small local offices
⑤P
acka
ging
Use
rs
Rec
eptio
n w
indo
ws
of
man
ufac
ture
rs
Rec
yclin
g fa
cilit
ies
②Send the bill
③Paymentof the fee
④Invoice (Eco-You-Pack) arrives
⑥Collection at user’ s door
⑥Applicationfor collection
⑥is at user’ s choice whether PC is collected or user bring in.
①Application for collection
0
100000
200000
300000
400000
500000
600000
20082007200620052004200320022001
business-usehome-use
(units)
(FY)
For collecting and recycling personal computers for business use, business operators need to directly contact the manufacturers and request that the used personal computers in their offices be collected. The collection and recycling fee are paid by the business operators who dispose of the personal computers. The personal computers disposed of by businesses reached roughly 514,000 in FY2008.
Off
ice
PC
man
ufac
ture
r
Rec
yclin
g c
ente
r
Dis
trib
uti
on
co
mp
any
Contract
Delivery
Collection
Instruction of collection
EstimateInstruction of recycling
Inquiry and request for proposal
Corporation, leasing company,
government/public office,
municipality, school, hospital,
etc.
- Recycle- Reuse-Final disposalin compliance with the Law for Promotion of Effective Utilization of Resources and Waste Management and Public Cleansing Law.
Fig IV-29 Example of recycling business PC Fig. IV-28 Flow of Collection and Recycling of Unused Home-use Computers
Fig. IV-27 Number of Unused Computers Collected
PC3R Promotion Centerhttp://www.pc3r.jp

86
Others
“The month for promoting 3Rs” was originally “the month for promoting recycling” in the light 1R in the Law for the Promotion of
Utilization of Recycled Resources enacted in October 1991. Subsequently, a more comprehensive approach is demanded through 3Rs
(reduction of wastes, reuse and recycling), not only 1R, in order to overcome the constraint on the environment and materials and to
maintain sustainable development. The basic ideas of 3Rs is defined by the Basic Law for Establishing the Recycling-based Society,
and specific approaches to 3R are provided in the Law for Promotion of Effective Utilization of Resources, successor of the Law for the
Promotion of Utilization of Recycled Resources; extensive efforts have been made to disseminate 3Rs since 2004, when the month is
renamed to “The month for promoting 3Rs.”
This is the logo created in 2003 by the Reduce, Reuse, Recycle
Promotion Association to encourage active participation and
cooperation in 3R activities.
The Rs represent “reduce,” “reuse” and “recycle.”
The three figures are taking a step forward, evoking a sense of progress.
Orange represents people, green earth, and blue the sky.
Recycling Promotion Association, the predecessor of the Reduce, Reuse, Recycle Promotion Association, was
established in September 1991, aiming at developing a sound material-cycle society and carrying out extensive national
recycling activities through close cooperation among governments, consumers and industries.
The organization changed its name to the Reduce, Reuse, Recycle Promotion Association in June 2002 and carries out
extensive national activities especially in October, the month for promoting 3Rs.
Major activities
(1) Implement the month for promoting 3Rs in October
(2) Recognition of distinguished people in promoting 3Rs
Headquarters
Clean Japan Center
6th floor, No. 16 Kowa Building, 1-9-20 Akasaka, Minatoku, Tokyo 107-0052 Tel: 03 (6229) 1031
http://www.cjc.or.jp
Japan Environment Association
2nd floor, Prime Kanda Building, 1-11-9 Azabudai, Minatoku, Tokyo 106-0041 Tel: 03 (5114) 1251
http://www.jeas.or.jp

87
3R Awards Programs
* Awards for Resource-Recycling Technologies and SystemsThe Awards for Resource-Recycling Technologies and Systems are granted to businesses and other entities. Its aims are to
promote and expand excellent initiatives and create new businesses that suppress the generation of waste, reuse used products, and contribute to recycling resources. Candidates for the awards must, in principle, have a track record of at least three years in such projects and initiatives. This awards program started in 1975 as the Awards for Corporate Contributions to Resource Recycling, and has the longest history in Japan among awards programs associated with recycling.
Overview of FY2009Date and time of award ceremony: October 2, 2009, Fri., 13:15Location: Science Hall of Science and Technology Museum (Kitanomaru Park, Chiyoda Ward, Tokyo)Overview of the awards: Clean Japan Center (http://www.cjc.or.jp)
Name of awards and number of recipients
METI Minister Awards 1 recipient in 1 company
METI Industrial Technology Environmental Agency Director General’s Awards
4 recipients in 4 companies
Clean Japan Center Chairman’s Awards 11 recipients in 14 companies
Best Practice Awards 3 recipients in 4 companies
* Awards for Distinguished Contributors in Promotion of Reduce, Reuse and Recycle The Awards for Distinguished Contributors in Promotion of Reduce, Reuse and Recycle (Awards for Distinguished
Contributors in 3R Promotion) are granted to individuals, groups, businesses, and other entities who have made efforts toward promoting 3Rs and achieved excellent results through continuous activities. Its aims are to promote and raise awareness about 3Rs for establishing a sustainable society. The awarding ceremony is held in every October, which is the month for promoting 3Rs, by the Reduce, Reuse and Recycle Promotion Association (3R Promotion Association).
The awards were previously presented as the Awards for Distinguished Contributors in Promotion of Recycling from the time it was created in FY1992 until FY2001.
Overview of FY2009Date and time of award ceremony: October 23, 2009, Fri., 14:00Location: Alumni House of Tokai University (Kasumigaseki Bldg., Kasumigaseki, Chiyoda Ward, Tokyo) Overview of the awards: 3R Promotion Association (http://www.cjc.or.jp/3r-communication/)
Name of awards and number of recipients
Prime Minister Awards 1Minister Awards of Ministry of Agriculture, Forestry and Fisheries
2
Finance Minister Awards 1 METI Minister Awards 1
Awards of Minister of State for Special Missions in Cabinet Office
NoneMinister Awards of Ministry of Land, Infrastructure, Transport and Tourism
6
Minister Awards of Ministry of Education, Culture, Sports, Science and Technology
4 Environmental Minister Awards 1
Minister Awards of Ministry of Health, Labour and Welfare
13R Promotion Association Chairman’s Awards
75

88
1 Subsidy system
(1) Industrial Technology Research Grant Program (Grant for Young Researchers)From the viewpoint of enhancing industrial technology, subsidies are granted for research and development activities for
industrial applications conducted by young researchers (individuals or teams) working at universities or research institutes. The program aims to explore and foster seeds of new industrial technology that meet the needs of the industrial sector and society, and to develop human resources specialized in research on industrial technology. Research terms are either four years or two years, and the upper limit of direct costs covered is 50 million yen for 4-year research and 30 million yen for 2-year research.
(2) Interest Subsidies for Fund for Promoting Effective Use of ResourcesNecessary funds are provided for private financial institutions so as to help business operators pay interests on the cost of
establishing or renovating recycling facilities.
2 Financing systemLoans offered by the Japan Finance Corporation for Small Business and National Life Finance CorporationLoans with low interest are available at the introduction of new equipment for the benefit of 3Rs if such an activity satisfies a
certain degree of requirements.
3 Tax break systemTaxes including special initial depreciation of equipment, property tax and business office tax are diminished upon the
introduction of new equipment for the benefit of 3Rs if such an activity satisfies a certain degree of requirements.
Support system

89
Eco-town project schematic structure
Financial support for a pioneering recycling facility by the Ministry of Economy, Trade and Industry, and Ministry of the Environment (discontinued in FY2005)
Financial support for the enlightenment, dissemination and provision of information by the Ministry of Economy, Trade and Industry, and Ministry of the Environment (discontinued in FY2004)
National governmentMinistry of Economy,Trade and industry
Local businesses Citizens
Ministry of theEnvironment
Build advanced recycling facilitiesStrengthen R&D centers
Eco-town plan developed by municipalities
Jointapproval
Support bymunicipalities
Implementationby municipalities
Implementation and investment n
Sturctural business
Eco town project
4 Eco-town Project
Overview of the project:Objective:[1] Regional development through activation of environmental industries making up most of the regional industrial experiences[2] Establishing a sound material-cycle society through control of waste amount and promotion of recycling considering regional
uniqueness
More details with regard to 1 (1) and (2), contact engineering department of the local bureau of economy and industryMore details with regard to 2 and 3, call 03 (3501) 1511 (Recycling Promotion Dept. Industrial Science and Technology Policy and Environment Bureau, METI)More details with regard to 4 and 5, call 03 (3501) 1511 (Harmonized Industry Promotion Dept. Industrial Science and Technology Policy and Environment Bureau, METI)
Procedure:[1] Municipalities develop their own "Eco-town plan-city plan
harmonized with the environment" with their unique features integrated.
[2] METI and the Ministry of Environment jointly approved a plan that can serve as a model for other municipalities.
[3] Financial support is provided for local public organizations and private businesses with regard to the construction of a recycling facility beneficial for pioneering the formation of a sustainable society according to the approved plan (discontinued in FY2005).
Areas approved for Eco-town project (As of January 2008: 26 regions)

90
BrochuresThe brochures listed below are published by the Recycling Promotion Department of the Ministry of Economy, Trade and
Industry. Write to the following e-mail address to request these brochures : [email protected](Please note that your request for a brochure may not be fulfilled due to a lack of inventory.)
“Tips for Environmentally Friendly Containers and Packaging”
Published in April 2007
This contains various examples of efforts for rational use of containers and packaging. It also introduces lighter and thinner containers and packaging, and tips for environmentally friendly ways of wrapping.
297mm H x 210mm W, A4, 20 pages
“Benefits of Awareness and Knowledge of 3Rs”Published in March, 2007
This book is written mainly for elementary and junior high school students, and familiar topics relating to 3Rs are explained in an easy-to-understand manner using illustrations and tables. It aims to encourage readers to be concerned and think about 3Rs, and to deepen understanding about 3Rs.
297mm H x 210mm W, A4, 68 pages
“Measures for Promoting Emissions Suppression, Containers and Packaging Recycling Law- For Retailers”
Published in March 2007
The Measures for Promoting Emissions Suppression, enforced on April 1, 2007, is explained in detail including an overview of the system, obligations of businesses, methods of entering the regular report, and mandatory bookwork.
297mm H x 210mm W, A4, 15 pages

91
“Container and Packaging Recycling Law”Published in December 2006
The outline of the Containers and Packaging Recycling Law, and obligations of specified businesses are explained in detail with charts, tables and statistic data.
297mm H x 210mm W, A4, 24 pages
“Waste and Recycling Governance for Waste-Generating Businesses: Proper Waste Treatment and Promotion of Recycling”
Published in March 2005
“Guidelines to Waste-Generating Businesses for Waste and Recycling Governance” was provided in September 2004 to support the waste-generating businesses to perform proper waste treatment. These businesses are expected to implement and practice waste and recycling governance.
297mm H x 210mm W, A4, 6 pages
“Points of Implementing and Practicing Waste and Recycling Governance for Waste Generators”
Published in March 2005
This explains in plain words the “Guidelines to Waste-Generating Businesses for Waste and Recycling Governance” provided in September 2004 to support the waste-generating businesses to carry out proper waste treatment.
297mm H x 210mm W, A4, 60 pages

92
Local contact
METI Hokkaido Natural Resources, Energy and Environment DepartmentEnvironmental Protection Administration Division
2-1-1 Kitahachijo Nishi Kitaku, Sapporo City 060-0808Tel: 011-709-1754 (direct)http://www.hkd.meti.go.jp/information/recycle/index.htm
METI Tohoku Natural Resources, Energy and Environment DepartmentRecycling Industry Promotion Division
3-3-1 Honcho Aobaku, Sendai City 980-8403Tel: 022-263-1206 (direct)http://www.tohoku.meti.go.jp/s_kan_ri/index_kanri.html
METI Kanto Natural Resources, Energy and Environment DepartmentEnvironmental Protection and Recycling Division
1-1 Shintoshin Chuoku, Saitama City 330-9715Tel: 048-600-0292 (direct)http://www.kanko.meti.go.jp/seisaku/kankyo/recycle/index.html
METI Chubu Natural Resources, Energy and Environment DepartmentEnvironmental Protection and Recycling Division
2-5-2 Sannomaru Nakaku, Nagoya City 460-8510Tel: 052-951-2768 (direct)http://www.chubu.meti.go.jp/kankyo/index.htm
METI Kinki Natural Resources, Energy and Environment DepartmentEnvironmental Protection and Recycling Division
1-5-44 Otemae Chuoku, Osaka City 540-8535Tel: 06-6966-6018 (direct)http://www.kansai.meti.go.jp/kankyo.html
METI Chugoku Natural Resources, Energy and Environment DepartmentEnvironmental Protection and Recycling Division
6-30 Hacchobori Nakaku, Hiroshima City 730-8531Tel: 082-224-5676 (direct)http://www.chugoku.meti.go.jp/policy/energy.html
METI Shikoku Natural Resources, Energy and Environment DepartmentEnvironmental Protection and Recycling Division
3-33 Sun-port, Takamatsu City 760-8512Tel: 087-834-3954 (direct)http://www.shikoku.meti.go.jp/1_sesaku/index.html#kankyo
METI Kyushu Natural Resources, Energy and Environment DepartmentEnvironmental Protection and Recycling Division
2-11-1 Hakataeki higashi Hakataku, Fukuoka City 812-8546Tel: 092-482-5471 (direct)http://www.kyushu.meti.go.jp/seisaku/recycle/frame.htm
Okinawa General Bureau Department of Economy, Trade and IndustryEnvironmental Protection and Natural Resources Division
2-21-7 Maeshima, Naha City 900-8530Tel: 098-864-2065 (direct)http://www.ogb.go.jp/move/pickup/kankyo/01.htm
Ministry of Economy, Trade and IndustryIndustrial Science and Technology Policy and Environment Bureau Recycling Promotion Division
1-3-1 Kasumigaseki Chiyodaku, Tokyo 100-8901Tel: 03-3501-4978 (direct)http://www.meti.go.jp/policy/recycle/
Ministry of Economy, Trade and Industry
http://www.meti.go.jp/policy/recycle/
Visit the website to learn more about the “3R policy.”
Updates on activities, legal information, and
statistical information are available.


Towards a 3R-Oriented, Sustainable Society: Legislation and Trends 2010
■Recycling Promotion DivisionIndustrial Science and Technology Policy and Environment BureauMinistry of Economy, Trade and Industry1 -3-1 Kasumigaseki, Chiyoda-ku, Tokyo 1 00-8901 , JapanTel: 03-3501-1511● Paper used in this handbook is made from 100% recycled pulp with 70% whiteness.